Cyber security skills in the UK labour market 2025
Updated 2 February 2026

© Crown copyright 2026
This publication is licensed under the terms of the Open Government Licence v3.0 except where otherwise stated. To view this licence, visit nationalarchives.gov.uk/doc/open-government-licence/version/3 or write to the Information Policy Team, The National Archives, Kew, London TW9 4DU, or email: psi@nationalarchives.gov.uk.
Where we have identified any third party copyright information you will need to obtain permission from the copyright holders concerned.
This publication is available at https://www.gov.uk/government/publications/cyber-security-skills-in-the-uk-labour-market-2025/cyber-security-skills-in-the-uk-labour-market-2025
Ministerial foreword

Kanishka Narayan MP, Parliamentary Under Secretary of State
I am delighted to present the 2025 findings report on cyber security skills in the UK labour market. This report, conducted by Ipsos and Perspective Economics, provides a comprehensive analysis of the current state of our cyber security workforce and highlights both our achievements and the challenges we must address.
The UK cyber sector continues to be a beacon of strength and innovation, creating thousands of high-quality jobs and driving economic growth. The government’s new Industrial Strategy highlights cyber security as a strategically important sector which is crucial for economic stability and prosperity. Our cyber security professionals are at the forefront of protecting our digital infrastructure, ensuring the safety and security of businesses and individuals alike. The sector’s resilience and dynamism are truly commendable, and I am proud of the contributions made by our talented workforce.
I am particularly pleased with the strong feedback on the UK Cyber Security Council. Since its inception, the Council has played a pivotal role in shaping the future of our cyber security industry. The Cyber Career Framework and the professional standards introduced by the Council have been well-received, providing clear pathways for career progression and reassuring employers about the expertise of their candidates. This positive reception underscores the Council’s importance in fostering a skilled and competent workforce.
However, we must also confront the stark reality of our diversity data. Despite the efforts of previous governments, the cyber security sector remains significantly less diverse than the wider digital sectors and the UK workforce as a whole. Only 17% of the cyber security workforce is female, and the representation of ethnic minorities in senior roles is also disappointingly low. These figures are a sobering reminder that we have much work to do to create an inclusive and representative workforce which draws upon the widest range of talented people.
We also need to increase overall numbers in the sector to meet the high demand for skilled people. Organisations will be better protected and more able to grow when they have the people they need, which is why we need to attract more young people and adults into the sector.
To address these issues, we are launching the TechFirst skills programme, which will be a cornerstone of our strategy to improve diversity and numbers in the cyber security sector. By 2029, we aim to see a significant increase in the representation of women, ethnic minorities, and disabled individuals in cyber security roles. The TechFirst programme will focus on providing targeted support and opportunities for underrepresented groups, ensuring that everyone has the chance to thrive in this vital industry.
In conclusion, while we celebrate the successes of our cyber security sector, we must also commit to addressing its shortcomings. Together, we can build a bigger, more diverse, inclusive, and resilient workforce that reflects the rich diversity of our nation. I look forward to working with all stakeholders to achieve these ambitious goals.
Thank you.
Kanishka Narayan MP
Parliamentary Under Secretary of State
Department for Science, Innovation and Technology
Summary
This is a summary of research into the UK cyber security labour market, carried out by Ipsos and Perspective Economics on behalf of the Department for Science, Innovation and Technology (DSIT). The study involves:
-
Representative surveys of cyber security sector businesses and the wider population of UK organisations (businesses, charities and public sector organisations).
-
Qualitative research with cyber security businesses, medium/large private and public sector organisations, training providers and recruitment agents.
-
A secondary analysis of cyber security job postings on the Lightcast labour market database and reviewing the supply of cyber security talent through sources such as the Higher Education Statistics Authority (HESA) and Jisc.
This is the seventh iteration of the research, which has been carried out on an annual basis since 2018. This year we asked new questions on Artificial Intelligence (AI), outsourcing of cyber security services, awareness of the UK Cyber Security Council, and future recruitment activity levels.
Mapping the workforce and the workforce gap
We estimate there were approximately 143,000 individuals in the UK cyber security workforce, reflecting moderately accelerated growth driven by increasing graduate numbers.
The workforce gap has stabilised in this 2025 report (3,800 individuals) after falling sharply between the 2023 (11,100 individuals) and 2024 (3,500 individuals) reports. While the supply of skills is increasing, demand has continued to slow.
Supply of skills
On the supply side, there was approximately 20% growth in the number of cyber security graduates between the 2021/22 and 2022/23 academic years. We therefore estimate approximately 6,000 graduates are entering the cyber security labour market each year. The number of non-UK and non-EU cyber security postgraduate students continued to rise, accounting for 67% of all cyber security postgraduate students in 2022/23, the most recent available data.
In addition, we estimate approximately 2,500 additional individuals are entering the cyber recruitment pool through certification and private training providers and approximately 600 new apprenticeship starts flowing into the labour market.
Demand for skills
There was an average of 2,698 core cyber security job postings per month in 2024, with a median salary of £55,000. For the second year running, there was a decline in cyber security job postings, decreasing by 33% from 2023 for core cyber security roles (jobs where some aspect of cyber security is the main job function), and by 41% for all cyber security roles (roles that may not formally be labelled or commonly recognised as cyber security jobs, but still require cyber security skills).
A quarter (26%) of cyber security vacancies were advertised as remote/UK-wide last year, and the London salary premium has narrowed to £11,000 compared to the UK average (London £69,800 vs £58,800 across the regions).
Demand for entry-level candidates with less than one year of experience has fallen from 25% in 2022, to 22% in 2023, to 17% in 2024. Almost two-thirds of core cyber security job postings (63%) required mid-level experience (2-6 years). Within the cyber security sector, roughly half (52%) of all recruitment continued to be from the existing cyber security recruitment pool, rather than career starters (15%) or those converting from non-cyber roles (28%).
Diversity in cyber security
The cyber security sector workforce remained less diverse compared to the wider digital sectors and the UK workforce as a whole. Only 17% of the cyber security workforce was female compared to 30% of the digital workforce and 48% of the UK workforce. Less than 1 in 10 (8%) were disabled compared to 17% of the UK workforce. This issue is more prevalent in the senior cyber security workforce (6 or more years of experience), being less diverse in terms of gender, disability and ethnicity than the wider cyber security workforce. While 19% of the cyber security workforce are from ethnic minorities, higher than the UK workforce average of 15%, only 8% are in senior roles.
Since the 2020 report there has been an increase in the proportion of neurodivergent staff reported by employers, from 9% in 2020 to 16% in the 2025 report, though this may also be attributed to improvements in the identification and reporting of neurodiverse conditions. The gender gap for postgraduate cyber courses also continues to improve year-on-year, with the proportion of female students rising from 21% in academic year 2020/21 to 24% in 2021/22 and 27% in 2022/23, the most recent available data.
Skills gaps and shortages
Skill gaps[footnote 1] in basic cyber security and incident response have persisted:
-
Nearly half (49%) of businesses had a basic skills gap, struggling with essential tasks including setting up firewalls, managing personal data securely and detecting malware. Charities were more likely to have a basic skills gap (59%), while public sector organisations were much less likely (14%).
-
Around 3 in 10 businesses (30%) and charities (29%) had gaps in advanced skills including forensic analysis, interpreting malicious code, and penetration testing. As with basic skills, the gap was lower among public sector organisations (21%).
A significant proportion of public sector organisations (58%), businesses (31%), and charities (24%) outsourced some elements of their cyber security. In a new question asked this year to those who outsourced services, 40% of charities, 23% of businesses and 13% of public sector organisations lacked confidence in assessing whether external providers were offering value for money. In the qualitative research, we heard that the outsourcing marketplace was confusing and fragmented, with some organisations seeking guidance on best practices for selecting providers.
In the cyber security sector, technical skills gaps among employees have increased year-on-year, with 28% of cyber security businesses reporting a gap compared to 18% in the 2021 report. The most commonly reported skills gaps were in areas like audit and assurance, digital forensics, and cryptography
New for this year, we explored AI in cyber security (see also Chapter 7 in the Cyber Security Sectoral Analysis 2025). Just over half (53%) of cyber security businesses said staff were using AI in their day-to-day work and around two-thirds (65%) expected their need for AI skills among employees to increase over the next 12 months. In the qualitative research, employers expressed concern about current and future shortages of AI-related skills in cyber security.
1. Introduction
1.1 About this research
The Department for Science, Innovation and Technology (DSIT) commissioned Ipsos and Perspective Economics to conduct the latest in an annual series of studies (since 2018) to improve its understanding of the UK cyber security labour market and skills needs. The research covers UK private sector businesses – both those that form the UK’s cyber sector, providing cyber security products and services, as well as wider private sector businesses (with 1 or more employees) managing their own cyber security – as well as charities and public sector organisations. It also collected data from cyber security training providers and recruitment agents.
This 2025 report, in line with previous years, covers the data on:
-
the size and composition of the cyber security workforce
-
staff turnover (within the cyber sector)
-
awareness and perceptions of the work of the UK Cyber Security Council – including the Cyber Career Framework and the Standard for Professional Competence & Commitment
-
diversity within cyber security, with quantitative data specifically for the cyber sector
-
demand for cyber security skills, based on an analysis of online cyber security job vacancies
-
the supply of cyber security skills, based on secondary data covering Higher Education pathways, apprenticeship programmes, and professional retraining and upskilling initiatives
-
cyber security skills gaps and skills shortages within and outside the cyber sector
-
the use of outsourcing to fill cyber security skills gaps
-
the cyber security workforce gap, i.e., the net annual shortfall in the number of cyber security professionals entering the labour market
This research was conducted alongside a sister study, also for DSIT, which focused specifically on the UK’s cyber security sector, covering sector growth and investment – the Cyber Security Sectoral Analysis 2025.
1.2 Summary of the methodology
This section contains a brief outline of the research methodology. Further methodological detail can be found in the accompanying technical report.
The methodology consisted of 4 strands:
-
Quantitative surveys – Ipsos conducted representative telephone surveys with 4 audiences: UK private sector businesses (outside the cyber sector), public sector organisations, registered charities, and cyber sector businesses (i.e., those providing cyber security products or services). Fieldwork was conducted between 31 July and 18 October 2024. There was also a short recall survey, which took place between 18 and 29 November 2024, to fill in gaps in the information collected in the main fieldwork. The data for the private sector, public sector and charities has been weighted to be representative of these populations, while the data for the cyber sector is considered representative of that sector, since the entire sector was sampled.
-
Qualitative interviews – Ipsos conducted 45 in-depth interviews relevant to this labour market research, including 24 with cyber sector businesses (other than training providers), 11 with cyber leads in medium and large businesses private sector businesses and public sector organisations, 4 with recruitment agents and 6 with cyber security training providers. The interviews explored the challenges organisations faced in addressing skills gaps and shortages, approaches to recruitment, workplace diversity, and factors impacting the development of skills in the cyber security workforce. This fieldwork took place between 16 September and 26 November 2024.
-
Job vacancies analysis – Perspective Economics analysed cyber security job postings on the Lightcast labour market database, providing details on the number, type and location of job vacancies across the UK. This analysis also covered remuneration, descriptions of job roles and the skills, qualifications and experience being sought by employers. We primarily focused on vacancies across the 2024 calendar year (i.e., January to December 2024).
-
Supply side analysis – Perspective Economics replicated the methodology used in the previous report to estimate the size of the cyber security recruitment pool. This used the latest published data on graduate enrolments from the Higher Education Statistics Authority (HESA) and Jisc, the HESA Graduate Outcomes survey 2022/23, the latest Department for Education apprenticeship data for England, and wider data on professional retraining and upskilling initiatives. This strand also produced further statistics on the demographic characteristics, educational and occupational backgrounds, and salaries of this pool of labour, as well as outflows from the pool.
1.3 Interpretation of the data
Years of data covered
Throughout this report, when referring to changes over time, we typically reference the publication year (i.e., 2025 for this latest report). However, it is important to note that the primary quantitative and qualitative data was collected in the previous calendar year (i.e., 2024). This is explicitly mentioned in each figure and chart title. To be consistent with previous reports, line charts based on survey data use the report publication year in the x axis, rather than the fieldwork year.
Furthermore, due to the use of multiple methodologies, the report references data from various time periods, summarised below:
-
quantitative survey data collected between July and November 2024
-
qualitative data collected between September and November 2024
-
job vacancies data from January to December 2024
-
2022/23 data on graduate enrolments from HESA and Jisc
-
the HESA Graduate Outcomes survey 2022/23 (covering graduates from the 2021/22 academic year, approximately 18 months after their graduation)
-
Department for Education apprenticeship data for England (covering the 2023/24 academic year).
Charting of survey results
Where figures in charts do not add to 100%, this is typically due to rounding of percentages that come from weighted data, because the questions allowed more than one response, or because not all responses have been charted for the sake of visual clarity.
Subgroup analysis for businesses
We have undertaken subgroup analysis on the quantitative survey data for businesses, to show how findings differ by business size and sector. There were too few public sector organisations and charities sampled to split out results for these organisations by subgroup.
For businesses, the analysis by size split the population into micro businesses (1 to 9 employees), small businesses (10 to 49 employees), medium businesses (50 to 249 employees) and large businesses (250 employees or more).
In our sector subgroup analysis, we grouped similar sectors together by SIC 2007 code for higher sample sizes. The groupings are the same ones used in DSIT’s Cyber Security Breaches Survey series. Ultimately, there were relatively few major sector differences to report on, but this is the full list of sector groupings that we looked at in the subgroup analysis:
-
administration and real estate (SIC L and N)
-
construction (SIC F)
-
education (including academies) (SIC P)
-
entertainment, service or membership organisations (SIC R and S)
-
finance and insurance (SIC K)
-
food and hospitality (SIC I)
-
health, social care and social work (including NHS organisations) (SIC Q)
-
information and communication (SIC J)
-
professional, scientific or technical (SIC M)
-
retail and wholesale (including vehicle sales and repairs) (SIC G)
-
transport and storage (SIC H)
-
utilities and production (including manufacturing) (SIC B, C, D and E)
Typically, we compared each sector to the average private sector business. The education sector and health, social care and social work sector include a large mix of private and public sector organisations. We therefore analysed these sectors using a merged sample of private and public sector organisations, specially weighted to represent a merged population profile.
The quantitative survey found few noteworthy or consistent regional subgroup differences. Therefore, we have typically not commented on these across the report. We do, however, have a far more substantial geographic analysis as part of strand 3, the secondary analysis of job vacancies (covered in Chapter 4).
Statistical significance testing (for subgroups and changes over time)
The survey results are subject to margins of error, which vary with the size of the sample and the percentage figure concerned. We carry out statistical significance tests, which signify whether differences across the results are likely to be real differences in the population, or likely to have occurred by chance.
In this report, where we highlight any subgroup differences by business size or sector, or any other variable, these are statistically significant differences (at the 95% level of confidence) – unless the commentary states otherwise. Similarly, where we indicate that findings have changed since the previous studies, this is indicating a statistically significant change over time unless otherwise stated.
Specifically, this report contains several workforce-level estimates compiled from cyber sector survey data. They estimate the percentage of the cyber sector workforce with certain traits (e.g., the proportion of the cyber sector workforce that is female), unlike most of the reported data for the cyber sector, which represents the percentage of cyber sector businesses. We do not expect to find statistically significant differences over time in these estimates given sample size limitations. Instead we focus on broad trends and patterns in the data when analysing workforce-level estimates.
Interpretation of the qualitative data
The qualitative findings offer more nuanced insights and case studies into how organisations address their cyber security skills needs, and why they take certain approaches. The findings reported here represent common themes emerging across multiple interviews.
Where we pull out an example, insight or quote from one organisation, this is typically to illustrate findings that emerged more broadly across multiple interviews. As with any qualitative findings, these examples are not intended to be statistically representative of the wider population of UK organisations.
1.4 Acknowledgements
Ipsos and Perspective Economics would like to thank colleagues at DSIT for their project management, support and guidance throughout the study, as well as Professor Steven Furnell for his contributions to the research design. This research was also endorsed by the National Cyber Security Centre (NCSC), the UK Cyber Security Council (UKCSC), the UK Cyber Cluster Collaboration (UKC3), techUK, teiss and the Security Awareness Special Interest Group (SASIG).
2. Mapping the workforce
This chapter estimates the size of the UK cyber security workforce across the whole economy (accounting for inflows and outflows since the previous year), findings that were previously featured in Chapters 2, 8 and 9 of the reports from earlier waves. Within the cyber sector specifically, we include survey data on the typical size of cyber teams, staff turnover, and cyber teams coverage of the specialisms outlined in the UK Cyber Security Council’s Cyber Career Framework.
Both the Council’s Cyber Career Framework and their Standard for Professional Competence & Commitment (UK CSC SPCC) were also topics for discussion in these qualitative interviews. Businesses, cyber leads and training providers provided broad feedback on the utility of these initiatives, which built on last year’s discussion of the Cyber Career Framework.
The current picture
There are approximately 143,000 individuals in the cyber security workforce. The longer-term trend suggests that the growth of the cyber workforce has moderately accelerated in recent years (from 2% growth in 2022 to 5% growth in 2024). This has been driven by increasing numbers of graduates entering the recruitment pool.
Within the cyber sector specifically, the dominance of small cyber teams prevailed, with the typical (median) cyber business having 3 to 4 employees working in cyber roles. Staff turnover remained similar to previous years, with 12% of sector employees leaving their roles.
What’s new since the 2024 report?
Both the Cyber Career Framework and associated professional standards were explored last year, although this year’s study generated new insights on each initiative. Participants welcomed the Career Framework’s potential to contribute to a shared understanding of cyber roles. However, they highlighted that understanding would always be challenging to achieve in a landscape of inconsistent and evolving terminology. Participants felt the professional standards provided clear progression pathways and reassurance for employers, but might inadvertently limit flexibility in careers, by emphasising specialisation early on. There were also uncertainties around duplication of existing qualifications, and how the standards would be implemented in practice.
2.1 Size of the cyber security workforce
The cyber security workforce estimate takes into account the number of individuals working in a cyber security related role in both the cyber security sector[footnote 2] and the wider labour market. It is calculated from several constituent parts, which include:
-
The previous year’s workforce estimate (at approximately 136,800 individuals).
-
An estimate of inflows, compiled from the Higher Education Statistics Authority (HESA) Graduate Outcomes survey, Department for Education data on apprenticeships, and wider data on retraining and upskilling pathways (from multiple sources) – these 3 aspects are covered in detail in Chapter 5. This year, the estimate has been supplemented with additional information from the Office for National Statistics (ONS) Annual Population Survey.
-
An outflows estimate, informed by the annual survey estimates of staff turnover in the cyber sector.
Each year’s workforce estimate has a lag relative to the year this report is published. Therefore, this year’s estimate covers the cyber security workforce at the end of 2024, while the last report covers figures for 2023. At the end of 2023 we estimated that there were approximately 136,800 individuals in the cyber security workforce.
-
We assume an inflow figure (new people to the industry) of approximately 11,700 individuals. This includes 9,100 new entrants – 6,000 new graduates, 600 new apprentices, and 2,500 individuals coming through retraining or upskilling pathways (each covered in Chapter 5) – and a further 2,600 moving into cyber security roles from aligned professions (see the next subsection).
-
We assume an outflow figure of approximately 5,500, based on up to 4% of cyber security employees leaving the sector in a given year due to retirement or exit. In the previous report, we estimated an outflow rate of 3.5%. The updated figure reflects a small increase this year in the survey data for the proportion of staff being dismissed, made redundant or retiring (see the end of Section 2.2).
-
This suggests an estimated cyber security workforce of 143,000 individuals as of end of 2024 (+5% from last year’s estimate). This represents a moderate acceleration in the growth of the workforce (having grown by 3% from 2022 to 2023, and 2% from 2021 to 2022). However, this comes alongside a tightening of the labour market, with advertised demand for cyber roles having fallen from 2022 to 2024 (covered further in Chapter 4).
Comparison to Standard Occupational Code (SOC) data
Both the HESA Graduate Outcomes survey and the ONS Annual Population Survey provide data on the number of people in IT-related or cyber security roles, which we use to inform our workforce estimate.
The latest Graduate Outcomes survey (covering graduates from the 2021/22 academic year, approximately 15 months after graduation) shows that the volume of graduates moving into IT roles has increased from 30,800 to 34,630 (+12%) since last year’s report. In addition, the volume of graduates moving specifically into cyber security professional roles (mapped to SOC 2135) has increased from 1,470 to 1,780 (+21%) over the same period. The full tabulated data for these figures is provided in Annex A.
The Annual Population Survey[footnote 3] provides its own estimate of the number of people working in cyber security professional roles (again mapped to SOC 2135). The most recent estimate covers the period of October 2023 to September 2024, and records that 69,900 individuals were working in these roles.
On its own, this Annual Population Survey figure is likely to significantly underestimate the size of the cyber security workforce. Individuals working in cyber security-related roles may be coded into another area, such as programming or consultancy, even if their role mainly encompasses cyber security. This helps to explain the disparity between our overall estimate of 143,000 in the cyber security workforce, and the 69,900 individuals identifying as cyber security professionals.
However, the trend data for this figure can be used to refine our annual inflows estimate for the cyber security workforce.[footnote 4] The figure for October 2022 to September 2023 was 58,200. This suggests an increase of 11,700 cyber security professionals from the October 2022-September 2023 period to the October 2023-September 2024 period. We have therefore adjusted our own conservative estimate of 9,100 new entrants from Higher Education, apprenticeships, and retraining or upskilling pathways (covered in Chapter 5). It is feasible that a further 2,600 people moved into cyber security roles from aligned professions (since the combined total of 9,100 and 2,600 is 11,700, matching the increase in cyber security professionals over the last 12 months as set out in the Annual Population Survey).
2.2 Composition of cyber teams within the cyber sector
This section specifically focuses on survey data for the cyber sector. In previous years, we also surveyed the wider business population, as well as charities and public sector organisations on the size of their cyber teams. This question was not asked this year to reduce the survey length and burden on respondents, and due to these statistics suggesting limited change across waves. However, it may be included again in future years.
Size of cyber teams within the cyber sector
The latest Cyber Security Sectoral Analysis highlights that 56% of cyber businesses were micro in size, employing less than 10 people. As such, it is expected that most cyber team sizes across the sector will be at the smaller end. This year, around a quarter (23%) had 1 employee in the cyber role. The typical (median) cyber business had 3 to 4 employees in these roles. The mean was 7 employees.
The overall composition, shown in Figure 2.1, was similar to last year. The typical size of cyber teams has become leaner when reflecting over a longer period. The median was 3 to 4 employees in the last 2 waves, compared to 5 to 9 in the 2023 and 2022 studies. This aligns with the wider data in this study showing a tightening of the cyber security jobs market over successive waves (see Section 4.1).
Figure 2.1: Percentage of UK cyber sector businesses by the number of people working in cyber roles (fieldwork year 2024)
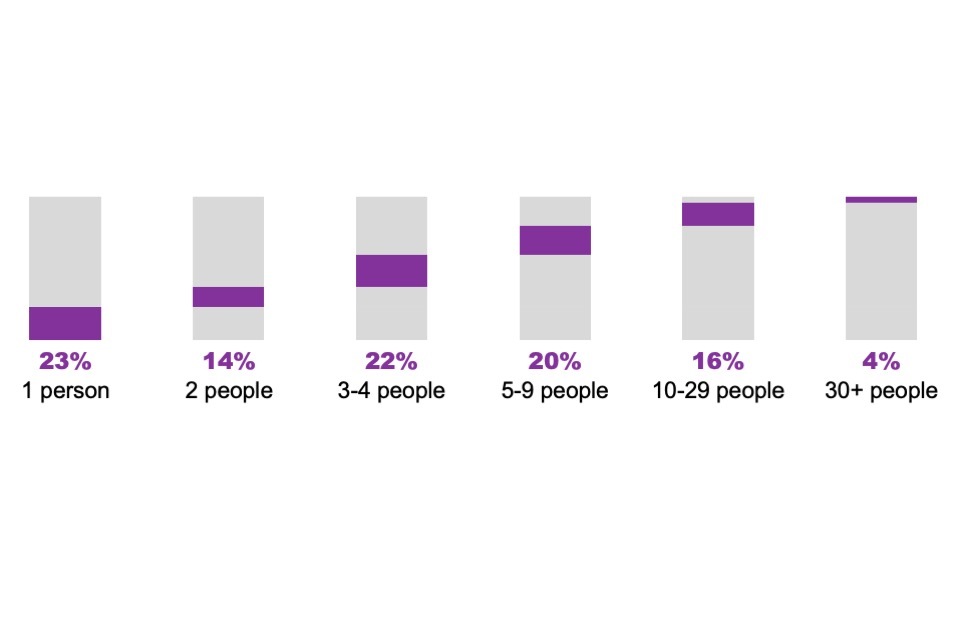
Base: 204 cyber sector businesses (i.e., excluding 5 from the full sample that did not provide this information)
Supplementary data on cyber sector recruitment expectations
In this year’s quantitative survey, there was a new question asking if cyber sector employers expected the number of people they had working in cyber security roles to change over the next 12 months. Two-thirds (67%) expected to grow their workforce, while just under a third (30%) expected no change. Very few (3%) had intentions to downsize their workforce.
Specialisms of cyber teams within the cyber sector
We asked cyber businesses whether they had staff working in any of the 15 specialisms outlined in the Cyber Career Framework.
The top two specialisms were cyber security governance and risk management (42%) and cyber security management (37%). At the other end, digital forensics (8%) and cryptography and communications security (9%) were the least mentioned.
Figure 2.2: Percentage of UK cyber sector businesses that employ people in cyber roles covering each of the following Cyber Career Framework specialisms (fieldwork year 2024)
| Cyber security governance and risk management | 42% |
| Cyber security management | 37% |
| Cyber security audit and assurance | 32% |
| Security testing | 32% |
| Vulnerability management | 29% |
| Secure system architecture and design | 25% |
| Data protection and privacy | 22% |
| Secure system development | 21% |
| Cyber threat intelligence | 20% |
| Incident response | 20% |
| Identity and access management | 19% |
| Secure operations | 16% |
| Network monitoring and intrusion detection | 15% |
| Cryptography and communications security | 9% |
| Digital forensics | 8% |
| Another area | 16% |
| Don’t know | 3% |
Base: 209 cyber sector businesses
The survey was amended this year to exclude the “cyber security generalist” response (in line with changes to the Cyber Career Framework). Instead, cyber businesses were asked to assign their employees based on the cyber activities they spend most time on. This means the findings are not directly comparable to previous years. It may also explain the relatively high proportion answering with “another role” – this may represent staff considered to be generalists.
Although direct comparisons are not possible, the pattern of responses across the specialisms can be compared. The top 3 specialisms match last year’s survey, as do the bottom 2. By contrast, network monitoring and intrusion detection was ranked lower than in the previous 2 waves, when it ranked in the middle of the list (ranked 7 out of 15 in 2023, and 8 out of 15 in 2024, compared to 12 out of 15 this year – when excluding the previous cyber security generalist category).
Staff turnover across the cyber sector
We estimate that 12% of cyber sector employees left their posts in the 18 months prior to the survey (i.e., since around January 2023). This includes 7% who left of their own volition, with 2% being dismissed, and 1% each leaving for retirement and redundancy. This pattern is similar to last year.
These are bare minimum estimates. The size of the total workforce in our calculations assumes, for simplicity, that all these staff were in post 18 months ago (i.e., they did not join and leave within the last 18 months, which is possible). The turnover rate has been similar across the last 3 waves (11% in each case).
In the qualitative research, we found that salary remained a crucial factor influencing staff turnover. Some participants noted that sales staff and junior staff were particularly likely to be attracted by higher pay and better career progression opportunities. Employees with specialist technical skills, such as penetration testing, were regarded as harder to retain because of high market demand for their skills.
On the other hand, the more recent slowdown in demand for cyber security professionals was felt to have been a stabilising factor for retention.
“We’ve got a fairly stable team. I think that is to do with the market, because the market slowed down quite a lot in the last year. A lot of the big tech companies have been reducing headcount in cyber, as well as normal technology functions. There’s not a huge amount of attrition. It comes in cycles, so I’d expect it to change again at some point.” Large non-cyber (private sector) business
Retention strategies continued to focus on training and career progression opportunities. Some cyber security businesses also saw flexible working conditions and remote working options as a way to retain staff.
2.3 The Cyber Career Framework
As noted in the chapter introduction, the qualitative interviews explored perceptions of the UK Cyber Security Council’s Cyber Career Framework (covered here) and their SPCC (covered in Section 2.4). As added context for these findings, and new for this year, we also covered awareness of the Council in the cyber sector survey. This showed a high level of awareness that has built up since the Council was created in 2021, with 69% of cyber sector businesses having heard of it.
Similar to previous years, we found a mixed awareness of the Council’s Cyber Career Framework in qualitative interviews. Nevertheless, feedback on the framework (which we showed to participants during the interview) was generally positive.
Consistent with previous years, employers, training providers and recruiters viewed the framework as a helpful introduction to the cyber security industry, particularly for entry-level roles and individuals reskilling in cyber security. Participants highlighted the framework’s value in informing career choices and guiding employers in professional development pathways.
“If you’re getting into the area or exploring getting into the area, I think it’s incredibly useful. It’s a great starting point.” Large business outside the cyber sector
However, some participants felt the framework was less relevant for more experienced professionals, whose experience might span across multiple specialisms.
This year, we also asked participants what impact the framework could have on developing a shared understanding of cyber security roles, for example by standardising job titles. This was welcomed in principle, and some participants praised the framework for clearly explaining different roles. However, some highlighted how challenging it would be to achieve this shared understanding, given that the terminology used in cyber security was already inconsistent, overlapping and evolving.
“Cyber is terrible for acronyms and terminology, and ‘let’s give that a new name’. It’s the same thing, but let’s give it a new name. There might be 10 people doing the same job and they’ve all got a different title.” Training provider
Participants emphasised the need for the framework to therefore incorporate evolving roles, as well as rapidly developing technologies such as artificial intelligence (AI), to ensure its continued relevance.
“I imagine in the future we’ll have more people [in cyber security] who work specifically within AI. And perhaps right now we just call them all data scientists and hope for the best. Developing the framework might just be expanding into those areas and having additional titles for those roles, but I couldn’t guess how that might develop.” Micro cyber sector business
2.4 Professional Standards
The UK Cyber Security Council’s introduction of a professional standard within its cyber specialisms generated mixed views across the qualitative interviews, largely echoing last year’s response.
Positive feedback centred on the potential for professional standards to reassure employers about candidate experience, particularly for more junior applicants.
“I think any chartership is good, because it provides a standard there that, if you know someone is qualified or chartered to that level, you know that they should have that level of expertise.” Recruitment agent
The tiered structure of the professional standards was appreciated for providing clear progression pathways (there are Chartered, Principal, Practitioner and Associate levels). However, participants had concerns about potential barriers for entry-level applicants if standards were to become mandatory, suggesting that this may inadvertently limit career flexibility by requiring early specialisation.
Mirroring last year’s findings, participants raised concerns about potential duplication with existing qualifications, such as CREST and other vendor certifications, as well as how the standards would be kept up to date. Some said they wanted to see how the standards are implemented in practice. They wanted to know about the assessment criteria, how much they would cost, how they related to existing certifications and whether they would be mandated in any way.
“This is something the industry doesn’t necessarily need, and the concern is that it’s going to impose a regime of keeping the thing up to date and therefore generate an industry of providers. I cannot imagine it’s going to roll out without cost, which is just another thing you have to sign up to do, in addition to CREST and all the rest of it.” Large cyber sector business
Finally, participants noted that the value of the professional standards would depend upon how widely they were adopted and how much customer demand there was for them. This would determine how willing employers would be to invest in them for their employees.
3. Diversity in cyber security
This chapter explores diversity within the cyber security workforce, covering gender, age, state school backgrounds, ethnicity, disability, and neurodiversity.[footnote 5] It includes workforce diversity estimates from the quantitative survey, secondary data covering diversity in the Higher Education recruitment pool, and qualitative findings. The secondary data was previously covered in Chapter 9 in the reports from earlier waves.
As in previous years, survey questions on diversity were only asked of cyber sector businesses and not the wider business population. This is because cyber sector businesses are the primary recruiters and employers of cyber-related positions – Chapter 2 highlights how the UK cyber sector workforce (67,299 employees) makes up the largest proportion of the overall cyber security workforce (approximately 143,000 individuals already in cyber roles, and in the wider recruitment pool). Moreover, most private sector businesses have employees undertaking cyber roles informally. Therefore, including these businesses would give an inaccurate view of diversity in the cyber professional workforce. The qualitative findings do nevertheless include the perspectives of non-cyber businesses, recruitment agents and training providers.
Future waves of this study will aim to expand our understanding of diversity trends by reviewing Annual Population Survey data for SOC 2135 (the code for cyber security professionals), which may be broken down by demographic variables such as gender.
The current picture
In terms of gender and disability, the UK cyber sector workforce continued to be less diverse than the wider digital sectors, and the UK workforce as a whole. The senior workforce in the cyber sector, with 6 or more years of experience, also continued to be less diverse than the overall cyber sector workforce.
The qualitative interviews suggest that many of the same barriers that hindered diversity remained in place. This included a perceived non-diverse talent pool at the entry level, the cost of degrees and other technical qualifications putting off new entrants. There was also an ongoing perception of the types of people working in cyber security roles being predominantly white men. As in previous years, recruitment agents often played an important role in educating employers on how to achieve diversity when hiring.
What’s new since the 2024 report?
This year’s results do suggest some positive trends. The proportion of neurodivergent staff reported by employers has risen almost every year since the 2020 report – although this may reflect greater awareness and identification of neurodiversity, rather than an increase in hiring of neurodivergent individuals. In addition, the gender gap in postgraduate cyber security courses has shown continuous, incremental improvement. In the 2020/21 academic year, 21% of cyber security postgraduates were female, rising to 24% in 2021/22, in 27% in 2022/23 (HESA, see Chapter 5).
New survey data for this year suggests that the most common actions cyber sector employers took to improve diversity in their recruitment were hiring through non-degree routes (63%), and running events in schools or colleges (41%). It was relatively rare for hiring cyber sector businesses to have set diversity quotas (8%) or hired through government-backed diversity schemes (7%).
3.1 Estimates of diversity in the cyber sector
As can be seen from Figure 3.1, when it came to gender and disability, the UK cyber sector workforce continued to be less diverse than the wider digital sectors, and the UK workforce as a whole. The statistics for the cyber sector workforce were more in line with wider digital sectors for ethnicity, and in this area the cyber sector once again outperformed the whole UK workforce. The senior workforce – defined as those who have 6 or more years of experience – was slightly less diverse across all groupings. These patterns all match those seen in previous years.[footnote 6]
Figure 3.1: Percentage of the UK cyber sector workforce estimated to belong to each of the following diversity groups (fieldwork year 2024)
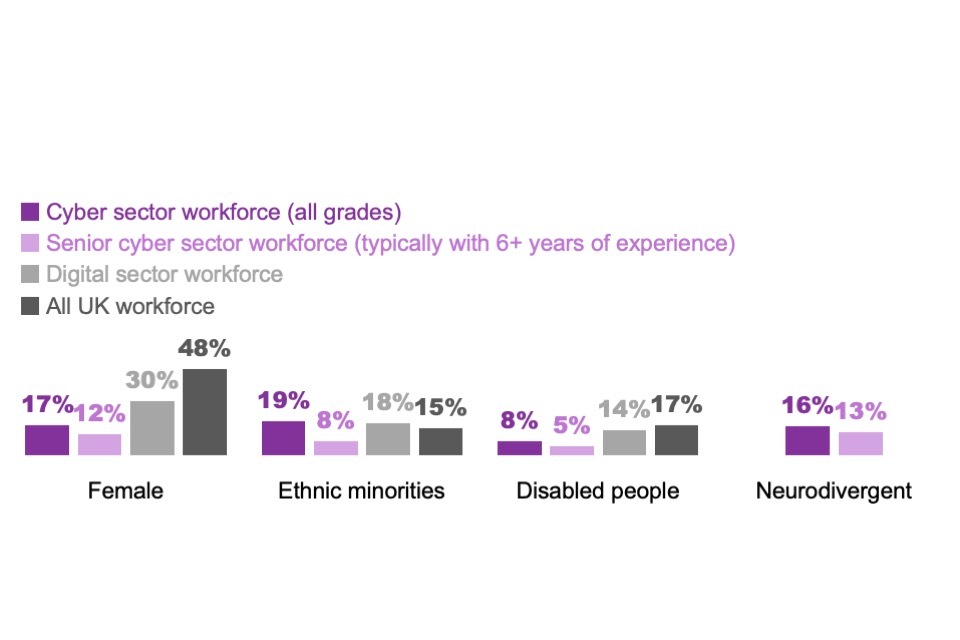
Bases: 192 cyber sector businesses for whole cyber sector workforce estimates, 187 for senior workforce estimates (in each case excluding those that were not able to answer or refused these questions.)
</sub>N.B. gender, ethnicity and disability comparison data for the whole UK workforce and digital sectors comes from DSIT Economic Estimates. We use the April 2023 to March 2024 data.</sub>
Figure 3.2 shows how the data for the whole cyber sector workforce has changed over time. It suggests a rise in the neurodivergent proportion of the workforce in the 6 years since this statistic was first measured (from 9% in the 2020 study, to 16% in this latest study). However, it is important to note that this could simply reflect an increasing awareness of neurodiversity across employers, leading to greater identification, rather than a genuine increase in the number of neurodivergent employees. In the qualitative research, some participants felt there was now a greater awareness of neurodiversity, with some employers reporting that they had specifically taken steps to accommodate the needs of neurodivergent people in the workplace.
Figure 3.2: Percentage of the whole UK cyber sector workforce estimated to be neurodivergent (fieldwork years 2019 to 2024, equivalent to report publication years 2020 to 2025)
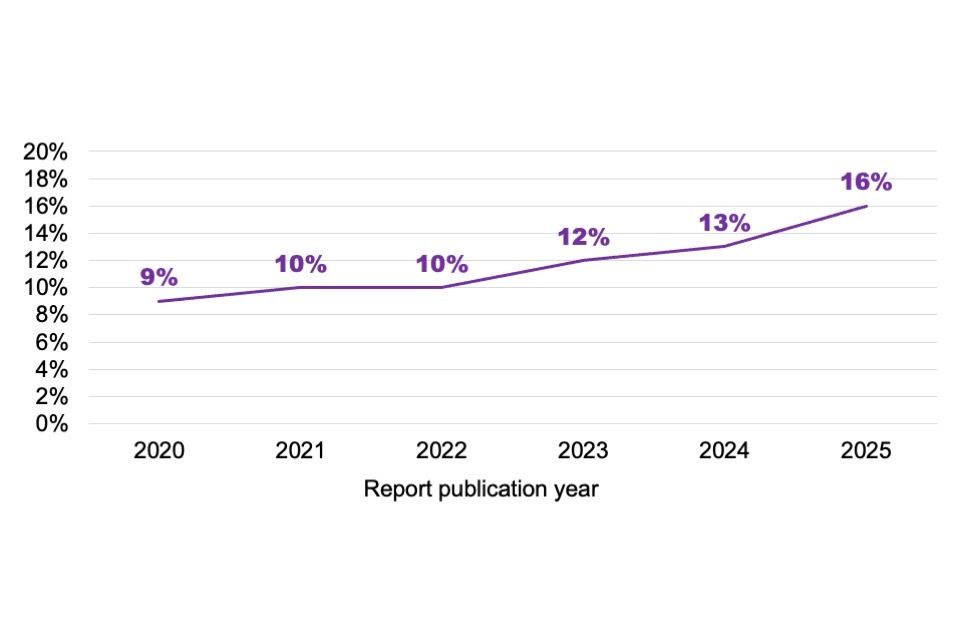
Bases:c.200 cyber sector businesses each year. For consistency with previous reports, the x axis refers to the report publication year, which is one year on from the fieldwork year.
Within the senior workforce, the proportion from ethnic minorities has slightly fallen over a 5-year period (the senior workforce statistics were first measured in the 2021 study), as Figure 3.3 highlights.
Figure 3.3: Percentage of the senior UK cyber sector workforce estimated to be from ethnic minorities (fieldwork year 2019 to 2024, equivalent to report publication years 2020 to 2025)
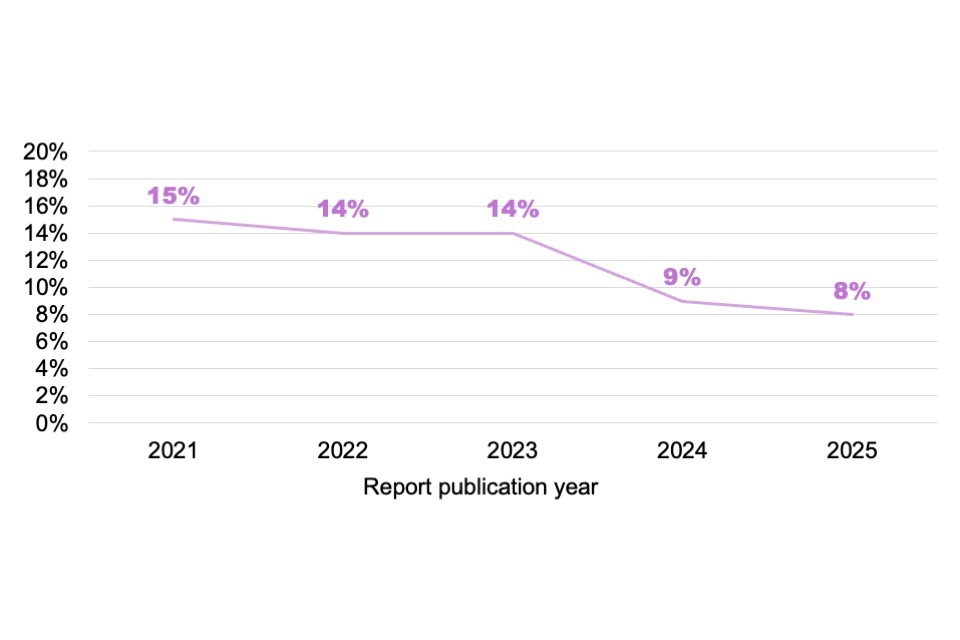
Bases: c.200 cyber sector businesses each year. For consistency with previous reports, the x axis refers to the report publication year, which is one year on from the fieldwork year
3.2 Higher Education student demographic profiles
This section provides the breakdown of graduates in cyber security and computer science courses for the latest available academic year (2022/23), in terms of gender identity, ethnicity, age, and entry from state schools. This is taken from HESA and Jisc secondary data. Overall, the pipeline of new entrants into the cyber security labour market has not substantially changed from last year, with the exception of sustained improvement in female participation in postgraduate cyber security courses.
-
Female participation in cyber security courses remained low in absolute terms, with only 14% of undergraduate and 27% of postgraduate students identifying as female. These female participation levels were, once again, significantly lower than for broader computer science courses (20% and 35% respectively, for undergraduate and postgraduate computer science courses). Nevertheless, the postgraduate figure for cyber security courses showed continued improvement, increasing from 21% female in 2020/21, and 24% in 2021/22, to 27% in 2022/23.
-
At least 17% of cyber security students and 14% of computer science students were from ethnic minority backgrounds, showing a slight decrease of 2% from the previous year. However, it should be noted that there was an increase in students with undisclosed ethnicity across both sets of courses, which may impact the results. Cyber security courses continued to attract enrolment from a wide range of age groups, with 72% of undergraduates aged 18-24 and 27% aged 25 or older. This diversity was more pronounced at postgraduate level, where 69% of students were 25 or above. These figures were similar to previous years.
-
As in previous years, mature students (aged 30+) showed a stronger preference than other age groups for part-time study (52% took this option, vs. 24% of those aged 25-29, 23% of those aged 21-24 and 4% of those between 18-20 years old).
-
At least 73% of UK-domiciled cyber security students came from state schools, consistent with the 72% for computer science students. This was broadly in line with previous years. These figures are likely to underestimate the true proportions, as the students with unknown schooling backgrounds in the dataset (accounting for 25% of the dataset) were most likely to have been state-educated. A small proportion of both cyber security students (2%) and computer science students (4%) came from privately funded schools.[footnote 7]
The full tabulated data for this section is provided in Annex B.
3.3 Diversity in recruitment processes
A new survey question for this year covered what cyber sector employers had done, if anything, to encourage job applications from diverse groups. This was asked to the 51% of cyber sector businesses that had undertaken recruitment in the 18 months prior to the survey.
As Figure 3.4 shows, the majority of these employers said they had hired through non-degree routes (63%). Another relatively common action, undertaken by around 4 in 10 employers when hiring, involved running events in schools or colleges (41%). Comparatively few businesses had diversified their senior leadership team (16%), set quotas (8%) or hired through government-backed diversity schemes (7%), which were the least commonly mentioned options. The lack of emphasis specifically on diversity among senior leadership teams may help to explain why diversity continued to be lower among this group, compared to the whole cyber sector workforce (as covered in Section 3.1).
Figure 3.4: Actions taken to encourage job applications from diverse groups in the UK cyber sector (fieldwork year 2024)
| Hired through non-degree routes | 63% |
| Run talks or events in schools colleges or universities | 41% |
| Attended networking events or career fairs specifically for diverse groups | 32% |
| Worked with recruitment agencies to find more diverse candidates | 31% |
| Worked with any third sector organisations to find more diverse cadidates | 20% |
| Diversified our senior leadership team | 16% |
| Set diversity quotas for recruitment | 8% |
| Hired through a government-backed scheme to promote diversity | 7% |
Base: 107 cyber sector businesses that had any job vacancies since January 2023
3.4 Qualitative insights on diversity
In the qualitative research, there was widespread agreement that the cyber security workforce continued to be male dominated. Perceptions of ethnic diversity were more mixed. While some participants thought there had been improvements in diversity over time, others contrasted with this view by saying there had been little change in their experience.
“It’s very pale, male and stale still. We’ve got two females, one ethnic minority, so we’re miles below where we should be.” Large cyber sector business
Participants continued to raise many of the same barriers to improving diversity that had been raised in previous years. Some thought that employers were not attracting enough diverse entry-level candidates. The talent pool remained a key issue, with employers citing the limited availability of diverse candidates. In addition, the cost of degrees and other technical qualifications was also believed to be an obstacle at the entry level.
“I wish there was more support in this area. You can observe that the pool is not as diverse as it needs to be. But I’m not necessarily educated enough to see how to solve that problem.” Micro cyber sector business
The sector not being visibly diverse was another challenge that participants highlighted. Some felt that it continued to be unattractive to women in particular, because of stereotypes of the sector being male dominated.
“There’s always been a big push for schools to develop more diversity. But then people come out of schools and don’t see themselves in that role, because the sector’s not diverse.” Training provider
Some employers were taking steps to make their recruitment processes more inclusive. Examples included using gender-neutral language in job descriptions, through to external partnerships and outreach work to attract more diverse candidates, for instance working with Cyber Security Challenge UK’s Women in Cyber campaign, and the STEM Returners programme (which helps STEM professionals to re-start their careers after career breaks).
“An example of what we did to get that 50/50 gender balance – we looked at all the photographs we used in the brochures, we got an expert team to look at the language. We had to work it really, really hard.” Small cyber sector business
Recruitment agents observed that they were frequently asked for advice on how to improve diversity. They had helped with the wording of job descriptions and given practical advice, for instance around ensuring diverse representation on interview panels.
“I think there probably is still a bit of a gap in female candidates, particularly for technical roles. And employers are asking for it more and more. So I’ve been working with a large firm recently, and they asked us at a point just to only send female candidates.” Recruitment agent
Diversity and staff retention were also felt to be linked. Participants thought broader staff retention would be affected in workplaces where diverse groups were made to feel different or unwelcome. Some employers were trying to attract and retain more diverse employees by creating more inclusive work environments, for instance allowing flexible working, hybrid working, and extended parental leave.
“If you’re specifically looking at attracting women into these jobs, you’ve got to really think about what’s important to them. And the feedback that I constantly get is flexibility.” Large non-cyber (private sector) business
4. Demand for skills
This chapter covers UK employer demand for cyber security skills, which was previously addressed in Chapter 7 of the reports from earlier waves. It explores the number of online job postings, the roles, skills, qualifications, and experience levels in demand, where the demand is coming from (both in terms of economic sectors and geographically) and the salary levels offered. The data for this 2025 report focuses mainly on the 2024 calendar year (January to December 2024). This is based on our analysis of online job vacancy data using the Lightcast Analyst labour market database.
Our analysis across this chapter continues, as in previous waves, to split out core cyber roles (where some aspect of cyber security is the main job function) and cyber-enabled roles (which require cyber skills but may not formally be labelled or commonly recognised as cyber security jobs). The charts therefore have separate data for core roles and “all cyber roles” (which sums core and cyber-enabled job postings). More detail on the definition of core and cyber-enabled roles is in Annex C.
The current picture
In 2024, there was an average of 2,698 core cyber security job postings every month, and a further 2,399 in cyber-enabled job roles. The median salary for a core cyber job was £55,000, which was 12% higher than the median salary for a job in the wider IT labour market (at £48,900). The top 5 cities posting the core cyber jobs – Greater London, Manchester, Bristol, Birmingham and Leeds – have not changed since 2021.
What’s new since the 2024 report (which covered 2023 job postings)?
For the second year running, there was a decline in cyber security job postings, reflecting the ongoing slowdown in the broader digital sector. Demand decreased by 33% from 2023 for core cyber roles, and by 41% all cyber roles. Both groupings had previously experienced a similar decline from 2022 to 2023. The wage premium for core cyber jobs – the median wage offer, over and above that for IT jobs – also shrank for the second year in a row (from 33% in 2022, to 25% in 2023, and 12% in 2024). Perhaps related to this, employers were less inclined to advertise a salary in 2024 (70% of core job postings did so, compared to 75% in 2023).
Where these jobs were located also continued to evolve. In 2024, there was a slight uptick in core job postings offering remote working (26%, vs. 22% in 2023). This followed the previous rise and fall in remote working trends, which increased from 13% of core job postings in 2020 to a high of 28% in 2022, before dropping back last year.
4.1 Number of job postings
In 2024, there were 61,163 relevant job postings covering all cyber roles. This includes 32,370 job postings across core cyber roles (2,698 per month) and 28,793 other cyber-enabled job postings requesting cyber security skills (2,399 per month).
These numbers have continued to decrease for the second year running (see Figure 4.1). Core job postings were down 33% (from 48,492 in 2023). Demand for all cyber roles decreased by 41% (from 97,319 in 2023). There were similar declines from 2022 to 2023 (by 32% and 39% respectively).
Figure 4.1: Monthly number of core and all online cyber job postings in the UK (January 2023 to December 2024)
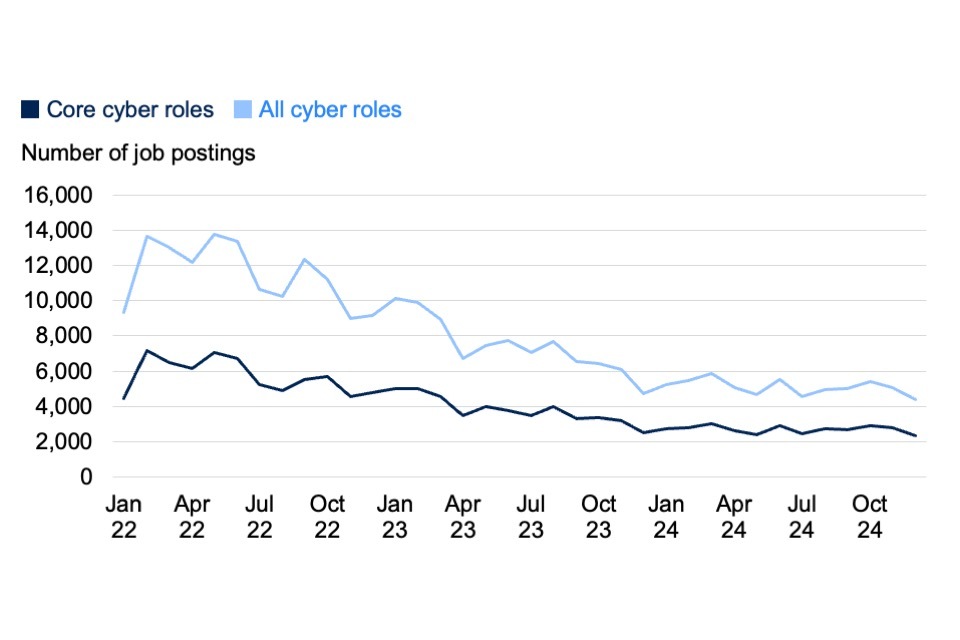
Source: Lightcast. Bases: 150,541 online job postings across all cyber roles from January 2023 to December 2024 (of which 61,163 were in 2024); 77,877 for core cyber roles (32,370 in 2024)
Figure 4.2 sets out how the volume of cyber security job postings has changed since January 2022, compared to job postings across all digital sectors. The job postings for each subsequent month are indexed to January 2022, which has an index score of 100.
Between January 2022 and March 2023, there was higher growth in cyber job postings than there was across all digital sectors. Across both cyber security and wider digital roles, this demand dropped from April 2023. This reduction in demand for cyber security roles continued throughout 2024.
Figure 4.2: Index of online cyber job postings in the UK (January 2022 to December 2024, January 2022 = 100)
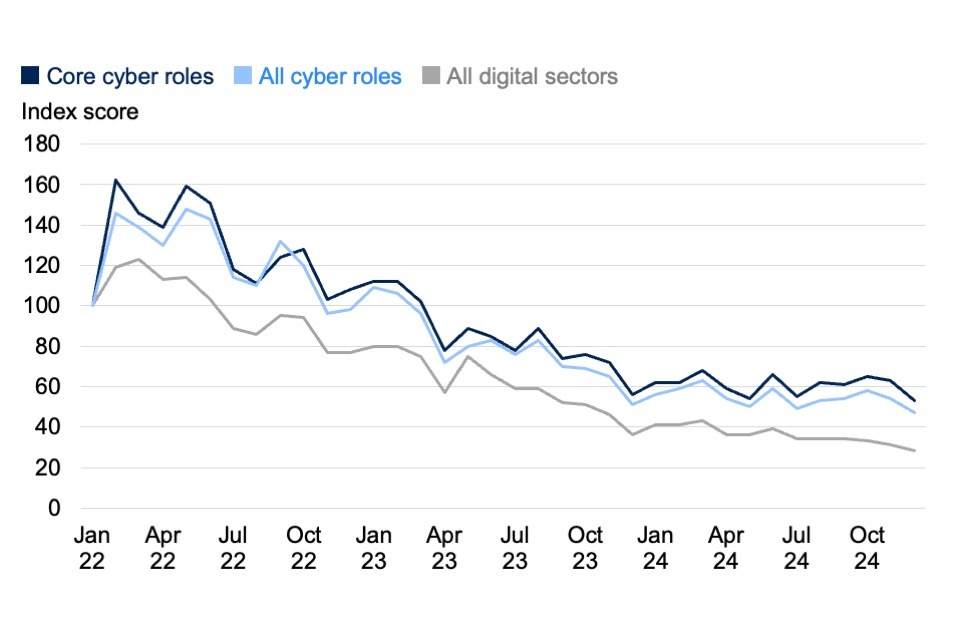
Source: Lightcast. Bases: 3,142,916 online job postings from January 2022 to December 2024 (of which 581,019 were in 2024); 288,311 across all cyber roles (61,163 in 2024); 2,854,605 across all digital sectors (519,856 in 2024)
In the qualitative research, recruitment agents acknowledged that the market for permanent cyber security jobs was growing more slowly than it had been in previous years. They thought the uncertain economic climate was making companies more reluctant to hire, and candidates more hesitant to change jobs. Layoffs following the downturn in the broader technology sector were another factor believed to be influencing the supply of candidates.
“There are very good people looking for work at the moment, so there is a high quality of candidates that are out there.” Recruitment agent
4.2 Geographical differences
The remainder of this chapter focuses on only the 32,370 core cyber job postings from January to December 2024.
Figure 4.3 shows the proportion of these job postings from each UK region (where region has been provided in the job listing) for 2024. On the heatmap, a darker colour indicates a higher density of cyber jobs in that region.
In line with last year’s report, the highest concentration of job posts fell within London and the South East. Some areas that had previously experienced growth – Yorkshire and the Humber and East of England – saw a small decline (by approximately 1% each from 2023).
Notably, 26% of job postings had no regional location listed, i.e., the roles were marked as remote or UK-wide. This is an increase from 2023 (22%), which suggests that there was a slight upward trend in job postings offering remote working. This followed the previous rise and fall in remote working trends, which made up 13% of core job postings in 2020, 21% in 2021 and 28% in 2022, before dropping back to 22% in 2023.
Figure 4.3: Percentage of core cyber job postings from each UK region (where location is known, January to December 2024)

Source: Lightcast. Base: 24,085 online job postings with location data from January to December 2024
Figure 4.4 sets out the cities with the highest number of job postings, alongside the top 15 UK Local Authorities in terms of Location Quotient rankings. Location Quotients measure how concentrated labour market demand is within an area. The average demand is set at 1.0. A Location Quotient of 1.2, for example, indicates that the demand for core cyber employees is 20% higher than the UK average.
The top 5 cities by number of job postings – Greater London, Manchester, Bristol, Birmingham and Leeds – have remained consistent since 2021. In terms of Location Quotient rankings, Reading has remained at the top for cyber security job postings since 2023, while some of the other highest demand areas include Cheltenham, Bristol, and Manchester. There has also been strong relative demand for skills in Cambridge, Gloucester, Basingstoke and Deane, and Belfast.
In Stevenage, it is worth noting that demand for core cyber roles is predominantly in sectors such as human health and defence.
Figure 4.4: Number of core cyber job postings and Location Quotients in the top 15 UK Local Authorities (January to December 2024)

Source: Lightcast. Base: 24,080 online job postings for core cyber roles with local authority location data from January to December 2024
4.3 The job roles being advertised
Figure 4.5 lists the identified core cyber roles by job title.[footnote 8] 4 most demanded roles remained consistent with the 2023 and 2022 data, with some changes in the specific proportions each year. Security Analyst job postings have increased as a share of all job postings (from 16% in 2022 and 25% in 2023, to 28% in 2024). Security Consultants as a share of all job postings have decreased, from 13% in 2023 to 8% in 2024.
There has been a steady demand for mid-level cyber security managers, especially in consulting businesses, professional services companies, financial institutions, and government organisations.
These positions often share overlapping skill requirements, which may explain variations in how different employers and recruitment agencies label and classify these roles.
Figure 4.5: Top recurring job titles among the UK core cyber job roles identified (January to December 2024)
| Security Analyst | 28% |
| Security Engineer | 26% |
| Security Manager | 22% |
| Security Consultant | 8% |
| Security Specialist | 5% |
| Security Architect | 4% |
| Security/IT Auditor | 3% |
| Penetration Tester | 2% |
| Network Architect | 1% |
Source: Lightcast. Base: 11,784 online job postings for core cyber roles with job titles from January to December 2024
4.4 The sectors with high demand
Job postings were typically advertised through a recruitment agency, which accounted for a third (33%) of the core cyber roles in this latest dataset. This compares to 42% in the 2023 dataset, suggesting a slight decrease in the use of recruitment agents in 2024. For the remaining 17,713 core cyber roles with a named employer, the data suggests the following sectoral breakdown (Figure 4.6).
As in previous years, this is not necessarily a comprehensive breakdown. The Lightcast dataset may omit some key large employers that do not post job adverts on recruitment sites online and instead use alternative avenues (e.g., directly recruiting through their own website). Consequently, the following explores the top sectors for core cyber postings, excluding direct employer-led recruitment activity.
Two of the key employers for core cyber roles in 2024 were in the public sector and aerospace and defence (namely, the NHS and BAE Systems). There was also significant demand among multinationals (e.g., Unilever, Amazon, Microsoft), professional services and finance businesses (e.g., Virgin Money, JP Morgan Chase, Deloitte, HSBC), telecommunications (e.g., BT, Vodafone), and central government departments (e.g., Ministry of Defence).
Figure 4.6: Percentage of UK job adverts for core cyber roles attributed to a specific Standard Industry Classification (SIC) 2007 code (where the employer is named, January to December 2024)
| Computer Programming, Consultancy and Related Activities | 15% |
| Financial Service Activities, Except Insurance and Pension Funding | 11% |
| Activities of Head Offices; Management Consultant Activities | 7% |
| Human Health Activities | 5% |
| Public Administration and Defence; Compulsory Social Security | 5% |
| Office Administrative, Office Support and Other Business Support Activities | 5% |
| Education | 4% |
| Other Professional, Scientific and Technical Activities | 3% |
| Legal and Accounting Activities | 3% |
| Telecommunications | 3% |
Source: Lightcast. Base: 17,713 core cyber job postings for core cyber roles with sector data from January to December 2024 (excluding recruitment agency postings). N.B. human health activities typically refer to the health and social care sector – the NHS is the largest employer of cyber security roles within this sector.
4.5 The skills, experience and qualifications being demanded
Specific skills mentioned in job postings
There has been no major change in the types of skills being sought after in core cyber job postings compared to last year (Figure 4.7). The top 3 technical skills mentioned are “cyber security skills” (a broad mention without further specification), auditing and vulnerability. There has been a 5% increase in the proportion of job postings requesting vulnerability skills since 2023, perhaps driven by increased demand for preventative and responsive threat intelligence.
Other sought-after skills areas include risk management, Microsoft Azure, penetration testing and automation. There was also a small increase in demand for automation skills (up 2% from the previous year).
Figure 4.7: Top skills requested for UK core cyber job roles (January to December 2024)
| Cyber security | 63% |
| Vulnerability | 20% |
| Auditing | 19% |
| ISO/IEC 27001 | 16% |
| Risk management | 16% |
| Incident response | 15% |
| Risk analysis | 14% |
| Project management | 14% |
| Microsoft Azure | 13% |
| Security controls | 13% |
| Network security | 13% |
| Cyber threat intelligence | 13% |
| Firewall | 13% |
| Security information and event management | 13% |
| Computer science | 12% |
| Automation | 11% |
Source: Lightcast. Base: 32,370 online job postings for core cyber roles from January to December 2024. N.B. only mention accounting for 10% or more are charted.
A total of 1,335 out of the 32,370 job postings (4%) explicitly requested AI skills – too small to be included in the above chart. This may be due to the relative nascence of “AI security” as examined in the latest DSIT Cyber Security Sectoral Analysis 2025, and its deep dive into AI and Software Security. Employer feedback on skills in AI and cyber security are also explored in this report in Section 6.4.
Experience and qualifications requirements
In line with all previous years of this analysis, the most common request from employers has been for applicants with mid-level experience of between 2 and 6 years (accounting for 63% of core cyber job postings in 2024). Similarly, demand for entry-level applicants with under 1 year of experience remained low in 2024 (17%), decreasing over the last 2 waves (from 25% in 2022 to 22% in 2023).
A total of 81% of employers required applicants to have a minimum of a bachelor’s degree (or equivalent), for a core cyber role, with a further 7% wanting postgraduate qualifications such as a master’s degree or PhD. The proportional share of requirements for wider cyber roles was similar, with over 8 in 10 employers (83%) looking for candidates with a bachelor’s or higher degree. This was in line with the previous study.
The full data on experience and qualifications has been included in Annex D.
4.6 Salaries
UK-wide salary data
In 2024, the mean advertised salary was £58,800 for a core cyber job posting, with a median value of £55,000. These figures are not directly comparable to previous waves, due to changes in the Lightcast platform and the way the data has been collected.[footnote 9]
For context, we can however compare external data (from the 2024 ONS Annual Survey of Hours and Earnings, or ASHE) on salaries within SIC 2007 code 62, which is the “computer programming, consultancy and related activities industry” code. This data shows that the mean annual pay increased from £51,300 in 2023 to £57,600 in 2024 (+9%). The median also increased from £44,100 in 2023 to £48,900 in 2024 (+9%).
Using the ASHE data as a proxy for IT job salaries in the UK suggests there was a wage premium of approximately 12% for core cyber jobs (£55,000) compared to IT jobs (£48,900), when comparing median salaries. This wage premium has decreased from a figure of 25% in 2023 and 33% in 2022, possibly reflecting the pay increases experienced by the wider IT sector over these years.
Figure 4.8 sets out the percentage of core cyber roles offering salaries within each of the charted salary ranges, where the salary was advertised. It is also worth noting that 75% of online core cyber job postings in 2024 did not contain any salary information, compared to 70% in 2023. This suggests a decrease in salary transparency across 2024, which has accompanied the tightening of the cyber security wage premium.
Figure 4.8: Percentage of UK core cyber job postings offering the following salaries (where a salary or salary range is advertised, January to December 2024)
| £11,000 to £24,999 | 3% |
| £25,000 to £30,999 | 5% |
| £31,000 to £36,999 | 8% |
| £37,000 to £42,999 | 11% |
| £43,000 to £48,999 | 9% |
| £49,000 to £54,999 | 11% |
| £55,000 to £60,999 | 14% |
| £61,000 to £66,999 | 9% |
| £67,000 to £72,999 | 8% |
| £73,000 to £78,999 | 6% |
| £79,000 to £84,999 | 4% |
| £85,000 to £459,000 | 13% |
Source: Lightcast. Base: 7,951 online job postings for core cyber roles with advertised salaries from January to December 2024 (25% of all online job postings for these roles)
Regional variations in salaries
Regional salary trends in job postings revealed persistent regional disparities. London continued to offer the highest mean salary (£69,800) for core cyber roles in the UK, as illustrated in Figure 4.9.
However, the regional pay landscape has evolved. The gap between regional salaries has been steadily narrowing in recent years. From a baseline £23,200 difference between the highest and lowest paying regions in 2021, this gap has consistently decreased, falling to £18,800 in 2022, £18,300 in 2023, and most recently to £17,100 in 2024. The difference between the UK average (mean) advertised salary and the lowest-paying region has also improved, standing at £6,100 in 2024, which represents a £1,200 reduction from the previous year.
Figure 4.9: Mean salary offers for UK core cyber job postings, by region (where the salary or salary range is advertised, January to December 2024)
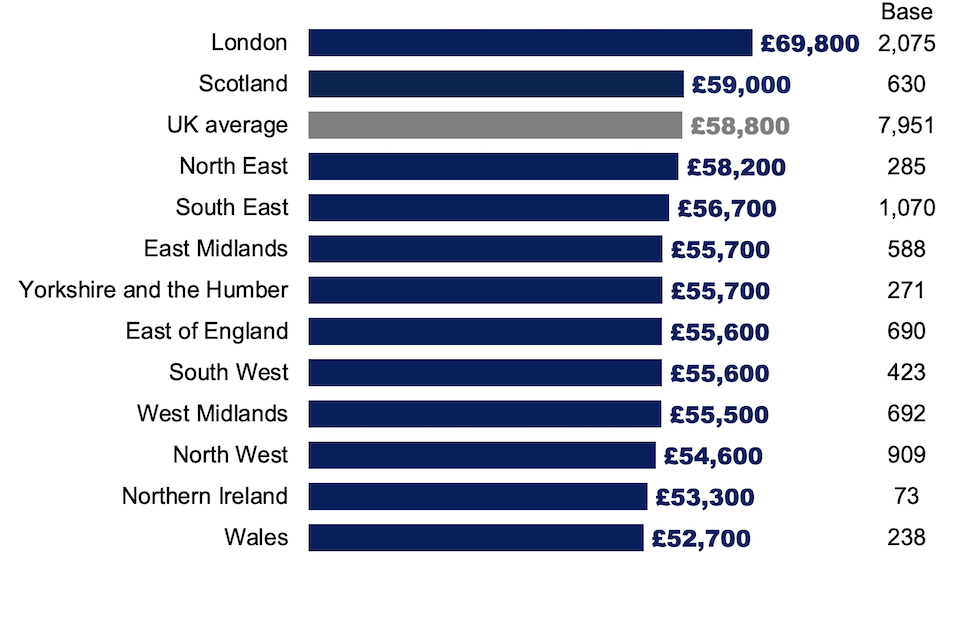
Source: Lightcast. Base: 7,951 online job postings for core cyber roles with salary data that can be mapped to a specific UK region from January to December 2024 (the remainder are based in the UK, but do not mention a region, and may be likely to offer a remote working option)
Nevertheless, analysis of actual earnings – not just advertised salaries – presents a more complex picture. When examining external data (from the 2024 ONS ASHE) on IT professionals’ earnings by region and occupation (specifically SOC 213), the disparity between London and Wales (the highest and lowest paying regions respectively) has actually widened significantly. The earnings gap between these regions stood at £32,000 in 2024, an increase of 34% from 2023. The difference between the UK average (mean) earnings for IT professionals and the Welsh average was £8,100, which aligns more closely with the Lightcast data on advertised salaries for core cyber roles.
The divergence between advertised salaries and actual earnings points to changing workplace dynamics. While Lightcast vacancy data indicates shrinking regional pay differences on the surface, this may in fact reflect the increasing prevalence of remote and flexible working arrangements across regions (e.g., jobs advertised in Wales could be undertaken from London, and vice versa). Despite this, actual earnings data of IT professionals suggests that a significant pay disparity remained between regions. The impact of remote working on salaries could simply be more pronounced in the cyber security labour market than in the wider IT labour market – particularly among specialist roles, or roles requiring higher levels of experience.
5. Supply of skills
This chapter looks at the skills pipeline – those entering the cyber security labour market. The analysis is based on secondary data covering Higher Education pathways, apprenticeship programmes, and professional retraining and upskilling initiatives. The data from this chapter maps back to our estimate of inflows into the labour market in 2024 (the most recent calendar year) in Chapter 2, which forms part of the overall workforce size calculation reported in that chapter.
We also review the latest secondary data to update our understanding of the geographical distribution (UK, EU and non-EU), and salary ranges of the people entering the cyber security labour market. This material was featured in Chapter 9 in last year’s report.
The survey and qualitative interviews also contribute here. We provide quantitative data on pathways into the cyber sector specifically. This is followed by qualitative insights on the effectiveness of entry-level pathways.
The current picture
There were 22,780 total enrolments in cyber security courses in UK Higher Education Institutions (HEIs) in the 2022/23 academic year, and 6,980 cyber security graduates (at both the undergraduate and postgraduate levels). Nevertheless, in the cyber sector, roughly half of all recruitment continued to be from the existing cyber security recruitment pool – those that previously held cyber roles, rather than career starters or those converting from non-cyber roles.
There were several barriers raised in qualitative interviews to employers taking on entry-level staff, particularly from Higher Education pathways. These included perceived financial risks for employers, high salary expectations from graduates, and graduates not having broader, job-ready skills, or relevant technical certifications and experience. There was more positivity towards apprenticeship pathways, retraining and upskilling initiatives. Many of these findings matched feedback from employers in last year’s report.
What’s new since the 2024 report?
There has been approximately 20% growth in the number of cyber security graduates, with particularly strong growth in postgraduate qualifiers (+50%), between the 2021/22 and 2022/23 academic years. The 20% growth rate means we have updated our estimate of the number of graduates entering the cyber security labour market each year to approximately 6,000.
A continued trend this year is the rising number of non-UK and non-EU students coming to the UK to study cyber security and computer science at the postgraduate level. These accounted for 67% of all cyber security postgraduate students in 2022/23 (vs. 45% in 2021/22).
The qualitative research also raised new insights this year, including the additional challenges of hiring career starters in remote working environments, and the possibility of greater employer and training provider collaboration to make career starters more job ready.
5.1 Higher Education Data
This section focuses on the latest published data on graduate enrolments from the HESA and Jisc, and graduate outcomes from the HESA Graduate Outcomes survey. To note, the most recent higher education courses and enrolments data available is for the 2022/23 academic year. Later subsections here focus on graduate outcomes, where the latest data covers graduates from the 2021/22 academic year, around 15 months since they graduated.
Courses and enrolments
In the 2022/23 academic year, the number of cyber security and computer science courses provided by UK HEIs (based on unique course titles) grew significantly compared to previous years. However, student enrolment growth in these subjects has been more modest in 2022/23. This is a different picture from last year’s report, where we found that growth in demand (in terms of enrolments) was outdoing growth in supply.
-
There were 82 universities providing cyber security undergraduate courses, and 91 universities providing cyber security postgraduate courses in the UK. This is a small increase from 74 and 84 universities respectively in last year’s report. There has been a sharp increase in the number of cyber security related courses offered (up 22%, from 580 to 709).
-
The number of universities providing computer science courses has also moderately increased, from 131 universities offering undergraduate places in 2021/22, to 140 in 2022/23. And across these universities, the number of undergraduate and postgraduate computer science courses has substantially increased (up 21%, from 4,788 to 5,795).
-
Student enrolment in cyber security courses grew by 9% between 2021/22 and 2022/23 (to 22,780), while computer science enrolment increased by 7% (to 166,730). The number of graduates also increased during this period, with cyber security rising by approximately 20% (to 6,980), and computer science showing an 11% rise (to 53,930). Though these growth rates were lower than previous years, there are notable differences between undergraduate and postgraduate levels. While undergraduate numbers remained relatively stable, postgraduate programmes saw substantial growth. This was particularly true for cyber security courses, where postgraduate enrolment increased by 21% (to 8,160), and the number of postgraduates rose by 50% (to 3,860).
The full tabulated data for this section is provided in Annex E.
Not every graduate in cyber security or computer science courses opts to work in cyber security. In last year report, we estimated that the number of graduates flowing into the cyber security labour market each year was approximately 5,000. This year, acknowledging the 20% growth in the number of cyber security graduates, we have updated this estimate to approximately 6,000.
Domicile and domestic skills retention
In 2022/23, UK students comprised 88% of cyber security undergraduates, similar to previous years. By contrast, the postgraduate population has evolved considerably. As Figures 5.1 to 5.3 show, the proportion of postgraduates from relevant courses that were from outside the UK and EU has gone up year-on-year since 2018/19 (the first academic year for which this analysis was undertaken), while the proportion from the UK has dropped.
Figure 5.1: Proportion of postgraduate cyber security and computer science enrolled students in UK HEIs who were from the UK (2018/19-2022/23 academic years)
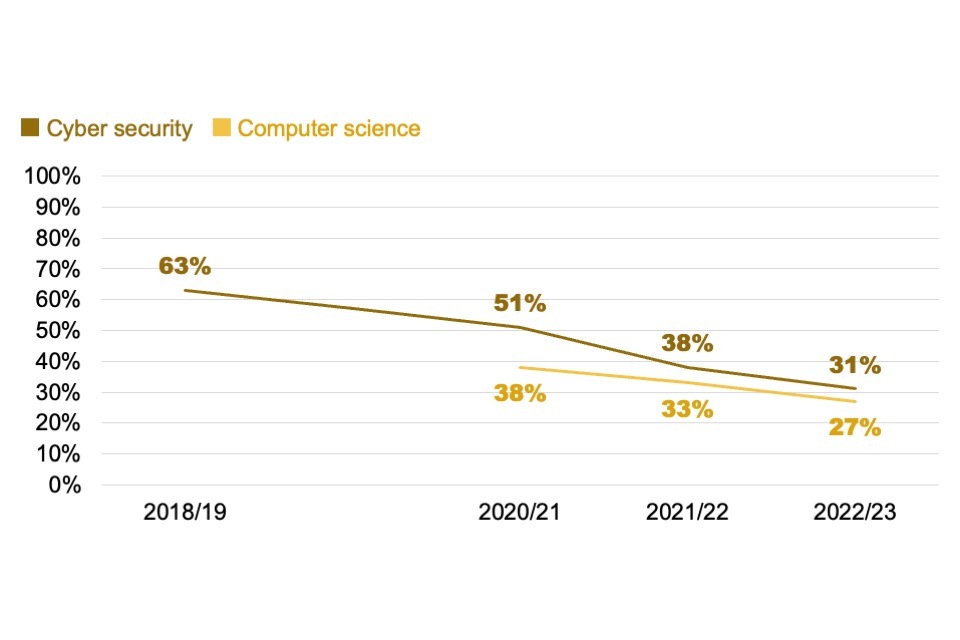
Source: HESA/Jisc data (2020/21-2022/23). ases (for 2022/23): 14,620 cyber security course enrolments, 107,330 computer science course enrolments
N.B. the reports before the 2020/21 wave did not contain the full data, with this data unavailable for 2019/20.</sub>
Figure 5.2: Proportion of postgraduate cyber security and computer science enrolled students in UK HEIs who were from the EU (2018/19-2022/23 academic years)
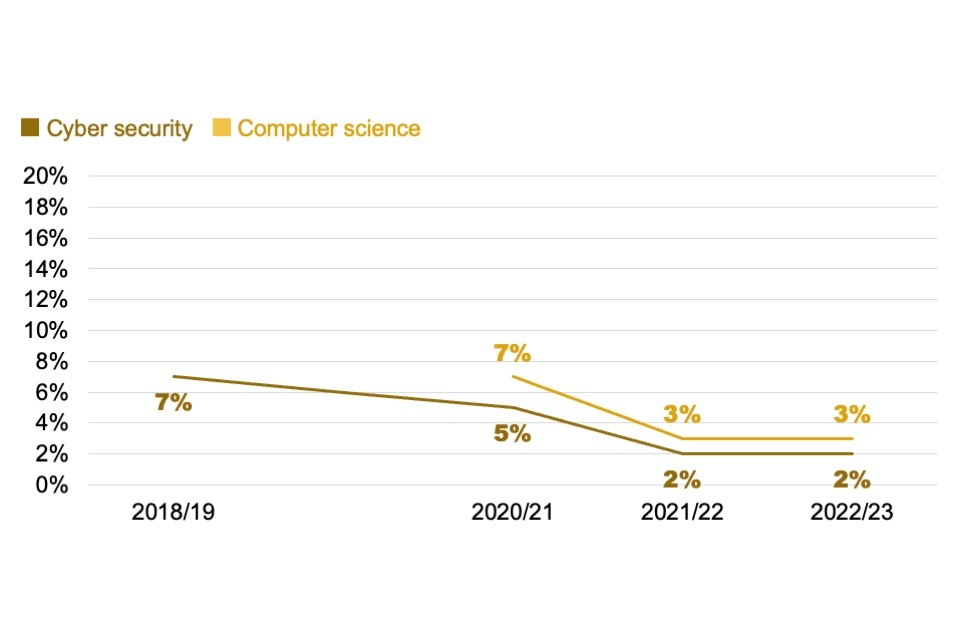
Source: HESA/Jisc data (2020/21-2022/23). Bases (for 2022/23): 14,620 cyber security course enrolments, 107,330 computer science course enrolments
N.B. the reports before the 2020/21 wave did not contain the full data, with this data unavailable for 2019/20.</sub>
Figure 5.3: Proportion of postgraduate cyber security and computer science enrolled students in UK HEIs who were from outside the UK and EU (2018/19-2022/23 academic years)
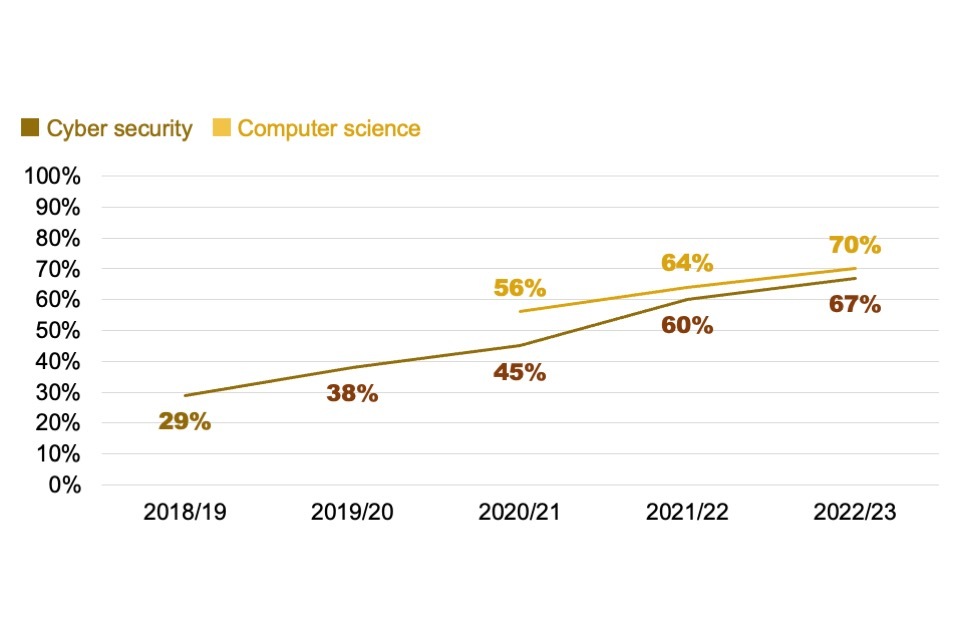
Source: HESA/Jisc data (2018/19-2022/23). Bases (for 2022/23): 14,620 cyber security course enrolments, 107,330 computer science course enrolments
N.B. the reports before the 2020/21 wave did not contain the full data.</sub>
While this illustrates the international attractiveness of the UK’s higher education sector in these fields, it could pose challenges for the domestic skills pipeline, as many international students may return to their home countries after graduation, due to visa requirements or career opportunities abroad. This could potentially limit the pool of skilled cyber security professionals at the postgraduate level available to UK employers in the long term.
Of the 1,362 cyber security graduates from the UK who were employed and provided job role SOC 2020 code at the time of the Graduate Outcomes survey 2021/22 (the most recent published year), 94% (1,279) reported that they stayed in the UK to work. This suggests that domestic graduate retention in the cyber security market has remained relatively consistent, with 96% reported retention in 2020/21.
Graduate employment outcomes
The most recent HESA data from the Graduate Outcomes survey covers graduates from the 2021/22 academic year (approximately 15 months after graduation). The results (Figure 5.4) show that 66% of cyber security graduates entered full-time employment, with an additional 11% combining employment and further study. Part-time employment remained similar to last year’s report at 6% of graduates, compared to 7% in the 2020/21 year). Combining these figures, we estimate that approximately 83% of the 5,790 students graduating in cyber security in 2021/22, and the 6,980 graduating in 2022/23, will have entered the labour market within 15 months of graduating.
The unemployment rate for cyber security graduates was 9%, compared to 5% across all graduates. This persistent gap – which was present in the 2 previous waves of this study – suggests ongoing challenges in the transition from education to employment, where cyber security graduates may face specific difficulties in meeting employer requirements. We elaborate on this in Section 5.4, covering qualitative findings on entry-level pathways.
Figure 5.4: UK graduate employment outcomes (2021/22 academic year)
| Full-time employment | 66% | 66% |
| Employment and further study | 11% | 8% |
| Part-time employment | 6% | 9% |
| Unemployed | 9% | 7% |
| Full-time further study | 3% | 4% |
| Voluntary or unpaid work | 1% | 1% |
| Part-time further study | 1% | 0% |
| Other (travelling, caring role or retired) | 3% | 4% |
Source: HESA Graduate Outcomes survey 2022/23 (covering the 2021/22 academic year). Bases: 2,430 cyber security graduates and 18,170 computer science graduates
The most recent Graduate Outcomes survey also contains SOC data for the 2021/22 academic year.
As shown in Figure 5.5, 31% of cyber security graduates entered cyber security professional roles, consistent with the previous year’s figure of 30% in 2020/21. In practice, many of those that are aligned to programming roles, or the other IT-related roles covered in the chart, may ultimately work for cyber security employers. For instance, a total of 10% of cyber security graduates moved into programming and software development roles (unchanged from 2020/21). The next 5 most common SOC codes may also signify jobs that require or benefit from cyber security expertise or are with cyber security employers.
Figure 5.5: Top 10 most commonly coded job roles for UK cyber security graduates based on SOC 2020 (2021/22 academic year)
| (2135) Cyber security professionals | 31% |
| (2134) Programmers and software development professionals | 10% |
| (3132) IT user support technicians | 9% |
| (2133) IT business analysts, architects and systems designers | 5% |
| (3131) IT operations technicians | 5% |
| (2139) Information technology professionals N.E.C. | 3% |
| (2137) IT network professionals | 3% |
| (7111) Sales and retail assistants | 1% |
| (2434) Business and related research professionals | 1% |
| (2132) IT managers | 1% |
Source: HESA Graduate Outcomes survey 2022/23 (covering the 2021/22 academic year). Base: 1,830 cyber security graduates in full-time or part-time employment.
Figure 5.6 shows that 38% of computer science graduates reported employment as programmers and software development professionals. This has been on a gradual decline (from 42%) since the 2019/20 academic year. Only 1% of computer science graduates from 2021/22 entered cyber security professional roles (not shown in chart), suggesting persistent challenges in attracting these graduates to the sector, amid competition from other industries, including software, graphic design and professional services.
Figure 5.6: Top 10 most commonly coded job roles for UK computer science graduates based on SOC 2020 (2021/22 academic year)
| (2134) Programmers and software development professionals | 38% |
| (2133) IT business analysts, architects and systems designers | 7% |
| (3132) IT user support technicians | 3% |
| (2142) Graphic and multimedia designers | 3% |
| (2139) Information technology professionals N.E.C. | 3% |
| (3544) Data analysts | 3% |
| (2433) Actuaries, economists and statisticians | 3% |
| (2431) Management consultants and business analysts | 2% |
| (7111) Sales and retail assistants | 2% |
| (3131) IT operations technicians | 5% |
Source: HESA Graduate Outcomes survey 2022/23 (covering the 2021/22 academic year). ase: 13,760 computer science graduates in full-time or part-time employment
Broader educational pathways into cyber security
To understand the diversity of educational pathways into cyber security, we analysed the academic backgrounds of graduates working in cyber professional roles (SOC 2135) within fifteen months of graduation. The sample included 890 graduates (from the 2021/22 academic year) who completed the latest Graduate Outcomes survey. This shows that:
-
62% of these students studied a cyber security course
-
15% studied computing or computer science course
-
11% studied a science, technology, engineering and maths (STEM) related course
-
6% studied humanities or social sciences
-
5% studied accounting, business, economics or finance.
This suggests that although a substantial proportion of cyber security professionals came from cyber security, computing and computer science backgrounds, graduates from other disciplines continued to feed into the cyber security workforce. This highlights the value in encouraging graduates from a wide range of pathways into the cyber security profession, as well as postgraduate reskilling bootcamps.
Salaries
Analysis of Graduate Outcomes data on full-time employment salaries (Figure 5.7) indicates that both cyber security and computer science graduates earn median salaries in the £30,001-£35,000 range within 15 months of graduating. This represents a change from the previous 3 waves, when the median bracket was £25,001-£30,000.
Figure 5.7: Reported salaries of UK cyber security and computer science graduates in full-time equivalent employment (2021/22 academic year)
| Under £15,001 | 0% | 0% |
| £15,001 to £20,000 | 3% | 4% |
| £20,001 to £25,000 | 20% | 15% |
| £25,001 to £ 30,000 | 24% | 23% |
| £30,001 to £35,000 | 18% | 18% |
| £35,001 to £40,000 | 13% | 13% |
| £40,001 to £45,000 | 6% | 8% |
| £45,001 to £50,000 | 4% | 5% |
| £50,001 to £55,000 | 2% | 3% |
| £55,001 to £60,000 | 3% | 3% |
| £60,001 to £65,000 | 2% | 1% |
| £65,001 to £70,000 | 1% | 1% |
| £70,001 to £245,000 | 4% | 5% |
Source: HESA Graduate Outcomes survey 2022/23 (covering the 2021/22 academic year). Bases: 1,120 cyber security graduates and 8,620 computer science graduates in full-time or part-time employment
Further analysis focusing specifically on graduates who entered into cyber professional roles (Figure 5.8) reveals the same median salary band of £30,001-£35,000. This analysis also shows that the salary distributions were similar between cyber security and computer science graduates working in these cyber professional roles. The latest data suggests that the previous salary disparity between these 2 graduate groups, on entering these roles, has diminished.
Figure 5.8: Reported salaries of UK cyber security and computer science graduates in full-time equivalent cyber professional roles (SOC 2135, 2021/22 academic year)
| Under £15,001 | 0% | 0% |
| £15,001 to £20,000 | 0% | 0% |
| £20,001 to £25,000 | 6% | 7% |
| £25,001 to £ 30,000 | 21% | 21% |
| £30,001 to £35,000 | 26% | 26% |
| £35,001 to £40,000 | 17% | 19% |
| £40,001 to £45,000 | 8% | 7% |
| £45,001 to £50,000 | 8% | 3% |
| £50,001 to £55,000 | 3% | 5% |
| £55,001 to £60,000 | 3% | 1% |
| £60,001 to £65,000 | 1% | 4% |
| £65,001 to £70,000 | 2% | 3% |
| £70,001 to £245,000 | 4% | 5% |
Source: HESA Graduate Outcomes survey 2022/23 (covering the 2021/22 academic year). Bases: 1,120 cyber security graduates and 8,620 computer science graduates in full-time or part-time employment.
5.2 Apprenticeship data
Further Education continues to provide an increasingly important route into the labour market for cyber security students, introducing them to basic concepts and acting as a stepping stone to other routes. This section focuses specifically on the pathway of apprenticeships, covering both ICT-related apprenticeships, as well as specific cyber security apprenticeship standards.
Apprenticeship data from the Department for Education only covers apprenticeships in England (not the whole of the UK). The latest data covers the 2023/24 academic year.
ICT-related apprenticeships
The number of apprenticeship enrolments[footnote 10] in ICT subject areas in England has increased significantly in recent years, rising from 46,080 in the 2021/22 academic year, to 52,510 in 2022/23 (+14%), and to 56,730 in 2023/24 (+8%). The number of apprenticeship starts[footnote 11] nflux of students getting involved in ICT at an apprenticeship level.
Female starter rates in ICT-related apprenticeships have increased slightly, from 33% of all starters in 2022/23, to 36% in 2023/24. In 5 specific apprenticeship standards – Digital Technician, Digital Marketer, Business Analyst, Digital Learning Designer, and Digital User Experience Professional – the number of female starters exceeded male starters. This represents a change from 2022/23, when female starters exceeded male starters in only 2 courses (Digital Marketer and Business Analyst). Furthermore, the proportion of female starters across all ICT-related apprenticeships is 10% higher than the proportion of female students enrolled in cyber security and computer science courses in Higher Education (undergraduate and postgraduate combined).
The full tabulated data for this section is provided in Annex F.
Cyber security-related degree apprenticeships
Figure 5.9 shows the number of apprenticeship enrolments, starts and achievements in England over the past 3 academic years. Between 2021/22 and 2022/23, the number of students starting cyber security apprenticeships increased by 18%. Going into 2023/24, the rate of new starts has plateaued (a 2% increase across years). However, the number of achievements increased by 50% between 2022/23 and 2023/24, signifying an increase in learners reaching the end point of assessment.[footnote 12]
Figure 5.9: Number of cyber security-related degree apprenticeships in England (2021/22-2023/24 academic years)
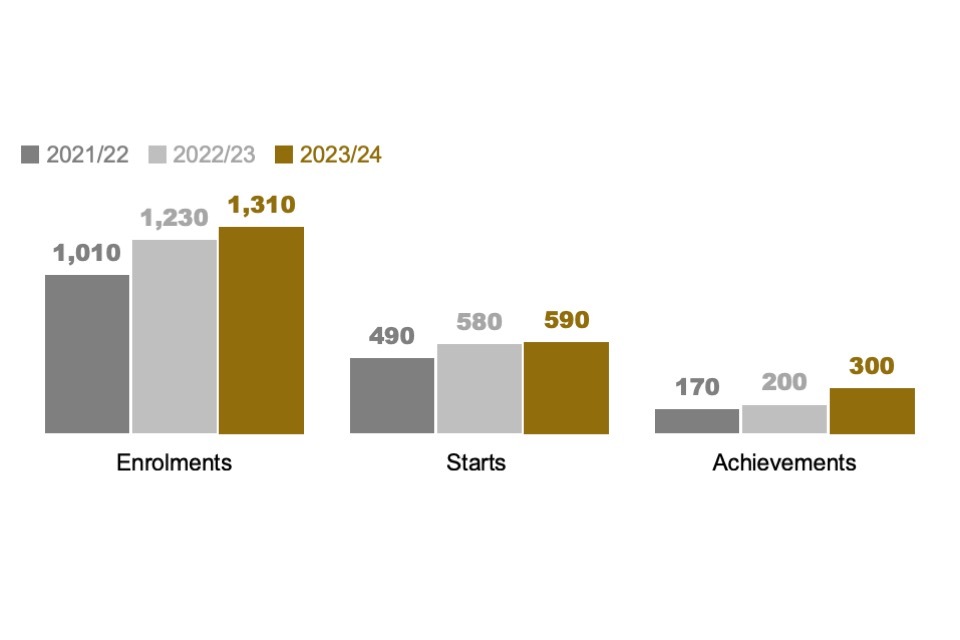
Source: Department for Education apprenticeships data. Bases: 5,880 learners who have been enrolled in, started or achieved apprenticeships in England; 1,670 in 2021/22; 2,010 in 2022/23; 2,200 in 2023/24. N.B. numbers are rounded to the nearest 10 to avoid disclosure, and may not sum due to rounding.
It is important to remember that the data only incorporates apprenticeships in England, rather than the whole of the UK. As such the UK figure is likely to be slightly higher. Our estimate of the number of cyber security apprentices entering the UK-wide cyber security labour market therefore rounds up the figure for the number of achievements in England in the most recent academic year, i.e., we estimate approximately 600 new apprenticeship starts entering into the labour market.
The full tabulated data for this section is provided in Annex G.
5.3 Retraining and upskilling
In addition to qualifications obtained through Higher and Further Education, several employers will also look for potential employees with relevant skills affirmed through certification and private training providers. In recent years, there has been increased emphasis on how certifications and training models can rapidly upskill people to move into, or increase their knowledge of, cyber security roles. The provision of innovative training models such as cyber security academies and bootcamps, as well as enhanced access to low-cost online training platforms, has also driven increasing interest in cyber security training.
This wide range of technical accreditations cannot be ignored alongside the more traditional Higher and Further Education pathways, when considering the supply of labour to the cyber security workforce. Our previous research on the cyber security recruitment pool (2021) explored 4 specific retraining and upskilling routes in depth. This section provides a brief update on these estimates, where new data is available.
The previous 2 iterations of this research estimated these routes could be generating approximately 2,500 additional individuals entering into the cyber recruitment pool each year. This year, we have retained this estimate as a conservative figure. This reflects the limited new data available to fully update this figure, as explored below. Moreover, where new data is available, there appears to be relative consistency or a small increase from previous years.
Certifications
ISC2 previously published annual data on CISSP certifications among its membership but has since ceased to do so. The most recent figure, reproduced from last year’s report, suggests that there were approximately 8,500 ISC2 members in the UK holding the CISSP certification (an increase of 8% between January 2021 and January 2023).
CompTIA is also a prevalent certification provider, offering Network+, CySA+, Security+, PenTest+ and more. Annual data for this certification (which was previously only available at a global level) is also no longer publicly available.
Armed forces
Over 16,000 individuals left the Armed Forces between April 2022 and the end of March 2023. In this period, over 13,000 service leavers used support from the Career Transition Partnership (a scheme to support leavers into employment). Of these, 789 entered Science, Research, Engineering and Technology Professional roles, of which 120 reported a role as a Cyber Security Professional under SOC 2020. This was an increase of 62% from the 2021/22 figure of 74. While this number is small in absolute terms in its impact on the overall cyber security labour market, it is an encouraging increase in a viable retraining pathway.
Specific UK-based retraining and upskilling initiatives
The UK is home to a range of retraining and upskilling initiatives. This includes providers such as Immersive Labs, Capslock, QA, SANS and more, as well as online provision. In line with last year’s report, we estimate that up to 1,500 individuals may currently enter the recruitment pool through this route. This estimate is calibrated across a number of initiatives identified in the UK (e.g., Assured Skills Academies, funded skills initiatives, and the aforementioned Career Transition Partnership).
International talent
In addition to upskilling the domestic population, the recruitment pool can also be increased via the UK’s capacity to attract international talent. The Global Talent Visa programme has approved approximately 12,240 visas between April 2020 and April 2023 (the latest published data), which includes researchers and employees coming to the UK to engage in cyber security activity. While we do not have granular breakdowns for the number of international employees entering specifically into the cyber security sector, around 20% of visa holders cited “science/technology” as their contribution to the UK.
5.4 Pathways into the cyber sector
Our survey data shows that:
-
52% of the cyber sector workforce were recruited or joined from a previous cyber security role
-
28% were recruited or joined from a non-cyber related previous role
-
15% joined as a career starter (e.g., a graduate or an apprentice).[footnote 13]
While these figures have varied across past waves, there has been no consistent change over time. Moreover, the pattern of responses this wave is very similar to the last wave, with the most common entry pathway being from a previous cyber security role (48% last year) and the least common being as a career starter (17% last year).
5.5 The effectiveness of entry-level pathways
In the qualitative interviews, we heard about several barriers to taking on entry-level cyber staff. Employers said that managing and training entry-level employees was resource-intensive, both in terms of time and money – an ongoing issue from previous years. The rise of remote working presented an additional challenge, as entry-level roles were noted to require more hands-on support than available resources allowed.
“Sadly, we are a 100% remote business, so we’re not really in a position to bring on juniors or grad schemes or whatever because, generally speaking, those people need to sit on someone’s shoulder and see what’s going on.” Large cyber sector business
Some employers and recruiters felt that graduates with cyber security degrees lacked the skills needed for employment. Hands-on and up-to-date cyber security experience, people skills and critical thinking were highlighted in this context. In some cases, the job-readiness of graduates was compared less favourably to those on retraining and upskilling pathways.
“[Graduates] are taught a very general overview of cyber security, and they are not coming to us with the knowledge of things that people are picking up in boot camps that they’re doing online.” Medium cyber sector business
A few commented that graduates’ salary expectations were increasingly high, which was a particular barrier for smaller cyber businesses trying to recruit at the entry level.
“People’s salary expectations don’t really align with the reality of things, so it is definitely a big challenge.” Micro cyber sector business
Participants reflected that industry and educational institutions needed to work together to ensure qualifications meet employers’ needs. They felt course content should be regularly updated to keep pace with rapid technological changes, including new developments in AI, which was set to have an important impact on entry level roles in the near future. Some participants were already engaging with educational institutions by giving talks and feeding into course content.
“It’s trying to feed back to the universities that, yes, you can have an academic qualification, but that doesn’t make you ready for work. So hopefully they will take that on board through that dialogue.” Small cyber sector business
We also heard about employers working with training providers to hire entry-level staff, with training providers then giving additional support to these candidates in applying for jobs and being ready for the workplace.
Qualifications and degrees were regarded by some participants as a barrier to entry to cyber security jobs. The cost of training, minimum entry requirements (e.g., employers requiring degrees) and qualifications that were largely exam-based were thought to exclude some groups of people, potentially limiting the diversity of the cyber security workforce. At the same time, employers continued to have a preference to hire people with existing experience and, in some cases, certifications – again, reflecting challenges raised in previous years.
The financial considerations around entry-level recruitment was a recurring theme. A perceived risk from employers was that investing in training may cause employees to leave for higher-paying opportunities elsewhere, making it challenging to justify the initial investment. A few participants commented that the increasing availability of free training programmes could increase opportunities to enter the sector.
“From a training point of view, I would hope actually it gets easier, and our candidate pool gets broader, because people who just have an initial passing interest [in cyber security] can learn that stuff at home.” Micro cyber sector business
Participants suggested there should be more financial support for training for employers and individuals, for instance grants, loans, tax breaks and more funding for apprenticeships.
“I think where the government needs to dip its toe in is to give businesses like mine tax breaks for producing cyber security experts… it is a significant investment on our part to get someone to the point where he’s filling the gap in cyber security… at the moment it’s really difficult to afford to do.” Micro cyber sector business
Apprenticeships were viewed as a valuable bridge between formal education, and the practical and complimentary skills needed in cyber security roles.
Participants also felt that the government had a role to play in supporting initiatives around early careers in cyber security, for instance in continuing to develop accessible pathways for career switchers.
“Let’s stop looking in the same place and thinking we’re going to find something different. How do we support people that change careers? Especially if you’re in a position where you might have left school at 16. What are your opportunities? We’ve seen people who absolutely know they are capable, but they are stuck. So it’s giving them pathways to get them out.” Training provider
More broadly, employers felt that the government had a role in promoting the value of cyber careers, highlighting that it was a rewarding career choice which had an essential societal function.
“I think the government’s role is to promote cyber security as a career. It’s to promote cyber security as something that’s fun and exciting and then give the right pathway for people to follow, to be able to be successful.” Small cyber sector business
6. Skills gaps and shortages
This chapter explores the cyber security skills that organisations feel they need, as well as skills gaps and skills shortages. Cyber security skills gaps exist when individuals working in or applying for cyber roles lack the skills necessary for those roles. Skills shortages are when there is a shortfall in the number of skilled individuals working in or applying for cyber roles.
The bulk of this chapter focuses on the non-cyber sector (all businesses, charities and public sector organisations), with the exception of Sections 6.1 and 6.9, which are exclusively about the cyber sector. This content was previously featured in Chapters 4, 5 and 6 of last year’s report.
AI skills and their impact on cyber security was also an important theme in this year’s qualitative research. This is covered in Section 6.4.
The current picture
Skills gaps in basic cyber security and incident response remained consistent with previous years, highlighting the ongoing need for information and guidance on basic cyber hygiene, especially for micro and small businesses, and charities. Approximately 699,000 businesses (49%) had a basic skills gap. A total of 32% of businesses and 40% of charities lacked confidence in dealing with cyber security breaches or attacks and had not outsourced this function.
Outsourcing of cyber security remained at similar levels to previous years and continued to be most prevalent among medium businesses (61%, vs. 31% of all businesses). The types of activities outsourced were also in line with previous years, with smaller businesses tending to outsource more basic aspects of cyber security, and larger businesses and public sector organisations more likely to use outsourcing to complement their in-house skills and fulfil more complex cyber security needs.
What’s new since the 2024 report?
For the cyber sector, this year saw the continuation of two important trends. Firstly, skill shortages have diminished, with fewer hard-to-fill vacancies being reported. This is likely to reflect a broader shift from a jobs market in favour of candidates to one in favour of employers, with tightening demand allowing employers to be more selective of who they employ. Secondly, at the same time, technical skills gaps among employees have become a more prevalent issue in the cyber sector. Cryptography and communication security has moved up the list in terms of skills gap areas.
New for this year, we explored AI skills in cyber security (both in terms of offering AI-enabled cyber security, and in terms of securing AI models and tools). AI was felt to be changing the skills landscape. Two-thirds (65%) of cyber sector businesses expected their need for AI skills among employees to increase over the next 12 months. In the qualitative research, employers expected a shift away from technical operational roles, and a greater preference in an AI-driven landscape for cyber roles that required more critical thinking skills and the ability to interpret AI-led insights. This raised some concerns around typical entry-level pathways into cyber security becoming redundant. There were also concerns around the lack of training and certification around AI in cyber security, although training providers said they were responding to plug the gaps.
6.1 Technical skills gaps within the cyber sector
Prevalence of technical skills gaps
Around 3 in 10 cyber sector businesses (28%) reported that a lack of technical skills among their existing employees affected their ability to meet their business goals. This rose to more than 4 in 10 (46%), when asked if they had been affected by job applicants who lacked technical skills.
The impact of job applicants lacking technical skills has not significantly changed since these statistics were first measured in the 2020 study. However, the impact of existing employees’ lack of technical skills shows a more concerning trend. In 2021, this was 18%, and has risen year-on-year since, to 28% in the current 2025 wave.
Areas in which there are technical skills gaps
As shown in Figure 6.1, the top 3 perceived skills gaps within the cyber sector were in auditing and assurance (23%), digital forensics (22%), and cryptography and communications security (22%). All the skills areas covered in Figure 6.1 are taken from the UK Cyber Security Council’s Cyber Career Framework
This year, this survey question was changed to remove the option for “generalist cyber security skills”, meaning the results cannot be directly compared to previous waves. Nevertheless, for the second year running, cryptography and communications security has ranked higher up in the list than in the 2023 report (when this question was first asked against the Cyber Career Framework). Indeed, in the 2023 report, cryptography and communications security was ranked bottom in the list.
Figure 6.1: Percentage of UK cyber sector businesses that had skills gaps in the following technical areas, among those that identified any skills gaps (fieldwork year 2024)
| Cyber security audit and assurance | 23% |
| Digital forensics | 22% |
| Cryptography and communication security | 22% |
| Security testing | 20% |
| Secure system architecture and design | 17% |
| Incident response | 15% |
| Secure system development | 14% |
| Cyber security governance and risk management | 11% |
| Cyber security management | 11% |
| Cyber threat intelligence | 10% |
| Data protection and privacy | 10% |
| Identity and access management | 10% |
| Vulnerability management | 9% |
| Secure operations | 9% |
| Network monitoring and intrusion detection | 8% |
| No current skills gaps | 8% |
| Another area | 3% |
Base: 118 cyber sector businesses identifying technical skills gaps among employees or job applicants
6.2 Technical skills gaps outside the cyber sector
In line with previous waves, we asked cyber leads across organisations in the private, charity and public sectors to report how confident they or anyone else in a cyber role would be at carrying out specific cyber security tasks or functions. Those who were not confident were understood to have a skills gap in this area.
Where organisations outsourced a cyber security task or function to external service providers, we did not count this as a skills gap (as the function was being fulfilled through skills sought externally). We cover the proportions outsourcing each task.
Basic technical skills gaps
The survey explored organisations’ ability to confidently cover a range of basic technical cyber security tasks and functions. These tasks, listed in Figure 6.2, were a combination of the technical areas covered under the government-endorsed Cyber Essentials scheme and other basic aspects of cyber security. The list does not include incident response, which is covered separately in Section 6.3, as an important skill in its own right.
The areas where skill gaps are most prevalent are in setting up configured firewalls (28%), storing or transferring personal data (25%), detecting and removing malware (23%), and restricting software that runs on business-owned devices (19%). These areas have been at the top of this list in all previous years as well.
Figure 6.2: Percentage not confident in performing basic cyber security tasks, by type of organisation in the UK (fieldwork year 2024)
| # | All businesses | Large businesses | Charities | Public Sector |
|---|---|---|---|---|
| Setting up configured firewalls | 28% | 11% | 31% | 3% |
| Storing or transferring personal data securely | 25% | 7% | 24% | 9% |
| Detecting and removing malware | 23% | 7% | 16% | 2% |
| Restricting the software that runs on their devices | 19% | 7% | 16% | 2% |
| Choosing secure settings for devices or software | 15% | 5% | 9% | 2% |
| Setting up automatic updates | 13% | 3% | 13% | 3% |
| Controlling who has admin rights | 12% | 4% | 8% | 1% |
| Setting up new user accounts and authentications securely | 12% | 7% | 10% | 2% |
| Creating back-ups | 7% | 5% | 4% | 2% |
Bases: 1,061 businesses; 108 large businesses (with 250+ staff); 197 charities; 111 public sector organisations. N.B. these figures are rebased on the full survey samples, but the questions were only asked of a subsample. The subsamples were small for large businesses and public sector organisations (c.50). *There was a minor change in wording for this code. Last year it was “setting up new and secure user accounts and authentications”.
These figures have fluctuated across previous waves, although there is no clear upwards or downwards trend. This highlights the ongoing need for basic cyber security advice and guidance to organisations outside the cyber sector.
As a measure of the overall basic skills gap, we combine all 9 tasks listed in Figure 6.2. This conveys the overall percentage of organisations that were not confident in carrying out at least 1 of these basic tasks. From this, we calculate that 49% of businesses had a basic technical cyber security skills gap. This equates to approximately 699,000 UK businesses.[footnote 14]
The basic cyber security skills gap was, once more, lower for large businesses (13%), indicating that smaller organisations faced the greatest difficulty in meeting these basic cyber security requirements. It was also lower for businesses in the information and communication sector (23%) and finance and insurance sector (34%).
Reflecting a pattern from previous years, this estimate was considerably lower for public sector organisations (14%) than for businesses overall (49%).
Six in ten charities (59%) had a basic skills gap, which continued to be higher than for businesses overall (49%). This pattern goes back to the 2021 report, where the result was 61% for charities and 50% for businesses.
Advanced technical skills gaps
Advanced technical skills are those that we expect may not be required in every organisation but will be important for those with more sophisticated cyber security needs. Figure 6.3 shows 8 such skills measured in the survey.
A total of 13% of businesses (rising to 31% of large businesses), 15% of charities and 28% of public sector organisations considered these skills areas to be essential to their organisations. This was based on a rating of 0 to 10 in the survey, where 10 meant “essential”.
As the chart indicates, many of these areas had similar skill gaps. That is, a similar proportion of cyber leads were not confident in undertaking these activities within their organisation, had not outsourced them, and had indicated in the survey that these activities were at last somewhat important for their organisation (a rating of at least 5 out of 10). The 2 advanced areas that had somewhat lower skills gaps were user monitoring and vulnerability scanning.
Figure 6.3: Percentage not confident in performing advanced cyber security tasks, by type of organisation in the UK (fieldwork year 2024)
| # | All businesses | Large businesses | Charities | Public Sector |
|---|---|---|---|---|
| Carrying out a forensics analysis of a cyber security breach | 21% | 19% | 18% | 12% |
| Interpreting malicious code | 20% | 15% | 20% | 13% |
| Carrying out a penetration test | 19% | 13% | 23% | 13% |
| Designing secure networks, systems and application architectures | 18% | 13% | 20% | 8% |
| Using cyber threat intelligence tools or platforms | 17% | 12% | 15% | 7% |
| Deploying autonomous cyber defences* | 14% | 15% | 19% | 5% |
| Carrying out vulnerability scans of the organisation’s network and devices | 14% | 10% | 13% | 5% |
| Using tools to monitor user activity | 11% | 11% | 10% | 5% |
Bases: 1,061 businesses; 108 large businesses (with 250+ staff); 197 charities; 111 public sector organisations. N.B. these figures are rebased on the full survey samples, but the questions were only asked of a subsample. The subsamples were small for large businesses and public sector organisations (c.50). *There was a minor change in wording for this code. Last year it was “Any automated defence against malicious network traffic”.
As a measure of the overall advanced skills gap, we again combine all 8 tasks to calculate the percentage of organisations that were not confident in carrying out at least 1 of these basic tasks. From this, we calculate that 30% of businesses had an advanced technical cyber security skills gap. This equates to approximately 428,000 UK businesses.[footnote 15]
For charities, the result was similar (29%). It was lower for public sector organisations (21%) and broadly similar for large businesses (25%).
6.3 Incident response skills
Incident response has remained a challenging area for organisations. In particular, the people responsible for cyber security in a third (32%) of all UK businesses and 4 in 10 charities (40%) lacked the confidence to deal with cyber security breaches or attacks and had not outsourced this function.
Those responsible for dealing with incident response in large business and the public sector were less likely than businesses overall to identify this as a skills gap (only 9% not confident for large business and 7% for public sector organisations). This pattern was also seen in previous waves.
Among businesses, this skills gap was lower in the information and communication sector (17%) and finance and insurance sector (12%).
These figures have not consistently trended upwards or downwards since the start of this survey series. While the figure for businesses was lower than its peak in 2023 (32%, vs. 41% in 2023), this simply marks a return to the levels last seen in 2021.
Separately, cyber leads were asked about their confidence in writing an incident response plan. In this, 47% of cyber leads in businesses, 55% in charities and 23% in public sector organisations were not confident. The figure dropped to 36% not confident and 14% not confident in medium and large businesses, respectively. This highlights that incident response was likely to have been very reactive, especially among smaller businesses, because of a skills gap. For context, the Cyber Security Breaches Survey 2024 also reported that formal incident response plans were not widespread (22% of businesses and 19% of charities had them, rising to 55% of medium businesses and 73% of large businesses).
6.4 AI skills in cyber security
Use of AI skills in the cyber sector
For the first time in this series, we surveyed cyber sector businesses about their use of AI in cyber security. Around half of all cyber sector businesses (53%) reported that staff were using AI in their day-to-day work. Despite this:
-
A smaller proportion (42%) said any of their staff had received training on AI concepts or algorithms. Among the 51% that had tried to recruit in the 18 months prior to the survey, just 15% had recruited anyone with AI skills into a cyber security role.
-
Two-thirds (65%) expected their need for AI skills among employees to increase over the next 12 months. A smaller proportion expected this need to remain unchanged (30%), while few cyber sector businesses said it would decrease (1%).
Qualitative insights on the use of AI in cyber security
The qualitative research also extensively explored the use of AI in cyber security. This was a recent and evolving topic area. Some of the businesses we spoke to had recently incorporated AI into their products and services. Others were cautiously experimenting with AI tools.
“Most of the products that we use to run our service have an element of AI built into them. It’s probably only been in the last 12 months that AI has been introduced into most of our products.” Medium cyber sector business
Where AI was being used within the cyber sector, there were a number of applications. Routine monitoring and reporting tasks, threat detection, intrusion analysis and incident response were all commonly mentioned. Some cyber sector businesses were also using AI for more specialist tasks, such as data mapping and network mapping. Some had developed their own AI tools, while others were using third-party tools which incorporated AI features (such as Microsoft Defender).
Nevertheless, we also came across cyber sector businesses that had opted to avoid AI tools, because of the perceived security risks, or because they felt these were not relevant to their cyber offering.
Various cyber leads in the wider private and public sectors mentioned that AI was increasingly being integrated into the cyber security tools they used, for activities such as threat detection and email filtering. Some had simply adopted the AI tools added by vendors or partners, but there were also cyber leads that wanted to better understand what they were buying in terms of AI-driven cyber solutions. They wanted reassurances that the AI tools were effective, and that any data gathered and used by these tools was kept within controlled environments. There was also some scepticism about replacing the human element of cyber security entirely with AI.
“AI is great at certain things and very poor at others. My concern would be if you’re relying on AI to monitor systems and look for patterns. AI actually isn’t intelligent at all. When something big and new comes along, then it might not be any better than a regular antivirus.” Medium non-cyber (private sector) business
Cyber security for AI models and tools
The private and public sector organisations interviewed in the qualitative phase were already using AI models and tools in a wide variety of ways in their business activities. Participants highlighted potential security issues around these AI models and tools.
“We’re seeing a whole new class of security issues targeting AI systems, aiming to achieve malicious output, steal data, and conduct data poisoning to reduce confidence in the output of platforms.” Large non-cyber (private sector) business
Data protection issues, such as employees feeding personal, sensitive or confidential data into publicly available AI models was commonly mentioned. On this basis, some cyber sector businesses said they were providing training and consultancy services to their customers on using AI models and tools safely.
The impact of AI on future skills needs
AI tools were felt to be changing the cyber security skills landscape. Employers said these tools saved time and resources and could allow cyber security professionals to focus on more complex tasks. Some cyber leads said this could help them plug skills gaps and make the most of their existing resources.
“We’re exploring cyber security solutions that involve AI, mainly to improve efficiency. Even with a stronger team in place, there are still some gaps in our coverage. The idea isn’t to replace the team, but to support them by using AI for repetitive tasks. This would free up their time to focus on more complex and strategic challenges.” Medium non-cyber (private sector) business
Participants felt that core cyber security skills such as critical thinking, risk mitigation and data security were fundamental both in using AI in cyber security and in securing AI models.
Those we spoke to thought that AI tools would have the most impact on operational roles, whereas risk management, auditing and assurance roles would be less affected. With operational tasks such as threat detection set to become more automated by AI tools, there was a sense that entry-level or junior analyst roles to perform these functions manually would be less in demand. Employers instead thought they would require cyber security staff with the experience and critical thinking skills to interpret AI-generated insights and make informed decisions about what actions to take. Participants raised concerns that fewer opportunities to develop expertise in entry-level roles could potentially reduce the pathways to become a more experienced cyber security analyst.
“There’s no longer necessarily a logical path from the entry-level operational things to the senior roles. As we’re driving through AI and automation into those operational tasks, there’s just less demand for them.” Large non-cyber (private sector) business
Participants highlighted the need for highly technical skills to develop AI systems securely and to develop AI tools for cyber security. Some felt that cyber staff in offensive roles, which identified and addressed security vulnerabilities (e.g., penetration testers), already needed to understand how AI models work, so they could test their vulnerabilities.
“How do we make AI secure by design, like we do with application development currently. It’s a different technology. People need to appreciate it’s different, and it might need different ways of controlling it.” Large non-cyber (private sector) business
Some participants expressed concern about both current and future shortages of technical skills in relation to AI within cyber security. It was felt to be an important future skills need and training requirement. However, cyber employers said it was hard to keep up with advancements in AI because of time constraints and a lack of resources.
“You could easily have a training module written on a Monday, and it would be out of date by Friday in terms of the pace of change and growth in AI over the last few years.” Medium cyber sector business
There was also felt to be a lack of certifications and courses specifically on AI in cyber security. Nevertheless, the training providers we spoke to said they were incorporating AI into their cyber security courses, as well as developing AI specific modules and qualifications.
Specific topics of interest around AI in cyber security included:
-
analysing and interpreting information generated by AI models and tools
-
learning how large language models worked from both a defender and attacker perspective
-
ensuring AI development was secure by design
-
how to manage and protect AI-based systems
-
managing AI-associated data access and data protection challenges.
In this year’s interviews, recruiters reported an increase in demand for AI-related skills in cyber security jobs. However, the recruiters and employers we spoke to noted that few candidates in the cyber security recruitment pool had long-term expertise in this area. They had also found that some candidates had been putting AI skills on their CVs, even when it transpired that they did not have much experience in this space.
“I’ve seen adverts going, ‘we want you to have 3 years of experience in generative AI’. Well, unless you work for one of three companies, you definitely don’t have that. Because these tools weren’t around that long.” Large non-cyber (private sector) business
6.5 Complementary skills
In the context of cyber security, complementary skills include all the non-technical skills that cyber sector employees and cyber leads in the wider private sector require to do their jobs well – sometimes referred to as “soft skills”. They cover aspects such as communication, leadership, management, and sales and marketing skills.
This study series has consistently found these skills to be highly important. Across the last 5 years of reporting, between 28% to 37% of cyber sector businesses have rated these skills as being essential for their business (in a question no longer asked). However, the survey continues to reveal skill gaps in these areas.
Complementary skills gaps in the cyber sector
Around 1 in 3 cyber sector businesses (32%) reported that a lack of complementary skills among job applicants had impacted their ability to meet their business goals in the last 12 months. A similar proportion (33%) said a lack of these skills among their existing employees had also had an impact.
These figures have not notably shifted from the last wave, suggesting this was a relatively constant skills gap. However, a lack of skills remained higher than the lowest recorded results from 2021 (when 18% said job applicants lacked these skills, and 23% said existing employees lacked these skills).
Complementary skills gaps outside the cyber sector
The survey also examined the confidence that cyber leads had in carrying out specific tasks required to develop and embed good cyber security practice within organisations. These included preparing training for non-cyber staff and communicating cyber security risks to senior internal stakeholders. For wider context, the Cyber Security Breaches Survey 2024 found that 18% of all businesses (74% for large businesses) and 18% of charities had provided cyber security training to staff.
Figure 6.4 shows the percentage of organisations where cyber leads reported that they had a skills gap in these areas. Over two-fifths (44%) of cyber leads in businesses were not confident in preparing staff training on cyber security, while 1 in 3 (31%) were not confident in communicating cyber security risks to senior individuals in their business. As Figure 6.4 shows, this was less of an issue among large businesses and public sector organisations – though training challenges were still substantial in public sector organisations (33% not confident).
These percentages have not shown a regular trend across previous waves. This report’s findings were consistent with the previous wave.
Figure 6.4: Percentage not confident in carrying out tasks that require complimentary skills, by type of organisation in the UK (fieldwork year 2024)
| # | All businesses | Large businesses | Charities | Public sector |
|---|---|---|---|---|
| Preparing training materials or sessions | 44% | 17% | 50% | 33% |
| Communicating cyber security risks to directors, trustees or senior management | 31% | 11% | 24% | 9% |
Bases: 366 businesses; 42 large businesses (with 250+ staff); 74 charities; 44 public sector organisations. N.B. these questions were asked of approximately a third of the relevant sampled groups, chosen at random.
The relatively small sample sizes for these questions do not allow for further subgroup analysis.
6.6 Governance and compliance skills
Cyber leads in the wider private, charity and public sectors are often relied upon to develop cyber security policies and strategies, contribute to business continuity planning, and to carry out cyber security risk assessments. The survey covers these 4 governance tasks, as shown in Figure 6.5. The coverage of cyber security strategies was a new addition to the survey for this wave.
Once again, for wider context, the Cyber Security Breaches Survey 2025 reported that:
-
36% of businesses and 35% of charities had formal cyber security policies in place
-
29% of businesses and 29% of charities undertook cyber security risk assessments
-
32% of businesses and 23% of charities had a business continuity plan that covered cyber security
-
57% of medium businesses and 70% of large businesses had a formal cyber security strategy (this question was only asked of these larger businesses).
Our skills-related survey shows that half of all businesses (48%) were not confident developing a cyber security strategy (falling to 22% of medium businesses and 14% of large businesses). Around a third to two-fifths also lacked the confidence to undertake risk assessments (43%), develop relevant policies (41%) and contribute to a business continuity plan (36%). Once more, charities were relatively similar to businesses, while public sector organisations tended to have fewer skills gaps in these areas.
Figure 6.5: Percentage not confident in carrying out a range of cyber security governance tasks, by type of organisation in the UK (fieldwork year 2024)
| # | All businesses | Charities | Public Sector |
|---|---|---|---|
| Developing a cyber security strategy | 48% | 49% | 17% |
| Carrying out a cyber security risk assessment | 43% | 35% | 29% |
| Developing cyber security policies | 41% | 42% | 22% |
| Writing or contributing to a business continuity plan | 36% | 33% | 10% |
Bases: 366/372 businesses; 62/74 charities; 44/48 public sector organisations. N.B. these questions were asked of approximately a third of the relevant sampled groups, chosen at random. The split-sampling meant that some statements had the lower of the 2 base sizes noted here. These lower base sizes do not allow for subgroup analysis by business size.
6.7 Cyber security skills gaps in the non-cyber workforce
Wider studies such as the Cyber Security Breaches Survey series have consistently found that wider staff outside cyber teams have an important role to play in cyber security. Board-level staff influence or decide budgets and assign strategic importance to cyber security. Wider staff are often the first line of defence, helping to identify and report cyber security breaches or attacks.
Board-level skills gaps
As in previous years, most cyber leads felt that senior management at their organisations had an adequate understanding of the risks, rules and processes relating to cyber security (Figure 6.6). Among businesses, 71% said senior managers understood the cyber risks they faced, 68% believed senior managers understood cyber security staffing needs, 63% said senior managers knew the steps to follow when managing a cyber incident, and 62% said senior managers knew when cyber breaches needed to be reported externally. Once again, these results were notably higher for large businesses and public sector organisations, whereas charities were similar to businesses overall.
These results had all declined between the 2023 and 2024 studies. This year’s data marks a return to the results from 2023 and earlier, suggesting no notable long-term change.
Figure 6.6: Percentage of cyber leads that felt their organisation’s senior management understood the following aspects of cyber security “very well” or “fairly well”, by type of organisation in the UK (fieldwork year 2024)
| # | All businesses | Large businesses | Charities | Public Sector |
|---|---|---|---|---|
| The cyber security risks facing their organisation | 71% | 88% | 72% | 90% |
| The staffing needs of cyber security within their organisation | 68% | 83% | 63% | 85% |
| The steps that need to be taken when managing a cyber security incident | 63% | 80% | 61% | 89% |
| When cyber security breaches need to be reported externally | 62% | 89% | 64% | 91% |
Bases: 1,061 businesses; 108 large businesses (with 250+ staff); 197 charities; 111 public sector organisations
Finance and insurance businesses were more likely than average to report that senior managers understood the following areas well:
-
the cyber security risks facing their organisation (90%, vs. 71% overall)
-
reporting of cyber security breaches (90%, vs. 62% overall)
-
the steps for managing cyber security incidents (84%, vs. 63% overall)
Information and communications businesses were also more likely to suggest that their senior managers understood:
-
the steps for managing cyber security incidents (85%, vs. 63% overall)
-
cyber security staffing needs (81%, vs. 68% overall)
Skills gaps among wider staff
Relatively few cyber leads had concerns that the wider staff in their organisations could identify fraudulent (phishing) emails or websites (e.g., 7% not confident in businesses, as per Figure 6.7). There was more concern around staff being able to deal with storing or transferring personal data using encryption (38%), detecting malware (33%), and working collaboratively with IT or cyber teams (19%). The personal data and malware challenges were also relatively sizeable concerns in large businesses, charities and public sector organisations, as the chart shows.
The all-business figure for collaborative working with IT or cyber teams has improved from the last wave (from 27% in 2024 to 19% in 2025), meaning it has reverted to the 2023 level.
Figure 6.7: Percentage not confident in non-specialist staff being able to carry out various tasks that can impact on cyber security, by type of organisation in the UK (fieldwork year 2024)
| # | All businesses | Large businesses | Charities | Public Sector |
|---|---|---|---|---|
| Store or transfer personal data securely, using encryption where appropriate | 38% | 17% | 22% | 14% |
| Detect malware on the organisation’s devices | 33% | 31% | 26% | 24% |
| Work collaboratively with those directly responsible for dealing with cyber security | 19% | 3% | 20% | 6% |
| Identify fraudulent emails or fraudulent websites | 7% | 2% | 13% | 6% |
Bases: 514/547 businesses; 53/55 large businesses; 197 charities; 111 public sector organisations. N.B. these questions were asked of approximately half the relevant sampled group among businesses, chosen at random, and the full sample among charities and public sector organisations.
However, as Figure 6.8 shows, the perceived challenges of getting wider staff to deal securely with personal data, and to detect malware, have both increased over the past 6 years, with a steady rise in the proportions of businesses saying they were not confident. The increasing complexity of these tasks over time may be a factor in this.
Figure 6.8: Percentage not confident in non-specialist staff being able to carry out various tasks that can impact on cyber security, by type of organisation in the UK (fieldwork years 2019 to 2024, equivalent to report publication years 2020 to 2025)
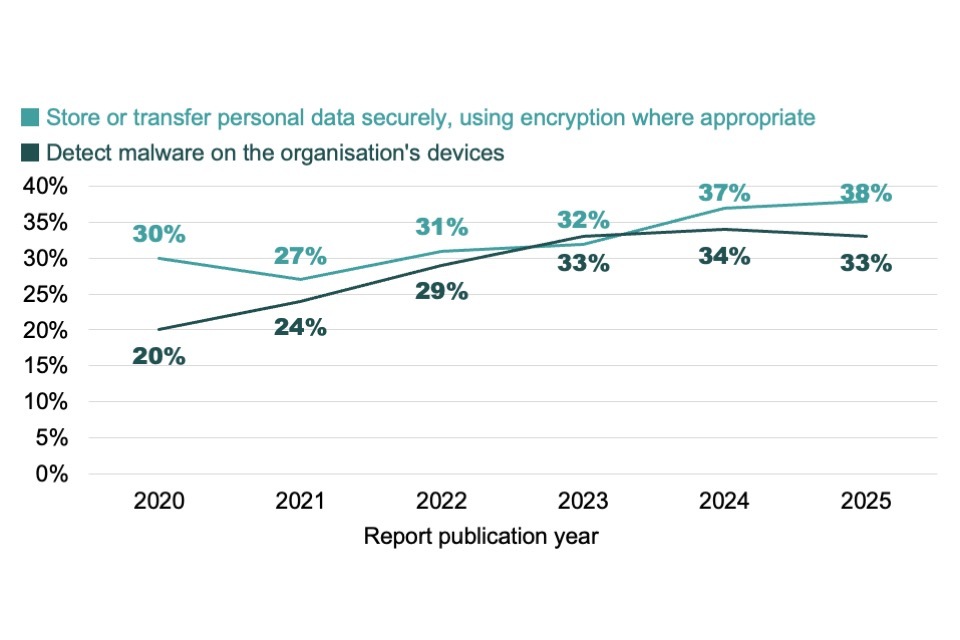
Bases: c.400-500 businesses in 2024 and 2025; c.1,000 businesses in earlier waves. For consistency with previous reports, the x axis refers to the report publication year, which is one year on from the fieldwork year
Once more, the relatively small sample sizes for these questions do not allow for further subgroup analysis.
6.8 Outsourcing
Prevalence of outsourcing
One way for organisations to plug skills gaps is to outsource aspects of their cyber security to external experts. This year, we found that 3 in 10 businesses (31%) had outsourced at least one aspect of their cyber security. This was less common among charities (24%) but substantially higher in public sector organisations (58%).
Businesses outsourcing at least one aspect of their cyber security was lower than in the 2024 report (when it was 38%). However, it was more in line with the longer-term trend (having been 33% in the 2023 report and 32% in the 2022 report). Charities and public sector organisations also fluctuated, with no consistent trend upwards or downwards over time in terms of outsourcing.
As in previous years, outsourcing was more common in:
-
medium businesses (61%) and large businesses (49%)
-
the finance and insurance sector (46%)
In this latest reporting year, companies in the administration and real estate sector (45%) and professional, scientific and technical sector (41%) were more likely to outsource cyber security functions than average (31% of all businesses). Conversely, the sectors least likely to outsource cyber security were agriculture, forestry and fishing (12%), and food and hospitality (15%).
Previous studies in this series have posited that outsourcing was most prevalent in medium businesses (more so than large businesses), because on one hand they had more complex cyber security needs than smaller businesses, but on the other hand they could not afford to employ cyber teams to the same extent as large businesses, so needed to bring cyber skills into their businesses externally.
Confidence in assessing external cyber security providers
This year, we asked a new question in the quantitative strand, to explore how confident cyber leads were in assessing whether their external cyber security providers were offering value for money. We found that – among the organisations that were outsourcing any aspects – a quarter (23%) of cyber leads in the private sector, two-fifths (40%) in the charity sector, and just over 1 in 10 (13%) in the public sector lacked confidence in this. This highlights that assessing the value-for-money of external cyber security providers is an area where businesses and charities with less in-house cyber security expertise may benefit from structured guidance.
Qualitative insights on the advantages and drawbacks of outsourcing
In the qualitative interviews, organisations reported outsourcing cyber security functions because of the resource and cost constraints of doing things in-house, for example costs associated with recruitment and training. Outsourcing had helped them address skills gaps by providing access to specialised skills and tools, particularly with regards to more advanced aspects of cyber security beyond cyber hygiene measures, such as penetration testing, and monitoring and detection. For example, one large business we interviewed had continued using a provider who had initially helped them with a ransomware attack, because they offered a 24/7 monitoring service.
Participants nevertheless identified several potential drawbacks to outsourcing cyber security functions. Some felt external providers had less commitment and could lack an understanding of their organisation’s specific needs compared to internal teams. There were also concerns about the time investment required to onboard external providers.
Some organisations had therefore opted for a hybrid approach, which combined internal cyber security teams with external expertise. This was favoured for retaining internal knowledge and control over cyber security functions, whilst supplementing any skills gaps, for example around penetration testing.
Qualitative insights on the choice of external provider
The cyber security outsourcing marketplace was described as confusing and fragmented, with some organisations saying they wanted guidance on best practice for selecting providers. Some cyber sector businesses recognised this, noting that their customers may not always know the right questions to ask when choosing an external provider, or choosing from a suite of options.
“It’s a very confusing marketplace for clients to operate in, because there’s so much to choose from and everyone’s got another box that you can tick, and it does a little bit more, for a little bit more.” Large cyber sector business
Managed Service Providers (MSPs) were considered part of this marketplace, with some organisations having outsourced all their cyber security to these providers. While some interviewees felt MSPs were increasingly offering more comprehensive and advanced services, such as Security Operations Centres, a few expressed concerns around the effectiveness of some MSPs’ cyber security services.
“A lot of the small MSPs are rebranding themselves as security. They do it because of business. They’re selling all sorts of security tools, and they don’t understand. They’re very much jumping on the bandwagon.” Large non-cyber (private sector) business
Organisations’ basis for selecting providers centred around factors such as price, word-of-mouth recommendations, and the supplier’s reputation. Increasing awareness of supply chain vulnerabilities had prompted a shift among some organisations towards more rigorous due diligence in their selection of external providers. This included implementing stricter procurement processes, seeking certifications and references, and establishing clear contractual agreements to ensure a shared understanding of the services being provided.
The businesses we spoke to were grappling with the trade-off between outsourcing specialist skills and maintaining control of the protection of their organisation against cyber threats. For some, concern about supply chain risks tipped the balance against outsourcing.
“We’re seeing a lot of interest around supply chain security at the minute, and a lot of customers are finding it very reassuring to go, ‘it’s under your control; it’s under your direction’.” Large non-cyber (private sector) business
Outsourcing of basic functions (including incident response)
This subsection focuses on the organisations outsourcing any aspects of their cyber security (accounting for 31% of businesses). Among these, we have grouped together the basic cyber security activities that every organisation would need to cover, regardless of their size or risk profile. These match the cyber hygiene activities from Figure 6.2 earlier in this chapter, as well as including incident response (another universal need across organisations).
Figure 6.9 below shows a recurring pattern from previous waves, in that the top 3 areas that tended to be outsourced among businesses were firewall configuration (85% of outsourcing businesses), detecting and removing malware (83%), and incident response or recovery (82%). The lowest ranking areas were restricting software installations (61%) and controlling admin rights (56%) – also in line with previous years. There has been no notable upwards or downwards trend in any aspects over time.
Large businesses – even those that outsourced aspects of their cyber security – were less likely to have outsourced every single one of these basic activities relative to the average business. Particularly uncommon was for large businesses to have ceded control of new user accounts and authentications, and admin rights.
Whereas other sections in this chapter have shown large businesses and public sector organisations to be closely aligned in their approaches, they diverged in terms of outsourcing. The chart shows that, among those outsourcing anything, public sector organisations were more likely than large businesses to outsource each of these basic aspects of cyber security.
Among those that outsourced anything, a total of 20% of businesses, 29% of charities, and 31% of public sector organisations had outsourced all the 9 areas listed in the chart. In other words, most still performed various cyber security functions in-house.
Figure 6.9: Percentage of UK organisations outsourcing various basic cyber security functions, among those that outsource any aspects, by type of organisation (fieldwork year 2024)
| # | All businesses | Large businesses | Charities | Public Sector |
|---|---|---|---|---|
| Setting up configured firewalls | 85% | 51% | 79% | 88% |
| Detecting and removing malware | 83% | 69% | 79% | 83% |
| Incident response or recovery | 82% | 62% | 74% | 75% |
| Setting up new user accounts and authentications securely | 71% | 28% | 80% | 60% |
| Keeping software up to date | 71% | 39% | 81% | 71% |
| Creating back-ups | 68% | 48% | 64% | 74% |
| Choosing secure settings for devices or software | 67% | 41% | 76% | 71% |
| Restricting what software can run on the organisation’s devices | 61% | 40% | 69% | 71% |
| Controlling who has admin rights | 56% | 28% | 68% | 60% |
Bases (among those outsourcing any aspects of their cyber security): 408 businesses; 53 large businesses; 72 charities; 67 public sector organisations. *There was a minor change in wording for this code. Last year it was “Setting up new and secure user accounts and authentications”.
Outsourcing of other more advanced functions
Across the population, 20% of businesses (including 35% of large businesses), 15% of charities, and 46% of public sector organisations outsourced any of the “advanced” cyber security functions, matching those mentioned in Figure 6.3 earlier in this chapter (and relisted in Figure 6.10 below). These figures were similar to previous waves, again suggesting no upwards or downwards trend.
The higher figure for larger businesses, who were less likely than the average business to have outsourced each of the more basic cyber security functions from Figure 6.9, suggests that these larger businesses were focusing their outsourcing on more complex cyber skills areas. However, there were not enough large businesses sampled for these questions to break down the specific advanced activities outsourced in Figure 6.10.
The percentages in this chart have been rebased to be out of all the sampled businesses, charities and public sector organisations (which is different to the equivalent chart from previous waves). This is to give a clearer picture of the proportion of organisations in total that are accessing these skills externally.
Figure 6.10: Percentage of UK organisations outsourcing various “advanced” cyber security functions, by type of organisation (fieldwork year 2024)
| # | All businesses | Charities | Public Sector |
|---|---|---|---|
| Any autonomous cyber defences* | 13% | 10% | 36% |
| Carrying out vulnerability scans | 15% | 10% | 42% |
| Using tools to monitor user activity | 11% | 11% | 37% |
| Interpreting malicious code | 15% | 13% | 39% |
| Carrying out a forensic analysis of a cyber security breach | 14% | 12% | 41% |
| Using cyber threat intelligence tools or platforms | 13% | 11% | 36% |
| Penetration testing | 13% | 10% | 42% |
| Designing secure networks, systems and application architectures | 15% | 12% | 34% |
Bases: 1,061 businesses; 197 charities; 111 public sector organisations. *There was a minor change in wording for this code. Last year it was “Any automated defence against malicious network traffic”.
Outsourcing functions outside of the UK
This year, for the first time, we gauged the proportion of businesses that had specifically outsourced any aspects of cyber security outside the UK. These proportions were relatively low, encompassing:
-
5% of the businesses that outsourced any cyber security functions (equalling 2% of all businesses)
-
25% of outsourcing large businesses (12% or all large businesses)
-
5% of outsourcing charities (1% of all charities)
-
none of the public sector organisations in our sample.
Due to the low sample sizes, it is not possible to break down the specific functions being taken outside the UK.
Insights from the qualitative interviews on this topic suggested UK-based providers were generally preferred, due to proximity, ease of communication, and compliance with national standards such as GDPR.
“I wanted somebody geographically local to us, so that I could go and have a face-to-face conversation with them, because I think you get a good feel for their practices and beliefs and the way that they work.” Large non-cyber (private sector) business
Overseas outsourcing was chosen by some businesses for practical reasons such as after-hours coverage or proximity to other parts of their business located overseas. For example, one participant had outsourced to Southeast Asia to facilitate collaboration between the provider and the business’s development team located there.
Some large businesses also leveraged their own intragroup cyber security resources located outside the UK. This was seen to have cost advantages, while maintaining internal knowledge and supply chain security.
Use of Security Operations Centres
For several years, we have also covered the use of Security Operations Centres. This year saw no notable changes in these statistics. Among all (i.e., not just those outsourcing), 15% of businesses used Security Operations Centres, compared with 11% of charities and 39% of public sector organisations. Therefore, public sector organisations were the most likely to use Security Operations Centres, reflecting a pattern back to 2021 (when this question was first asked).
6.9 Hard-to-fill vacancies and skills shortages in the cyber sector
This section reverts to covering the cyber sector. Cyber sector businesses are the primary recruiters and employers of cyber-related positions (as covered in Chapter 2), so the survey has historically focused on measuring skills shortages among these businesses.
Half (51%) of cyber sector businesses had tried to recruit someone into a cyber role since the beginning of 2023 (i.e., roughly in the 18 months prior to the survey). This was broadly in line with the previous 2 waves (47% in the 2024 study, and 53% in the 2023 study).
However, the average number of vacancies had dropped over the past 2 waves (from 8.2 in 2023, to 6.1 in 2024, and 4.3 in this latest wave). This pattern matched the fall in job vacancies seen in the online job postings analysis covered in Chapter 4.
Hard-to-fill vacancies
Among the 51% of cyber sector businesses that had tried to recruit, just over half (54%) reported that at least 1 vacancy was hard-to-fill. This was notably lower than in the 3 previous waves (70% in 2023, 67% in 2022 and 67% in 2021).
Overall, we estimate that 33% of cyber sector job vacancies themselves were hard-to-fill. This compares to estimates of 55% in 2023, and 37% in 2022.
The drop in the number of cyber sector employers highlighting hard-to-fill vacancies, and in the number of hard-to-fill vacancies themselves, are both indicators that the cyber security labour market had shifted from being a candidate’s market to an employer’s market. In a period of tougher competition for a smaller number of job vacancies, employers were potentially more able to identify and recruit the highest calibre candidates. This was reflected in the qualitative interviews with recruitment agents as well.
The roles and levels that were hard-to-fill
New for this year’s survey, we asked cyber sector businesses to say which specialisms they had incurred hard-to-fill vacancies in (Figure 6.11). The list of specialisms came from the UK Cyber Security Council’s Cyber Career Framework (previously discussed in Chapter 2).
As Figure 6.11 shows, a quarter (24%) of cyber businesses with hard-to-fill vacancies mentioned cyber security audit and assurance roles, followed by cyber security governance and risk management roles (21%) and cyber security management (18%). The least commonly raised were identity and access management occupations (3%).
To note, cyber security generalist (15%) was not part of the prompted list at this question but was nevertheless mentioned by 8% of businesses without prompting (i.e., they were not able to define the role in terms of one of the existing Cyber Career Framework specialisms.
Figure 6.11: Percentage of UK cyber sector businesses that have found it hard to fill job vacancies in the following specialisms, among those that had any hard-to-fill vacancies (fieldwork year 2024)
| Cyber security audit and assurance | 24% |
| Cyber security governance and riks management | 21% |
| Cyber security management | 18% |
| Security testing | 16% |
| Vulnerability management | 13% |
| Incident response | 13% |
| Secure system architecture and design | 10% |
| Network monitoring and intrusion detection | 10% |
| Cyber security generalist | 8% |
| Secure system development | 8% |
| Secure operations | 8% |
| Cryptography and communications security | 8% |
| Data protection and privacy | 6% |
| Cyber threat intelligence | 5% |
| Digital forensics | 5% |
| Identity and access management | 3% |
| Another area | 16% |
| Don’t know | 5% |
Base: 62 cyber sector businesses that had any hard-to-fill job vacancies in the 18 months prior to the survey
Finally, Figure 6.12 illustrates that most skills shortages continued to be in mid-level or more senior roles that require at least 3 years of experience. This was broadly in line with results from the 2024 report. Specifically, the proportion of employers with at least 1 hard-to-fill vacancy at a senior level (69%, looking for 3-5 years of experience) remained higher than in 2023 (when it was 59%).
Figure 6.12: Percentage of UK cyber sector businesses that have found it hard to fill job vacancies at the following levels, among those that had any hard-to-fill vacancies (fieldwork year 2024)
| Apprentices | 5% |
| Entry-level staff or graduates | 32% |
| Experienced or senior staff typically with around 3 to 5 years of experience | 69% |
| Principal-level staff typically with around 6 to 9 years of experience | 16% |
| Director-level typically with around 10 or more years of experience | 8% |
Base: 62 cyber sector businesses that had any hard-to-fill job vacancies in the 18 months prior to the survey. N.B. a further 2% said “don’t know” at this question, which has not been included in the chart.
7. The workforce gap
This chapter brings together the findings on:
-
the size of the current cyber security workforce (from Chapter 2)
-
the inflow, i.e., the people expected to enter the workforce each year (from Chapter 5)
-
the outflow, i.e., the rate at which people are expected to leave the workforce each year (also from Chapter 2).
We consider the likely growth in demand for cyber security professionals. We then combine the expected change in the supply of the workforce and the change in labour demand, to produce an annual workforce gap estimate – showing the extent to which demand outstrips supply year-on-year. To note, this is different to the skills gaps and skills shortages discussed in Chapters 6.
This content was previously in Chapter 9 of last year’s report.
The current picture
There is a net annual shortfall of approximately 3,800 people in the UK’s cyber security labour market. The market requires at least an additional 12,900 individuals, but only 9,100 new individuals are entering the workforce each year.
What’s new since the 2024 report?
For the second year running, the workforce gap has remained markedly lower than our previous estimates (3,800 this year and 3,500 in 2024, compared to 11,100 in 2023 and 14,100 in 2022). This reflects both supply and demand trends. The UK has continued to increase its supply of cyber security graduates, but demand for new cyber security professionals was lower in 2024 than in previous years. This means that the policy challenge for the UK’s cyber security labour market may be shifting from more simply increasing the supply, to better matching the supply of new talent to the demand (given that there may be fewer jobs to go around each year).
7.1 The expected supply of cyber security professionals in 2025
Taken from Chapter 2, we estimate the current cyber security workforce, as of 2024, to be in the region of 143,000 individuals.
For 2024, we estimate an inflow figure (new people to the industry) of approximately 11,700 individuals, taken from Chapter 5. This includes 9,100 new entrants, and a further 2,600 moving into cyber security roles from aligned professions. Of these figures, the 9,100 estimate is calculated from the ground up, using up-to-date data on Higher Education, Further Education, and retraining and upskilling pathways. We expect equivalent inflows from these pathways in 2025.
The 2,600 figure is calculated using supplementary information from the ONS Annual Population Survey (see Chapter 5). It accounts for the apparent increase in the number of cyber security professionals in the population, based on the number of people identifying as being in SOC 2135 (cyber security professionals). This was used to recalibrate our estimate for 2024, but this recalibration should not necessarily be assumed for 2025. For 2025, we therefore expect, conservatively, a further 9,100 new entrants into the cyber security workforce.
In 2025, we also assume an outflow rate consistent with the one estimated for 2024 (4%, as covered in Chapter 2). Applying this rate to the 2024 workforce estimate of 143,000 suggests that approximately 5,700 individuals will leave the cyber security workforce in 2025.
7.2 The expected demand for cyber security professionals in 2025
DSIT’s Cyber Security Sectoral Analysis 2025 (the most recent published analysis) found that the UK’s cyber sector workforce grew by 11%, from 60,689 in 2023 to 67,299 in 2024. This only accounts for the employees of businesses that sell cyber security products or services – it does not include cyber security professionals working in other sectors. However, it provides a good baseline against which to calibrate our estimate for the growth in demand for cyber security professionals, across all sectors.
In previous studies, there was also a calibration against the UK cyber security workforce estimates from the (now disbanded) Tech Partnership and the annual ISC2 Cybersecurity Workforce Study. However, these are no longer used. The the latest ISC2 study only provides a global estimate and does not have a UK-specific figure. The global estimate suggests a very small growth in the size of the workforce globally (+0.1%), based on the increasing economic pressures, budget cuts, geopolitical uncertainties, and rapid technological change facing organisations globally when investing in cyber security.
Our estimate for the entire cyber security workforce suggests a lower growth in demand than in the UK cyber sector (5%, vs. 11% specifically for the cyber sector). We believe that 5% is a more credible growth estimate. It matches the growth rate assumed in last year’s report. It also reflects this year’s data showing successive years of falling online job postings for cyber security professionals (see Section 4.1), and the more challenging economic conditions expected for businesses in general going into 2025.
We assume a 5% growth rate, which suggests a need for approximately 7,200 new people in 2025 to meet demand, in addition to the 5,700 to replace those exiting the sector, i.e., a total supply requirement of approximately 12,900 per year for the cyber security workforce in 2025.
7.3 The expected cyber security workforce gap in 2025
Figure 7.1 concludes with a visual summary of this workforce gap for the most recent year. Our findings suggest a net annual shortfall of approximately 3,800 people (i.e., the UK market requires at least an additional 12,900 individuals, but only 9,100 new individuals are entering the workforce each year).
Figure 7.1: Visual summary of UK’s annual cyber security workforce gap (updated for 2025)
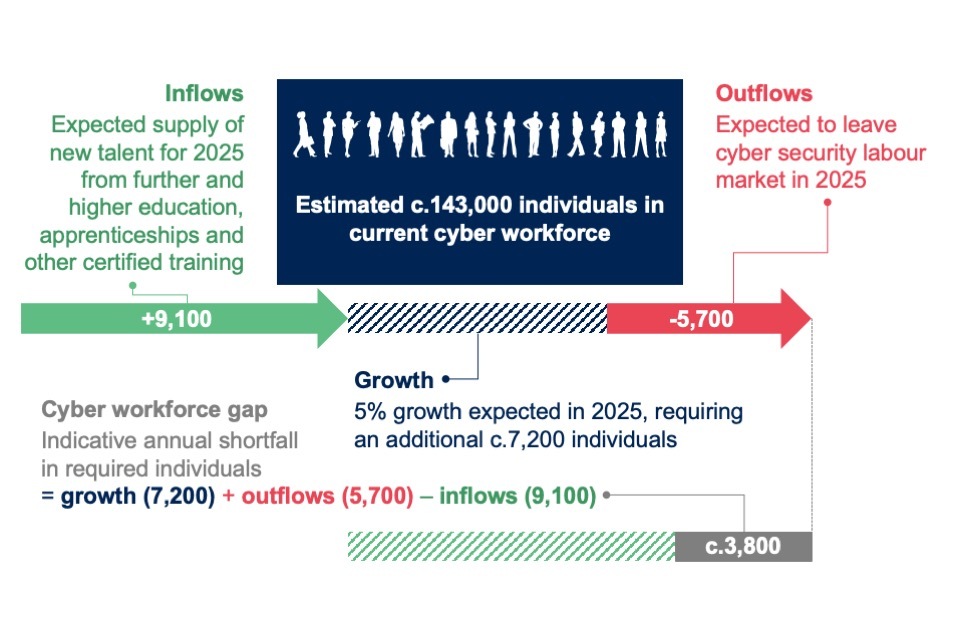
Source: Perspective Economics
8. Conclusions
This research series continues to show a rapidly evolving UK cyber security labour market. This latest report shines a light on the persistent challenges faced by employers and policymakers, for instance in addressing skills gaps and improving diversity. It also highlights new trends, particularly around the use of AI in cyber security and its impact on the skills landscape.
The following overarching insights are among the most important from this latest report:
-
The annual workforce gap was lower for the second year running, reflecting both supply and demand trends. The policy challenge is shifting from simply increasing the supply of skills to better matching supply with demand, particularly in advanced areas like AI and cryptography
-
Demand for AI-related skills is likely to increase. Upskilling the cyber security workforce can help tackle skills gaps
-
Existing challenges for new entrants to the labour market may be compounded by the proliferation of AI solutions. There is a need to ensure a well-matched talent pipeline
-
Barriers to diversity remain, although there were some promising developments. Widening the talent pool and improving senior progression remain key areas of focus
-
Cyber security skills gaps in the UK economy persist and tackling these gaps continues to be a priority
-
Outsourcing can be challenging, and organisations need guidance on how to select and manage suitable external cyber security providers
-
The UK Cyber Security Council has higher awareness among cyber firms but will need to regularly evolve its frameworks and standards to stay relevant
Skills challenges continued to evolve as the supply of cyber security skills increased and demand for cyber security professionals continued to slow. Growth was driven primarily by more graduates entering the recruitment pool, with cyber security graduate numbers increasing by 20% since last year’s report. Apprenticeships also rose by 18%.
Reflecting the ongoing slowdown in recruitment in the broader digital sector, job postings in 2024 declined by 33% from 2023 for core cyber security roles (jobs where some aspect of cyber security is the main job function) and 41% for all cyber security roles. In the cyber security sector, fewer hard-to-fill vacancies were reported (54% in 2024 down from 70% in 2023 and 67% in 2022). The Cyber Security Sectoral Analysis 2025 also showed the proportion of staff moving jobs or retiring decreased significantly compared to the previous year (from 29% in 2023 to 19% in 2024).
The policy challenge has shifted from increasing supply of skills to better matching supply with demand. Trends in supply and demand narrowed the workforce gap. We estimated the market required at least an additional 12,900 individuals but only had 9,100 new individuals entering the workforce. This resulted in an estimated net shortfall of approximately 3,800. This workface gap is similar to last year’s report (3,500 in the 2024 report) and markedly lower than in the 2023 (11,100) and 2022 (14,100) reports.
However, skills gaps increased. Technical skills gaps among existing cyber security sector employees continued to rise, increasing year-on-year from 18% in the 2021 report to 28% in the current report, though technical skills gaps among job applicants (reported by 46% of cyber security businesses) remained in line with previous waves. Developing advanced technical skills is crucial to meet the evolving needs of the sector, particularly in areas like cryptography and AI.
Demand for AI skills is likely to grow as AI transforms the skills landscape. Already just over half (53%) of cyber security businesses reported that staff were using AI in their day-to-day work and 65% expected their AI skills needs to increase over the next 12 months. A lower proportion (42%) said that any of their staff had received training on AI concepts or algorithms. In the qualitative research, we heard that the rapid pace of AI advancements made it challenging for training and certifications to keep up with the latest developments.
Participants thought there would be more demand for highly technical skills in developing AI cyber security tools and securing AI models, as well as roles requiring skills like critical thinking and the ability to interpret AI-driven insights. Upskilling the cyber security workforce in AI is required to close the skills gap in a rapidly evolving area.
AI may increase existing challenges around entry-level recruitment. Demand for entry-level candidates with less than one year of experience already fell from 25% in 2022 to 17% in 2024. In the qualitative research, participants thought that entry-level and junior analyst roles would become increasingly automated, potentially reducing the skills pipeline.
The qualitative research highlighted the barriers to taking on entry-level staff, particularly from education pathways, including perceived financial costs, high salary expectations from graduates, and graduates lacking broader, job-ready skills or relevant experience. Participants suggested more financial support for training for employers and individuals. There needs to be a focus on developing job-ready skills and fostering closer collaboration between education providers and employers to ensure a well-matched talent pipeline.
Diversity remains a challenge for the sector. The cyber security sector continued to be less diverse overall in terms of gender (17% of the cyber sector workforce are female compared to 48% of the overall UK workforce) and disability (8% of the cyber sector workforce are disabled compared to 17% of the overall UK workforce). At senior level (those with 6 or more years of experience) it was also less diverse in terms of ethnicity. Neurodivergent representation had increased since the 2020 report (although this may reflect better understanding of neurodiversity) and the gender gap for postgraduate cyber courses continued to improve year-on-year.
Despite these promising signs, barriers to increasing diversity remained, including a perceived lack of diversity in the talent pool at entry-level, negative stereotypes of the industry, and the high associated cost of degrees and certifications. In the qualitative research, recruitment agents noted they were frequently asked for practical advice on improving diversity. Potential areas of focus are identifying where and how to attract candidates from diverse backgrounds, encouraging employers to be part of diverse networks, and improving senior progression and representation.
Tackling cyber security skills gaps in the UK economy continues to be a priority. Extrapolating our survey results to the wider UK business population, we estimate that approximately 699,000 businesses (49%) had a basic technical skills gap, and 428,000 (30%) had an advanced skills gap. Our findings continued to suggest an ongoing need for basic cyber security advice and guidance, particularly for smaller organisations outside of the cyber security sector, where difficulties meeting basic cyber security requirements are greater.
Outsourcing cyber security can be challenging. Some organisations that were outsourcing lacked confidence in evaluating cyber security providers in terms or value for money (23% of cyber leads in the private sector, 40% in the charity sector and 13% in the public sector). In the qualitative research we heard that the outsourcing marketplace was confusing and fragmented, suggesting organisations need guidance on how to select and manage suitable external cyber security providers.
There is high awareness of the UK Cyber Security Council, with 69% of cyber security businesses having heard of it. Participants in the qualitative research thought the Council’s Cyber Career Framework was helpful for sharing role definitions, despite ever-evolving terminology in the cyber sector. The new professional standards associated with the framework were also seen as providing clear pathways, although there were concerns that they could limit early career flexibility, and questions about how this would fit alongside other qualifications. The Framework and standards will need to evolve to remain relevant.
9. Annexes
Annex A: Graduate inflows into IT-related and cyber security professional role
Table 9.1: Estimated number of graduates moving into IT-related roles
| Course type | Number of Graduates | Proportion in full-time employment | Proportion in IT-related roles | Implied population |
|---|---|---|---|---|
| Cyber security | 6,980 | 66% | 95% | 4,380 |
| Other computer science | 53,930 | 66% | 85% | 30,250 |
| Total | 34,630 |
Source: Perspective Economics estimates based on HESA Graduate Outcomes survey 2022/23 (covering the 2021/22 academic year). N.B. student numbers are rounded to the nearest 10 to avoid disclosure, and may not sum due to rounding.
Table 9.2: Estimated number of graduates moving into cyber security professional roles (SOC 2135)
| Course type | Number of Graduates | Proportion in full-time employment | Proportion in SOC 2135 | Implied population |
|---|---|---|---|---|
| Cyber security | 6,980 | 66% | 30% | 1,380 |
| Other computer science | 53,930 | 66% | c.1% | 360 |
| Total | 1,780 |
Source: Perspective Economics estimates based on HESA Graduate Outcomes survey 2022/23 (covering the 2021/22 academic year). N.B. student numbers are rounded to the nearest 10 to avoid disclosure, and may not sum due to rounding.
Annex B: Higher education student demographic profiles
Figure 9.1: Gender identity of cyber security and computer science undergraduates and postgraduates (2022/23 academic year)
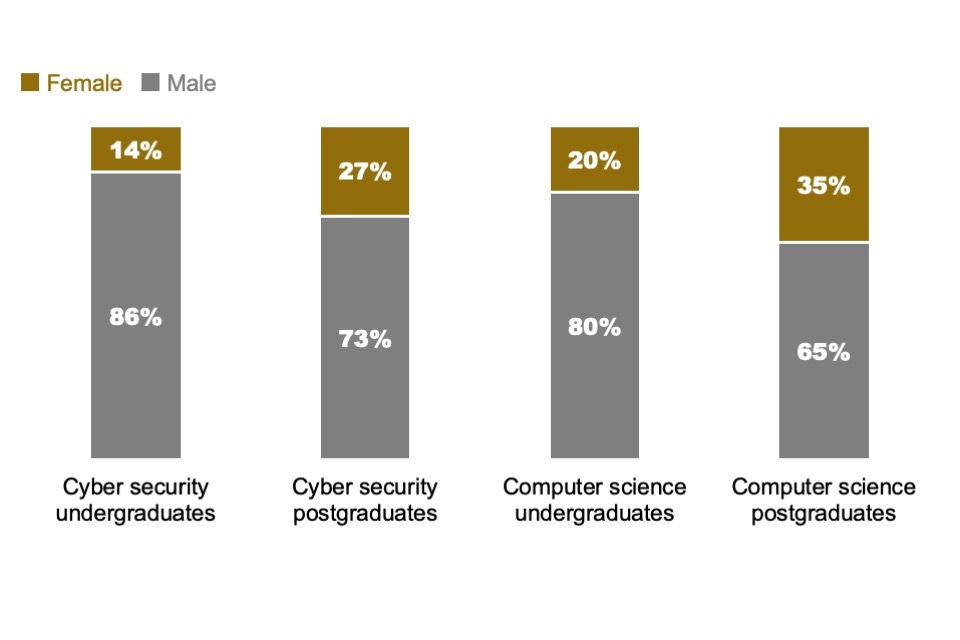
Source: HESA/Jisc data. Bases: cyber security undergraduates (3,100) and postgraduates (3,820); computer science undergraduates (24,780) and postgraduates (28,670).
Figure 9.2: Ethnicity of cyber security and computer science graduates (2022/23 academic year)
| # | Cyber Security | Computer science |
|---|---|---|
| White | 31% | 29% |
| Unknown | 52% | 57% |
| Asian | 9% | 8% |
| Black | 5% | 3% |
| Mixed | 2% | 2% |
| Other | 1% | 1% |
Source: HESA/Jisc data. Bases: 6,980 cyber security graduates; 53,930 computer science graduates
Figure 9.3: Age of cyber security and computer science students (enrolled in 2022/23 academic year)
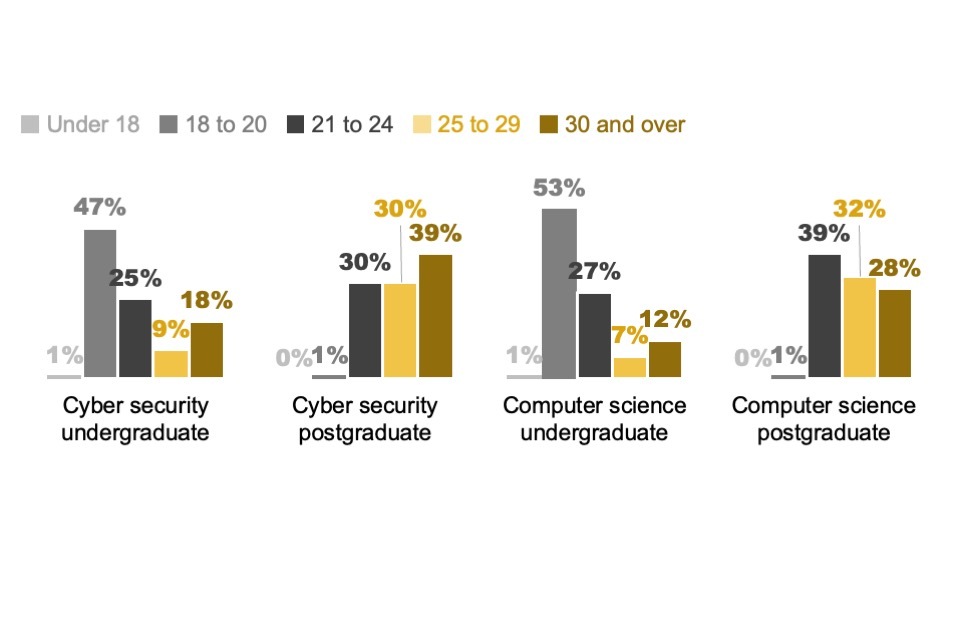
Source: HESA/Jisc data. Bases: 22,780 cyber security students; 166,730 computer science students.
Figure 9.4: State school marker for cyber security and computer science students from the UK (enrolled in 2022/23 academic year)
| # | Cyber Security | Computer science |
|---|---|---|
| State-funded | 73% | 72% |
| Privately funded | 2% | 4% |
| Unknown | 25% | 24% |
Source: HESA/Jisc data. Bases: 15,420 UK-domiciled cyber security students; 101,170 UK-domiciled computer science students.
Annex C: Definition of core and cyber-enabled roles
The data across Chapter 4 refers to both “core cyber roles” and “cyber-enabled roles”. In certain charts in this chapter, we combine both these groupings to create an “all cyber roles” grouping.
-
Core cyber roles are formally labelled or commonly recognised as cyber security jobs. They have a greater demand for skillsets and tools directly related to cyber security, such as information systems, cryptography, information assurance, network scanners, and security operations. In other words, these are job roles where some aspect of cyber security is the main job function. This would typically include job titles such as Cyber Security Architect, Cyber Security Engineer, Cyber Security Consultant, Security Operations Centre (SOC) Analyst and Penetration Tester.
-
Cyber-enabled roles are not formally labelled or commonly recognised as cyber security jobs, but they still require cyber security skills. Alongside cyber security skills, they demand more general IT and business skills, such as project management, risk assessment, network engineering, SQL, system administration, and technical support. This might be because the job requires light touch knowledge and application of technical cyber security skills (e.g., for IT technicians or governance, regulation and compliance roles) or because the job role includes cyber security functions among other things (e.g., network engineers whose role includes but is broader than just network security). Typical job titles include Computer Support, IT Support Analyst and Applications Analyst.
Annex D: Experience and qualifications requested in online cyber security job postings
Figure 9.5: Percentage of core and all cyber job postings asking for the following levels of minimum experience (where any minimum requirement is identified)
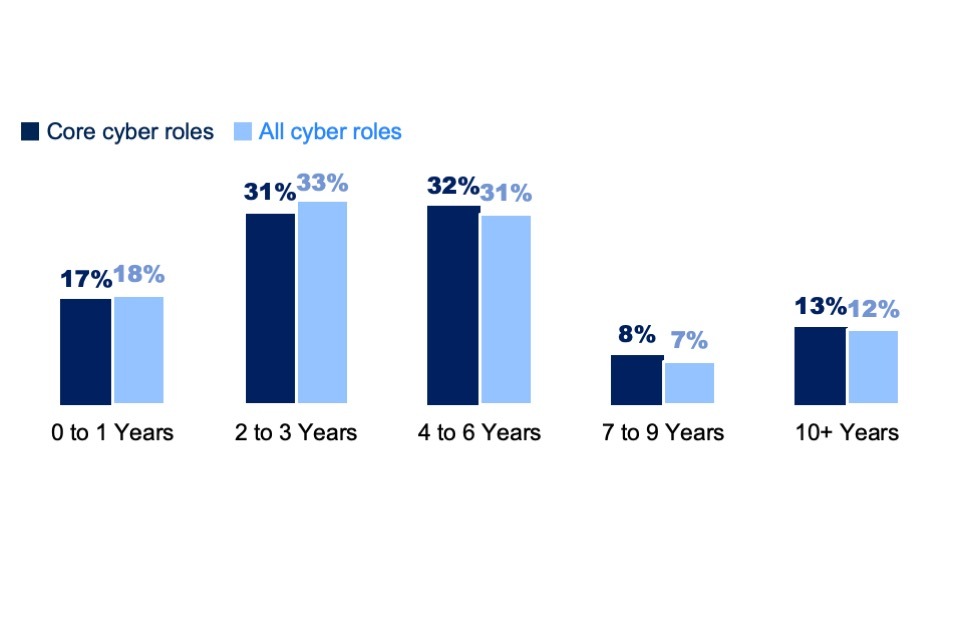
Source: Lightcast. Bases: 9,619 online job postings for core cyber roles with minimum requirements listed from January to December 2024; 18,538 across all cyber roles
Figure 9.6: Percentage of core and all cyber job postings asking for the following minimum levels of education (where any minimum requirement is identified)
| # | Core cyber roles | All cyber roles |
|---|---|---|
| PhD or equivalent | 2% | 3% |
| Master’s or equivalent | 5% | 6% |
| Bachelor’s or equivalent | 81% | 75% |
| Foundation/HNC/HND or equivalent | 4% | 5% |
| A-levels or equivalent | 4% | 4% |
| Up to GCSEs or equivalent | 4% | 7% |
Source: Lightcast. Bases: 8,684 online job postings for core cyber roles with minimum requirements listed from January to December 2024; 16,765 across all cyber roles
Annex E: Higher education courses and enrolments data
Table 9.3: Number of cyber security and computer science courses and providers (2021/22 and 2022/23 academic years)
| Qualification level | Cyber security | Computer science |
|---|---|---|
| Undergraduate | 393 (from 82 universities) | 2,940 (from 140 universities) |
| Other UG | 18 (from 15 universities) | 275 (from 65 universities) |
| Postgraduate | 298 (from 91 universities) | 2,580 (from 133 universities) |
| Total | 709 | 5,795 |
Source: HESA/Jisc data
Table 9.4: Breakdown of student enrolment and qualifiers in cyber security courses in UK HEIs (2021/22 academic year)
| Number of HEIs offering a relevant course | Number of students enrolled | Number graduating | |
|---|---|---|---|
| Undergraduate | 74 | 14,140 | 3,220 |
| Postgraduate | 84 | 6,750 | 2,570 |
| Total | 97 | 20,890 | 5,790 |
Source: HESA/Jisc data. N.B. student numbers are rounded to the nearest 10 to avoid disclosure, and may not sum due to rounding.
Table 9.5: Breakdown of student enrolment and qualifiers in cyber security courses in UK HEIs (2022/23 academic year)
| Number of HEIs offering a relevant course | Number of students enrolled | Number graduating | |
|---|---|---|---|
| Undergraduate | 81 | 14,620 | 3,120 |
| Postgraduate | 89 | 8,160 | 3,860 |
| Total | 102 | 22,780 | 6,980 |
Source: HESA/Jisc data. N.B. student numbers are rounded to the nearest 10 to avoid disclosure, and may not sum due to rounding.
Table 9.6: Breakdown of student enrolment and qualifiers in computer science courses in UK HEIs (2021/22 academic year)
| Number of HEIs offering a relevant course | Number of students enrolled | Number graduating | |
|---|---|---|---|
| Undergraduate | 131 | 103,270 | 24,850 |
| Postgraduate | 127 | 52,620 | 23,590 |
| Total | 134 | 155,890 | 48,440 |
Source: HESA/Jisc data. N.B. student numbers are rounded to the nearest 10 to avoid disclosure, and may not sum due to rounding.
Table 9.7: Breakdown of student enrolment and qualifiers in computer science courses in UK HEIs (2022/23 academic year)
| Number of HEIs offering a relevant course | Number of students enrolled | Number graduating | |
|---|---|---|---|
| Undergraduate | 142 | 107,330 | 24,950 |
| Postgraduate | 130 | 59,400 | 28,980 |
| Total | 144 | 166,730 | 53,930 |
Source: HESA/Jisc data. N.B. student numbers are rounded to the nearest 10 to avoid disclosure, and may not sum due to rounding.
Annex F: ICT-related apprenticeships data
Table 9.8: Number of ICT-related apprenticeships in England (2022/23 academic year)
| Enrolments | Starts | Achievements | |
|---|---|---|---|
| Intermediate Apprenticeship | 40 | 10 | 20 |
| Advanced Apprenticeship | 24,440 | 11,880 | 5,500 |
| Higher Apprenticeship | 28,030 | 13,210 | 4,730 |
| Total | 52,510 | 25,100 | 10,250 |
Source: Department for Education apprenticeships data. N.B. numbers are rounded to the nearest 10 to avoid disclosure, and may not sum due to rounding.
Table 9.9: Number of ICT-related apprenticeships in England (2023/24 academic year)
| Enrolments | Starts | Achievements | |
|---|---|---|---|
| Intermediate Apprenticeship | 10 | Under 10 | Under 5 |
| Advanced Apprenticeship | 24,150 | 11,530 | 6,960 |
| Higher Apprenticeship | 32,570 | 15,560 | 6,880 |
| Total | 56,730 | 27,090 | 13,850 |
Source: Department for Education apprenticeships data. N.B. numbers are rounded to the nearest 10 to avoid disclosure, and may not sum due to rounding.
Table 9.10: Number of starts in ICT-related apprenticeships in England by gender (2023/24 academic year)
| Standard | Detailed level | Female | Male | Total starts |
|---|---|---|---|---|
| Cyber Security Technician (ST0865) | 3 | Under 5 | 20 | 30 |
| Data Technician (ST0795) | 3 | 3,140 | 3,030 | 6,160 |
| Digital Marketer (ST0122) | 3 | 540 | 380 | 930 |
| Digital Support Technician (ST0120) | 3 | 170 | 280 | 450 |
| Information Communications Technician (ST0973) | 3 | 300 | 2,790 | 3,090 |
| IT Solutions Technician (ST0505) | 3 | 20 | 190 | 220 |
| IT Technical Salesperson (ST0115) | 3 | 130 | 240 | 370 |
| Radio Network Technician (ST0757) | 3 | 20 | 190 | 220 |
| Software Development Technician (ST0128) | 3 | 40 | 150 | 190 |
| Unified Communications Technician (ST0130) | 3 | Under 5 | 20 | 20 |
| Applications Support Lead (ST0949) | 4 | 10 | 30 | 40 |
| Business Analyst (ST0117) | 4 | 980 | 950 | 1,930 |
| Cyber Security Technologist (2021) (ST1021) | 4 | 70 | 380 | 450 |
| Data Analyst (ST0118) | 4 | 2,760 | 3,990 | 6,750 |
| DevOps Engineer (ST0825) | 4 | 70 | 200 | 270 |
| Digital Accessibility Specialist (ST0863) | 4 | 10 | 10 | 20 |
| Digital Forensic Technician (ST1343) | 4 | Under 5 | 10 | 20 |
| Digital Product Manager (ST0964) | 4 | 80 | 90 | 160 |
| Junior Animator (ST0488) | 4 | Under 5 | Under 5 | 10 |
| Network Engineer (ST0127) | 4 | 50 | 820 | 870 |
| Software Developer (ST0116) | 4 | 180 | 480 | 660 |
| Software Tester (ST0129) | 4 | 30 | 90 | 120 |
| Data Engineer (ST1386) | 5 | 20 | 50 | 70 |
| Digital Learning Designer (ST0974) | 5 | 70 | 50 | 120 |
| Cyber Security Technical Professional (Integrated Degree) (ST0409) | 6 | 20 | 90 | 110 |
| Data Scientist (Integrated Degree) (ST0585) | 6 | 90 | 210 | 300 |
| Digital and Technology Solutions Professional (ST0119) | 6 | 650 | 1,700 | 2,350 |
| Digital User Experience (UX) Professional (Integrated Degree) (ST0470) | 6 | 40 | 30 | 60 |
| AI Data Specialist (ST0763) | 7 | 130 | 310 | 440 |
| Digital and Technology Solutions Specialist (Integrated Degree) (ST0482) | 7 | 230 | 540 | 770 |
| Game Programmer (ST0953) | 7 | Under 5 | 20 | 20 |
| Total | 9,860 | 17,230 | 27,090 |
Source: Department for Education apprenticeships data. N.B. numbers are rounded to the nearest 10 to avoid disclosure, and may not sum due to rounding.
Annex G: Cyber security-related apprenticeships data
Table 9.11: Number of cyber security-related degree apprenticeships in England (2021/22-2023/24 academic years)
| Standard | Type | 2021/22 | 2022/23 | 2023/24 |
|---|---|---|---|---|
| Cyber Intrusion Analyst-ST0114 | Enrolments | 10 | 0 | 0 |
| Cyber Security Technical Professional (Integrated Degree)-ST0409 | Enrolments | 220 | 270 | 320 |
| Cyber Security Technician-ST0865 | Enrolments | 60 | 70 | 60 |
| Cyber Security Technologist (2021)-ST1021 | Enrolments | 340 | 730 | 920 |
| Cyber Security Technologist-ST0124 | Enrolments | 380 | 160 | 10 |
| Total | Enrolments | 1,010 | 1,230 | 1,310 |
| Cyber Intrusion Analyst-ST0114 | Starts | 0 | 0 | 0 |
| Cyber Security Technical Professional (Integrated Degree)-ST0409 | Starts | 100 | 110 | 110 |
| Cyber Security Technician-ST0865 | Starts | 40 | 30 | 30 |
| Cyber Security Technologist (2021)-ST1021 | Starts | 320 | 430 | 450 |
| Cyber Security Technologist-ST0124 | Starts | 30 | 10 | 0 |
| Total | Starts | 490 | 580 | 590 |
| Cyber Intrusion Analyst-ST0114 | Achievements | 0 | 0 | 0 |
| Cyber Security Technical Professional (Integrated Degree)-ST0409 | Achievements | 30 | 20 | 60 |
| Cyber Security Technician-ST0865 | Achievements | 0 | 10 | 20 |
| Cyber Security Technologist (2021)-ST1021 | Achievements | 0 | 60 | 200 |
| Cyber Security Technologist-ST0124 | Achievements | 140 | 110 | 20 |
| Total | Achievements | 170 | 200 | 300 |
Source: Department for Education apprenticeships data. N.B. numbers are rounded to the nearest 10 to avoid disclosure, and may not sum due to rounding.
Our standards and accreditations
Ipsos’ standards and accreditations provide our clients with the peace of mind that they can always depend on us to deliver reliable, sustainable findings. Our focus on quality and continuous improvement means we have embedded a “right first time” approach throughout our organisation.
ISO 20252
This is the international market research specific standard that supersedes BS 7911/MRQSA and incorporates IQCS (Interviewer Quality Control Scheme). It covers the 5 stages of a Market Research project. Ipsos MORI was the first company in the world to gain this accreditation.
ISO 27001
This is the international standard for information security designed to ensure the selection of adequate and proportionate security controls. Ipsos MORI was the first research company in the UK to be awarded this in August 2008.
ISO 9001
This is the international general company standard with a focus on continual improvement through quality management systems. In 1994, we became one of the early adopters of the ISO 9001 business standard.
Market Research Society (MRS) Company Partnership
By being an MRS Company Partner, Ipsos MORI endorses and supports the core MRS brand values of professionalism, research excellence and business effectiveness, and commits to comply with the MRS Code of Conduct throughout the organisation.
Data Protection Act 2018
Ipsos MORI is required to comply with the Data Protection Act 2018. It covers the processing of personal data and the protection of privacy.
HMG Cyber Essentials
This is a government-backed scheme and a key deliverable of the UK’s National Cyber Security Programme. Ipsos was assessment-validated for Cyber Essentials certification in 2016. Cyber Essentials defines a set of controls which, when properly implemented, provide organisations with basic protection from the most prevalent forms of threat coming from the internet.
Fair Data
Ipsos is signed up as a ‘Fair Data’ company, agreeing to adhere to 10 core principles. The principles support and complement other standards such as ISOs, and the requirements of Data Protection legislation.
-
Basic technical skills were a combination of the technical areas covered under the government-endorsed Cyber Essentials scheme and other basic aspects of cyber security. Advanced technical skills may not be required in every organisation but are important for those with more sophisticated cyber security needs. ↩
-
We estimate that there are 67,299 Full Time Equivalent (FTEs) working in a cyber security related role across the 2,165 cyber security firms identified in the Cyber Security Sectoral Analysis 2025. This highlights how the UK cyber sector workforce (67,299 employees) makes up the largest proportion of the overall cyber security workforce (approximately 143,000 individuals already in cyber roles, and in the wider recruitment pool). ↩
-
As of the publication of this report, the Annual Population Survey is not an accredited Official Statistic due to a fall in the response rates and, consequently, in the achieved sample sizes. However, it remains a useful resource to help calibrate and adjust our own estimate of the inflow of individuals into the cyber security workforce. ↩
-
In earlier waves of this study, limited trend data from the Annual Population Survey was available to inform workforce estimates for the cyber security workforce. The SOC 2135 code was only introduced to that survey relatively recently (initially covering the period of April 2022 to March 2023). In addition, the initial trend data saw a sharp rise in the number of people aligning to this code (jumping from 45,200 in April 2022-March 2023, to 65,200 in April 2023-March 2024 – a growth rate of 44%). This sharp increase was most likely to be due to the increasing professionalisation of the cyber security industry. This may have led to large numbers of respondents, who would have previously placed themselves in adjacent roles in IT, programming, networks and consultancy, rebadging themselves as cyber security professionals. Now that the use of SOC 2135 has become more established, with increased data points over time, it is more appropriate to consider within these workforce estimates. ↩
-
For this study (e.g., in question wording), we defined neurodiversity as the inclusion of people with “conditions or learning disorders such as autism, Asperger syndrome, dyslexia, dyspraxia and attention deficit hyperactivity disorder (ADHD)”. Please note that the diagnostic term “Asperger syndrome” is no longer in use and has been subsumed under autism spectrum disorder (ASD). ↩
-
These workforce-level estimates are derived from survey responses from cyber sector employers (i.e., these employers tell us how many of their staff are, for example, neurodivergent). As per previous years, these estimates can be very variable, so sudden year-to-year shifts should be treated with caution. Moreover, the results are susceptible to outliers in the data. For instance, in this year’s data, there were 2 cyber sector businesses that reported having more than 30 employees who were neurodivergent. If these 2 were excluded from the base, the neurodivergent statistic would decrease from 16% to 13%. There were no other notable outliers in the data for this year. ↩
-
Further statistics for the Higher Education student demographic profiles are set out in Annex B. ↩
-
We have categorised the top 50 job titles appearing in the data. This covers 11,784 of the total 32,370 core cyber job postings for the latest calendar year. It means some of the very specific variants (e.g., “Security Manager – Banking”) may have been missed. However, a manual review of the Lightcast platform suggests that the top 50 job titles are representative of the wider dataset. ↩
-
This is set out in the corresponding technical report ↩
-
Apprenticeship enrolments are the count of enrolments at a programme level for each academic year. Learners will be counted for each apprenticeship they take. Therefore, each learner may be counted more than once. ↩
-
Apprenticeship starts show the take-up of programmes each academic year. As with apprenticeship enrolments, learners will be counted for each apprenticeship they start. Therefore, each learner may be counted more than once. ↩
-
Apprenticeship achievements signify a learner reaching the end point of assessment. This is not necessarily the same as reaching the end of their learning/apprenticeship. ↩
-
These figures do not sum to 100%, both because of rounding, and because respondents may not have accounted for all their cyber security employees in their response (e.g., they may have provided complete information on entry-level staff, but not known how many joined from a previous non-cyber role). ↩
-
The business population data is taken from the DBT business population estimates 2024. These were the latest estimates as of the publication of this report, identifying a business population of 1,427,165 (for businesses with 1 or more employees). For the extrapolated figures presented here and later in this chapter, we have rounded to 3 significant figures. These figures are subject to a margin of error, as with all the results from the survey. The margin of error for businesses on this result is ±3.9 percentage points. This means that the true figure could be between approximately 644,000 and 755,000 businesses. ↩
-
The margin of error for businesses on this result is ±3.6 percentage points. This means that the true figure could be between approximately 377,000 and 480,000 businesses. ↩