Cyber security sectoral analysis 2025
Published 10 March 2025
Foreword

Feryal Clark MP, Parliamentary Under-Secretary of State for AI and Digital Government
The UK’s cyber security sector stands as a cornerstone of our ambition to drive sustainable economic growth through technology leadership. This year’s analysis demonstrates exceptional performance, with the sector’s contribution to our economy reaching new heights – generating £13.2 billion in revenue and £7.8 billion in Gross Value Added.
This growth translates directly into high-value employment opportunities across the country. The sector now employs an estimated 67,300 people, creating 6,600 new jobs in the past year alone, and is a key part of our vision for kickstarting economic growth.
The government’s recently published AI Opportunities Action Plan sets out our bold vision for UK leadership in artificial intelligence. Cyber security is fundamental to realising this ambition, ensuring AI systems are secure and trustworthy by design. Cyber security is critical to our economic resilience and underpins the deployment of all emerging technology, but also the routine transactions, from banking to social media, that we all rely on. Our forthcoming Cyber Security and Resilience Bill will provide a robust framework for protecting our critical national infrastructure, driving up security standards, and ensuring that we are prepared against attacks.
This all means that cyber security products and services are in demand, not just here, but globally. The UK cyber security sector is a strong growth market, delivering impressive capabilities. The geographical spread of cyber security firms – with half located outside London and the South East, and growth in every region – shows that everyone can benefit from this success. For the first time, the highest proportion of external investment was in the North West, home to a growing number of cyber businesses and soon to be the home of the National Cyber Force in Lancashire, countering threats from terrorists, criminals and states seeking to do harm to the UK and other democratic societies.
As we implement our ambitious policy agenda, the cyber security sector’s role becomes ever more central – not just in protecting our critical infrastructure, but in enabling the next wave of digital innovation. We will ensure this sector continues to create opportunities, drive innovation, and secure Britain’s digital future.
Feryal Clark MP
Parliamentary Under-Secretary of State for AI and Digital Government
Department for Science, Innovation and Technology
Executive summary
Introduction
Ipsos and Perspective Economics were commissioned by the Department for Science, Innovation and Technology (DSIT) in May 2024 to undertake an updated analysis of the UK’s cyber security sector.
This analysis builds upon the previous UK Cyber Security Sectoral Analysis (published in May 2024) that provides a recent estimate of the size and scale of the UK’s cyber security industry. The research provides an assessment of:
-
the number of businesses in the UK supplying cyber security products or services
-
the sector’s contribution to the UK economy (measured through revenue and Gross Value Added, or GVA)
-
the number employed in the cyber security sector
-
the products and services offered by these firms
Project scope and summary of methodology
The diagram below sets out a summary of the research methodology used. This is consistent with previous studies to support a time-series analysis of the sector’s performance to date.
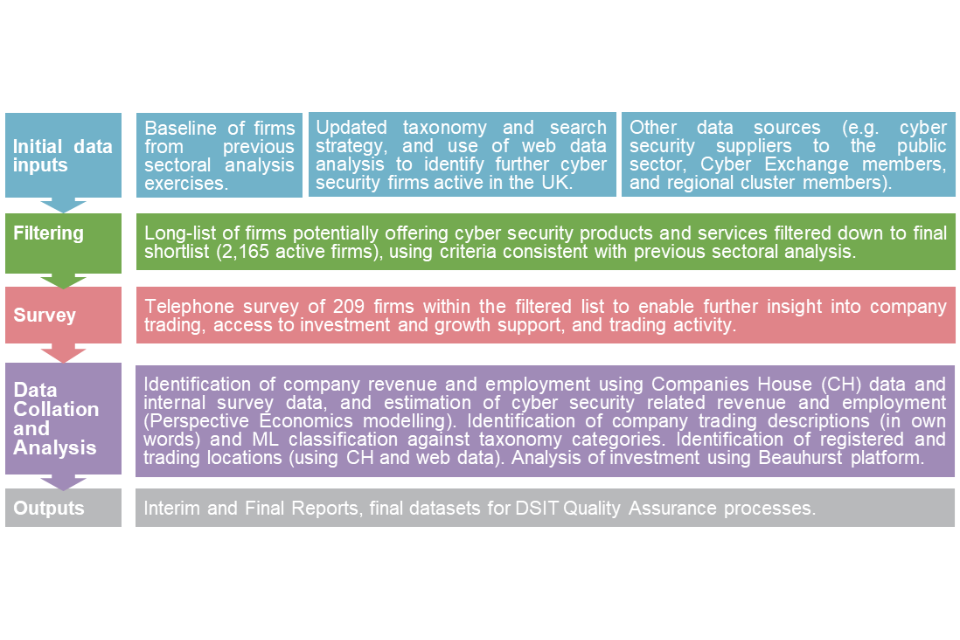
Source: Ipsos, Perspective Economics
Key findings
Number of companies
- We estimate that there are 2,165 firms currently active within the UK providing cyber security products and services
Sectoral Employment
-
We estimate there are approximately 67,300 Full Time Equivalents (FTEs) working in a cyber security related role across the cyber security firms identified
-
This reflects an estimated increase of c. 6,600 cyber security employee jobs within the last 12 months (an increase of 11%)
Sectoral Revenue
-
We estimate that total annual revenue within the sector has reached £13.2 billion within the most recent financial year.
-
This reflects a nominal increase of c. 12% since last year’s study.
Gross Value Added
-
We estimate that total GVA for the sector has reached c. £7.8 billion
-
This reflects an increase of 21% since last year’s study.
-
We estimate that GVA per employee has also increased from £106,300 to £116,200 (+8%).
Investment
- In 2024, £206 million has been raised across 59 deals within dedicated cyber security firms.
1. Introduction
1.1 Methodology and sources
This analysis builds upon the previous UK Cyber Security Sectoral Analysis (published in May 2024) that provides a recent estimate of the size and scale of the UK’s cyber security industry. This continues the time-series analysis undertaken by the research team since 2018. A full time-series analysis is set out within Chapter 4.
The research provides an assessment of the number of businesses in the UK supplying cyber security products or services; the sector’s contribution to the UK economy (measured through revenue and Gross Value Added[footnote 1], or GVA); the number employed in the cyber security sector; and an overview of the products and services offered by these firms.
The UK cyber security sector does not have a formal Standard Industrial Classification (SIC) code, and this study therefore closely aligns itself to that of the baseline analysis, to provide a time series analysis of how the sector has progressed since the baseline (2017/18) and subsequent annual studies.
The cyber security sector remains fast-moving, and continually subject to changes in products, services, and market approaches. This year’s study is fully consistent with the previous updated methodology set out within last year’s report. This includes a refined taxonomy to better identify and classify cyber security activity, continued use of a range of data sources[footnote 2], and an ongoing telephone and online survey of cyber security businesses in July to September 2024.
The following methodology and research sources were used to provide an overarching shortlist of UK cyber security businesses, and to estimate their economic contribution related to the sale of cyber security products or services.
The process by which we identify and measure the economic contribution of cyber security activity reflects a best estimate by the research team using agreed parameters for the inclusion of respective firms considered to be active in the field.
The key stages below are consistent with previous Cyber Security Sectoral Analysis exercises to enable a time series comparison.
Stage 1: Desk research
The research team conducted initial desk research to explore how the cyber security market had changed within the last 12 months. This included:
-
Engagement with UK cyber security regional networks and clusters, to gather local intelligence
-
A review of published reports regarding the output or activities of the sector (e.g., National Cyber Strategy, NCSC Annual Review, and wider landscape literature)
-
Recent investments or initiatives in the cyber security sector (including review of investments and acquisitions, and identification of industry initiatives and cohorts, e.g., Cyber Runway)
-
Any emerging trends in the market (including supply side and demand side), e.g., enhanced demand attributable to cloud security, or new product innovations requiring specific cyber security requirements (e.g., AI Security) – this is explored in new detail in Section 7.
Stage 2: Initial data collection & gap analysis
The research team sought to identify potential active cyber security firms in the UK through:
-
A review of firms previously identified in the sectoral analysis (identifying current status and determining inclusion in the updated set)
-
A review of company participation within clusters, networks, and/or government supported initiatives
-
An updated taxonomy has been used to inform a long list of firms (identified through use of web data and refined within DSIT taxonomy workshops). This list was subject to automated and manual review, and refined to a final cyber security business list for analysis (n = 2,165)
The business metrics include (but are not limited to):
-
Company name, registered number, company status, and date of incorporation
-
Registered and trading locations (using official and web data)
-
Company website and contact details
-
Core description of company activities related to cyber security
-
Company size[footnote 3] (large / medium / small / micro)
Stage 3: Cyber security sectoral survey
Ipsos conducted a representative survey of 209 cyber security firms from June to September 2024. The survey used the list of firms (n = 2,165) established in Stage 2 of this study as a sample frame from across the UK. The purpose of the survey was to understand firm-level performance, barriers, and collaboration in further detail.
It covered the following topics:
-
The categories of products and services offered across firms
-
The client sectors that cyber security firms work across
-
Revenue estimates (to supplement the other published data found in Stage 2)
-
Extent of export activity, or international collaboration
-
Perceived barriers to growth
-
Understanding areas of collaboration and reasons for working with cyber security partners
Stage 4: Qualitative consultations
This research has also been supported through five one-to-one consultations with investors in the cyber security sector. Participants were purposively sampled to reflect variation in size, location, product or service focus, maturity, and investment focus.
Stage 5: Data blending
In December 2024, the results of the cyber security sector survey were used to inform gaps within the list of identified cyber security sector firms e.g., the extent to which a firm provided cyber security products or services and attributed revenues accordingly. This stage involved data cleaning and augmentation from a range of previous sources (including company level accounts, web data, survey data, and wider desk review) to provide a final dataset of cyber security firms, including the development of firm-level metrics used for analysis within the report. Additional verification of web domains (to ensure active status) and Companies House was also undertaken to confirm active status at the time of analysis.
Stage 6: Data analysis and reporting
The final stage involved analysis of the final shortlist of firms to provide estimates of the total number of firms, products and services offered, whether firms are ‘dedicated or diversified’ with respect to how much of their activity related to cyber security provision, revenue/GVA/employment estimates, locations (registered, trading, and international presence), investment and survey feedback (anonymised at an individual level).
The data sources used to underpin the sectoral analysis included:
-
Web data: glass.ai supported with the initial identification of new providers of cyber security products and services, providing company descriptions and locations for identified company websites. Further use of web data was also used by Perspective Economics to review sub-sectors such as AI Security and Software Security.
-
Bureau van Dijk FAME (and Companies House Data Product): This platform collates Companies House data and financial statements from all registered businesses within the UK
-
Beauhurst: Beauhurst is a leading investment analysis platform, which enables users to discover, track and understand some of the UK’s high-growth companies e.g., identify investment, accelerator participation, and key information
-
Tussell: Tussell provides market insight into public sector procurement through identifying key contracts, spend, buyers and suppliers
-
Cyber Exchange: techUK’s Cyber Exchange directory enables cyber security providers to register an account and set out the products and services they provide to the market
-
Representative survey of cyber security firms: in late 2024, Ipsos conducted a representative survey of cyber security firms. The feedback from 209 providers has been useful to understand the growth drivers and challenges for firms within the market
-
One-to-one qualitative consultations: further, the team has also conducted five one-to-one consultations with investors to gather feedback on the growth and performance of the cyber security sector in the UK
1.2 Consistency with the 2024 Cyber Security Sectoral Analysis
Our approach remains consistent with previous reports (and builds upon the methodology to identify and measure the contribution of the sector). As per previous studies, this report also explores firms that:
-
Have a clear presence within the UK market, through a UK registered business that reports to Companies House on an annual basis
-
Demonstrate an active provision of commercial activity related to cyber security (e.g., through the presence of a website / social media)
-
Provide cyber security products or services to the market (i.e., sell or enable the selling of cyber solutions to other customers)
-
Have identifiable revenue or employment within the UK
-
Appear to be active at the time of writing (i.e., have not, or are not in the process of dissolution)
-
Are not charities, universities, networks, or individual contractors (non-registered) – all excluded for analysis purposes
It also draws upon consistent sources, i.e., company accounts, longitudinal survey data, and Beauhurst for investment data. The financial analysis of firms is also consistent, as it uses company information from the most recent financial year of accounts (analysis undertaken in late 2024, with financial year 2023/24 as the modal year for published accounts) and the underpinning dataset sets out where employment, revenue, GVA and investment are either known or estimated (and the rationale underpinning this).
1.3 Interpretation of the data
Across this report, percentages from the quantitative data may not add to 100%. This is because:
-
We have rounded percentage results to the nearest whole number
-
At certain questions, survey respondents could give multiple answers
It is also important to note that the survey data is based on a sample of cyber sector firms rather than the entire population. Therefore, they are subject to sampling tolerances. The overall margin of error for the sample of 209 firms (within a population of 2,165 firms) is between c.4 and c.6 percentage points. The lower end of this range (4 percentage points) is used for survey estimates closer to 10% or 90%. The higher end (6 percentage points) is used for survey estimates around 50%. For example, for a survey result of 50%, the true value, if we had surveyed the whole population, is highly likely to be in the range of 44% to 56%.[footnote 4]
By contrast, the data from the qualitative consultations is intended to be illustrative of the key themes affecting the cyber security sector as a whole, rather than a statistically representative view of cyber sector investors.
1.4 Acknowledgements
The authors would like to thank the DSIT team for their support across the study. DSIT and the report authors would also like to thank those that participated within this research, including those that participated within the industry survey, the regional cyber security clusters, consultations, and shared data, knowledge, and feedback to help underpin this study.
Note: The cyber security sector continues to increase in size, scope, and specialisms. We are happy to receive comments and feedback regarding the methodology or findings herein, through contacting cybersecurity@dsit.gov.uk
2. Profile of the UK cyber security sector
2.1 Defining the UK cyber security sector
Within the National Cyber Strategy 2022, cyber security is defined as:
The protection of internet connected systems (to include hardware, software, and associated infrastructure), the data on them, and the services they provide, from unauthorised access, harm, or misuse. This includes harm caused intentionally by the operator of the system, or accidentally, as a result of failing to follow security procedures or being manipulated into doing so.
Therefore, this sectoral analysis seeks to identify businesses active within the UK that provide products or services that enable the protection of internet connected systems and their users.
In line with previous studies, this analysis is focused upon organisations that include all of the following attributes:
-
Have a clear presence within the UK market, through a UK registered business that reports to Companies House on an annual basis
-
Demonstrate an active provision of commercial activity (e.g., through the presence of an active website / social media presence)
-
Provide cyber security products or services to the market (i.e., sell or enable the selling of cyber solutions to other customers) – aligned to the taxonomy set out below
-
Have identifiable revenue or employment within the UK related to cyber security
-
Appear to be active at the time of writing (i.e., have not, or are not in the process of dissolution)
-
Are not charities, universities, networks, and individual contractors (non-registered) – which are all excluded for analysis purposes
The businesses included within this analysis are considered to provide one or more of the following products or services:
-
Cyber professional services, i.e., providing trusted contractors or consultants to advise on, or implement, products, solutions, or services for others.
-
Endpoint and mobile security, i.e., hardware or software that protects devices when accessing networks
-
Identification, authentication, and access controls, i.e., products or services that control user access, for example with passwords, biometrics, or multi-factor authentication
-
Incident response and management, i.e., helping other organisations react, respond, or recover from cyber attacks
-
Information risk assessment and management, i.e., products or services that support other organisations to manage cyber risks, for example around security compliance or data leakage
-
Internet of Things (IoT Security), i.e., products or services to embed or retrofit security for Internet of Things devices or networks
-
Network security, i.e., hardware or software designed to protect the usability and integrity of a network
-
SCADA and Information Control Systems, i.e., cyber security specifically for industrial control systems, critical national infrastructure, and operational technologies
-
Threat intelligence, monitoring, detection, and analysis, i.e., monitoring or detection of varying forms of threats to networks and systems
-
Awareness, training, and education, i.e., products or services in relation to cyber awareness, training, or education
Section 2.3 sets out the type of cyber security products and services in further detail.
2.2 Number of cyber security firms active in the UK
We estimate that there are currently 2,165 firms active within the UK providing cyber security products and services. This reflects an estimate as of December 2024.
Whilst this reflects an increase in the number of firms offering cyber security products and services (2,091 identified in the previous study), the research team emphasise that this is one metric among many to gauge the health of the sector. For example, this increase includes:
-
Newly registered companies offering cyber security products and services (often very early / small start-ups)
-
Previously registered companies that did not previously offer such services, but have established a product or team to do so recently (e.g., consultancies offering IT risk services)
-
Businesses now identified as providing a relevant cyber security product or service (e.g., identified through provision of an accredited scheme such as Cyber Essentials) where previous web-data matching did not flag such products or services.
-
Businesses with limited web data reporting the provision of cyber security products or services, but which have been flagged through engagement with other sources (e.g., consultation with regional clusters).
Throughout this study, the research team emphasise the need to draw upon a wide range of existing sources, alongside the development and deployment of a cyber security taxonomy against Companies House data, analysis of relevant website domains, and in-depth regional engagement. Within the process, a ‘long list’ of several thousand businesses in the UK was identified as potentially relevant to the cyber security sector using keywords and web data. However, this long list was subsequently filtered to ensure each business demonstrated sufficient alignment to the research parameters and the market taxonomy.
For example, web data can identify firms that may have an active registration with Companies House, have a website or social media presence, and meets the parameters of the taxonomy. However, further review of the presence may indicate a lagging status (e.g., the business may have no true employees or may not appear to be active for several years). The team therefore reviewed more than 4,000 firms in detail, removing organisations that may have mentioned security (e.g., offering a secure data centre service) but did not appear to tangibly offer cyber security products or services to the end-market.
This yielded the 2,165 firms in scope, and the research team considers this to be an appropriate figure to gauge the health and composition of the sector whilst ensuring consistency with previous analysis.
We do however note, that as with all emerging sectors, subtle differences in definition can result in varying interpretations of the size and composition of activity. In this respect, there may be other relevant cyber security use cases, which could in future meet the short list requirements (i.e., the six conditions set at the beginning of Section 2.1) and could therefore be included in future analysis. This might include, for example, firms involved in areas such as FinTech, RegTech[footnote 5] or Safety Tech[footnote 6]. However, we provide these parameters to avoid duplication and provide DSIT with a health check regarding the overall cyber security market.
There are also businesses operating within the UK that may, for example, resell cyber security solutions (anti-virus, anti-malware, spam filtering etc) through a broader package of managed IT support. As this cyber security spend should be reflected in the revenues of those providing rather than reselling these solutions, we place less focus on the role of resellers within the sectoral analysis (although do include a small number of larger resellers that offer cyber security advisory services and implementation support).
Overall, this process means that the 2,165 firms for analysis within this report have been assessed and verified as providers of cyber security products and solutions. We provide a high-level breakdown of this provision in subsequent chapters. Given the breadth of ‘cyber security’ as a term, we endeavour to be clear regarding what is in scope, what is being measured, and why this matters, for the sector and for the wider economy and society. The following sub-sections set out an overview of the number of companies by size; the breakdown between companies that appear dedicated or diversified; and the products or services provided by each company. For the 2,165 cyber security firms, Figure 2.1 and Table 2.1 demonstrate the breakdown by size.[footnote 7]
Figure 2.1: Number of registered cyber security firms by size
| Large | 213 (10%) |
| Medium | 353 (16%) |
| Small | 397 (18%) |
| Micro | 1,202 (56%) |
Source: Perspective Economics, glass.ai (n = 2,165)
Within the UK, the vast majority of all businesses are Small and Medium Enterprises (SMEs), and it is therefore to be expected that the majority of registered businesses within the cyber security sector are small (18%) or micro (56%) in size.
As this study focuses upon businesses with at least one member of staff, the following comparison is noted between the UK’s cyber security sector, and the broader UK business population. This highlights that, despite the cyber security sector containing a considerable proportion of micro and small businesses, there are many providers of scale operating within the UK market (i.e., 26% of businesses offering cyber security products and services to market are medium or large, compared to c. 3% of all businesses[footnote 8] in the UK).
Comparison of the size of cyber security firms and wider business population
| Size | UK Business Population Estimates (2024) | Percentage | Cyber Sectoral Analysis | Percentage[footnote 9] |
|---|---|---|---|---|
| Large (250+ employees) | 8,250 | <1% | 213 | 10% |
| Medium (50-249) | 37,800 | 3% | 353 | 16% |
| Small (10-49) | 219,900 | 15% | 397 | 18% |
| Micro (1-9) | 1,161,265 | 81% | 1,202 | 56% |
| All Businesses with at least 1 employee | 1,427,165 | 100% | 2,165 | 100% |
Change in Size
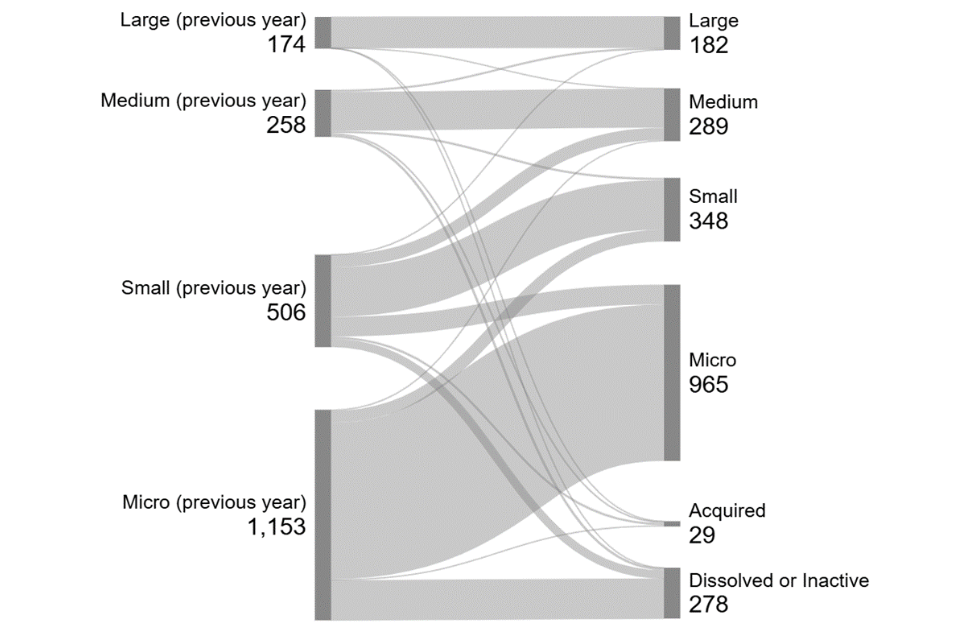
Following last year’s sectoral analysis, we have tracked the performance of each firm (n = 2,091 in the previous study) to understand how the size of cyber security firms has changed (where applicable) in the last 12 months.
The left side of the Sankey diagram (Figure 2.2) shows the size of cyber security firms as identified in the 2024 study, with the right side showing their updated size currently.
The data highlights:
-
An increase in the number of medium-sized firms, likely driven through a combination of organic growth and increased merger and acquisition activity;
-
Increasing levels of dissolution or inactivity among micro and small providers. However, we note that this study methodology has undertaken additional rigorous firm level checks to remove or mark firms as ‘inactive’ that no longer appear to be significantly trading, even if they are marked as ‘active’ with Companies House. For example, this includes the removal of ‘dead’ domain websites, and additional website quality reviews to remove firms without clear active market relevance. As such, this improves the underlying dataset quality; however, results in the removal of ‘lower quality’ domains and entities.
-
Comparing overall size breakdown as a proportion of active cyber security firms between this study and the previous study also suggests a proportional increase in large firms (from 8% to 10%), medium-sized firms (12% to 16%), with smaller firms decreasing from 24% to 18% and micro relatively consistent (55% to 56%) as shown in Figure 2.1.
Figure 2.2: Sankey Flow Chart – Size (2024 Study – 2025 Study)
Source: Perspective Economics (n=2,091)
Dedicated and diversified providers of cyber security products and services
Within this research, we attempt to categorise firms by whether they are either:
-
Dedicated (or ‘pure-play’), i.e., all or most of the business’ revenue or employment can be attributed to the provision of cyber security products or services.
-
Diversified, i.e., some, but typically less of the business’ revenue or employment can be attributed to the provision of cyber security products or services
These classifications are determined by the research team based on review of revenue, employment, and review of all products and services offered by the firm.
Figure 2.3 Dedicated and diversified providers
| Dedicated | 68% |
| Diversified | 32% |
Source: Perspective Economics (n = 2,165)
The rationale underpinning the need to provide this distinction is attributable to seeking to understand how firms either set up to solely provide cyber security, or firms that provide cyber security as one product or service among others vary with respect to size, scale, growth, and market activity.
Within the current dataset, almost three-quarters (68%) of firms are dedicated providers of cyber security products and services. This reflects a limited change from the previous study (71%).
Disaggregating these firms by size (as below in Figure 2.4) also highlights that micro and small firms within this analysis are much more likely to be dedicated (82% and 69% respectively), whereas there are few large dedicated cyber security firms (17%).
In other words, this reflects the tendency for several large and medium sized companies in the UK to establish cyber security practices to complement existing provision, e.g., management consultancies, managed service providers, or telecoms firms developing a cyber security division that sells to the market. This also includes a range of larger diversified firms developing cyber security products or solutions tailored towards markets such as aerospace and defence, critical national infrastructure, and professional services.
Figure 2.4 Dedicated / diversified cyber security firms by size
| Business Size | Dedicated | Diversified |
|---|---|---|
| Micro | 82% | 18% |
| Small | 69% | 31% |
| Medium | 49% | 51% |
| Large | 17% | 83% |
Source: Perspective Economics (n=2,165)
2.3 Products and services provided
To understand the products and services provided by the UK cyber security sector, DSIT and the research team use a taxonomy (as summarised below) to categorise them.
This provides a high-level overview of the UK’s cyber security product and service offer. This taxonomy remains broadly consistent with previous years; however, the underlying keywords and terms have been revisited and updated. Further, the use of web data and manual review means firms can be classified into taxonomy areas through both the text available, and the analyst decision regarding key products and services. This means the following data reflects an interpretation of the key products and services offered. It is therefore indicative of the main solutions provided by the UK cyber security sector.
We take a top-down review of products and services using the text data available through web data review. This study draws on additional text data compared to previous studies; typically reviewing dozens of relevant web pages to ascertain products and services provided. Further, this year’s study has also reviewed products and services in the firm’s own words. The research team has considered over 18,000 products or services mentioned by the c. 2,165 cyber security providers identified.
Taxonomy Definitions:
| Taxonomy Category | Agreed Definition (Short) |
|---|---|
| Cyber professional services | Providing trusted contractors or consultants to advise on, or implement, cyber security products, solutions, or services for others. |
| Endpoint and mobile security | Hardware or software that protects devices when accessing networks |
| Identification, authentication, and access controls | Products or services that control user access, for example with passwords, biometrics, or multi-factor authentication |
| Incident response and management | Helping other organisations react, respond, or recover from cyber attacks |
| Information risk assessment and management | Products or services that support other organisations to manage cyber risks, for example around security compliance or data leakage |
| Internet of Things | Products or services to embed or retrofit security for Internet of Things devices or networks |
| Network security | Hardware or software designed to protect the usability and integrity of a network |
| SCADA and Information Control Systems | Cyber security specifically for industrial control systems, critical national infrastructure, and operational technologies |
| Threat intelligence, monitoring, detection, and analysis | Monitoring or detection of varying forms of threats to networks and systems |
| Awareness, training, and education[footnote 10] | Products or services in relation to cyber awareness, training, or education |
Source: Ipsos, Perspective Economics and Centre for Secure Information Technologies
Additionally, we also classify each company by whether they provide (as their main cyber security offering) products, services, managed security services, or act as a cyber security specific reseller:
-
Cyber security product(s): i.e., the business has developed and sells a bespoke product (hardware or software solution) to the market
-
Cyber security service(s): i.e., the business sells a service to the market e.g., cyber security advisory services, penetration testing etc
-
Provide Managed Security Services: i.e., the business offers other organisations some degree of cyber security support e.g., establishes security protocols, monitoring, management, threat detection etc – typically for a monthly or annual fee
-
Resellers: i.e., the business packages and resells cyber security solutions (usually through licencing agreements)
This approach helps policymakers, industry, and investors understand how many companies there are focusing on a particular subsector of the market or offering new products or solutions accordingly.
Product and service provision
Figure 2.5 sets out an analysis of how many companies appear to be focused upon product or service provision. It is worth noting that there will be some overlap where firms provide both products and services; however, this approach selects one primary category per firm. Overall, analysis of company trading descriptions suggests that over 7 in 10 (71%) of firms are mainly involved in service provision (including managed services and reselling[footnote 11]), and just over 1 in 4 (26%) are mainly involved in cyber security product development. This is consistent with the 2024 study.
Figure 2.5 Number of registered cyber security firms by product/service focus
| Service | 1,273 (59%) |
| Product | 558 (26%) |
| MSSP | 264 (12%) |
| Reseller | 60 (3%) |
Source: Perspective Economics (n = 2,165)
Taxonomy breakdown
Within this study, we have matched company descriptions (in their own words through website analysis) with the key terms within each taxonomy category, followed by a manual and automated check to assign companies to one (or more) taxonomy categories with respect to their product and service provision.
Figure 2.6 is based upon our analysis of trading descriptions.
Figure 2.6 Number of registered cyber security firms by taxonomy offering
| Category | Percentage |
|---|---|
| Information Risk Assessment and Management | 80% |
| Cyber Professional Services | 80% |
| Network Security (including perimeter and application) | 53% |
| Threat Intelligence, Monitoring, Detection and Analysis | 44% |
| Training, Awareness and Education | 42% |
| Incident Response and Management | 36% |
| Identification, Authentication and Access Control | 29% |
| Endpoint Security (including Mobile Security) | 22% |
| IoT (including devices, automotive and connected home) | 10% |
| SCADA and ICS | 6% |
Source: Perspective Economics (n = 2,165)
3. Location of cyber security firms
3.1 Introduction
This chapter explores the registered location (i.e., where each business has located its registered address with Companies House), and the active office locations (i.e., where each business has a trading presence or office across the UK) of cyber security firms.
Understanding the registered and trading addresses of cyber security firms in the UK enables regional analysis and supports the evidence-based identification of notable clusters or hotspots of activity. We have identified 3,132 active office locations for the 2,165 firms identified within this study.
Please note that this number has changed compared to the previous study. This is due to an updated search algorithm which identifies active (and cyber related) office provision and also notes a reduction in the number of active satellite offices. Further, we focus on office locations where these can be attributed to cyber security activity only.
3.2 Location of cyber security firms in the UK
Figure 3.1 sets out the breakdown of firms by number of UK office locations identified in each of the twelve regions. This highlights the importance of identifying local units of activity in the UK (marked in blue below) when seeking to understand regional activity, as registered locations can be skewed towards London and the South East.
Overall, the data suggests that just under half (45%) are based outside of London and the South East regions. Further exploration of regional office data suggests no significant proportional changes at the regional level (proportional to overall size of the UK market).
Figure 3.1 Percentage of cyber security firms by location
| London | 38% |
| South East | 17% |
| North West | 8% |
| South West | 8% |
| East of England | 7% |
| Scotland | 6% |
| West Midlands | 5% |
| Yorkshire and the Humber | 4% |
| East Midlands | 3% |
| North East | 2% |
| Wales | 2% |
| Northern Ireland | 2% |
Source: Perspective Economics (n=3,132)
Active (local offices)
Figure 3.2 also highlights the number of active offices by Travel to Work Area (TTWA)[footnote 12], and emphasises sustained hotspots in areas such as Greater Manchester, Bristol and Bath, Cheltenham, Belfast, Glasgow, Edinburgh, and Newcastle.
Figure 3.2 Active cyber security offices by travel to work area (TTWA)
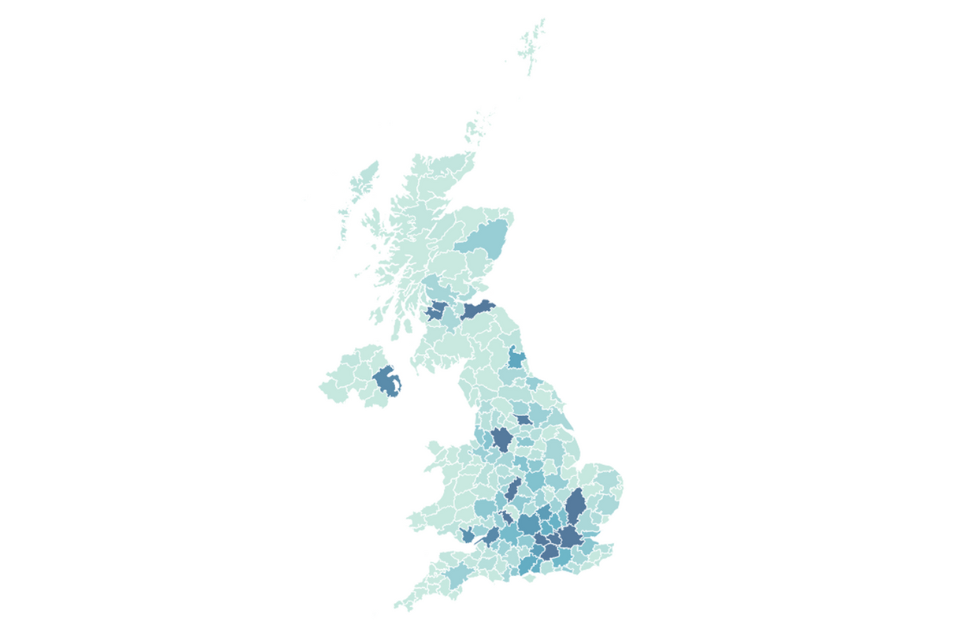
Source: Perspective Economics (n=3,132) (Darkest blue denotes any TTWA with >50 active offices)
3.3 International activity
This section outlines where UK registered cyber security firms have an established physical presence in another country. This helps to inform a further understanding of where firms are exporting, are engaged in international markets, or where multinational firms have a presence in the UK. For the 2,165 providers of cyber security products and services, we have identified:
-
316 UK-headquartered cyber security businesses with a physical presence in international markets (denoted by an office presence); and
-
A further 260 cyber security businesses active in the UK appear to be headquartered or originate from outside the UK
For the 316 UK-headquartered cyber security businesses, the following chart sets out the main trading regions (totalling to more than 100%, since firms have offices across multiple locations):
Figure 3.3 Regions with an international presence (by UK-headquartered cyber security firms)
| Country/Region | Percentage |
|---|---|
| European Union / EEA | 52% |
| United States | 43% |
| Australia | 13% |
| India | 11% |
| United Arab Emirates | 9% |
| South Africa | 7% |
| Singapore | 7% |
| Canada | 6% |
| Malaysia | 3% |
| Japan | 2% |
Source: Perspective Economics (n = 316)
As with previous years, the United States and European Union / European Economic Area are core markets for international trading[footnote 13]. In recent years, the UK has also been a clear international destination for foreign direct investment (FDI) in cyber security. We have also identified where international firms (n = 260) have set up a physical presence in the UK (related to cyber security). We find that key nations (by count) continue to include the US, Israel, France, Germany, Australia and Ireland.
4. Economic contribution of the UK cyber security sector
4.1 Estimated revenue
In the most recent financial year, annual cyber security revenue within the sector is estimated at £13,234 million (rounded to £13.2 billion). This reflects an increase of 12%[footnote 14] from last year’s study (£11.9 billion).
This figure is estimated using:
-
Revenue figures available for dedicated (100%) cyber security firms that publish annual accounts
-
Revenue figures available for diversified cyber security firms (multiplied by the estimate of the proportion of the firm’s activity related to cyber security)
-
Estimated cyber security revenue within the cyber sector survey (for the most recent financial year)
-
Where gaps exist, employment has been sourced or estimated, with revenue estimated using ‘revenue per employee’ (estimated by size using known data) multiplied by ‘number of employees’ to provide an estimated revenue figure on a firm-by-firm basis.
This revenue estimate relates to revenue attributable to cyber security activity only. The following subsections set out revenue by size, revenue by size and dedicated/diversified categorisation, and revenue by key company offer. Please note that as the analysis was undertaken in late 2024, we use the most recent financial year reporting data where possible, which means that much of the revenue will have been achieved through work delivered and billed in 2023 (e.g., if a company has a financial year ending March 2024, those accounts will reflect billed work from April 2023 – March 2024).
Revenue by firm size
We estimate that three-quarters (£9.3 billion, 70%) of all UK cyber security revenue is earned by large firms (which further demonstrates the earning power of these firms given that they reflect 8% of all market providers). This includes several very large firms in telecommunications, aerospace, defence and security, and consultancies for which the size and scale of their respective cyber security product and service divisions reflect a considerable proportion of the wider market.
Medium firm revenues have increased their revenue share in relative and absolute terms, increasing from a previous revenue share of 16% to 21%, with a notable increase from £1.9bn to £2.8bn in the last twelve months. Small firms have continued to see a slight reduction in revenues over this period (from £862m to £790m), whereas micro firms have increased revenue levels (from £262m to £394m).
Overall, the more limited net increase in the number of cyber security firms in this year’s study, combined with increased revenue among medium firms, suggests that there has been increasing levels of market consolidation, with smaller firms merging to form unified offerings (typically as medium-sized firms), in addition to larger and medium-sized firms acquired smaller specialist providers (e.g. enhancing capabilities in areas such as penetration testing and expanding the range of managed security services).
Figure 4.1: Total cyber security revenue by size of firm
| Size | Revenue |
|---|---|
| Large | £9,271M |
| Medium | £2,780M |
| Small | £790M |
| Micro | £394M |
Source: Perspective Economics (n=2,165)
Segmentation of revenue by both size and by whether the firm is understood to be ‘dedicated’ or ‘diversified’ also provides an interesting overview of which firms are driving the revenue within the sector.
This highlights that ‘diversified’ firms continue to generate significant revenues through their cyber security offer. However, for Small and Medium Enterprises (SMEs), dedicated cyber security firms generate the greatest proportional revenue (i.e., c. 86% of revenues for each of the SME categories).
Figure 4.2: Total cyber security revenue by size by dedicated / diversified status
| Size | Dedicated | Diversified |
|---|---|---|
| Large | £4,706m | £4,565m |
| Medium | £2,406m | £374m |
| Small | £698m | £92m |
| Micro | £318m | £76m |
Source: Perspective Economics (n = 2,165)
This suggests that the UK market remains home to:
-
Approximately 28 (up from 20 last year) ‘anchor’ large and diversified firms, which are estimated to generate over £50 million each in cyber security revenues. This can often be a very small proportion of the firm’s revenues (often in £ billions) but reflects a significant proportion of the UK’s cyber sector
-
A significant ‘dedicated’ and growing middle market: There are now 219 firms (a substantial increase from 105 last year) that we have identified as dedicated providers of cyber security with over £10 million in annual revenues
Finally, segmentation of revenues by size and by those companies that either provide (as a core role) cyber security products, services, managed security services, or resell (set out in Figure 4.3) also provides some useful insight.
Overall, service providers (including Managed Service Providers (MSPs) and Managed Security Service Providers (MSSPs)) are generating approximately £7.4 billion in cyber security related revenues (up from £6.2bn last year).
The revenue of product companies has increased slightly to c. £5.6 billion (up from £5.5bn last year).
Figure 4.3: Total cyber security revenue by size and by offering
| Offering type | Large | Medium | Small | Micro | Total |
|---|---|---|---|---|---|
| Service | £4,772M | £1,014M | £409M | £240M | £6,295M |
| Product | £3,958M | £1,296M | £266M | £110M | £5,620M |
| MSSP | £371M | £419M | £112M | £35M | £890M |
| Reseller | £170M | £50M | £3M | £9M | £200M |
Source: Perspective Economics (n = 2,165)[footnote 15]
4.2 Estimated employment
We estimate that there are 67,299 Full Time Equivalents (FTEs) working in a cyber security related role across the 2,165 cyber security firms identified. Please note that this figure only relates to the number of estimated FTE cyber security professionals working within cyber security sector firms.
This reflects an increase of 11% (up from 60,689 last year) in employee jobs within the last 12 months. This growth is higher than the rate seen in the previous study (5%), but consistent with that of previous years (typically 8 – 12% per annum) and reflects growth with the sector with respect to employment levels.
However, we emphasise that the cyber security sectoral workforce is only one part of the wider UK cyber security workforce. As such, employment growth within the cyber security sector may also reflect some displacement and movement within the broader workforce (e.g. individuals moving from a cyber security role outside of the ‘cyber sector’ such as a large retailer, into a firm that offers cyber security products or services). This is explored further in the DSIT Cyber Security Skills in the UK Labour Market (2025) report.
Company level employment is initially estimated at the registered level (i.e., this suggests concentrated employment within Greater London and the South East is 72% of the UK figure). However, as this reflects employment at a registered level, this has the effect of underestimating employment for the other regions, whereby employers have employees across the UK. As such, in Figure 4.4, we provide the estimated ‘actual’ employment breakdown by region. This estimate draws upon Perspective Economics modelling[footnote 16] of key regional employers.
Figure 4.4: Estimated cyber security employment by region
| Region | Estimated | Registered |
|---|---|---|
| London | 30% | 45% |
| South East | 13% | 27% |
| North West | 10% | 7% |
| South West | 9% | 5% |
| West Midlands | 7% | 3% |
| Scotland | 7% | 2% |
| Yorkshire and The Humber | 6% | 2% |
| East of England | 5% | 6% |
| Northern Ireland | 4% | 1% |
| Wales | 3% | 1% |
| East Midlands | 3% | 1% |
| North East | 3% | 1% |
Source: Perspective Economics (n = 67,299 FTEs, estimate. Navy denotes ‘estimated true employment’ and teal is registered-level employment)
Analysis of estimated cyber security employment by company size (Figure 4.5) demonstrates that, in line with last year’s findings, most cyber security employment remains concentrated within large firms (65%).
The average size of a cyber security related team has increased slightly since last year’s study, from 29 staff to 31 staff.
Figure 4.5: Estimated cyber security employment by size of firm
| Size | Number of FTEs |
|---|---|
| Large | 43,368 |
| Medium | 15,685 |
| Small | 5,377 |
| Micro | 2,869 |
Note: Large = 43,368 (Average: 204, Median: 45); Medium = 15,685 (Average: 44, Median: 30); Small = 5,377 (Average: 14, Median: 13); Micro = 2,869 (Average: 2, Median: 1)
Source: Perspective Economics (n=67,299)
Figure 4.6 sets out employment segmented by ‘Dedicated’ and ‘Diversified’ firms. This suggests that in the most recent twelve months, despite softened employment growth across the wider cyber security sector – most of the employment growth has taken place within ‘diversified’ firms e.g., wider consultancies – with diversified employment share increasing from 39% to 41% in the past year.
Figure 4.6: Estimated cyber security employment by dedicated / diversified
| Category | Number of FTEs (% of Total) |
|---|---|
| Dedicated | 39,761 (59%) |
| Diversified | 27,538 (41%) |
Source: Perspective Economics (n=67,299)
Figure 4.7 also sets out cyber security related employment segmented by company core offering. Just under two-thirds (62%) of employees work within a company that primarily offers cyber security services or managed services, compared to 36% that work primarily within a product environment.
In previous years, the number of cyber security staff working within product companies had largely experienced an upward trend from 15,278 (2021 report, 33% of cyber security staff) to 23,153 (2024 report, 38%). However, this has broadly stabilised in this year’s study to 23,952 FTEs (+3%).
This means that most of the employment growth within the cyber security sector within the last twelve-month period of reporting has been seen within service based firms (with service and MSSP related cyber security employment increasing from an estimated 37,070 FTEs to 42,232 FTEs (+14%) in this time period.
Figure 4.7: Estimated cyber security employment by offering
| Sector | FTEs |
|---|---|
| Service | 37,272 |
| Product | 23,952 |
| MSSP | 4,960 |
| Reseller | 1,115 |
Source: Perspective Economics (n=67,299)
4.3 Estimated Gross Value Added (GVA)
Gross Value Added (GVA) is used as a measure of productivity (at a firm level, or above). It captures the sum of a firm’s Gross Profit, Employee Remuneration, Amortisation and Depreciation. In this respect, any increase in GVA can highlight an improvement in the performance of a firm or a sector, as evidenced through higher profitability or enhanced earnings.
We estimate that within the most recent financial year, cyber security related GVA (for the 2,165 firms) has reached £7.8 billion (£7,820m). This is a significant increase of £1,370m (+21%) since last year’s report.
Figure 4.8 sets out an overview of GVA (compared to revenue) by size of firm.
Overall, this data suggests an increased GVA-to-turnover ratio of 0.59:1 (i.e., for every £1 of revenue the sector generates, 59p in direct GVA is generated, compared to 54p last year and 60p in the prior year).
Table 4.2 also sets out the estimated GVA per employee at £116,200 per employee. This is an increase of 8% from the previous year’s estimate of £107,400). GVA per employee provides an estimate of labour productivity in the sector, as it typically captures remuneration and profitability.
Figure 4.8: Total cyber security revenue and GVA by size of firm
| Size | Revenue | GVA |
|---|---|---|
| Large | £9,271M | £5,373M |
| Medium | £2,780M | £1,730M |
| Small | £790M | £507M |
| Micro | £394M | £210M |
Time-series analysis
The table below sets out the key metrics for the cyber security sector, as tracked by each sectoral study since 2017. Green denotes strong growth (year-on-year), and amber denotes softer growth (<5%).
Table 4.1: Key sector metrics (since 2017)
| Year | Number of Firms | Change | Employment | Change | Revenue | Change | GVA | Change | Investment (Dedicated) | Change |
|---|---|---|---|---|---|---|---|---|---|---|
| 2017 | 846 | 44% | 31,339 | 37% | £5,682m | 46% | £2,349m | 61% | £238m | 28% |
| 2019 | 1,221 | 42,855 | £8,293m | £3,774m | £305m | |||||
| 2020 | 1,483 | +21% | 46,683 | +9% | £8,878m | +7% | £4,003m | +6% | £821m | +169% |
| 2021 | 1,838 | +24% | 52,727 | +13% | £10,146m | +14% | £5,326m | +33% | £1,013m | +23% |
| 2022 | 1,979 | +8% | 58,005 | +10% | £10,462m | +3% | £6,228m | +17% | £302m | -70% |
| 2023 | 2,091 | +6% | 60,689 | +5% | £11,859m | +13% | £6,450m | +4% | £271m | -10% |
| 2024 | 2,165 | +4% | 67,299 | +11% | £13,234m | +12% | £7,820m | +21% | £206m | -24% |
| Estimated CAGR (2017 – 23) | +14% | +12% | +13% | +19% |
4.4 Summary
The table below sets out the key findings regarding the economic contribution of the UK’s cyber security sector.
Table 4.2: Summary of cyber sector economic contribution
| Size | Number of Firms | Estimated Revenue (Cyber Security Related) | Estimated GVA (Cyber Security Related) | Estimated Employment (FTE) (Cyber Security Related) | Estimated Revenue per employee | Estimated GVA per employee |
|---|---|---|---|---|---|---|
| Large | 213 | £9,271m | £5,373m | 43,368 | £213,772 | £123,896 |
| Medium | 353 | £2,780m | £1,730m | 15,685 | £177,246 | £110,301 |
| Small | 397 | £790m | £507m | 5,377 | £146,850 | £94,327 |
| Micro | 1,202 | £394m | £210m | 2,869 | £137,174 | £73,118 |
| Grand Total | 2,165 | £13,234m | £7,820m | 67,299 | £196,647 | £116,200 |
Source: Perspective Economics
5. Investment in the UK cyber security sector
5.1 Introduction
This section draws upon the Beauhurst platform which tracks announced and unannounced investments in high-growth companies from across the UK. Our team has matched Company Registration Numbers and Company Names identified within this current analysis with the platform to identify 1,088 fundraisings[footnote 17] associated with 525 tracked companies. In other words, approximately 1 in every 4 firms identified within our analysis has received some form of external investment or fundraising since incorporation.
This chapter focuses on investment activity within the full year of 2024 (1st January – 31st December), and typically explores investment raised by dedicated cyber security firms.
5.2 Investment to date
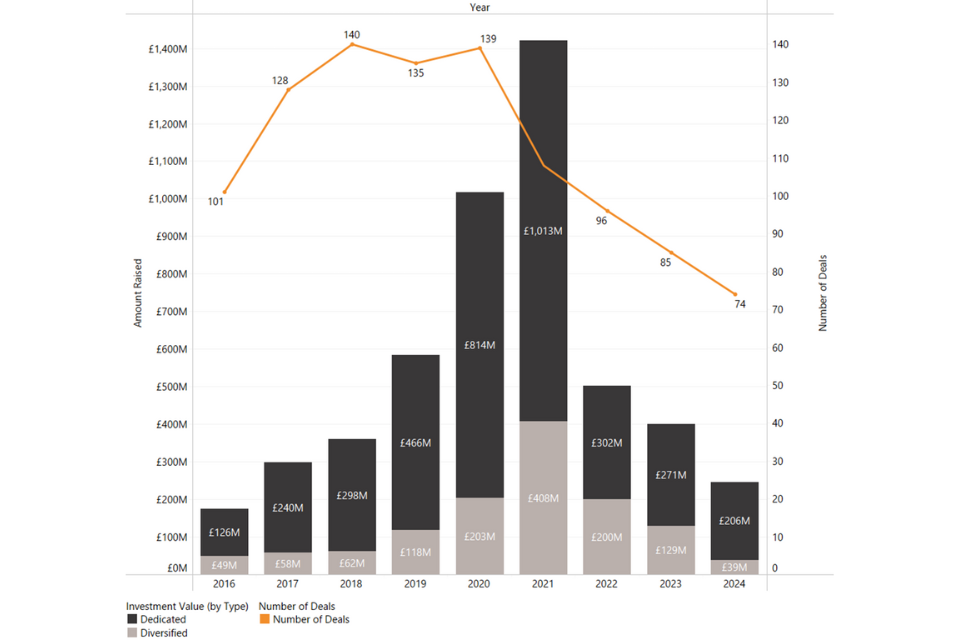
The investment timeline (Figure 5.1) demonstrates that 2024 has remained challenging for cyber security investment compared to previous years. The investment data highlights that cyber security firms (dedicated and diversified) raised approximately £245m in 2024 across 74 deals.
This includes £206 million raised across 59 deals within dedicated cyber security firms, which we focus on subsequently.
Between 2019 – 2021, external investment in dedicated cyber security companies reached record figures, particularly in 2020 and 2021, with £814m raised and £1,013m raised respectively. However, these high levels were arguably due to wider macroeconomic conditions such as low interest rates, and high demand for investment into technology sectors such as cyber security and AI.
In 2020 and 2021, there were several very large investment rounds raised by some dedicated cyber security firms in the UK, with firms such as Snyk raising over £400 million through Series F, OneTrust raising a Series C investment, and Immersive Labs raising over £53 million. This resulted in high levels of sectoral investment at the aggregate level. This data is also highly subject to variation, as a small number of very large investments can significantly impact quarterly and annual trends.
Since 2022, external investment into private firms has reduced across sectors, as interest rates have risen, and as firm-level valuations have been revised. The Beauhurst Equity Investment Update[footnote 18] highlights that, for example, the amount raised by UK private companies across all sectors in H1 2024 (£6.5bn) is 52% lower than that raised in H1 2022 (£13.5bn).
Within the previous sectoral analysis the research team noted the UK cyber security investment landscape is broadly similar to 2018/19 levels, which may reflect a ‘return to normal’, rather than a significant loss of investor confidence or engagement. Further, as explored in Section 5.6, there is wider investment activity in the UK market beyond Venture Capital e.g. mergers, acquisitions, loan and equity funding.
As shown in Figure 5.1, investment levels into the UK cyber security sector have reduced compared to 2023 levels. There has been a reduction in overall amount raised by UK dedicated cyber security firms (reducing from £271m in 2023 to £206m in 2024, a decrease of 24%).
Dedicated deals have also reduced slightly (from 71 to 59, a decrease of 17%), and the overall number of deals (including diversified cyber firms) has reduced from 85 to 74 (a decrease of 13%).
Figure 5.1: Total external investment
Source: Beauhurst
5.3 Investment by location
Figure 5.2 sets out an overview of investment performance within cyber security by UK region, with respect to value and volume of investment.
The 2024 data highlights that, for the first time, the highest proportion of external investment was in the North West (49%) with six deals to the value of £102m. This is largely due to the c. £88m raised by Cheshire-based web application security firm PortSwigger[footnote 19], as well as firms such as CultureAI, Cytix, CloudGuard, and Zally. This is followed by the South East (21%), and London (14%).
London and the South East collectively account for 30 deals (51% of the UK total), but moving beyond investment values, and exploring by volume of deals highlights an encouraging landscape in areas such as the South West (6 deals worth £10.6m), West Midlands (4 deals worth £2.6m), and Yorkshire and the Humber (3 deals worth £5.3m). Areas such as Scotland, the North East, Northern Ireland, and East Midlands have seen fewer VC deals; however, wider merger and acquisition and private equity activity has taken place in these regions as explored in Section 5.6.
Increasing access to investment, in all forms, across the regions is a key tenet of national cyber security and economic strategy to support regional start-ups to scale and grow. In 2024, 49% of the investment raised was across the ten regions outside of London and South East. This is a higher proportion than seen in 2023 (35%), 2022 (25%), and much higher than the 9% in 2021.
This is encouraging from a regional perspective, as it suggests increased investor activity across the regions. Further, despite lower levels of aggregate investment and continued challenges regarding regional growth, 2024 continued to ensure that all UK regions had at least one cyber security VC deal undertaken. This continues to highlight the emergent impact of regional schemes such as Cyber Runway as well as regional clusters in supporting promote and broker investment across the regions.
Figure 5.2: Total investment (value and volume, 2024)
| Region | Amount Raised | Deals |
|---|---|---|
| North West | £101.5M | 6 |
| South East | £43.1M | 10 |
| London | £28.4M | 20 |
| South West | £10.6M | 6 |
| Yorkshire and The Humber | £8.4M | 3 |
| Wales | £5.3M | 3 |
| East of England | £2.9M | 1 |
| West Midlands | £2.6M | 4 |
| Scotland | £2.1M | 2 |
| North East | £0.9M | 2 |
| Northern Ireland | £0.2M | 1 |
| East Midlands | £0.1M | 1 |
Source: Beauhurst (59 deals)
5.4 Investment by size
Figure 5.3 sets out the volume of investment by company size within the cyber security sector in 2024.
Figure 5.3: Total investment by company size (2024)
| Company size | Investment value (£million) |
|---|---|
| Medium | £142m (69%) |
| Small | £35m (17%) |
| Micro | £29m (14%) |
This data suggests that in 2024:
-
Medium sized firms (50-249 employees) have raised £142 million (69%) across 11 deals
-
Small firms (10-49 employees) have raised £35 million (17%) across 24 deals
-
Micro firms (1-9 employees) have raised £29 million (12%) across 24 deals
Whilst investment values have fallen overall, the data suggests that there are some signs of resilience and interest in early-stage investment, there remains a strong requirement among VCs and some seed investors for firms to demonstrate recurrent revenue streams prior to investment.
5.5 Investor views
Across the five investor consultations undertaken by Ipsos in late 2024, investors were also asked about their main criteria for investing in cyber security businesses in the UK, the role of AI in cyber security, their view on the UK as a ‘destination’ for cyber security investment (including regional and national considerations), changes over the last year and how they expect the landscape to develop, and any other feedback on where additional support would help to catalyse further investment. We set out some key feedback below. Please note that this is a small sample, covering indicative sentiment. It is not considered representative of the full investment community but does provide some insight into key areas.
Market outlook and investment criteria:
Investors expressed strong confidence in the sector’s growth potential, particularly given increasing digitalisation and evolving threat landscapes. The intersection with emerging technologies like AI and quantum computing has heightened investor interest. However, investors emphasised the importance of finding companies with differentiated products and efficient scaling potential.
“We’re very bullish on the growth for cyber security. Cyber security is not going away. More and more things are being done online, everything is becoming digital. AI is starting to change the world and that’s going to lead to security issues and the need for security around all of that new infrastructure. We think that there’s going to be a huge number of very attractive companies to continue to invest in for years to come.”
– Venture capital investor
“I’m very bullish about the need for cyber security and the growing need for cyber security across all spectrums of business and consumer life. That’s not really something we have to think very hard about. The question is just finding companies that meet our thesis. Can we find companies that have a differentiated product, but also a path to scaling efficiently?”
– Venture capital investor
Innovation pipeline and early-stage support
Universities were highlighted as critical components of the UK’s cyber security investment landscape. The quality of academic research and ability to spin out companies were seen as key drivers of the investment pipeline. However, investors noted that additional early-stage funding is needed to commercialise research and encouraged more support for angel investors in the cyber security sector.
“There’s a lot of good academic research done in the UK. I think probably outside of the US and Israel, we’re a leader on a global scale in terms of the sector.”
– Venture capital investor
“The amount of investment that’s available for early stage, I think that’s going to be key to unlocking the growth because that’s what gets research out of the lab or out of the academic institutions and into startups that can grow. There are loads of fantastic research that just never really sees the light of day that we need to start to unlock. There’s not enough early-stage VC money. In terms of the pitch decks that I see, the typical asks for the first pre-seed raise can be as high as a million, half a million. That’s a lot of angels you’ve got to get together to syndicate and build conviction to achieve that.”
– Angel investor
Government role and market development
The government’s role in supporting the cyber security ecosystem through incubators and accelerators was highly regarded. Investors valued the networking opportunities these initiatives provide, enabling connections with early-stage startups and other investors. Some suggested the government could take a more active role as a preferred buyer of security solutions from early-stage companies, similar to an approach adopted in the United States.
“The UK government has been great… they have the incubators, accelerators, the focus on non-dilutive sources of capital for companies when they’re at very early stages. I think that will continue to play a big role.”
– Venture capital investor
“The more that the UK government can support the whole ecosystem right from the very start, those at the academic level, the companies coming right out, [the better]. I know there are a number of programmes where they are either investing directly or helping support us. The UK is in a great position to play a huge role in cyber, but it needs to be a focus.”
– Venture capital investor
Market challenges and funding environment
The investment landscape has faced uncertainty, with investors discussing macroeconomic and policy factors. Some investors advocated for more strategic deployment of grant funding, particularly focusing on initial product development or commercial progress.
“We’ve seen it with our portfolio, grant funding at the wrong time can actually end up distracting and damaging the ultimate success of the business…so ensuring that grant funding is funnelled in such a way that it supports either initial product development or commercial progress.”
– Venture capital investor
Regional development and investment distribution
Stakeholders have noted a shift in regional investment patterns (as demonstrated in the investment data), with activity extending beyond London, particularly among university spin-outs in regions such as the North West, Yorkshire, South West, and Scotland, supported by increased regional funding and ecosystem development. Factors such as hybrid working and lower operating costs outside London have also been considered to have contributed to this trend.
“My impression now is that Manchester has a really thriving cyber scene. We’re beginning to see a few things out of Leeds as well. And the South West as well. A lot of companies based around Cheltenham. There is still a slight skew towards the Golden Triangle, but it’s a far more balanced dynamic than it was five years ago.”
– Venture capital investor
“I’d say it’s better joined up and there’s better awareness of the regional specialities and the capabilities in each part of the UK. Certainly, from an investment perspective, it still feel like there’s a very London-centric investment landscape.”
– Angel investor
International positioning
Investors highlighted the importance of government support in showcasing the UK’s cyber security capabilities, particularly in emerging areas like AI security management. This was seen as crucial for attracting international investment and attention.
“If the UK government can market there’s a cluster of world leading companies around AI security management, the rest of the world sits up and takes notice and it makes it easier for the companies to get investment.”
– Venture capital investor
5.6 Wider investment in cyber security
Whilst venture capital investment provides a useful tracker for market development, the cyber security sector has demonstrated wider investment activity through other forms. This section explores the role of private equity, mergers and acquisitions, public markets, and strategic partnerships. We set out some examples of key investments identified in 2024 below.
Private equity and growth capital
Private equity continues to play an important role in market development, particularly in consolidating and scaling established cyber security providers. Globally, according to Capstone Partners research[footnote 20], cyber security merger and acquisition activity is estimated to have experienced recovery in 2024 compared to 2022 and 2023, with an estimated 226 announced or completed transactions (+13.6%) in H1 2024.
-
One of the most significant transactions included Thoma Bravo’s all-cash acquisition of Darktrace[footnote 21] for $5.3bn. This follows their acquisition of Sophos for $3.8bn in 2020.
-
In June 2024, Edinburgh-based Quorum Cyber announced a significant growth investment for Charlesbank Capital Partners[footnote 22], to help ‘accelerate its growth strategy, including through talent recruitment and expanding its services to its global customer base. This has resulted in rapid expansion, with Quorum Cyber announcing their acquisition of Difenda (a Canada-based Microsoft Solutions Partner for Security) in September 2024, followed by further acquisition of Kivu Consulting in December 2024, a global incident response practice.
-
In 2022, managed service provider Acora announced a minority investment with LDC, the private equity arm of Lloyds Banking Group[footnote 23]. Since 2022, they have acquired firms such as Secrutiny (in early 2022) and Infosec Partners (May 2023)[footnote 24], and in September 2024, they announced the acquisition of Elastacloud, a leader in data science and artificial intelligence. This is expected to create a combined group of approximately 1,000 staff[footnote 25] globally.
Mergers, acquisitions and rebrands
As covered in Section 2.2 and within the qualitative findings, 2024 has seen a number of domestic mergers, acquisitions, rebrands and expansions. This is often driven by the need for customers to have access to a wide range of capabilities from managed providers, and a push for market growth, particularly among mid-market firms. We set out some examples below:
-
In July 2024, KnowBe4, a Florida based provider of security awareness training, announced the acquisition of Egress. They reported that the ‘addition of Egress’ cloud email security solution to KnowBe4’s comprehensive product suite would create an advanced AI-driven cybersecurity platform for managing human risk’.[footnote 26]
-
In July 2024, Intragen, a European Identity and Access Management (IAM) consultancy announced the acquisition of UK-based identity management specialist Atlas Identity[footnote 27].
-
In August 2024, Nortal, a global strategic innovation and technology company headquartered in Estonia, acquired 3DOT Solutions[footnote 28], a UK cyber security consultancy and a certified supplier to the UK Armed Forces and Intelligence Services. Nortal plans to strengthen its UK footprint and increase its cyber security and defence business.
-
In October 2024, Instil announced it had bought cyber security consultancy Vertical Structure[footnote 29] in an acquisition which “will see two of Northern Ireland’s leading technology firms join forces”.
These deals highlight a wider investment landscape where different forms of capital and commercial partnerships can support growth and expansion of the UK cyber security sector. The continued interest from international investors and strategic buyers, combined with domestic consolidation activity, indicates sustained confidence in the UK cyber security sector’s growth potential.
However, the data does highlight a range of international acquisitions of UK cyber security firms, particularly by US investors, which may raise important considerations for long-term market development. While such investment demonstrates the quality and attractiveness of the UK cyber sector, it demonstrates a clear need to support early-stage firms at the start of the growth pipeline and the delivery of infrastructure to help UK firms scale domestically and secure capital.
This is particularly important given the strategic nature of cyber security capability and the need to maintain sovereign capacity in key technology areas. This highlights the continued need for policy to help strengthen domestic growth pathways while maintaining the benefits of attracting international investment, collaboration, and market access.
6. Supporting growth of the sector
6.1 Introduction
This section sets out some of the current initiatives within the UK that support the growth of the cyber security sector. In addition, the Ipsos survey (n = 209) asked cyber security businesses about their key challenges, collaborations, and export activity. The research team also carried out six consultations with cyber security investors to explore their views on the health and potential of the cyber security sector in the UK. This section explores these key findings.
6.2 Recent investments and support initiatives
The National Cyber Strategy 2022 sets out how the government has sought to support the growth of the cyber security sector, through a blend of direct investment in accelerators and growth initiatives, skills and profession support, investment in regions and clusters, and as a key buyer of cyber security products and services. Some of these initiatives are summarised below:
Growing the sector and exports, and promoting regional growth:
-
Helping cyber businesses find international markets. The UK exported £7.2 billion of cyber services in 2023. Section 6.4 explores export activity among UK cyber security firms identified through the business survey
-
Running Cyber Exchange, a portal for cyber security businesses across all regions of the UK:
-
The UK Cyber Cluster Collaboration (UKC3) is building partnerships between industry, academia, and local government to ensure opportunities and expertise are available across the regions, with over 18 accredited regional clusters across the UK
Supporting businesses to grow and scale:
-
Running initiatives such as NCSC for Startups to help address some of the most important strategic challenges in cyber security
-
Providing funding for schemes such as Cyber Runway, which supports innovators to launch, grow and scale their business – building on the success of LORCA, HutZero, Cyber101 and the Tech Nation Cyber Programme, and supporting academic commercialisation through the Cyber Security Academic Startup Accelerator Programme (CyberASAP).
Encouraging new entrants into the cyber security sector to help tackle the skills gap:
-
The CyberFirst bursary scheme supports undergraduate students and is delivering hundreds of individuals, with work experience, into the cyber workforce every year
-
The CyberFirst courses, Discovery, and Cyber Explorers programmes have engaged hundreds of thousands of young people aged 11-17 in the last five years
-
There are now several cyber apprenticeship standards that have been designed by industry and three cyber offerings for initial learning outcomes offered through the DfE ‘Courses for Jobs’ initiative
-
DSIT has also funded the ‘Upskill in Cyber’ programme, delivered by SANS Institute, which has supported hundreds of individuals to be trained and certified in cyber security pathways.
Professionalising the cyber security workforce:
-
The UK Cyber Security Council is a world-first professional authority for cyber security. It sets clear and consistent professional standards, and in October 2023, it recognised the first cohort of over 100 practitioners as ‘Chartered Cyber Security Professionals’.
-
The Cyber Security Body of Knowledge (CyBOK) informs and underpins education and professional training for the cyber security sector
These initiatives continue to help address a range of barriers faced by cyber security businesses. Within this year’s study, survey respondents were asked the extent to which the following barriers impacted their business to some or a great extent (as shown in Figure 6.1).
Figure 6.1 Barriers reported by cyber security businesses
| Challenge | Percentage |
|---|---|
| A lack of candidates in the labour market that have the technical cyber security skills that you need | 47% |
| Salary demands of candidates not being affordable | 46% |
| Competition for candidates from other businesses in the cyber sector | 39% |
| Your existing employees lacking non-technical skills, such as communication, leadership, management or sales and marketing skills | 33% |
| A lack of candidates in the labour market that have non-technical skills, such as communication, leadership, management or sales and marketing skills | 32% |
| Your existing employees lacking the technical cyber security skills that you need | 28% |
| Competition for candidates from other businesses outside the cyber sector | 22% |
| Staff moving jobs or retiring | 19% |
Source: Ipsos (n = 209) Percentage of businesses reporting barriers “to a great extent / to some extent”
These barriers show some notable changes compared to the previous year, with decreases across most areas, suggesting a slight easing of recruitment pressures in the sector for some firms. This shift appears to be driven by a combination of workforce adjustments (including some firms reducing headcount despite overall sector growth) and potentially increased supply of talent (as explored in the Cyber Skills research):
-
Competition for candidates within the cyber sector has decreased significantly (from 49% to 39%)
-
Salary demands remaining not affordable has stayed relatively stable (from 47% to 46%)
-
The lack of candidates with technical skills remains a top concern among employers at 47% (unchanged from last year)
-
Existing employees lacking non-technical skills has remained largely stable (from 34% to 33%)
-
Candidates lacking non-technical skills has slightly decreased (from 34% to 32%)
-
Existing employees lacking technical skills has shown a small increase (from 26% to 28%)
-
Staff moving jobs or retiring has decreased significantly (from 29% to 19%)
Competition for candidates from outside the cyber sector also suggests a downward trend, falling further (from 41% in 2022, to 31% in 2023 to 22% this year). This broader reduction in recruitment pressures, particularly around competition and staff movement, suggests a market adjusting to new workforce dynamics, though wider challenges around technical skills availability remain persistent.
6.3 Sector engagement
In the business survey, 86% of cyber security businesses said they engaged with at least one other type of organisation, with 63% engaging with another cyber security business, 50% attending meetup events, 37% engaging with a university or higher education provider, and 38% engaging with other public sector bodies. These engagement levels remain strong, similar to last year.
There is also notable regional engagement, with 35% of businesses reporting that they engage with regional Cyber Security Clusters and 31% with regional Cyber Resilience Centres, highlighting the importance of local and regional networks. This is summarised in Figure 6.2 below.
Figure 6.2 Businesses that collaborated with at least one of the following organisations in a cyber security activity:
| Organisation | Percentage |
|---|---|
| Any other cyber security businesses | 63% |
| Any Meetup events | 50% |
| Any other public sector bodies | 38% |
| A university or other higher education provider | 37% |
| A regional Cyber Security Cluster | 35% |
| A regional Cyber Resilience Centre | 31% |
| A Local Enterprise Partnership or Regional Economic Development Agency | 25% |
| Any other organisations | 5% |
| Networking/consortium | 3% |
| Certification bodies | 3% |
| Charities/not for profit | 2% |
| Private sector/businesses | 1% |
| None of these | 14% |
Source: Ipsos (n = 209)
6.4 Cyber security exports
In January 2025, the Department for Business & Trade published the updated UK Security Export Statistics (2023). This suggests that UK cyber security exports have grown from approximately £6.1 billion in 2022 to £7.2bn in 2023 (increased by c. 18%).
Within this year’s sectoral survey, cyber security businesses were asked if they exported, and if so, what and to which regions. In Figure 6.3, just under two-fifths (36%) reported that they exported products or services, of which the majority exported to the European Union (77% of exporters), and North America (57% of exporters). These levels are broadly similar to last year’s findings.
Figure 6.3 Export regions (for businesses that export)
| Region | Percentage |
|---|---|
| The European Union | 77% |
| North America | 57% |
| Asia-Pacific, including East Asia, South Asia, Southeast Asia, Australia and New Zealand | 40% |
| Wider Europe, outside the European Union (including Israel) | 36% |
| The Gulf states, including Bahrain, Iraq, Kuwait, Oman, Qatar, Saudi Arabia, the United Arab Emirates and Yemen | 25% |
| Africa | 19% |
| Central or South America | 13% |
Source: Ipsos, n = 75 out of 209
6.5 Public procurement
Public procurement plays a crucial role in the health of the cyber security sector, and for improving public sector engagement with innovative cyber security start-ups and techniques. This includes where cyber security firms can sell products, services, and solutions to public sector buyers such as central and local government, law enforcement and policing, NHS, schools etc.
In previous years, we have used Tussell data to identify cyber security related contract notices. For transparency, this measures the number and value of public contracts awarded to UK registered firms related to cyber security. It excludes the award of framework contracts as these can be difficult to identify exact government spending, where the contract value is the same as the framework maximum budget.
Figure 6.4 highlights the significance of public procurement in growing the UK cyber security ecosystem.
We note that, following publication of successful contract awards, the 2023 data has been revised upwards from the previous study, with 963 contracts awarded to UK cyber security businesses to the value of £772 million. The provisional[footnote 30] procurement data for 2024 suggests that public sector demand for cyber security products and services has remained strong, with 942 contracts awarded to the value of £931m, representing a significant increase in contract value despite a slight decrease in the number of contracts.
Figure 6.4 Cyber security contracts (value and volume)
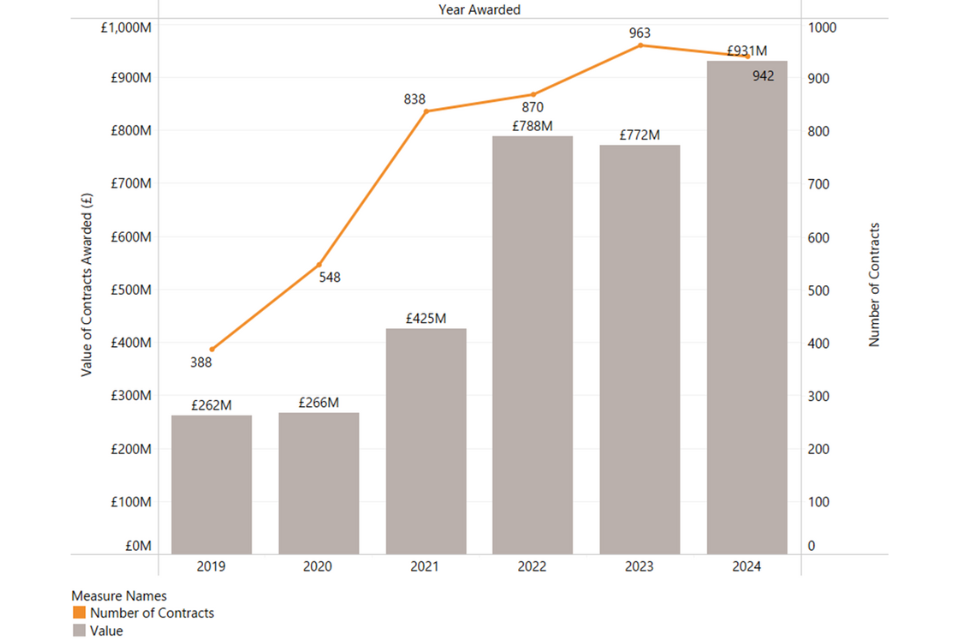
Source: Tussell (data source on UK government spend and contracts).
6.6 Sector views on market growth
This year’s research involved over thirty consultations with industry and investors regarding growth ambitions, and routes to market. We highlight some of the key qualitative findings below. Please note that this feedback represents indicative sentiment from industry consultations and should be considered alongside other market indicators.
Increasing SME adoption of cyber security
Whilst noting that cyber security service-based revenues have increased, many firms have noted that continuing to sustain and increase buy-in from small and medium sized enterprises for cyber security solutions represents a key growth opportunity for the UK. This is also expected to return wider growth through increased adoption of cyber standards and hygiene overall.
“Breaking into the small to medium sized enterprise market within the UK represents a huge potential opportunity. The problem that we’ve got is a large part of that market still believes it doesn’t need cyber security, but it absolutely does.”
– Cyber sector firm, 50-249 employees
Further, the role of Managed Security Service Providers (MSSPs) is considered to be expanding as MSPs increasingly incorporate cyber security into their offer (e.g. through providing SOCs). There are opportunities to provide managed security solutions for smaller businesses in addition to previous wider IT and networking support. Some investors commented that they expected to see further market consolidation among providers, whereby larger MSPs may acquire specialist MSSPs (e.g. managed IT firms acquiring penetration testing specialists to increase their ability to service clients in areas such as software security).
“If you look at what’s going on in the private equity space at the moment, there are a lot of Private Equity roll ups of MSSPs and service led propositions, particularly focusing on the SME space where companies need to outsource.”
– Venture capital investor
Increased adoption of AI-powered cyber security solutions, and new demand for AI security
Many stakeholders commented on the increased adoption and roll-out of ‘AI-powered’ cyber security solutions as a significant trend e.g. using AI to help improve threat intelligence and risk alerts. Further, securing the use and deployment of AI models directly is becoming increasingly significant, creating new demand for specialised security solutions. This is explored further in Section 7.4, which includes an overview of the UK’s AI Security subsector.
“The UK [cyber] sector is strong and where I think it will get stronger is in AI, because the UK generally is well positioned in AI in the data world. There’s a real opportunity to lead both in AI and AI security.”
– Venture capital investor
Several cyber security businesses also mentioned growing demand for in-person auditing, compliance certification support, penetration testing, zero-trust network implementation and vulnerability management. In addition, helping businesses understand and manage the security risks associated with adopting technologies such as AI and quantum, shifting to mobile applications and automating functions such as service desks and customer service was also raised.
“You have to make sure the models are secure. You have to make sure the data coming out of the models you can rely on and it’s auditable, and so you’ve got lots of security compliance related issues around AI. That is going to be a massive driver, and I think the UK is really well positioned to play a large role in that market as we go forward.”
– Venture capital investor
Evolving threat landscape
Both criminal and state-sponsored threats are becoming more sophisticated, particularly with the emergence of AI-driven threats and ongoing geopolitical tensions. This evolution is driving increased awareness and investment in security measures. The role of government guidance, particularly through the NCSC, was highlighted as crucial in driving market development.
“The threat of breaches are only getting worse. The threats are only becoming more advanced. And I think that the awareness and the understanding of it is going to increase. And I expect the money and being invested to go significantly.”
– Cyber sector firm, 10-49 employees
“Anytime the NCSC talks, it really, really helps us, especially when the NCSC is making guidance. The more engagement the NCSC can have with companies, the better it is for us as a private company, because then those companies come to us and say, how can you help us implement this?”
– Cyber sector firm, 1-9 employees
Digital transformation
The continued digitisation of business processes and consumer products is expanding the attack surface and creating new security requirements. This includes the shift to mobile applications, automation of corporate functions, and the proliferation of connected devices.
“People are continuing to find new ways to do things better, faster, cheaper, digitally and they’re going to develop these new technologies. And the great thing about cyber security is those new platforms, tools, devices, next generation technologies need to operate securely.”
– Venture capital investor
Regulatory environment and compliance
Government regulation, industry standards, and supply chain requirements are increasingly driving cyber security adoption. International regulations, including the NIS2 Directive in the EU, are creating additional compliance demands and market opportunities.
“Regulation gives a clear demand signal and a compelling event that’s going to force enterprises, the potential customers for start-ups, to become buyers.”
– Angel investor
7. Emerging market trends
7.1 Introduction
As part of this Cyber Security Sectoral Analysis, DSIT sought to undertake detailed examination of two segments within the UK’s cyber security sector: software security and AI security. This chapter provides a summary of these findings. Please see the AI and software cyber security market analysis for the full research report.
This explores baseline evidence regarding market scale, capabilities, and technical provision of the UK’s software and AI security landscape to help support policy development.
For analytical purposes, the research considers three distinct market segments:
Cyber security for AI:
Providers specialising in securing AI systems and applications, including:
-
Firms focused on security of AI systems (e.g. LLM security, model protection)
-
Providers of dedicated advisory or implementation support for AI system security
-
Highly specialist start-ups developing innovative Cyber Security for AI solutions
-
Larger consultancies and firms with dedicated Cyber Security for AI product offerings
Specialist Software Security Providers:
Firms with clear specialisation in software security provision, including:
-
Application security (AppSec) testing and tooling
-
Secure development lifecycle solutions
-
Software vulnerability assessment
-
DevSecOps implementation
-
Code and API security
-
Container and Supply Chain security
Wider Software Security Provision:
Firms offering software security within broader portfolio offerings, including:
-
AppSec capabilities as part of wider security services
-
Code review services
-
Vulnerability assessment provision
-
Broader software security testing for clients
The following sections present detailed analysis of these market segments, examining their scale, technical capabilities, investment patterns, and geographic distribution.
7.2 AI security
We estimate, based on initial research, that there are 66 firms active and registered in the UK that clearly offer cyber security for AI systems as an explicit product or service offering.
We estimate that 14 of these have been established or mainly focus on Security for AI, highlighting that this is a particularly niche and emerging specialist market in the UK. A further 52 providers have been tagged as ‘hybrid’ i.e. they provide Security for AI systems and discuss provision of AI to enhance existing cyber security capabilities.
The product and service data (as shown in Figure 7.1) highlights that whilst these providers primarily cover areas expected such as LLM security, AI model protection, training data, and risk management etc, it also highlights novel areas such as guardrails, protection against prompt injection, shadow AI detection, and data poisoning.
The products and services mentioned by the providers identified suggest there are three distinct market segments for consideration:
Specialist cyber security for AI firms:
This is a small group (c. 14) of firms active in the UK with a sole focus on Cyber Security for AI. The majority are small or micro, with a median of 16 FTE employees.
Notable examples include Mindgard (automated red teaming specifically for LLMs and GenAI), Advai (AI testing methodologies), and SECQAI (specialists in use and security of quantum algorithms). We also find some firms with dual UK-US positioning e.g. Harmonic Security, founded in 2023.
Wider provision of cyber security for AI firms (including advisory and managed services):
We find evidence of (c. 31) dedicated cyber security firms operating in the UK that have offer some form of cyber security for AI product or service to their customers. This includes several dedicated UK headquartered security specialists such as Tessian, Darktrace, and Mimecast. It also includes international firms active in the UK such as Checkmarx, Rapid7, Anomali, CrowdStrike and Palo Alto Networks.
We also find evidence of (c. 21) advisory and implementation support with Cyber Security for AI. This can vary from established tech platforms such as IBM, AWS, Microsoft, Oracle, and NVIDIA all offering Cyber Security for AI tools and solutions; to more direct advisory support from consultancy firms (e.g. Deloitte, KPMG, Accenture, Capgemini) and specialist firms such as Trilateral Research, Fuzzy Labs, Roke, and Kroll.
Figure 7.1 explores the percentage of cyber security for AI providers that mention a product or service offering online that falls under at least one of the following categories. The research team found that these providers mentioned 341 unique products or services via web data, which have been classified and assigned to relevant categories e.g. AI model security.
This highlights the breadth of provision in relation to cyber security for AI; several providers will offer multiple distinct solutions depending on the customer requirements and AI use cases. Further, it highlights that, given the nascence of this market and response by vendors to the rising adoption of Large Language Models (LLMs), it is unsurprising that most vendors (56%) mention securing AI models, and LLM and GenAI security (52%).
Whilst not the focus of this study, AI Governance and Compliance (28%) and AI Ethics (19%) remains closely aligned to this market. Further, quantum AI security (8%) and AI supply chain security (5%) appear to have more limited market scale in the UK, and remain highly specialised, albeit should be tracked to monitor market adoption in the coming years.
Figure 7.1 Product and service ‘focus areas’ for cyber security for AI providers
| Focus Area | Percentage |
|---|---|
| AI Model Security & Protection | 56% |
| LLM & Generative AI Security | 52% |
| AI Infrastructure Security | 47% |
| AI-Enhanced Security Operations | 45% |
| AI Threat Detection & Response | 34% |
| AI Risk Management & Assessment | 33% |
| AI Governance & Compliance | 28% |
| AI Privacy & Data Protection | 27% |
| AI Development Security | 27% |
| AI Ethics & Responsible AI | 19% |
| Quantum & Advanced AI Security | 8% |
| AI Authentication & Access | 8% |
| AI-Specific Threat Protection | 6% |
| AI Supply Chain Security | 5% |
| AI Monitoring & Observability | 5% |
Source: PE analysis of 64 security for AI specialist providers with identified web data (341 terms, 15 classification areas)
Location and scale
For Cyber Security for AI providers, we find a mix of domestic and international firms operating in the UK, with 48% of firms being UK headquartered, and 38% of providers being headquartered in the United States, with the remainder (14%) across the European Union and rest of world.
Review of UK locations highlights some concentration in London (59%) and the South East (17%). While some presence exists in regional clusters such as the North West (9%, 6 firms) and East of England (6%, 4 firms), the data suggests more limited distribution of Cyber Security for AI capability across other regions.
7.3 Software security
We estimate there are 960 firms active in the UK providing software security services[footnote 31], of which:
-
93 are specialist software security providers (i.e. they appear to exclusively focus on the provision of software security) and
-
867 firms offer some form of software security solutions to their clients as part of a wider cyber security offering.
This suggests that just under half (44%) of cyber security providers in the UK appear to be actively involved in software security provision or capability for their customers. Each provider has been reviewed and applied a ‘strong’, ‘partial’ or ‘null’ tag based on their products and services identified against the following areas of software security (Secure Development, Application Security, Code Security, DevSecOps, API Security, Cloud/Container Security, and Supply Chain Security).
As highlighted in Figure 7.2, all providers are considered to offer some form of application security, followed by secure development (82%), cloud / container security (77%), code security (48%), API security (44%), DevSecOps (42%) and supply chain security (36%).
Figure 7.2 Software security provision (by provider count):
| Security Category | STRONG | PARTIAL | Total |
|---|---|---|---|
| Application Security | 259 | 701 | 960 |
| Secure Development | 97 | 694 | 791 |
| Cloud / Container Security | 166 | 572 | 738 |
| Code Security | 77 | 384 | 461 |
| API Security | 98 | 325 | 423 |
| DevSecOps | 68 | 340 | 408 |
| Supply Chain Security | 40 | 308 | 348 |
Source: PE analysis of 960 providers
Size and scale:
The software security landscape demonstrates a notably different size composition compared to cyber security for AI firms. For specialist providers of software security, there is a relatively balanced size distribution. An estimated 38% of providers have a large or medium presence in the UK, suggesting a maturing specialist market that has developed over time, supporting both niche providers and companies that have successfully scaled their operations.
In contrast, partial providers show a skew towards micro enterprises, with 52% in this category. This distribution may reflect the large number of IT consultancies, managed service providers, and wider cyber security firms that offer software security as part of their broader portfolio e.g. security services such as application security and penetration testing.
Overall, we estimate that specialist software security providers (n=93) employ an estimated 7,960 FTEs specifically in cyber security roles, with the wider software security ecosystem (n=867) employing approximately 19,940 FTEs working in cyber security roles. This suggests almost one in three UK cyber security employees work in a company with some form of software security capability.
Location:
For Software Security, we estimate that 79% (757 firms) are UK-headquartered, and 21% (203 firms) represent international firms with a UK presence.
For specialist security software providers (n=93), registration data shows similar concentration in London (49%, 46 firms) and the South East (20%, 19 firms). Regional distribution remains limited, with the South West (9%, 8 firms) and North West (8%, 7 firms) representing other clusters outside of London and South East.
However, wider (partial) provision of software security suggests (n=772) a more distributed pattern. While London maintains the highest concentration (38%, 332 firms), there are more substantial regional counts from the North West, East of England, and South West (each 7-8%). Scotland and Wales demonstrate modest but established presence (40 and 14 firms respectively). Every UK region appears to contain firms offering some form of software security provision, which is beneficial from a market access perspective.
8. Regional snapshots
Introduction
Whilst this report focuses upon the cyber security sector across the entire UK, we set out snapshots[footnote 32] of the number of cyber security firms, offices, and estimated percentage of UK cyber security related employment.
East Midlands
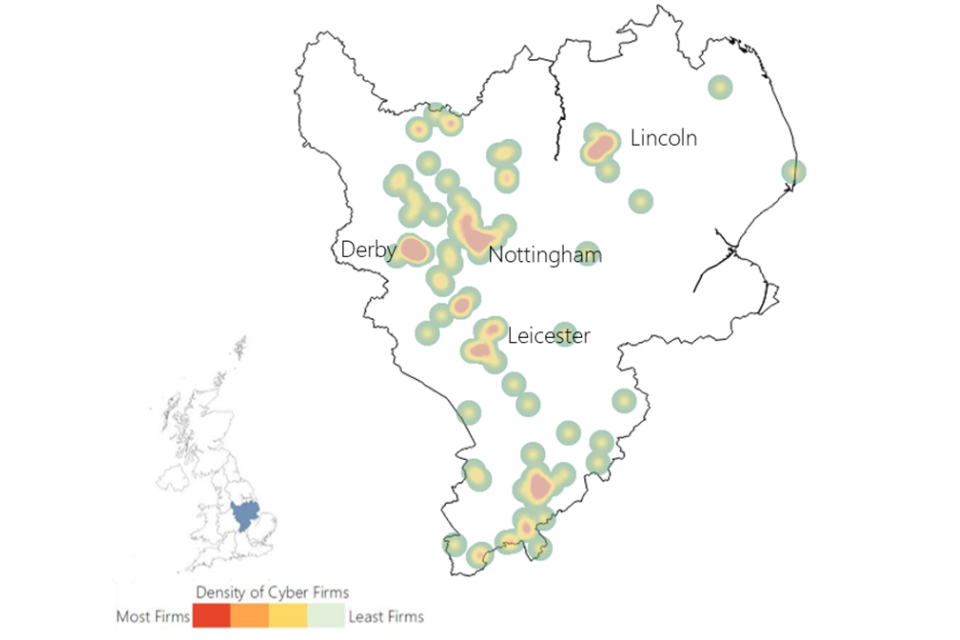
East Midlands
| Percentage of UK Cyber security offices | Estimated percentage of UK based cyber security employment | Mean Advertised Salaries (2024 in core cyber security roles | |
|---|---|---|---|
| 3% | 3% | £55,700 |
East of England
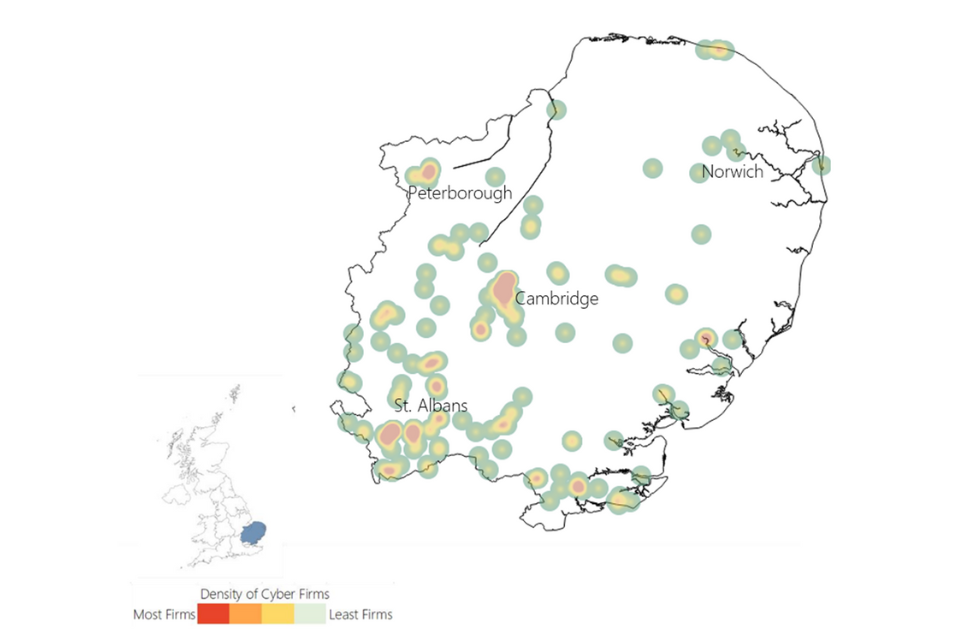
East of England
| Percentage of UK Cyber security offices | Estimated percentage of UK based cyber security employment | Mean Advertised Salaries (2024 in core cyber security roles | |
|---|---|---|---|
| 7% | 5% | £55,600 |
Greater London
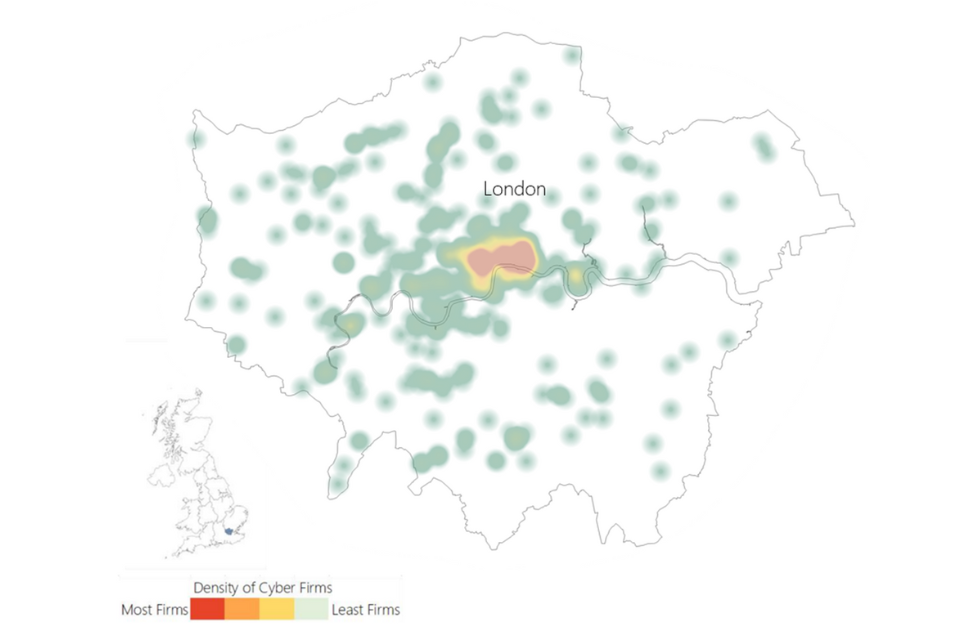
Greater London
| Percentage of UK Cyber security offices | Estimated percentage of UK based cyber security employment | Mean Advertised Salaries (2024 in core cyber security roles | |
|---|---|---|---|
| 38% | 30% | £69,800 |
North East
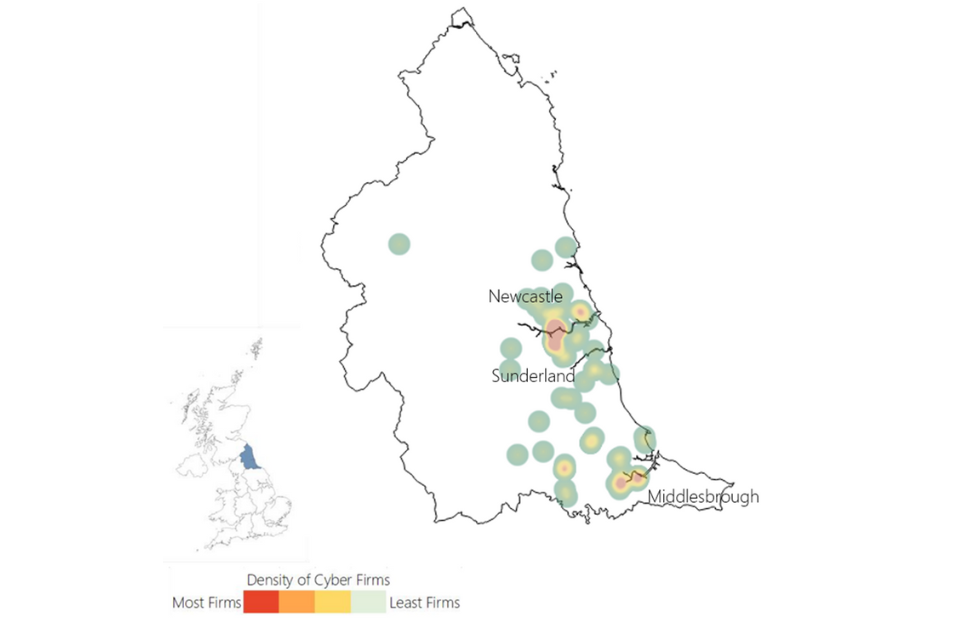
North East
| Percentage of UK Cyber security offices | Estimated percentage of UK based cyber security employment | Mean Advertised Salaries (2024 in core cyber security roles |
|---|---|---|
| 2% | 3% | £58,200 |
North West
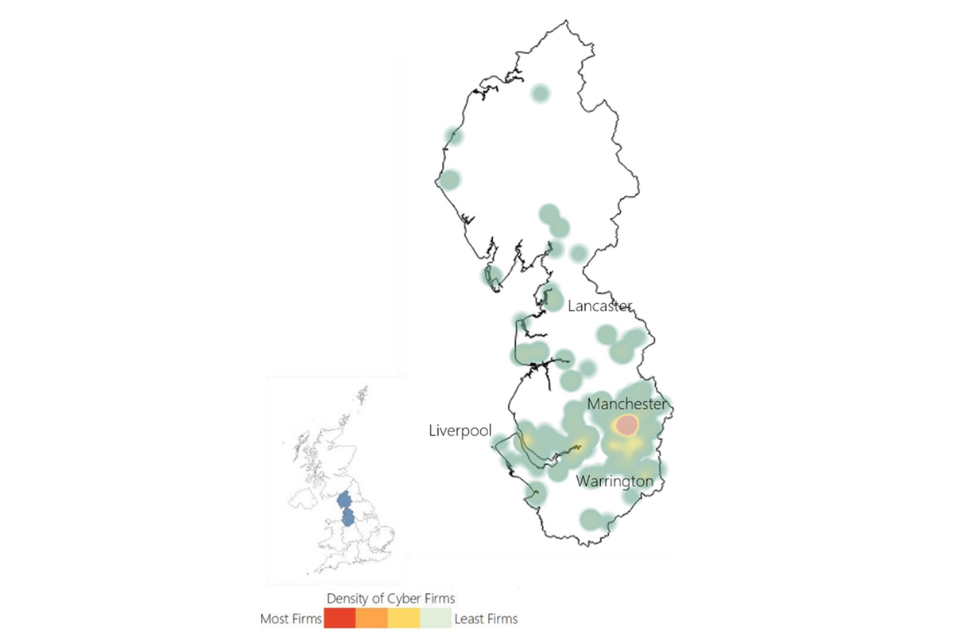
North West
| Percentage of UK Cyber security offices | Estimated percentage of UK based cyber security employment | Mean Advertised Salaries (2024 in core cyber security roles | |
|---|---|---|---|
| 8% | 10% | £54,600 |
South East
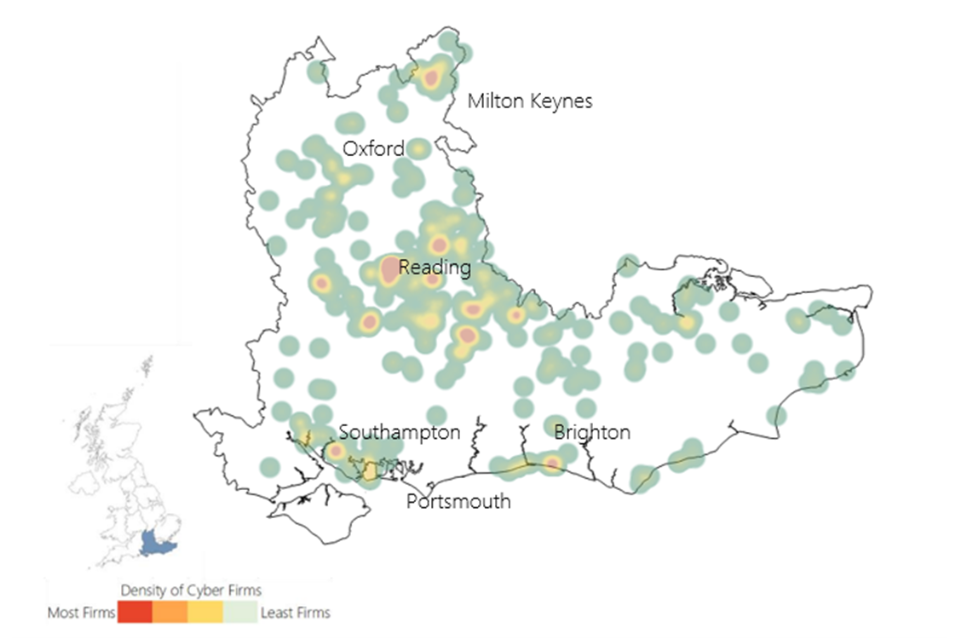
South East
| Percentage of UK Cyber security offices | Estimated percentage of UK based cyber security employment | Mean Advertised Salaries (2024 in core cyber security roles |
|---|---|---|
| 17% | 13% | £56,700 |
South West
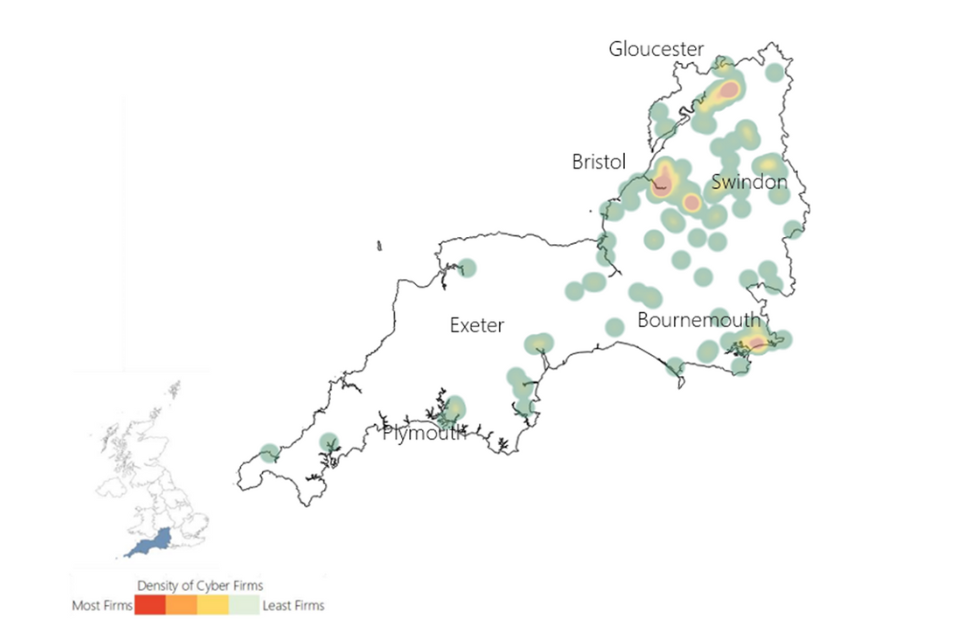
South West
| Percentage of UK Cyber security offices | Estimated percentage of UK based cyber security employment | Mean Advertised Salaries (2024 in core cyber security roles |
|---|---|---|
| 8% | 9% | £55,600 |
West Midlands
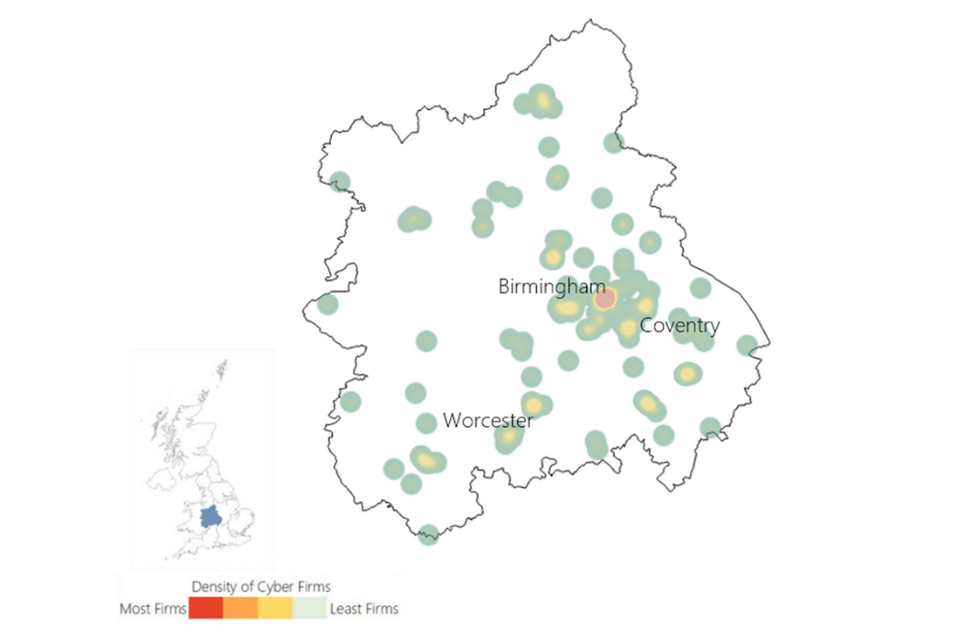
West Midlands
| Percentage of UK Cyber security offices | Estimated percentage of UK based cyber security employment | Mean Advertised Salaries (2024 in core cyber security roles | |
|---|---|---|---|
| 5% | 7% | £55,500 |
Yorkshire and the Humber
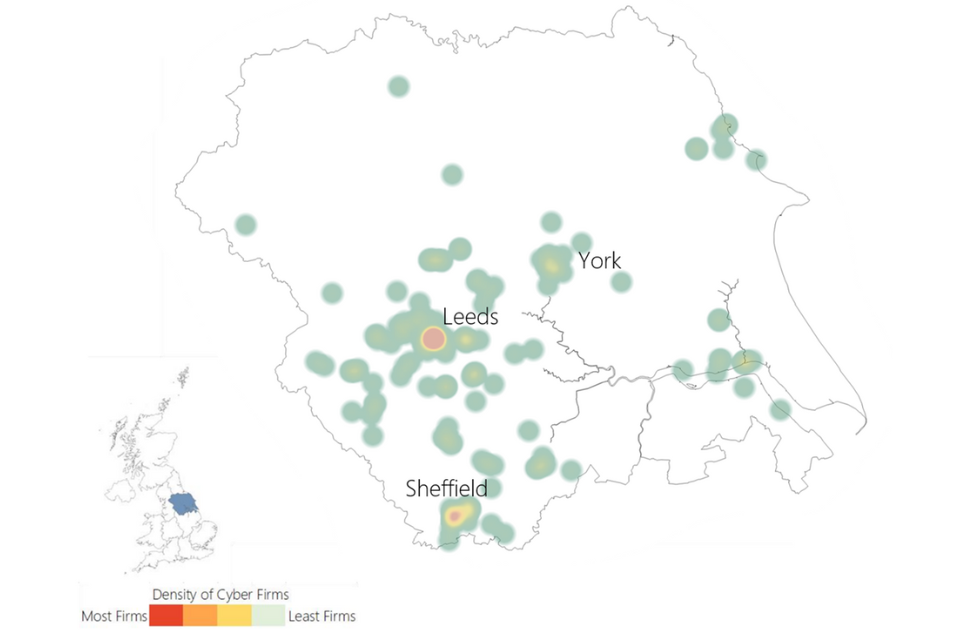
Yorkshire and the Humber
| Percentage of UK Cyber security offices | Estimated percentage of UK based cyber security employment | Mean Advertised Salaries (2024 in core cyber security roles | |
|---|---|---|---|
| 4% | 6% | £55,700 |
Northern Ireland
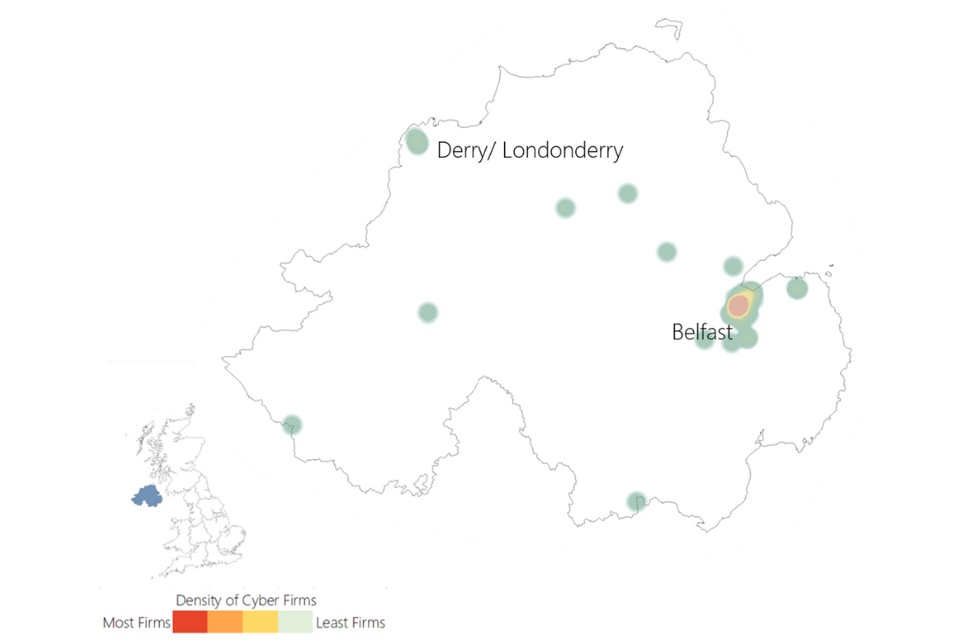
Northern Ireland
| Percentage of UK Cyber security offices | Estimated percentage of UK based cyber security employment | Mean Advertised Salaries (2024 in core cyber security roles |
|---|---|---|
| 2% | 4% | £53,300 |
Scotland
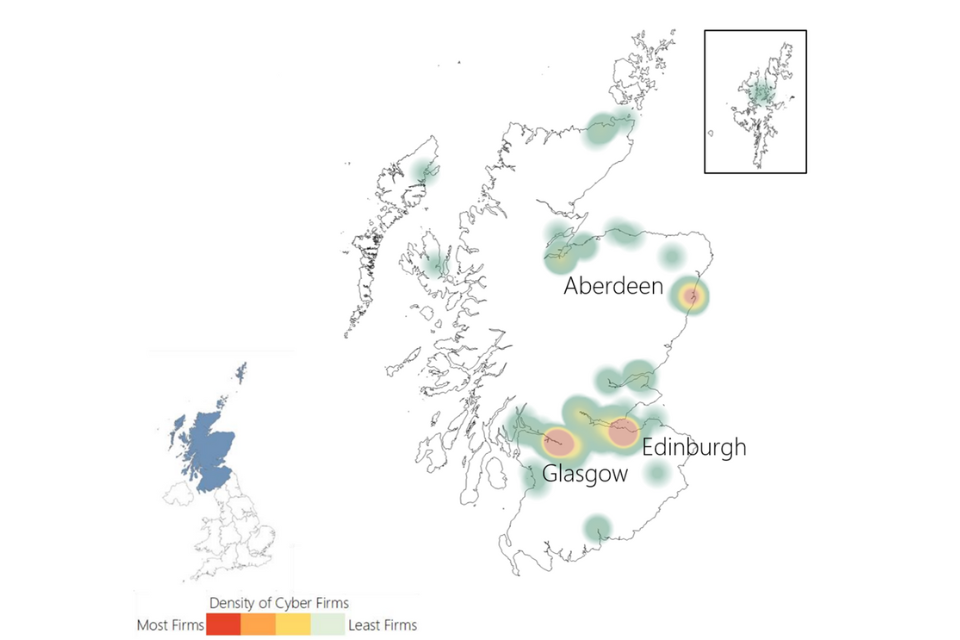
Scotland
| Percentage of UK Cyber security offices | Estimated percentage of UK based cyber security employment | Mean Advertised Salaries (2024 in core cyber security roles |
|---|---|---|
| 6% | 7% | £59,000 |
Wales
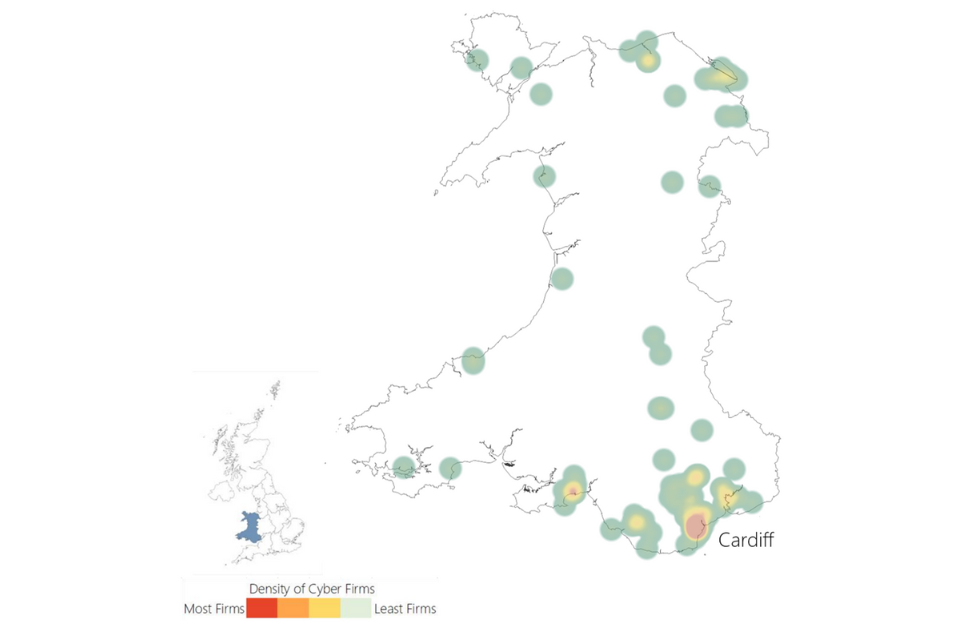
Wales
| Percentage of UK Cyber security offices | Estimated percentage of UK based cyber security employment | Mean Advertised Salaries (2024 in core cyber security roles |
|---|---|---|
| 2% | 3% | £52,700 |
-
Gross Value Added (GVA is a measure of the increase in the value of the economy due to the production of goods and services. In this study, this captures the estimated direct contribution of the cyber security sector to the UK economy. ↩
-
All firms identified were also subject to additional automated and human review by the Perspective Economics analyst team for final inclusion in the cyber security sectoral dataset. ↩
-
Full size definitions: Large: Employees >=250 and Turnover > €50 million or Balance sheet total > €43 million // Medium: Employees >50 and < 250 And Turnover <= €50 million or Balance sheet total <= €43 million // Small: Employees >10 and < 50 And Turnover <= €10 million or Balance sheet total <= €43 million // Micro Employees < 10 And Turnover <= €2 million or Balance sheet total <= €2million ↩
-
Based on 95% confidence intervals. ↩
-
FinTech refers to financial technology used to help deliver financial products and services to users. RegTech refers to ‘regulatory technology’ used to enhance and assist organisations with regulatory and compliance processes. ↩
-
Safety tech providers deliver products and services that enable safer online experiences for citizens. DSIT sector research is available at: https://www.gov.uk/government/publications/safer-technology-safer-users-the-uk-as-a-world-leader-in-safety-tech ↩
-
Full size definitions: Large: Employees >=250 and Turnover > €50 million or Balance sheet total > €43 million // Medium: Employees >=50 and < 250 and Turnover <= €50 million or Balance sheet total <= €43 million // Small: Employees >=10 and < 50 and Turnover <= €10 million or Balance sheet total <= €43 million // Micro: Employees < 10 and Turnover <= €2 million or Balance sheet total <= €2 million ↩
-
UK Business Population Estimates (2022): Available at: https://www.gov.uk/government/statistics/business-population-estimates-2022 ↩
-
Figures may not sum due to rounding. ↩
-
The keywords underpinning Awareness, Training and Education have been broadened to include firms offering awareness or training courses without formal accreditation (e.g., online modules in cyber security awareness). ↩
-
Note only a small number of resellers are included – whereby they also appear to offer other services aligned to the agreed cyber security taxonomy e.g., advisory support with implementation of cyber security products or services. We do not include, for example, high street or online retailers. ↩
-
For a full explanation of TTWAs, see the ONS website. TTWAs are a ‘self-contained labour market in which all commuting occurs within the boundary of that area. At least 75% of the area’s resident workforce work in the area, and at least 75% of the people who work in the area also live in th area. There is a total of 228 TTWAs. The Isle of Man and the Channel Islands are not TTWAs so are not included. Our Location Quotient calculations are based on 2016 Annual Population Survey (APS) data, and the TTWA calculations are based on the April 2011 TTWAs. ↩
-
As marked by international presence with a known office / location. Many firms will trade globally without a physical office presence. This is explored further in Section 6.4. ↩
-
£11,859m (2024 study) to £13,234m = Compound Annual Growth Rate (CAGR) of 12%. ↩
-
Note: Smaller values include Service, Micro £240 million, Product, Micro £110 million, MSSP, Micro £35 million, Small £112 million, Reseller (all) £233 million ↩
-
The research team also models regional estimates of cyber security employment and labour force estimates within the 2024 Cyber Security Skills in the UK research with Ipsos. Within this, vacancy data and estimated workforce data is used to estimate regional estimates of cyber workforce size (as a proportion of the UK). ↩
-
The Beauhurst platform tracks investments in these companies from 2006– 2024. ↩
-
Beauhurst (2024) Equity Market Update H1 2024. Available at: https://www.beauhurst.com/research/the-h1-equity-market-update-2024/ ↩
-
UKTN (2024) Bootstrapped PortSwigger secures £88m in first external investment. Available at: https://www.uktech.news/cybersecurity/portswigger-brighton-park-capital-funding-20240701 ↩
-
Capstone Partners (2024) ‘Cybersecurity M&A Update – July 2024’ Available at: https://www.capstonepartners.com/insights/article-cybersecurity-ma-update/ ↩
-
Thoma Bravo (2024) ‘Thoma Bravo Completes Acquisition of Darktrace’, https://www.thomabravo.com/press-releases/thoma-bravo-completes-acquisition-of-darktrace ↩
-
Digit (2024) ‘Quorum Cyber Receives ‘Significant Investment’ From Charlesbank Capital’, https://www.digit.fyi/quorum-cyber-receives-signigicant-investment-from-charlesbank-capital/ ↩
-
LDC (2022) ‘Acora secures new funding to support next growth phase’, https://ldc.co.uk/news/ldc-invests-in-msp-acora/ ↩
-
Acora (2023) ‘Acora continues to grow and develop its cyber proposition’, https://acora.com/news/announcements/acora-continues-its-cyber-proposition/ ↩
-
Charles Russell Speechlys (2025) [‘Charles Russell Speechlys advises Acora on its acquisition of Elastacloud’](https://www.charlesrussellspeechlys.com/en/news-and-events/news/2025/01/charles-russell-speechlys-advises-acora-on-its-acquisition-of-elastacloud/0 ↩
-
Egress (2024) ‘KnowBe4 to Acquire Egress’ ↩
-
Intragen (2024) ‘Intragen Scales Up with Third Acquisition in Twelve Months’ ↩
-
Nortal (2024) ‘Nortal acquires UK cybersecurity consultancy 3DOT Solutions’ ↩
-
Instil (2024) ‘Instil adds cyber security expertise to its offering with acquisition of Vertical Structure’ ↩
-
This analysis is undertaken in January 2025. It is possible that contract awards for Q4 2024 are added by public buyers later in H1 2025, therefore this data is considered provisional. As such, this figure may actually be higher than the current figure reported. This will be revisited in the 2026 sectoral analysis. ↩
-
Please note this includes firms engaged in AI security. ↩
-
Each of the sections below sets out a heatmap of the active offices within each region (darker red intensity signals a cluster of firms), count of registered cyber firms, count of active cyber offices in the region, percentage of active UK cyber security offices within the region (i.e. number of active offices in the region divided by the total number of active cyber offices in the UK), and an estimated percentage of UK cyber security sectoral employment within the region. The average advertised salary is derived for 2024 using the Lightcast Analyst tool. This is consistent with the methodology from the Cyber Skills in the UK Labour Market research (published in 2024, with data and analysis from 2023), and updates the figures from that report using labour market data from 2024. ↩
