Cyber security sectoral analysis 2026
Published 12 May 2026

© Crown copyright 2026
This publication is licensed under the terms of the Open Government Licence v3.0 except where otherwise stated. To view this licence, visit nationalarchives.gov.uk/doc/open-government-licence/version/3 or write to the Information Policy Team, The National Archives, Kew, London TW9 4DU, or email: psi@nationalarchives.gov.uk.
Where we have identified any third party copyright information you will need to obtain permission from the copyright holders concerned.
This publication is available at https://www.gov.uk/government/publications/cyber-security-sectoral-analysis-2026/cyber-security-sectoral-analysis-2026
Foreword
The UK’s cyber security sector continues to demonstrate why this country is one of the best places in the world to start and grow a cyber business. This year’s analysis shows a sector that is expanding in scale and capability, generating £14.7 billion in revenue, contributing £9.1 billion in Gross Value Added, and employing nearly 70,000 highly skilled people across more than 2,600 firms. These businesses protect our digital economy while creating high value jobs in every part of the UK.
At the heart of this success is talent. UK cyber businesses consistently highlight the strength of our engineering and security expertise as a key competitive advantage. Through programmes such as TechFirst, the government is helping to sustain the pipeline of specialist skills needed across cyber security and the UK’s wider frontier technologies. Alongside this, reforms to technical education and apprenticeships, and our continued focus on increasing the participation of women in tech, are helping to ensure that more people can access and benefit from the opportunities the cyber sector creates.
The UK is also a leading environment for cyber innovation. Our universities continue to generate new ideas, companies and intellectual property. Targeted accelerator programmes, including CyberASAP, are supporting researchers and founders to turn cutting edge research into commercially viable businesses, attracting private investment and strengthening the UK’s innovation pipeline.
Cyber security is a clear government priority. The Government Cyber Action Plan set out how we will strengthen resilience against cyber threats, and the Cyber Security and Resilience Bill will raise standards across critical national infrastructure and digital supply chains. As this report shows, public sector spending on cyber security continues to increase. Harnessing this demand to support UK capability, and to build stronger design partnerships between government, industry and investors, will be essential if more UK cyber firms are to scale into global leaders.
Artificial intelligence is reshaping the cyber security landscape. This report highlights the rapid growth of firms securing AI systems and using AI to identify vulnerabilities more effectively. The UK’s combined strengths in cyber security, AI and research position us well to lead in this next phase, securing our digital future while building globally competitive businesses at home.
Baroness Lloyd of Effra CBE

Parliamentary Under-Secretary of State (Minister for Digital Economy)
Department for Science, Innovation and Technology
Executive summary
Introduction
Ipsos and Perspective Economics were commissioned by the Department for Science, Innovation and Technology (DSIT) in May 2025 to undertake an updated analysis of the UK’s cyber security sector.
This analysis builds upon the previous UK Cyber Security Sectoral Analysis (published in March 2025) that provides a recent estimate of the size and scale of the UK’s cyber security industry. The research provides an assessment of:
-
the number of businesses in the UK supplying cyber security products or services
-
the sector’s contribution to the UK economy (measured through revenue and Gross Value Added, or GVA)
-
the number employed in the cyber security sector
-
the products and services offered by these firms
Project scope and summary of methodology
The diagram below sets out a summary of the research methodology used. This is consistent with previous studies to support a time-series analysis of the sector’s performance to date.
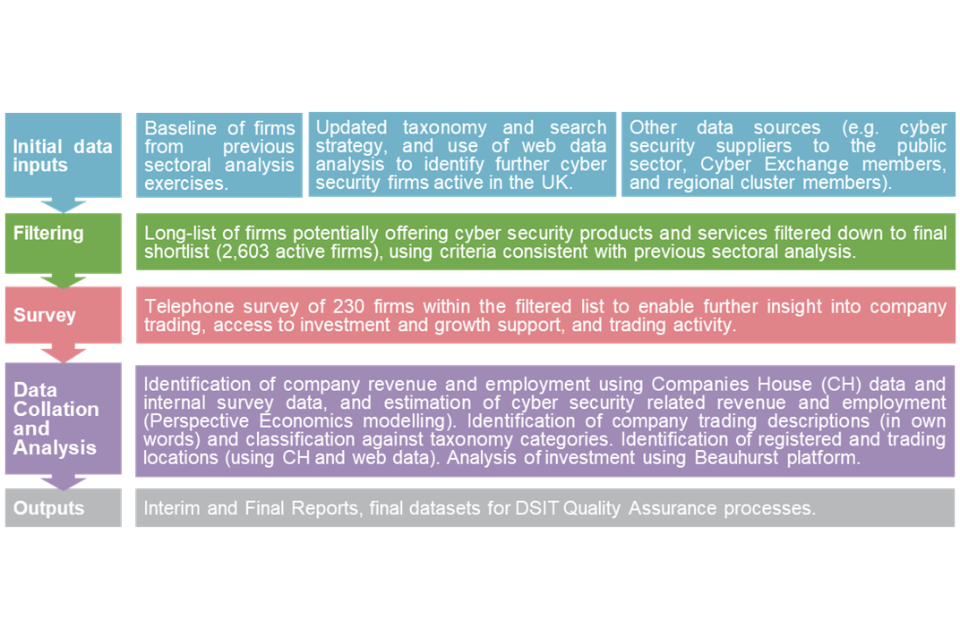
Source: Ipsos, Perspective Economics
Key findings
| Metric | Finding |
|---|---|
| Number of companies | We estimate that there are 2,603 firms currently active within the UK providing cyber security products and services. This is an increase of 438 firms (+20%) compared to the previous report, which identified 2,165 firms. |
| Sectoral Employment | We estimate there are approximately 69,600 Full Time Equivalents (FTEs) working in a cyber security related role across the cyber security firms identified. This reflects an estimated increase of c. 2,300 cyber security employee jobs within the last 12 months (an increase of 3%). |
| Sectoral Revenue | We estimate that total annual revenue within the sector has reached £14.7 billion within the most recent financial year. This reflects a nominal increase of c. 11% since last year’s study. |
| Gross Value Added | We estimate that total GVA for the sector has reached c. £9.1 billion — an increase of 17% since last year’s study. We estimate that GVA per employee has also increased from £116,200 to £131,200 (+13%). |
| Investment | In 2025, £184 million has been raised across 47 deals within dedicated cyber security firms. |
1. Introduction
1.1 Methodology and sources
This analysis builds upon the previous UK Cyber Security Sectoral Analysis 2025 (published in March 2025) that provides a recent estimate of the size and scale of the UK’s cyber security industry. This continues the time-series analysis undertaken by the research team since 2018. A full time-series analysis is set out within Chapter 4.
The research provides an assessment of the number of businesses in the UK supplying cyber security products or services; the sector’s contribution to the UK economy (measured through revenue and Gross Value Added, or GVA [footnote 1] ); the number employed in the cyber security sector; and an overview of the products and services offered by these firms.
The UK cyber security sector does not have a formal Standard Industrial Classification (SIC) code, and this study therefore closely aligns itself to that of the baseline analysis, to provide a time series analysis of how the sector has progressed since the baseline and subsequent annual studies.
The cyber security sector remains fast-moving, and continually subject to changes in products, services, and market approaches. This year’s study is fully consistent with the previous updated methodology set out within last year’s report. This includes a refined taxonomy to better identify and classify cyber security activity, continued use of a range of data sources[footnote 2], and an ongoing telephone and online survey of cyber security businesses in July to October 2025.
The following methodology and research sources were used to provide an overarching shortlist of UK cyber security businesses, and to estimate their economic contribution related to the sale of cyber security products or services.
The process by which we identify and measure the economic contribution of cyber security activity reflects a best estimate by the research team using agreed parameters for the inclusion of respective firms considered to be active in the field.
The key stages below are consistent with previous Cyber Security Sectoral Analysis exercises to enable a time series comparison.
Stage 1: Desk research
The research team conducted initial desk research to explore how the cyber security market had changed within the last 12 months. This included:
-
Engagement with UK cyber security regional networks and clusters, to gather local intelligence
-
A review of published reports regarding the output or activities of the sector (e.g., National Cyber Strategy, NCSC Annual Review, and wider landscape literature)
-
Recent investments or initiatives in the cyber security sector (including review of investments and acquisitions, and identification of industry initiatives and cohorts, e.g., Cyber Runway)
-
Any emerging trends in the market (including supply side and demand side), e.g., enhanced demand attributable to cloud security, or new product innovations requiring specific cyber security requirements (e.g., AI Security) — this is explored in Section 7
Stage 2: Initial data collection & gap analysis
The research team sought to identify potential active cyber security firms in the UK through:
-
A review of firms previously identified in the sectoral analysis (identifying current status and determining inclusion in the updated set)
-
A review of company participation within clusters, networks, and/or government supported initiatives
-
A cyber security market taxonomy has been used to inform a long list of firms (identified through use of web data and refined within DSIT workshops). This list was subject to automated and manual review, and refined to a final cyber security business list for analysis (n = 2,603)
The business metrics include (but are not limited to):
-
Company name, registered number, company status, and date of incorporation
-
Registered and trading locations (using official and web data)
-
Company website and contact details
-
Core description of company activities related to cyber security
-
Company size (Large / Medium / Small / Micro)
Stage 3: Cyber security sectoral survey
Ipsos conducted a representative survey of 230 cyber security firms from July to October 2025. The survey used the list of firms (n = 2,603) established in Stage 2 of this study as a sample frame from across the UK. The purpose of the survey was to understand firm-level performance, barriers, and collaboration in further detail.
It covered the following topics:
-
The categories of products and services offered across firms
-
The client sectors that cyber security firms work across
-
Revenue estimates (to supplement the other published data found in Stage 2)
-
Understanding areas of collaboration and reasons for working with cyber security partners
Stage 4: Qualitative consultations
This research has also been supported through 5 one-to-one consultations with investors in the cyber security sector. Participants were purposively sampled to reflect variation in size, location, product or service focus, maturity, and investment focus.
Stage 5: Data blending
In December 2025, the results of the cyber security sector survey were used to inform gaps within the list of identified cyber security sector firms e.g., the extent to which a firm provided cyber security products or services and attributed revenues accordingly. This stage involved data cleaning and augmentation from a range of previous sources (including company level accounts, web data, survey data, and wider desk review) to provide a final dataset of cyber security firms, including the development of firm-level metrics used for analysis within the report. Additional verification of web domains (to ensure active status) and Companies House was also undertaken to confirm active status at the time of analysis.
Stage 6: Data analysis and reporting
The final stage involved analysis of the final shortlist of firms to provide estimates of the total number of firms, products and services offered, whether firms are ‘dedicated or diversified’ with respect to how much of their activity related to cyber security provision, revenue/GVA/employment estimates, locations (registered, trading, and international presence), investment and survey feedback (anonymised at an individual level). Further analysis is also undertaken to explore AI security and software security providers operating in the UK market (as set out in Chapter 7).
The data sources used to underpin the sectoral analysis included:
-
Web Data: Perspective Economics undertook extensive web review to identify new providers of cyber security products and services, with enriched company descriptions, activities and locations for identified company websites.
-
Bureau van Dijk FAME (and Companies House Data Product): This platform collates Companies House data and financial statements from all registered businesses within the UK.
-
Beauhurst: Beauhurst is a leading investment analysis platform, which enables users to discover, track and understand some of the UK’s high-growth companies e.g., identify investment, accelerator participation, and key information.
-
Tussell: Tussell provides market insight into public sector procurement through identifying key contracts, spend, buyers and suppliers.
-
Cyber Exchange: techUK’s Cyber Exchange directory enables cyber security providers to register an account and set out the products and services they provide to the market.
-
Representative survey of cyber security firms: in late 2025, Ipsos conducted a representative survey of cyber security firms. The feedback from 230 providers has been useful to understand the growth drivers and challenges for firms within the market.
-
One-to-one qualitative consultations: further, the team has also conducted 5 one-to-one consultations with investors to gather feedback on the growth and performance of the cyber security sector in the UK.
1.2 Consistency with the 2025 cyber security sectoral analysis
Our approach remains consistent with previous reports (and builds upon the methodology to identify and measure the contribution of the sector). As per previous studies, this report also explores firms that:
-
Have a clear presence within the UK market, through a UK registered business that reports to Companies House on an annual basis
-
Demonstrate an active provision of commercial activity related to cyber security (e.g., through the presence of a website / social media)
-
Provide cyber security products or services to the market (i.e., sell or enable the selling of cyber solutions to other customers)
-
Have identifiable revenue or employment within the UK
-
Appear to be active at the time of writing (i.e., have not, or are not in the process of dissolution)
-
Are not charities, universities, networks, or individual contractors (non-registered) — all excluded for analysis purposes
It also draws upon consistent sources, i.e., company accounts, longitudinal survey data, and Beauhurst for investment data. The financial analysis of firms is also consistent, as it uses company information from the most recent financial year of accounts (analysis undertaken in late 2025, with financial year 2024/25 as the modal year for published accounts) and the underpinning dataset sets out where employment, revenue, GVA and investment are either known or estimated (and the rationale underpinning this).
We note that a series of methodological updates have been undertaken including an update to UK company size thresholds (as set out previously), increased use and scoping of web data by the Perspective Economics research team, updated classification and categorisation (as set out in Section 2), and further research to identify AI and Software Security providers, following the 2025 research.
1.3 Interpretation of the data
Across this report, percentages from the quantitative data may not add to 100%. This is because:
-
We have rounded percentage results to the nearest whole number
-
At certain questions, survey respondents could give multiple answers
It is also important to note that the survey data is based on a sample of cyber sector firms rather than the entire population. Therefore, they are subject to sampling tolerances. The overall margin of error for the sample of 230 firms (within a population of 2,603 firms) is between c.4 and c.6 percentage points. The lower end of this range (4 percentage points) is used for survey estimates closer to 10% or 90%. The higher end (6 percentage points) is used for survey estimates around 50%. For example, for a survey result of 50%, the true value, if we had surveyed the whole population, is highly likely to be in the range of 44% to 56%.[footnote 3]
By contrast, the data from the qualitative consultations is intended to be illustrative of the key themes affecting the cyber security sector as a whole, rather than a statistically representative view of cyber sector investors.
1.4 Acknowledgements
The authors would like to thank the DSIT team for their support across the study. DSIT and the report authors would also like to thank those that participated within this research, including those that participated within the industry survey, the regional cyber security clusters, consultations, and shared data, knowledge, and feedback to help underpin this study.
Note: The cyber security sector continues to increase in size, scope, and specialisms. We are happy to receive comments and feedback regarding the methodology or findings herein, through contacting cybersecurity@dsit.gov.uk
2. Profile of the UK cyber security sector
Section summary: profile of the UK cyber security sector
-
We estimate that there are 2,603 firms currently active within the UK providing cyber security products and services. This reflects an increase of 438 firms (+20%) compared to the previous report, driven by newly registered companies, firms diversifying into cyber security, and improved identification through expanded web data and source coverage.
-
The majority of firms are small (19%) or micro (58%) in size. However, the sector contains a notably higher proportion of medium and large firms (22%) than the wider UK business population (c. 3%), indicating significant provider scale within the market.
-
Just over two-thirds (69%) of firms are dedicated (‘pure-play’) providers of cyber security. Micro firms are much more likely to be dedicated (84%), whereas large firms are predominantly diversified (83%), reflecting the tendency for major consultancies, managed service providers, and telecoms firms to establish cyber security practices alongside existing provision.
-
Analysis of company descriptions suggests that over 7 in 10 (72%) of firms are mainly involved in service provision (including managed services), and just under 1 in 3 (29%) are mainly involved in cyber security product development. This reflects a slight increase in product-led activity compared to the previous study.
2.1 Defining the UK cyber security sector
Within the National Cyber Strategy 2022, cyber security is defined as:
The protection of internet connected systems (to include hardware, software, and associated infrastructure), the data on them, and the services they provide, from unauthorised access, harm, or misuse. This includes harm caused intentionally by the operator of the system, or accidentally, as a result of failing to follow security procedures or being manipulated into doing so.
Therefore, this sectoral analysis seeks to identify businesses active within the UK that provide products or services that enable the protection of internet connected systems and their users.
In line with previous studies, this analysis is focused upon organisations that include all of the following attributes:
-
Have a clear presence within the UK market, through a UK registered business that reports to Companies House on an annual basis
-
Demonstrate an active provision of commercial activity (e.g., through the presence of an active website / social media presence)
-
Provide cyber security products or services to the market (i.e., sell or enable the selling of cyber solutions to other customers) — aligned to the taxonomy set out below
-
Have identifiable revenue or employment within the UK related to cyber security
-
Appear to be active at the time of writing (i.e., have not, or are not in the process of dissolution)
-
Are not charities, universities, networks, and individual contractors (non-registered) — which are all excluded for analysis purposes
The businesses included within this analysis are considered to provide one or more of the following products or services:
-
Cyber professional services, i.e., providing trusted contractors or consultants to advise on, or implement, products, solutions, or services for others.
-
Endpoint and mobile security, i.e., hardware or software that protects devices when accessing networks.
-
Identification, authentication, and access controls, i.e., products or services that control user access, for example with passwords, biometrics, or multi-factor authentication.
-
Incident response and management, i.e., helping other organisations react, respond, or recover from cyber attacks.
-
Information risk assessment and management, i.e., products or services that support other organisations to manage cyber risks, for example around security compliance or data leakage.
-
Internet of Things (IoT Security), i.e., products or services to embed or retrofit security for Internet of Things devices or networks.
-
Network security, i.e., hardware or software designed to protect the usability and integrity of a network.
-
SCADA and Information Control Systems, i.e., cyber security specifically for industrial control systems, critical national infrastructure, and operational technologies.
-
Threat intelligence, monitoring, detection, and analysis, i.e., monitoring or detection of varying forms of threats to networks and systems.
-
Awareness, training, and education, i.e., products or services in relation to cyber awareness, training, or education.
Section 2.3 sets out the type of cyber security products and services in further detail.
2.2 Number of cyber security firms active in the UK
We estimate that there are currently 2,603 firms active within the UK providing cyber security products and services. This reflects an estimate as of December 2025. Whilst this reflects an increase in the number of firms offering cyber security products and services (2,165 identified in the previous study), the research team emphasise that this is one metric among many to gauge the health of the sector. For example, this increase includes:
-
Newly registered companies offering cyber security products and services (often very early / small start-ups)
-
Previously registered companies that did not previously offer such services, but have established a product or team to do so recently (e.g., consultancies offering IT risk services)
-
Businesses now identified as providing a relevant cyber security product or service (e.g., identified through provision of an accredited scheme such as Cyber Essentials) where previous web-data matching did not flag such products or services
-
Businesses with limited web data reporting the provision of cyber security products or services, but which have been flagged through engagement with other sources (e.g., consultation with regional clusters)
Throughout this study, the research team emphasise the need to draw upon a wide range of existing sources, alongside the development and deployment of a cyber security taxonomy against Companies House data, analysis of relevant website domains, and in-depth regional engagement. Within the process, a ‘long list’ of several thousand businesses in the UK was identified as potentially relevant to the cyber security sector using keywords and web data. However, this long list was subsequently filtered to ensure each business demonstrated sufficient alignment to the research parameters and the market taxonomy. For example, web data can identify firms that may have an active registration with Companies House, have a website or social media presence, and meets the parameters of the taxonomy. However, further review of the presence may indicate a lagging status (e.g., the business may have no true employees or may not appear to be active for several years). The team therefore reviewed thousands of potentially relevant firms in detail and subsequently omitted organisations that may have mentioned security (e.g., offering a secure data centre service) but did not appear to tangibly offer security products or services to the end-market.
This yielded the 2,603 firms in scope, and the research team considers this to be an appropriate figure to gauge the health and composition of the sector whilst ensuring consistency with previous analysis.
We do however note, that as with all emerging sectors, subtle differences in definition can result in varying interpretations of the scope and composition of activity. In this respect, there may be other relevant cyber security use cases, which could in future meet the short list requirements (i.e., the 6 conditions set at the beginning of Section 2.1) and could therefore be included in future analysis. This might include, for example, firms involved in areas such as RegTech[footnote 4] or Safety Tech[footnote 5]. However, we provide these parameters to avoid duplication and provide DSIT with a health check regarding the overall cyber security market.
Further, we have improved our identification methodology. This analysis draws on an expanded range of data sources, including company accounts, web data, and wider secondary datasets, to inform our assessment of whether a firm can be considered in scope. We have also included signals such as Cyber Essentials certification and participation in accelerator programmes (e.g. Cyber Runway) to support identification of relevant firms. All web data is reviewed by the Perspective Economics research team to minimise omissions where automated scraping may not fully capture firm-level activity.
Overall, this process means that the 2,603 firms identified for analysis within this report have been assessed and verified as providers of cyber security products and solutions. We provide a high-level breakdown of this provision in subsequent chapters. Given the breadth of ‘cyber security’ as a term, we endeavour to be clear regarding what is in scope, what is being measured, and why this matters, for the sector and for the wider economy and society.
The following sub-sections set out an overview of the number of companies by size; the breakdown between companies that appear dedicated or diversified; and the products or services provided by each company. For the 2,603 cyber security firms, Figure 2.1 and Table 2.1 demonstrate breakdown by size. [footnote 6]
Figure 2.1: Number of registered cyber security firms by size
| Large | 240 |
| Medium | 343 |
| Small | 507 |
| Micro | 1,513 |
Source: Perspective Economics (n = 2,603)
Within the UK, the vast majority of all businesses are Small and Medium Enterprises (SMEs), and it is therefore to be expected that the majority of registered businesses within the cyber security sector are small (19%) or micro (58%) in size.
As this study focuses upon businesses with at least one member of staff, the following comparison is noted between the UK’s cyber security sector, and the broader UK business population. This highlights that, despite the cyber security sector containing a considerable proportion of micro and small businesses, there are many providers of scale operating within the UK market (i.e., 22% of businesses offering cyber security products and services to market are medium or large, compared to c. 3% of all businesses[footnote 7] in the UK).
Table 2.1: Comparison of the size of cyber security firms and wider business population
| Size | UK Business Population Estimates (2025) | Percentage[footnote 8] | Cyber Sectoral Analysis | Percentage |
|---|---|---|---|---|
| Large (250+) | 8,335 | <1% | 240 | 9% |
| Medium (50-249) | 38,435 | 3% | 343 | 13% |
| Small (10-49) | 220,085 | 16% | 507 | 19% |
| Micro (1-9) | 1,150,875 | 81% | 1,513 | 58% |
| All Businesses with at least 1 employee | 1,417,730 | 100% | 2,603 | 100% |
Change in Size
Following last year’s sectoral analysis, we have tracked the performance of each firm identified last year (n = 2,165 in the previous study) to understand how the size of cyber security firms has changed (where applicable) in the last 12 months.
The left side of the Sankey diagram (Figure 2.2) shows the size of cyber security firms as identified in the 2025 study, with the right side showing their updated size currently. The data highlights ongoing levels of dissolution or inactivity among micro and small providers. However, we note this study methodology has undertaken additional firm level checks to remove or mark firms as ‘inactive’ that no longer appear to be substantially trading, even if they are marked as ‘active’ with Companies House. For example, this includes the removal of ‘dead’ domain websites, and additional website quality reviews to remove firms without clear active market relevance or cyber security provision. As such, this improves the underlying dataset quality; however, results in the removal of ‘lower quality’ domains and entities (as marked by ‘removed’ in Figure 2.2).
Figure 2.2: Sankey flow chart — size (2025 study – 2026 study)[footnote 9]
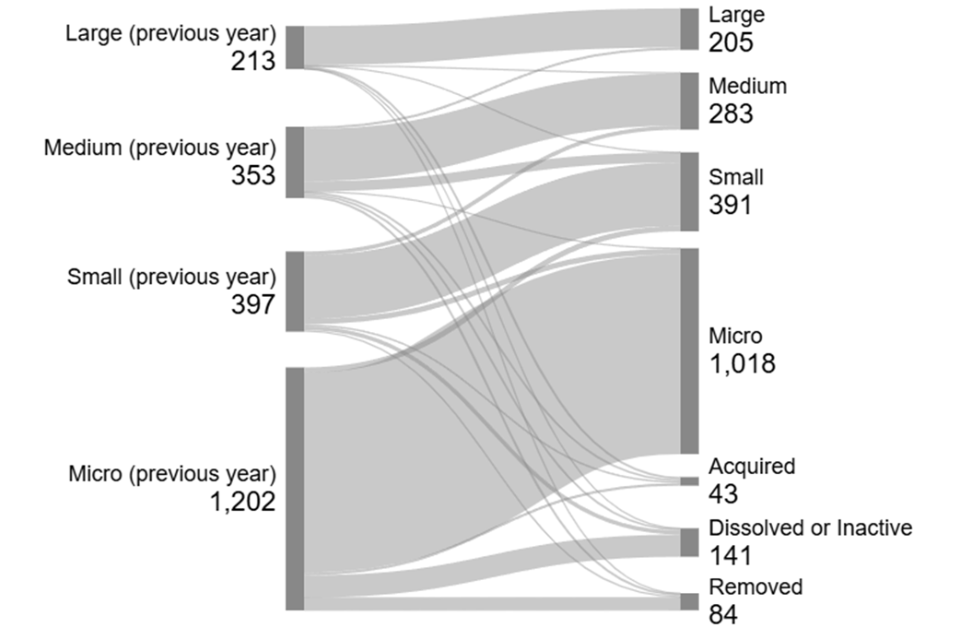
Source: Perspective Economics (n=2,165)
Dedicated and diversified providers of cyber security products and services
Within this research, we attempt to categorise firms by whether they are either:
-
Dedicated (or ‘pure-play’), i.e., all or most of the business’ revenue or employment can be attributed to the provision of cyber security products or services.
-
Diversified, i.e., some, but not all of the business’ revenue or employment can be attributed to the provision of cyber security products or services.
These classifications are determined by the research team based on review of revenue, employment, and review of all products and services offered by the firm.
Figure 2.3: Dedicated and diversified providers
| Dedicated | 69% |
| Diversified | 31% |
Source: Perspective Economics (n = 2,603)
The rationale underpinning the need to provide this distinction between dedicated and diversified firms is because it is important to understand how firms solely providing cyber security, and firms providing cyber security as one product or service among others, vary with respect to size, scale, growth, and market activity.
Within the current dataset, just over two-thirds (69%) of firms are dedicated providers of cyber security products and services. This reflects a limited change from the previous study (68%). Disaggregating these firms by size also highlights that micro and small cyber security firms within this analysis are much more likely to be dedicated (84% and 64% respectively), whereas there are few large dedicated cyber security firms (17%).
In other words, this reflects the tendency for several large and medium sized companies in the UK to establish cyber security practices to complement existing provision, e.g., management consultancies, managed service providers, or telecoms firms developing a cyber security division that sells to the market. This also includes a range of larger diversified firms developing cyber security products or solutions tailored towards markets such as aerospace and defence, critical national infrastructure, and professional services.
Figure 2.4: Dedicated / diversified cyber security firms by size
| Size | Dedicated | Diversified |
|---|---|---|
| Large | 17% | 83% |
| Medium | 51% | 49% |
| Small | 64% | 36% |
| Micro | 84% | 16% |
Source: Perspective Economics (n=2,603)
2.3 Products and Services Provided
To understand the products and services provided by the UK cyber security sector, DSIT and the research team use a taxonomy (as summarised below) to categorise them.
This provides a high-level overview of the UK’s cyber security product and service offer. This taxonomy remains broadly consistent with previous years; however, the underlying keywords and terms have been revisited and updated. Further, the use of web data and manual review means firms can be classified into taxonomy areas through both the text available, and the analyst decision regarding key products and services. This means the following data reflects an interpretation of the key products and services offered. It is therefore indicative of the main solutions provided by the UK cyber security sector.
We take a top-down review of products and services using the text data available through web data review. This study draws on additional text data compared to previous studies; typically reviewing dozens of relevant web pages to ascertain products and services provided. Further, this year’s study has also reviewed products and services in the firm’s own words. The research team has considered almost 37,000 unique products or services mentioned by the cyber security providers identified.
Taxonomy definitions:
| Taxonomy Category | Agreed Definition |
|---|---|
| Cyber professional services | Providing trusted contractors or consultants to advise on, or implement, cyber security products, solutions, or services for others |
| Endpoint and mobile security | Hardware or software that protects devices when accessing networks |
| Identification, authentication, and access controls | Products or services that control user access, for example with passwords, biometrics, or multi-factor authentication |
| Incident response and management | Helping other organisations react, respond, or recover from cyber attacks |
| Information risk assessment and management | Products or services that support other organisations to manage cyber risks, for example around security compliance or data leakage |
| Internet of Things | Products or services to embed or retrofit security for Internet of Things devices or networks |
| Network security | Hardware or software designed to protect the usability and integrity of a network |
| SCADA and Information Control Systems | Cyber security specifically for industrial control systems, critical national infrastructure, and operational technologies |
| Threat intelligence, monitoring, detection, and analysis | Monitoring or detection of varying forms of threats to networks and systems |
| Awareness, training, and education[footnote 10] | Products or services in relation to cyber awareness, training, or education |
Source: Perspective Economics
Additionally, we also classify each company by whether they provide (as their main cyber security offering) products, services, and or managed security services:
-
Cyber security product(s): i.e., the business has developed and sells a bespoke product (hardware or software solution) to the market
-
Cyber security service(s): i.e., the business sells a service to the market e.g., cyber security advisory services, penetration testing etc
-
Managed Security Service Provider(s): i.e., the business offers other organisations some degree of cyber security support e.g., establishes security protocols, monitoring, management, threat detection etc — typically for a monthly or annual fee
This approach helps policymakers, industry, and investors understand how many companies there are focusing on a particular subsector of the market or offering new products or solutions accordingly.
Product and service provision
Figure 2.5 sets out an analysis of how many companies appear to be focused upon product or service provision. It is worth noting that there will be some overlap where firms provide both products and services; however, this approach selects one primary category per firm. Overall, analysis of company trading descriptions suggests that over 7 in 10 (72%) of firms are mainly involved in service provision (including managed services and reselling), and just under 1 in 3 (29%) are mainly involved in cyber security product development. This reflects a slight increase in product-led activity (from 26% in the previous study to 29% in this year’s study).
Figure 2.5: Number of registered cyber security firms by product/service focus
| Service | 1,216 |
| Product | 743 |
| MSSP | 644 |
Source: Perspective Economics (n = 2,603)
Taxonomy breakdown
Within this study, we have matched company descriptions (in their own words through website analysis) with the key terms within each taxonomy category, followed by a manual and automated check to assign companies to one (or more) taxonomy categories with respect to their product and service provision.
Figure 2.6 is based upon our analysis of trading descriptions, mapped against the taxonomy for all cyber security firms identified. This uses a ‘multiple-fit’ criteria (e.g. a firm may provide several products or services aligned to multiple taxonomy areas).
Figure 2.6: Number of registered cyber security firms by taxonomy offering
| Information Risk Assessment and Management | 80% |
| Cyber Professional Services | 80% |
| Network Security (including perimeter and application) | 52% |
| Threat Intelligence, Monitoring, Detection and Analysis | 45% |
| Training, Awareness and Education | 43% |
| Incident Response and Management | 38% |
| Identification, Authentication and Access Control | 29% |
| Endpoint Security (including Mobile Security) | 25% |
| IoT (including devices, automotive and connected home) | 10% |
| SCADA and ICS | 7% |
Source: Perspective Economics (n = 2,603)
Figure 2.7 sets out a range of the top product and service areas in cyber security mentioned by providers based on a review of web data. The research team has classified these into key groupings.
We note that this is based upon text classification of almost 37,000 unique products and services identified within company web data. This is reliant upon sufficient web coverage and a rapid classification of products and services into relevant categories identified by the research team. This should therefore be considered as indicative of the most commonly mentioned products and service areas, rather than an exhaustive coverage. Further, this is based upon estimated count of terms mentioned across providers, rather than a full assessment of all values as set out in Figure 2.6. As such, there may be some minor variance between taxonomy estimates, and product and service estimates. However, this chart is included to provide a more granular assessment of key solutions cited by vendors.
Figure 2.7: Products and services identified within the cyber security sector
| Security Consulting & Advisory | 63% |
| Governance Risk & Compliance | 62% |
| Security Operations & Monitoring | 46% |
| Incident Response & Recovery | 46% |
| Security Awareness & Training | 40% |
| Vulnerability Management | 38% |
| Data Security & Privacy | 36% |
| Penetration Testing & Red Teaming | 35% |
| Threat Intelligence | 32% |
| Identity & Access Management | 30% |
| Security Certifications | 29% |
| Network Security | 29% |
| Cloud Security | 26% |
| Endpoint & Device Security | 25% |
| Application Security | 21% |
| Email & Communication Security | 16% |
| AI Security, Assurance and Governance | 13% |
| Physical & Hardware Security | 11% |
| Backup & Data Protection | 11% |
| Industrial & OT Security | 10% |
| Secure Development | 7% |
| Fraud & Financial Security | 7% |
| IoT Security | 6% |
Source: Perspective Economics review of web data (n = 2,494 providers with product and services identified)
3. Location of cyber security firms
Section summary: location of cyber security firms
-
We have identified 5,374 active office locations for the 2,603 firms in this study. London (33%) and the South East (16%) are the 2 largest regions; however, just over half (51%) of UK office locations are based outside these 2 regions.
-
The data highlights sustained hotspots in areas such as Greater Manchester, Bristol and Bath, Cheltenham, Belfast, Glasgow, Edinburgh, Newcastle, and the Oxford–Cambridge Growth Corridor. No substantial proportional changes at the regional level were observed compared to the previous report.
-
For dedicated providers, we have identified 414 UK-headquartered businesses with a physical presence in international markets. The United States and European Union / European Economic Area are the core markets for international trading (each 62%), with key European markets including Germany, Netherlands, Spain, France, and Ireland.
-
A further 530 cyber security businesses active in the UK appear to be headquartered or originate from outside the UK, with key nations (by count) continuing to include the US, India, Canada, Israel, France, Germany, Australia and Ireland.
3.1 Introduction
This chapter explores the registered location (i.e., where each business has located its registered address with Companies House), and the active office locations (i.e., where each business has a trading presence or office across the UK) of cyber security firms.
Understanding the registered and trading addresses of cyber security firms in the UK enables regional analysis and supports the evidence-based identification of notable clusters or hotspots of activity. We have identified 5,374 active office locations for the 2,603 firms identified within this study.
These have been identified using identification of 2,603 registered locations (via Companies House) and a further 2,771 UK office locations with web data (for example, where a cyber security firm has multiple sites across the UK).
3.2 Location of cyber security firms in the UK
Figure 3.1 sets out the breakdown of firms by number of UK office locations identified in each of the 12 regions. This highlights the importance of identifying local units of activity in the UK (marked in blue below) when seeking to understand regional activity, as registered locations can be skewed towards London and the South East.
Overall, the data suggests that just over half (51%) of UK office locations are based outside of London and the South East regions. Further exploration of regional office data suggests no substantial proportional changes at the regional level (proportional to overall size of the UK market) compared to the previous report.
Figure 3.1: Percentage of cyber security firms by location
| London | 33% |
| South East | 16% |
| North West | 9% |
| South West | 8% |
| Scotland | 7% |
| East of England | 7% |
| West Midlands | 6% |
| Yorkshire and The Humber | 5% |
| East Midlands | 3% |
| Wales | 2% |
| Northern Ireland | 2% |
| North East | 2% |
Source: Perspective Economics (n=5,374)
Active (local offices)
Figure 3.2 also highlights the number of active offices by Travel to Work Area (TTWA)[footnote 11], and emphasises sustained hotspots in areas such as Greater Manchester, Bristol and Bath, Cheltenham, Belfast, Glasgow, Edinburgh, Newcastle, and the Oxford-Cambridge Growth Corridor.
Figure 3.2: Active cyber security offices by travel to work area (TTWA)
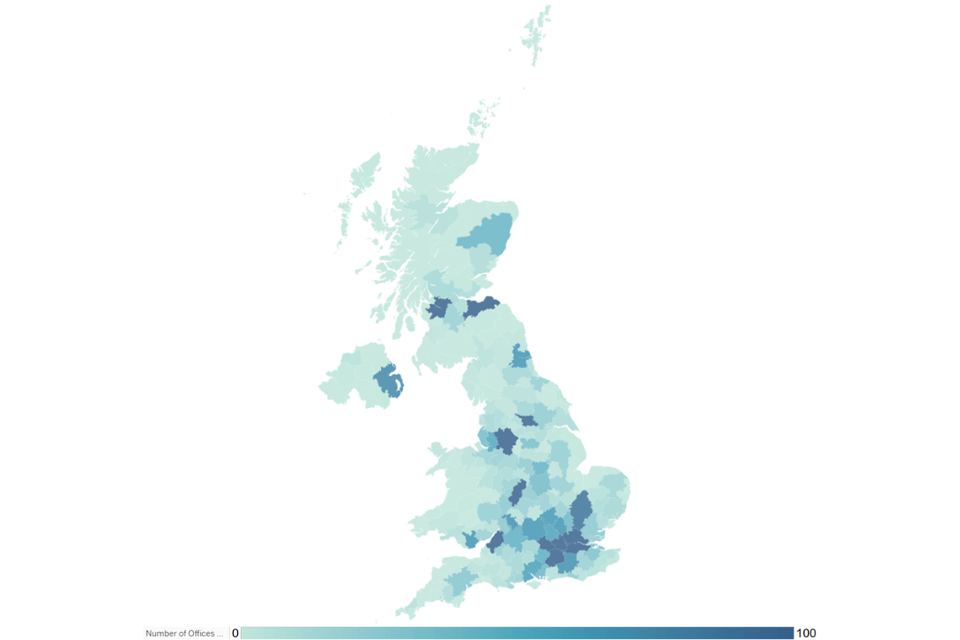
Source: Perspective Economics (n=5,374) (Darkest blue denotes any TTWA with >100 active offices)
3.3 International activity
This section outlines where UK registered cyber security firms have an established physical presence in another country. This helps to inform a further understanding of where firms are exporting, are engaged in international markets, or where multinational firms have a presence in the UK. For the dedicated providers of cyber security products and services, we have identified:
-
414 UK-headquartered dedicated cyber security businesses with a physical presence in international markets (denoted by an office presence);
-
A further 530 cyber security businesses (dedicated and diversified) active in the UK appear to be headquartered or originate from outside the UK.
For the 414 UK-headquartered dedicated cyber security businesses, the following chart sets out the main trading regions (totalling to more than 100%, since firms have offices across multiple locations):
Figure 3.3: Regions with an international presence (by UK-headquartered cyber security firms)
| United States | 62% |
| EU/EEA | 62% |
| India | 14% |
| Australia | 14% |
| United Arab Emirates | 11% |
| Canada | 9% |
| Singapore | 7% |
| South Africa | 6% |
| Japan | 4% |
| Israel | 4% |
Source: Perspective Economics (n = 414)
As with previous years, the United States and European Union / European Economic Area are core markets for international trading [footnote 12], with key markets including Germany, Netherlands, Spain, France, and Ireland. In recent years, the UK has also been a clear international destination for foreign direct investment (FDI) in cyber security. We have also identified where international firms (n = 530) have set up a physical presence in the UK (related to cyber security). We find that key nations (by count) continue to include the US, India, Canada, Israel, France, Germany, Australia and Ireland.
4. Economic contribution of the UK cyber security sector
Section Summary: Economic Contribution of the UK Cyber Security Sector
-
We estimate that total annual revenue within the sector has reached £14.7 billion, reflecting a nominal increase of c. 11% since last year’s study. The majority (70%) of revenue is earned by large firms; however, average cyber security revenue among small firms has increased by approximately 25%, and there are now 241 firms with over £10 million in annual revenues (up from 105 two years ago).
-
We estimate there are approximately 69,600 Full Time Equivalents (FTEs) working in a cyber security related role, an increase of c. 2,300 (3%). This is the lowest recorded growth rate since the series began in 2018, suggesting a significant softening in workforce growth.
-
Total GVA for the sector has reached c. £9.1 billion (+17%), with estimated GVA per employee increasing from £116,200 to £131,200 (+13%). The GVA-to-turnover ratio has also improved (from 0.59 to 0.62), suggesting increasing levels of productivity within the cyber security ecosystem.
-
Most of the employment growth within the sector over the last 12 months has been driven by product-based firms (rising to 27,164 FTEs, 39% of the total), while service and MSSP related employment has effectively stabilised at c. 42,400.
-
The average size of a cyber security team has reduced from 31 to 27 staff (and from 204 to 180 in large enterprises), potentially highlighting workforce efficiencies throughout some of the largest employers in the market.
4.1 Estimated revenue
In the most recent financial year, annual cyber security revenue within the sector is estimated at £14,735 million (rounded to £14.7 billion). This reflects an increase of 11%[footnote 13] from last year’s study (£13.2 billion). This figure is estimated using:
-
Revenue figures available for dedicated (pure-play) cyber security firms that publish annual accounts
-
Revenue figures available for diversified cyber security firms (multiplied by the estimate of the proportion of the firm’s activity related to cyber security, typically based upon headcount or reported proportions in annual accounts or survey responses)
-
Estimated cyber security revenue within the cyber sector survey (for most recent financial year)
-
Where gaps exist, employment has been sourced or estimated, with revenue estimated using ‘revenue per employee’ (estimated by size using known data) multiplied by ‘number of employees’ to provide an estimated revenue figure on a firm-by-firm basis. These modelled estimates are subject to wider variance than figures drawn directly from company accounts.
This revenue estimate relates to revenue attributable to cyber security activity only. The following subsections set out revenue by size, revenue by size and dedicated/diversified categorisation, and revenue by key company offer. Please note that as the analysis was undertaken in late 2025, we use the most recent financial year reporting data where possible, which means that much of the revenue will have been achieved through work delivered and billed in 2024 (e.g., if a company has a financial year ending March 2025, those accounts will reflect billed work from April 2024 – March 2025).
Revenue by firm size
We estimate that the majority (£10.4 billion, 70%) of all UK cyber security revenue is earned by large firms (which further demonstrates the earning power of these firms given that they reflect 9% of all market providers). This includes several very large firms in telecommunications, aerospace, defence and security, and consultancies for which the size and scale of their respective cyber security product and service divisions reflect a considerable proportion of the wider market. Analysis of these 240 large providers also highlights that:
-
153 large firms are UK headquartered with estimated UK cyber security revenue of £6.1 billion
-
87 are international firms (headquartered outside of the UK) but have a registered presence in the UK market with estimated UK cyber security revenue of approximately £4.2 billion
Medium firm revenues have sustained their revenue share in relative and absolute terms, at 19% (compared to 21% last year) with £2.9 billion generated in the last 12 months.
Small firms have encouragingly increased revenues over this period (from £790 million to £1,269 million). The average cyber security related revenue among small firms has increased from approximately £2 million in the previous study (2025) to £2.5 million in the last 12 months (an average increase in revenue by approximately 25% among small firms). Further, we estimate that micro firms have generated £251 million in this period.
Figure 4.1: Total cyber security revenue by size of firm
| Large | £10,363M |
| Medium | £2,852M |
| Small | £1,269M |
| Micro | £251M |
Source: Perspective Economics (n=2,603)
Segmentation of revenue by both size and by whether the firm is understood to be ‘dedicated’ or ‘diversified’ also provides an overview of which firms are driving the revenue within the sector.
This highlights that ‘diversified’ firms continue to generate significant revenues through their cyber security offer. However, for Small and Medium Enterprises (SMEs) including micro firms, dedicated cyber security firms generate the greatest proportional revenue (i.e., c. 83% of revenues for each of the SME categories[footnote 14]).
Figure 4.2: Total cyber security revenue by size by dedicated / diversified status
| Size | Dedicated | Diversified |
|---|---|---|
| Large | £4,748M | £5,614M |
| Medium | £2,307M | £546M |
| Small | £1,119M | £150M |
| Micro | £221M | £30M |
Source: Perspective Economics (n = 2,603)
Review of firm level cyber security related revenue also highlights that the UK market has:
-
Approximately 32 large, diversified ‘anchor’ firms generating over £50 million in cyber security revenues (up from 28 last year). Although cyber security may often represent a small proportion of their overall business (for example, a multinational consultancy with £1 billion in total revenue and a £50 million cyber practice), these firms account for a substantial proportion of the UK cyber sector’s total revenue.
-
A significant growing middle market: There are now 241 firms (an increase from 219 in 2025, and more than twice the figure of 105 firms in 2024) that we have identified as providers of cyber security with over £10 million in annual revenues.
Further, segmentation of revenues by size and by those companies that either provide (as a core role) cyber security products or services is set out in Figure 4.3 below.
Overall, service providers including Managed Service Providers (MSPs) and Managed Security Service Providers (MSSPs)[footnote 15] are generating approximately £8.4 billion in cyber security related revenues (up from £7.4 billion last year). The revenue of product companies has also increased to c. £6.4 billion (up from £5.6 billion last year).
Figure 4.3: Total cyber security revenue by size and by offering
| Offering | Large | Medium | Small | Micro | Total |
|---|---|---|---|---|---|
| Services (including MSSPs) | £6,087M | £1,328M | £768M | £200M | £8,383M |
| Product | £4,276M | £1,524M | £501M | £63M | £6,364M |
Source: Perspective Economics (n = 2,603)[footnote 16]
4.2 Estimated employment
We estimate that there are 69,589 Full Time Equivalents (FTEs) working in a cyber security related role across the 2,603 cyber security firms identified.
This reflects an increase of 3% (up from 67,299 last year) in employee jobs within the last 12 months. This growth is the lowest recorded growth rate in employment within the sector since this study began in 2018 and suggests a significant softening in workforce growth. We set out estimated cyber security sectoral employment by year in Figure 4.4, as set out within previous sectoral analysis reports.
Figure 4.4: Cyber security employment (annual estimates)
| 2020 | 46,683 |
| 2021 | 52,727 |
| 2022 | 58,005 |
| 2023 | 60,689 |
| 2024 | 67,299 |
| 2025 | 69,589 |
Source: Perspective Economics
Factors shaping employment and workforce activity are explored further in the annual DSIT Cyber Security Skills in the UK Labour Market research.
Company level employment is initially estimated at the registered office location level (i.e., this suggests concentrated employment within Greater London and the South East is 72% of the UK figure). As a result, this has the effect of underestimating employment for the other regions, because employers often have employees across the UK. As such, in Figure 4.5, we provide the estimated employment breakdown by region. This estimate draws upon Perspective Economics modelling[footnote 17] of key regional employers, and regional cyber security workforce estimates. These are explored in further detail in the annual DSIT Cyber Security Skills in the UK Labour Market research, but include assessment of regional workforce roles, multiple office locations, regional market intelligence, vacancy data, and review of wider estimates such as Annual Population Survey / Labour Force Survey.
Figure 4.5: Estimated cyber security employment by region
| Region | Estimated | Registered |
|---|---|---|
| London | 30% | 49% |
| South East | 13% | 23% |
| North West | 10% | 7% |
| South West | 9% | 5% |
| West Midlands | 8% | 3% |
| Scotland | 7% | 2% |
| East of England | 7% | 5% |
| Yorkshire and The Humber | 5% | 2% |
| Northern Ireland | 4% | 1% |
| East Midlands | 4% | 1% |
| Wales | 3% | 1% |
| North East | 3% | 1% |
Source: Perspective Economics (n = 69,589 FTEs, estimate)
Analysis of estimated cyber security employment by company size (Figure 4.6) demonstrates that, in line with last year’s findings, most cyber security employment remains concentrated within large firms (62%).
Based on review of company level data, we estimate that the average size of a cyber security team within the sector has reduced since last year’s study, from 31 staff to 27 staff. Further, the average size of a cyber security team within large enterprises (firms with over 250 employees) has reduced from 204 cyber security staff in the previous study to 180 staff (an average reduction of 12%) potentially highlighting workforce efficiencies throughout some of the largest cyber security employers in the market. As set out in Section 4.3, this has resulted in higher levels of reported productivity (as measured through Gross Value Added) per employee within the sector.
Figure 4.6: Estimated cyber security employment by size of firm
| Large | 43,310 |
| Medium | 15,871 |
| Small | 6,897 |
| Micro | 3,511 |
Source: Perspective Economics (n=69,589)
Figure 4.7 sets out employment segmented by ‘Dedicated’ and ‘Diversified’ firms. In contrast to the previous year, the latest data suggests that dedicated cyber security firms are driving the majority of employment growth. Dedicated firms added an estimated 2,100 FTEs (+5%), compared to fewer than 200 (<1%) in diversified firms. We estimate that 60% of sectoral employment takes place within dedicated firms.
Figure 4.7: Estimated cyber security employment by dedicated / diversified
| Dedicated | 41,872 |
| Diversified | 27,717 |
Source: Perspective Economics (n=69,589)
Figure 4.8 also sets out cyber security related employment segmented by company core offering. Just under two-thirds (61%) of employees work within a company that primarily offers cyber security services or managed services, compared to 39% that work primarily within a product environment.
In previous years, the number of cyber security staff working within product companies had increased (from 15,278 in 2021, 33% of cyber security staff) to 23,952 FTEs in last year’s report. This trend has continued, growing to 27,164 FTEs (39% of cyber security staff), particularly as firms seek to develop products or integrate tooling into platforms for end-customer use.
Service and MSSP related cyber security employment has effectively stabilised at 42,425 FTEs[footnote 18] (from 42,232 last year), after growing 14% in the previous year (2024). This suggests a potential cooling down in service related employment. Further, this means that most of the employment growth within the cyber security sector captured within the study over the last 12 months has been driven by product-based firms.
As set out in Figure 4.8, cyber security product firms typically operate with larger teams than their service counterparts, with an average of 37 FTEs compared to 23 for services, and a median of 5 FTEs for product firms compared to 2 for services. This may reflect the prevalence of smaller independent consultancies and advisory practices within the service segment.
Figure 4.8: Estimated cyber security employment by offering
| Services (including MSSPs) | 42,425 |
| Product | 27,164 |
Source: Perspective Economics (n=69,589)
4.3 Estimated Gross Value Added (GVA)
Gross Value Added (GVA) is used as a measure of productivity (at a firm level, or above). It captures the sum of a firm’s Gross Profit, Employee Remuneration, Amortisation and Depreciation. In this respect, any increase in GVA can highlight an improvement in the performance of a firm or a sector, as evidenced through higher profitability or enhanced earnings.
We estimate that within the most recent financial year, cyber security related GVA (for the 2,603 firms) has reached £9.1 billion (£9,131 million). This is a significant increase of £1.3 billion (+17%) since last year’s report from £7.8 billion.
Figure 4.9 sets out an overview of GVA (compared to revenue) by size of firm. Overall, this data suggests an increased GVA-to-turnover ratio of 0.62:1 (i.e., for every £1 of revenue the sector generates, 62p in direct GVA is generated, compared to 59p last year and 54p in the prior year). This suggests increasing levels of productivity within the cyber security ecosystem.
Table 4.2 also sets out the estimated GVA per employee at approximately £131,200 per employee. This is an increase of 13% from the previous year’s estimate of £116,200). GVA per employee provides an estimate of labour productivity in the sector, as it typically captures remuneration and profitability.
Figure 4.9: Total cyber security revenue and GVA by size of firm
| Size | Estimated Revenue | Estimated GVA |
|---|---|---|
| Large | £10,363 million | £6,459 million |
| Medium | £2,852 million | £1,744 million |
| Small | £1,269 million | £728 million |
| Micro | £251 million | £200 million |
Time-series analysis
The table below sets out the key metrics for the cyber security sector, as tracked by each sectoral study since 2020.
Table 4.1: Key sector metrics (since 2020)
| Year | Number of Firms | Change | Employment | Change | Revenue | Change | GVA | Change | Investment (Dedicated) | Change |
|---|---|---|---|---|---|---|---|---|---|---|
| 2020 | 1,483 | +21% | 46,683 | +9% | £8,878m | +7% | £4,003m | +6% | £821m | +169% |
| 2021 | 1,838 | +24% | 52,727 | +13% | £10,146m | +14% | £5,326m | +33% | £1,013m | +23% |
| 2022 | 1,979 | +8% | 58,005 | +10% | £10,462m | +3% | £6,228m | +17% | £302m | -70% |
| 2023 | 2,091 | +6% | 60,689 | +5% | £11,859m | +13% | £6,450m | +4% | £271m | -10% |
| 2024 | 2,165 | +4% | 67,299 | +11% | £13,234m | +12% | £7,820m | +21% | £206m | -24% |
| 2025 | 2,603 | +20% | 69,589 | +3% | £14,735m | +11% | £9,131m | +17% | £184m | -11% |
| Estimated CAGR (2020–25)[footnote 19] | 11.9% p.a. | 8.3% p.a. | 10.7% p.a. | 17.9% p.a. | — |
4.4 Summary
The table below sets out the key findings regarding the economic contribution of the UK’s cyber security sector, as per this year’s analysis (2025).
Table 4.2: Summary of cyber sector economic contribution (2025)
| Size | Number of Firms | Estimated Revenue | Estimated GVA | Estimated Employment (FTE) | Revenue per Employee | GVA per Employee |
|---|---|---|---|---|---|---|
| Large | 240 | £10,363m | £6,459m | 43,310 | £239,268 | £149,136 |
| Medium | 343 | £2,852m | £1,744m | 15,871 | £179,713 | £109,891 |
| Small | 507 | £1,269m | £728m | 6,897 | £183,982 | £105,568 |
| Micro | 1,513 | £251m | £200m | 3,511 | £71,481 | £57,001 |
| Grand Total | 2,603 | £14,735m | £9,131m | 69,589 | £211,741 | £131,219 |
Source: Perspective Economics
5. Investment in the UK cyber security sector
Section summary: investment in the UK cyber security sector
-
In 2025, £184 million has been raised across 47 deals within dedicated cyber security firms. This represents a reduction of 11% compared to 2024 (£206 million across 59 deals), though the rate of decline has softened compared to the previous year.
-
In contrast to 2024, where medium sized firms accounted for 69% of investment value, 2025 has seen a shift towards smaller firms. Small firms accounted for the largest share by value (£84 million, 46%), and micro firms also saw increased investment (£43 million, 23%), suggesting growing investor appetite for earlier-stage opportunities.
-
London is the top performing region for cyber security investment (£103 million, 56%). In 2025, 37% of investment raised was across the 10 regions outside of London and the South East, above the levels seen in 2022 (25%) and 2023 (35%), though below the 49% recorded in 2024.
-
Investor consultations highlight AI security and post-quantum cryptography as key investment themes. Investors reported improved deal flow and founder quality but cited procurement barriers and the availability of UK growth stage capital as ongoing concerns.
5.1 Introduction
This section draws upon the Beauhurst platform which tracks announced and unannounced investments in high-growth companies from across the UK. Our team has matched Company Registration Numbers and Company Names identified within this current analysis with the platform to identify 1,077 fundraisings[footnote 20] associated with 318 cyber security companies. This chapter focuses on investment activity within the full year of 2025 (1st January – 31st December), and typically explores investment raised by dedicated cyber security firms.
5.2 Investment to date
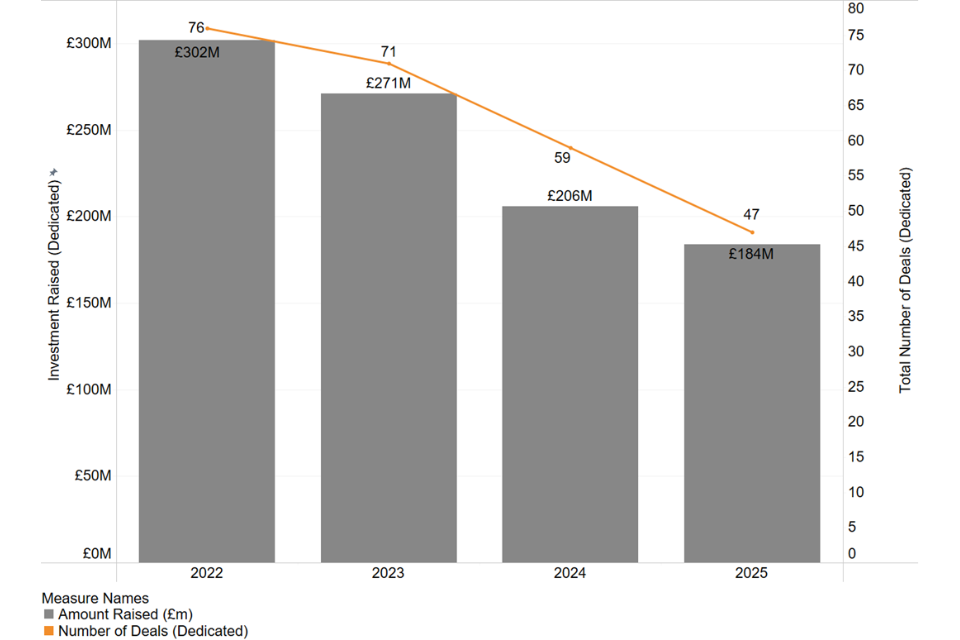
The investment timeline (Figure 5.1) demonstrates that 2025 has remained challenging for cyber security investment compared to previous years. This includes £184 million raised across 47 deals within dedicated cyber security firms.
As set out with the previous report, since 2022, external investment into private firms has reduced across sectors, as interest rates have risen, and as firm-level valuations have been revised. The Beauhurst State of UK Investment H1 2025 Update[footnote 21] highlights that, for example, the amount raised by UK private companies across all sectors in H1 2025 (£8.6 billion) is 34% lower than that raised in H1 2024 (£13.1 billion). The research conducted by Beauhurst notes that it is “increasingly clear we may be settling into a lower baseline for investment activity. The sharp peaks of previous years, including the post COVID-19 investment boom in 2021 and 2022, have given way to a flatter, more cautious landscape.”
As shown in Figure 5.1, investment levels into the UK cyber security sector have reduced year on year since 2022, and this has continued into 2025. We estimate there has been a reduction in the overall investment raised by UK dedicated cyber security firms in the most recent year (reducing from £206 million in 2024 to £184 million in 2025, a decrease of 11%). However, this is a softer decline than seen between 2023 and 2024 (a decrease of 24%) which may indicate some levelling off in activity. Further, this has been raised across 47 investment deals, with a range of investors still highly engaged with the sector, particularly among domestic funds, such as Osney Capital’s Fund 1[footnote 22], a cyber security specialist seed fund focused on early-stage UK cyber security. Section 5.5 explores some of the views among the investment community.
Figure 5.1: Total external investment
Source: Perspective Economics analysis of Beauhurst data
5.3 Investment by location
Figure 5.2 sets out an overview of investment performance within cyber security by UK region, with respect to value and volume of investment.
In 2025, London is the top performing region for cyber security investment, with £103 million raised (56%) across 22 deals. In London, notable fundraisings this year include Inforcer (£26 million raised in July 2025 to help MSPs standardise Microsoft 365 security policies), Maze (launching with $25 million (£18.4 million) in Series A and $6 million prior investment to scale AI cloud security agents). Yorkshire and the Humber also saw the second highest value of activity (£23 million), via a deal driven by Optalysys, which builds photonic computers for secure encrypted data processing. Further, Sitehop (based in Sheffield, with a registered address in London) secured £7.5 million in October 2025 to help ‘future-proof networks against quantum threats’.
Further, the data highlights some encouraging activity across the regions in the UK. The South East recorded 6 deals worth £12.8 million, including Cybaverse (£5 million) and Adarga (£4.3 million), while the North West saw 7 deals totalling £10.5 million, with firms such as Zally (£2.8 million) and usecure (£3 million) securing funding. Scotland also attracted £7.3 million across 3 deals, notably Approov’s £5 million Series A for mobile app security.
London and the South East collectively account for 28 deals (60% of the UK total). However, 2025 continued to see investment activity spread across UK regions, with deals recorded in the South West (Blueskytec, £1.5 million), West Midlands (SecureCloud+, £5 million), and North East (GoDefend), £250,000). However, given the reduction in overall number of deals among dedicated cyber security firms at a UK level, some smaller regions had reduced, or no investments were identified within the Beauhurst investment data.
Increasing access to investment across the regions remains a key tenet of national cyber security and economic strategy, as set out in the Industrial Strategy (2025). In 2025, 37% of investment raised was across the 10 regions outside of London and the South East. Whilst this is lower than the 49% recorded in 2024, it remains above the levels seen in 2023 (35%), 2022 (25%), and significantly higher than the 9% recorded in 2021. This suggests that regional investment activity, supported by schemes such as Cyber Runway and regional investor networks, continues to broaden access to capital for cyber security firms across all regions.
Figure 5.2: Total investment by region (2025)
| Region | Amount Raised | Number of Deals |
|---|---|---|
| London | £103.2M | 22 |
| Yorkshire and the Humber | £23.4M | 1 |
| East of England | £19.6M | 2 |
| South East | £12.8M | 6 |
| North West | £10.5M | 7 |
| Scotland | £7.3M | 3 |
| West Midlands | £5.4M | 2 |
| South West | £1.6M | 2 |
| North East | £0.3M | 2 |
Source: Beauhurst
5.4 Investment by size
Figure 5.3 sets out the volume of investment by company size within the cyber security sector in 2025. This data suggests that in 2025:
-
Small firms (10 to 49 employees) raised £84 million (46%) across 18 deals
-
Medium sized firms (50 to 249 employees) raised £57 million (31%) across 10 deals
-
Micro firms (1 to 9 employees) raised £43 million (23%) across 19 deals
In contrast to 2024, where medium sized firms accounted for 69% of investment value, 2025 has seen a shift towards smaller firms. Small firms accounted for the largest share of investment by value, raising £84 million (46%) compared to £35 million (17%) in 2024. Micro firms also saw increased investment, raising £43 million (23%) compared to £29 million (14%) in 2024. This suggests growing investor appetite for earlier stage opportunities, particularly in emerging areas such as post-quantum security and AI security.
Figure 5.3: Total investment by company size (2025)
| Medium (50-249 employees) | £57M |
| Small (10-49 employees) | £84M |
| Micro (1-9 employees) | £43M |
Source: Beauhurst
5.5 Investor views
Across the investor consultations undertaken by Ipsos in late 2025, investors were also asked about their main criteria for investing in cyber security businesses in the UK, the role of AI in cyber security, their view on the UK as a ‘destination’ for cyber security investment (including regional and national considerations), changes over the last year and how they expect the landscape to develop, and any other feedback on where additional support would help to catalyse further investment. We set out some key feedback below. Please note that this is a small sample, covering indicative sentiment. It is not considered representative of the full investment community but does provide insight into key areas.
Market outlook and investment criteria
Several investors, particularly at angel and pre-seed levels, reported an uptick in deal flow compared to 2024, with an increase in potential investment opportunities compared to the previous year, and improved assessment of long-term growth opportunities. AI has been reported as a key component of investment theses, both for AI-powered cyber security solutions and for securing AI systems directly. However, investors noted that they were carefully scrutinising AI claims to distinguish genuine innovation from more generic use cases.
“We’re seeing no shortage of deal flow, with 3 or 4 companies [reviewed] every couple of weeks.” — Angel Investor
“The prices for the sector have gone up. I think there’s people getting more excited about [cyber] again and multiples are up.” — Venture Capital Investor
“Every single company I meet now has some sort of AI story. You can’t get away from it. From a sector perspective, it creates new opportunities for new companies to be disruptive to established players.” — Venture Capital Investor
“We spend quite a bit of time, particularly if companies are saying they’re using AI within their products, to really get under the skin of that. Is that genuine innovation or are they just putting a skin on a large language model?” — Angel Investor
Key investment areas identified within consultations included:
-
AI security: Agentic AI (creating new risk categories), securing AI workloads, monitoring AI use, and explainable AI
-
Quantum and post-quantum cryptography: Heightened interest following NCSC guidance on migrating to post-quantum technology, though investment timelines remain uncertain
-
Market Consolidation: Private equity interest in bundling MSSPs and niche solutions into direct platforms
-
Recovery and incident response solutions driven by high-profile breaches
-
Hardware security and semiconductor security, including memory safety at chip level
“Agentic AI is a whole new set of risks and family of risks that we’re not used to dealing with. When we talk about agents, we’re talking about groups of systems with different accesses to data that can tell each other to do things. I would say that is a 2025 new problem.” — Venture Capital Investor
“Post-quantum cryptography is now becoming more urgent. In the last 12 months the NCSC have published their guidance around migrating to post-quantum technology ahead of Q-Day.” — Angel Investor
Innovation pipeline and early-stage support
The UK’s innovation ecosystem was viewed positively, with investors noting a significant improvement in the quality of founders. Universities remain central to the ecosystem, and increasing specialisation within cyber security has created more investment opportunities. Government-backed accelerator programmes, particularly Cyber Runway and CyberASAP, were highlighted as valuable contributors to the pipeline.
“In the last 12 months, there’s been a big step up in quality of entrepreneurs looking at starting cyber businesses…in 2025, the number of really great early companies that I’ve met has been great.” — Venture Capital Investor
“Innovation happens in many places across the UK. From a university perspective, we’ve seen quite a bit come out of the CyberASAP programme.” — Angel Investor
Government role and market development
Government support for the early-stage ecosystem was valued, with investors highlighting programmes such as CyberASAP and deployment of capital through the National Security Strategic Investment Fund. Investors encouraged continued and expanded support in this area.
However, investors identified procurement as a significant barrier. Government procurement rules and requirements were seen as providing some obstacles for smaller cyber security SMEs to grow. Investors would like to see the UK government buy more from cyber start-ups.
“[Government] need to open that space up for those SMEs to succeed, which means changing how they engage with their suppliers… actually, we’re going to give our people the freedom to engage with the right suppliers on set terms and trust them to execute on that.” — Venture Capital Investor
“We want to be doing more cyber investing. We’re finding it hard to work out where the best place to play is partly because of the funding journeys that they go on and partly because of the later stage markets. It’s a sector that I think has enormous potential. It’s just we collectively need to find a better way to unlock it, to make sure that UK innovation is funded in the UK rather than snapped up at an early stage.” — Venture Capital Investor
Market challenges and funding environment
The investment landscape has faced uncertainty, with investors discussing macroeconomic and policy factors. Some investors advocated for more strategic deployment of grant funding, particularly focusing on initial product development or commercial progress. A key concern raised was the availability of growth capital in the UK. Investors cited challenges with UK public markets and the availability of private equity at later stages. A related point was a need to promote visible role models for building large UK cyber security companies.
Talent gaps in go-to-market functions were also highlighted. The UK was described as strong in technical talent but weaker in sales capability, with top commercial talent often attracted to the US market.
“The UK public markets need to invest in it. The ability to raise real growth capital within the UK is what will really enable some of these businesses to go big.” — Venture Capital Investor
“I think the market is maturing slightly. Certainly, if I go back 5, even 10 years, there were very few people who are good at selling cyber security. I think there are more now, but they’re still few and far between.” — Venture Capital Investor
Regional development and investment distribution
Investors reported continued and strengthening regional diversity in the cyber ecosystem. Belfast, Cheltenham, Edinburgh and Manchester were highlighted as particularly strong hubs. This has been stimulated by universities, investment in local ecosystems (with CyberASAP cited), and remote working patterns. However, London continues to exert gravity for cyber firms as a source of capital and proximity to major customers according to respondents.
“There has been far more diversity from a geographic perspective. I’d say almost everywhere has grown, at least from the deal flow we see. When I first started, we were heavily dependent on Golden Triangle relationships and I say that’s definitely not the case at the moment.” — Venture Capital Investor
“Probably mostly linked to the universities, their investment into cyber and the ecosystem’s built up around that. My view is that Belfast as a cyber hub is mostly a function of a concerted effort to develop talent and support companies in that city.” — Venture Capital Investor
“It’s just the natural course of growth and business and pursuing opportunity means that you have to be in close proximity to your customers and your sources of private capital… and that means being in London.” — Venture Capital Investor
International positioning
Investors noted increasing interest from international investors in UK cyber security companies, with one investor commenting that there is an unprecedented amount of funding available globally. The UK is seen as attractive due to its rule of law, connectivity, and relatively stable government.
There were mixed views on UK cyber companies moving to the US. Some felt the UK needs to improve at commercialising innovation; others viewed US expansion as inevitable given market size, noting that companies often maintain significant UK presence with UK founders and investors.
“There’s more investment coming into the UK. Particularly in the US there’s lots of people looking at the UK ecosystem. There’s an opportunity for us to attract later stage investment and other investment into our companies.” — Venture Capital Investor
“From a technology standpoint, where the UK sits is as a potential world leader. Constantly time and again the UK innovates and the US commercialises. We need to figure out how do we commercialise as opposed to just selling it to the US.” — Venture Capital Investor
“The risk appetite [in the UK] is typically less than compared to the US… That is a frustration, but it’s an inevitability, I guess, when the sums of money and the risk appetite is greater over there. It’s not necessarily a bad thing. Those companies that are taking US investment maintain a fairly significant presence in the UK.” — Angel Investor
“You can service both Europe and North America from the UK. It’s of a certain quality and threshold but it’s still cheaper than the US. The outsourcing potential from those markets is massive.” — Venture Capital Investor
5.6 Wider investment in cyber security
Whilst venture capital investment provides a useful tracker for market development, the cyber security sector has demonstrated wider investment activity through other forms. This section explores the role of private equity, mergers and acquisitions, public markets, and strategic partnerships. We set out some examples of key investments identified in 2025 below.
Private equity and growth capital
Private equity continues to play an important role in market development, particularly in consolidating and scaling established cyber security providers. Globally, according to Capstone Partners[footnote 23] research, cyber security merger and acquisition activity has continued to ‘operate at pre-pandemic levels’ with a slight downtick year-over-year. Kroll[footnote 24] also estimates that total year-to-date deal value in cyber security global M&A activity reached $63.3 billion by Q3 2025. Related to the UK market, we find deals such as:
-
Following Darktrace’s acquisition by Thoma Bravo in October 2024 for $5.3 billion, Darktrace has expanded its capabilities by acquiring 2 specialist firms, including Cado Security[footnote 25] (a London and Bristol-based cyber investigation and response solution provider for hybrid and cloud security) and Mira Security[footnote 26] (a US and South Africa based provider of network traffic visibility solutions).
-
Sophos (also acquired by Thoma Bravo in 2020) completed its acquisition of Secureworks[footnote 27] (valued at approximately $859 million) from Dell Technologies in February 2025. (Sophos reports that this has made Sophos the ‘leading pure-play cybersecurity provider of Managed Detection and Response (MDR) services, supporting more than 28,000 organisations of all sizes worldwide’.)
-
UK ‘mid-market’ private equity firm Limerston Capital announced its acquisition of Aristi[footnote 28] in December 2025 to its Xypher platform, bringing the Aristi, CyberCrowd, DigitalXRAID, and Inta Forensics brands under one offering with over 150 experts specialising in managed SOC, MDR, pen-testing, digital forensics, and OT security.
-
In December 2025, Aspire Technology Solutions (based in Gateshead) announced it had secured £200 million of new investment led by LDC to accelerate expansion and support an acquisition strategy. Since initial funding in 2022, it reports ‘increased revenue by 158% and headcount by 55%’, with plans to reach £100 million in revenue by 2030.[footnote 29]
Mergers, acquisitions and rebrands
As covered in Section 2.2 and within the qualitative findings, 2025 has seen a number of domestic mergers, acquisitions, rebrands and expansions. This is often driven by the need for customers to have access to a wide range of capabilities from managed providers, and a push for market growth, particularly among mid-market firms. We set out some examples below:
-
Managed services and cyber security provider Redsquid announced 6 acquisitions in 2025, including UK-based SOC provider Cyberseer[footnote 30]
-
Irish-headquartered Ekco expanded its UK presence through the acquisition of Manchester based Predatech in May 2025. This reflects Ekco’s fourth acquisition in 18 months.[footnote 31]
-
In April 2025, Acora announced the acquisition of Hydras, specialists in AWS security.[footnote 32]
These deals highlight a wider investment landscape where different forms of capital and commercial partnerships can support growth and expansion of the UK cyber security sector. The continued interest from international investors and strategic buyers, combined with domestic consolidation activity, indicates sustained confidence in the UK cyber security sector’s growth potential. Notable international acquisitions in 2025 included:
-
1Password (based in Canada) acquired Trelica (a UK-based SaaS access management platform) in January 2025. The deal was reported to represent 1Password’s largest acquisition by company revenue.[footnote 33]
-
In November 2025, Huntress announced its acquisition of London-based Inside Agent[footnote 34], a platform specialising in ‘hardening Microsoft 365 environments against external and insider threats’ to strengthen its Identity Security Posture Management solution.
While such investment demonstrates the quality and attractiveness of the UK cyber sector, it demonstrates a clear need to support early-stage firms at the start of the growth pipeline and the delivery of infrastructure to help UK firms scale domestically and secure capital.
This is particularly important given the strategic nature of cyber security capability and the need to maintain sovereign capacity in key technology areas. This highlights the continued need for policy to help strengthen domestic growth pathways while maintaining the benefits of attracting international investment, collaboration, and market access.
6. Supporting growth of the sector
Section summary: supporting growth of the sector
-
Public procurement of cyber security products and services has strengthened further in 2025, with 967 contracts awarded to the value of £1,507 million. This represents a 62% increase in contract value compared to 2024. Since 2019, the total value of cyber security public procurement has grown almost six-fold.
-
UK cyber security exports have grown from approximately £7.2 billion in 2023 to £8.6 billion in 2024, an increase of 19%. Cyber security now accounts for 67% of total UK security export value (£12.9 billion). Europe remains the largest regional export market (55%).
- Government regulation and supply chain requirements continue to drive cyber security adoption. The Cyber Security and Resilience Bill and international frameworks such as NIS2 are shaping buyer behaviour, particularly across critical national infrastructure sectors.
-
Increasing SME adoption of cyber security remains a significant growth opportunity and a persistent challenge. Stakeholders reported that ‘do nothing’ remains the biggest competitor, with cost concerns and limited awareness continuing to constrain uptake among smaller organisations.
- In the business survey, 87% of cyber security businesses said they engaged with at least one other type of organisation in a cyber security activity, with 68% attending networking or meetup events.
6.1 Introduction
This section sets out some of the current initiatives within the UK that support the growth of the cyber security sector. In addition, the Ipsos survey (n = 230) asked cyber security businesses about their key collaborations. The research team also carried out 5 consultations with cyber security investors to explore their views on the health and potential of the cyber security sector in the UK.
6.2 Recent investments and support initiatives
The National Cyber Strategy sets out how the government has sought to support the growth of the cyber security sector, through a blend of direct investment in accelerators and growth initiatives, skills and profession support, investment in regions and clusters, and as a key buyer of cyber security products and services. Some of these initiatives are summarised below:
Growing the sector:
- The Industrial Strategy was published in June 2025 alongside an allocation of up to £16 million for cyber innovation, including £10 million over 4 years for the CyberASAP programme targeting over 25 academic spin-outs by 2030 and £30 million in additional private investment, and £6 million for the next phase of Cyber Runway, which supports innovators to launch, grow and scale their business.
Encouraging new entrants into the cyber security sector:
-
The CyberFirst schools programme and bursary scheme supports undergraduate students and is delivering hundreds of individuals, with work experience, into the cyber workforce every year. The programme is now being extended as part of the broader TechFirst programme.
-
The Cyber Explorers programme has engaged approximately 142,000 young people[footnote 35] aged 11-14 in the last 3 years.
-
There are now several cyber apprenticeship standards that have been designed by industry and cyber (as set out within the DSIT Cyber Skills in the UK Labour Market research).
Professionalising the cyber security workforce:
- The UK Cyber Security Council is a world-first professional authority for cyber security. It sets clear and consistent professional standards, and now has over 1,000 practitioners on its cyber security professional register.
6.3 Sector engagement
In the business survey, 87% of cyber security businesses said they engaged with at least one other type of organisation, with 68% attending meetup events, 58% engaging with another cyber security business, 38% with a regional cluster, 37% engaging with a university or higher education provider, or engaging with other public sector bodies. These engagement levels remain strong, similar to last year.
Figure 6.1: Businesses that collaborated with at least one of the following organisations in a cyber security activity
| Any networking or Meetup events | 68% |
| Any other cyber security businesses | 58% |
| A regional Cyber Security Cluster | 38% |
| Any other public sector bodies | 37% |
| A university or other higher or further education provider | 37% |
| A regional Cyber Resilience Centre | 28% |
| Strategic Local Authorities | 19% |
| A Digital Skills Partnership (or DSP) or Local Skills Improvement Plans (or LSIP) | 13% |
| Any other organisations | 8% |
| Private sector / businesses | 4% |
| Certification bodies eg. IASME, ISACA | 3% |
| National Cyber Security Centre / NCSC / GCHQ | 2% |
| Tech UK | 1% |
| Charities / not for profit | 1% |
| None of these | 13% |
Source: Ipsos (n = 230)
6.4 Cyber security exports
In December 2025, the Department for Business and Trade published the updated UK Security Export Statistics (2024). This suggests that UK cyber security exports have grown from approximately £7.2 billion in 2023 to £8.6 billion in 2024, an increase of 19% in nominal prices. It is estimated that cyber security now accounts for 67% of total UK security export value (£12.9 billion).
Europe remains the largest regional export market for UK cyber security, accounting for £4.7 billion (55% of cyber exports), followed by North America (£1.7 billion) and Asia Pacific (£1.2 billion).
This research also finds that UK cyber security exports have grown consistently since 2020, more than doubling from £4.1 billion to £8.6 billion over the four-year period.
6.5 Public procurement
Public procurement plays a crucial role in the health of the cyber security sector, and for improving public sector engagement with innovative cyber security start-ups and techniques. This includes where cyber security firms can sell products, services, and solutions to public sector buyers such as central and local government, law enforcement and policing, NHS, schools etc.
In previous years, we have used Tussell data to identify cyber security related contract notices. For transparency, this measures the number and value of public contracts awarded to UK registered firms related to cyber security. It excludes the award of framework contracts as these can be difficult to identify exact government spending, where the contract value is the same as the framework maximum budget.
Figure 6.2 highlights the significance of public procurement in growing the UK cyber security ecosystem. The data for 2025 suggests that public sector demand for cyber security products and services has strengthened further, with 967 contracts awarded to the value of £1,507 million. This represents a 62% increase in contract value compared to 2024, alongside a small increase in the number of contracts (+3%). Since 2019, the total value of cyber security public procurement has grown almost six-fold, from £262 million to over £1.5 billion.
Figure 6.2: Cyber security contracts (value and volume)
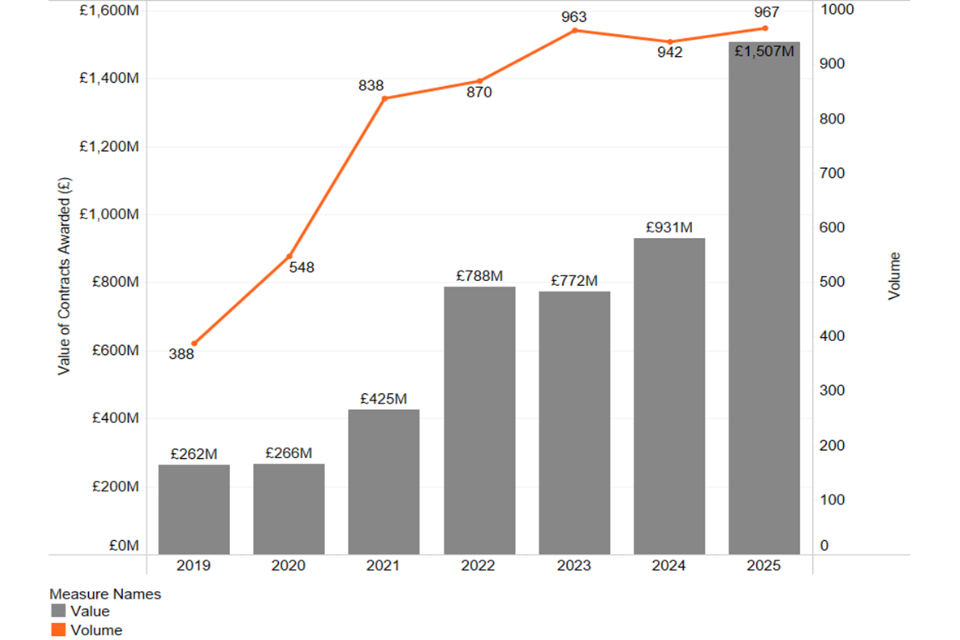
Source: Tussell (data source on UK government spend and contracts)
6.6 Sector views on market growth
This year’s research involved over 20 consultations with industry and investors regarding growth ambitions and routes to market. We highlight key qualitative findings below. Please note that this feedback represents indicative but non-representative sentiment from industry consultations and should be considered alongside other market indicators.
AI as a dual growth enabler
AI has emerged as the dominant theme in this year’s consultations, functioning as both a capability enhancer and a new market category. Cyber firms reported strong demand for AI-powered solutions (threat detection, automation, pen testing tools) whilst simultaneously seeing rapid growth in services to secure AI systems themselves.
The volume of AI-related work has also increased substantially. Firms reported a shift from isolated AI security engagements to a steady pipeline, with demand spanning penetration testing of AI applications, consultancy on AI security risks, and training on safe AI adoption.
“Over the past year and a half, we’ve had a number of clients come forward saying that they have an AI based application, something they’ve tried developing internally or something they potentially want to take to market. Can we do pen tests on it?” — Cyber sector firm, 1-9 employees
“We consult on [AI systems]. We test to see if we can bypass protections and guardrails. Last year we had one AI job. This year we’ve had, I reckon, between 14 and 15.” — Cyber sector firm, 1-9 employees
“We’ve added AI training as part of our portfolio and actually it’s our fastest growing segment.” — Cyber sector firm, 1-9 employees
Investors echoed this, noting that AI now features in virtually every pitch. However, they cautioned that not all AI claims represent genuine innovation and expect the emphasis on AI to normalise as the technology becomes more embedded.
“Every single company I meet now has some sort of AI story. You can’t get away from it. From a sector perspective, it creates new opportunities for new companies to be disruptive to established players.” — Venture Capital Investor
“The UK [cyber] sector is strong and where I think it will get stronger is in AI, because the UK generally is well positioned in AI in the data world. There’s a real opportunity to lead both in AI and AI security.” — Venture Capital Investor
Looking ahead, agentic AI was identified as an emerging risk category that will create new security requirements.
“Agentic AI, I think in the next two years the growth of AI to a generalist commercial opportunity is going to be huge.” — Cyber sector firm, 10-49 employees
High profile breaches potentially driving enhanced awareness and demand
High scale breaches at major employers such as Marks & Spencer and Jaguar Land Rover in 2025, together with the widespread disruption caused by the CrowdStrike software update, have been reported to have increased awareness of cyber risk. These incidents have focused attention on supply chain security, business continuity, and the need for resilience and recovery capabilities.
Cyber firms consulted reported that recovery and resilience solutions are now a distinct growth area, as organisations recognise the need to restore operations quickly following an incident.
“Ransomware remains hot in the headlines, and products framed to protect against this are faring well.” — Cyber sector firm, 50-249 employees
“From a proliferation of data and breadth of attack vectors, cyber is increasingly important. It’s a bit of a cliché, but you only need to look at all of the big consumer facing companies that have been hit over the last year or so… it’s front and centre for everyone right now.” — Venture Capital Investor
Government-backed initiatives shaping market demand
Both criminal and state-sponsored threats are becoming more sophisticated, particularly with the emergence of AI-driven threats and ongoing geopolitical tensions. This evolution is driving increased awareness and investment in security measures. The role of government guidance, particularly through the NCSC, was highlighted as crucial in driving market development. Against this backdrop, the Cyber Security and Resilience Bill aims to deliver a step change in the UK’s national security, making essential and digital services more secure in the face of cyber criminals and state actors. The Bill aims to secure better protections for businesses, with the ambition of reducing costs caused by downtime, increasing economic stability and reinforcing the UK’s position as a safe and trusted place to do business.
“The Cyber Security and Resilience Bill is now live and we’re certainly seeing that drive change in the critical national infrastructure sectors. That, combined with the increased threat landscape, means that CNI providers in particular are having to invest more into improving their cyber posture. That’s where regulation is driving demand.” — Angel Investor
“We’re looking at law firms because, in order to access legal aid budgets, the law firms need to have Cyber Essentials by the start of this month. So that was a big campaign for us to promote Cyber Essentials. And then what comes with that is selling all the add-ons.” — Cyber sector firm, 1-9 employees
“Regulation gives a clear demand signal and a compelling event that’s going to force enterprises, the potential customers for start-ups, to become buyers.” — Angel Investor
However, some stakeholders noted that regulation is only effective if enforced, and that many SMEs adopt cyber security measures primarily to satisfy contractual or regulatory requirements rather than from intrinsic motivation.
“I’d say 90% of the time, companies come to us to implement [cyber security measures] because they need it for some sort of government contract or because it’s a requirement to get additional work. It’s almost never because they want to improve cyber security.” — Cyber sector firm, 1-9 employees
The need to increase SME adoption
Increasing SME adoption of cyber security remains a significant growth opportunity — and a persistent challenge. Despite rising awareness following high-profile incidents, many firms reported that “do nothing” remains their biggest competitor. Cost concerns, particularly around auditing and certifications, continue to limit uptake.
“‘Do nothing’ is our biggest competition.” — Cyber sector firm, 50-249 employees
“Breaking into the small to medium sized enterprise market within the UK represents a huge potential opportunity. The problem that we’ve got is a large part of that market still believes it doesn’t need cyber security, but it absolutely does.” — Cyber sector firm, 50-249 employees
“We still are making the same mistakes. Even ten years after I started, it’s still seen as a nice to have thing [rather than need to have].” — Cyber sector firm, 1-9 employees
“People are running on very lean margins and they don’t think they’ve got what they need to spend potentially on cyber security.” — Cyber sector firm, 250+ employees
Some stakeholders suggested that government mandates, such as requiring Cyber Essentials for a broader range of contracts, could help shift behaviour.
“If you just said, ‘we want our supply chain suppliers to have Cyber Essentials as a base standard’, because it’s not expensive, most companies probably would easily put that in place.” — Cyber sector firm, 250+ employees
“Unless government mandates some form of cyber resiliency reporting for all organisations, the SME space is not going to get better.” — Cyber sector firm, 250+ employees
Market consolidation among managed services
The role of Managed Security Service Providers continues to expand, with MSPs increasingly incorporating cyber security into their offerings. Private equity investment is driving consolidation in this space, with larger providers acquiring specialists to broaden their capabilities.
“There’s a huge amount of money that’s going into the managed service provider space from private equity right now. Our view is that there will be a lot of consolidation that happens.” — Venture Capital Investor
“We’re seeing consolidation in certain areas, so in areas such as penetration testing, we’re starting to see private equity money come in and look to consolidate a number of the small niche companies.” — Angel Investor
This consolidation creates opportunities for specialist firms to exit, but some stakeholders raised concerns about the longer-term implications for smaller players and pricing dynamics.
“I don’t think [monopolisation] is a problem at the moment because there are so many vendors coming out now with different products. But at the same time, it does raise questions over whether the good vendors, which are adding more and more to their portfolio, might in fact push prices up.” — Cyber sector firm, 1-9 employees
Growth constraints
Alongside growth opportunities, stakeholders identified several factors constraining market development, including that:
-
Inertia and budget constraints remain the primary barriers. Many organisations, particularly SMEs, may not prioritise cyber security spend unless compelled by regulation or supply chain requirements.
-
Limited levels of funding for cyber security within public services was raised as a concern, with implications for both the security of public services and the market opportunity for cyber firms.
-
Some stakeholders expressed concern that government focus on AI may be overshadowing cyber security, and that organisations are prioritising AI adoption over addressing fundamental security issues.
“It’s great that everyone can shout about AI. But if the underlying fundamentals of security aren’t managed and certainly the government isn’t giving it the similar sort of air time, it is a concern of mine.” — Cyber sector firm, 1-9 employees
“This year just feels a bit flat, which is amazing when you consider what’s going on.” — Cyber sector firm, 250+ employees
7. AI and software cyber security
Section summary: AI and software cyber security
-
We estimate that there are 111 firms active and registered in the UK that clearly offer cyber security for AI systems as an explicit product or service offering. This represents an increase of 45 firms (+68%) since the previous baseline. Of these, 32 are specialist providers focused primarily or exclusively on cyber security for AI.
-
AI/ML model security (57%), AI security advisory and consulting (43%), and AI runtime and infrastructure security (41%) are the most commonly cited offerings. AI red teaming and penetration testing has emerged as a distinct service category (21%), and nascent areas such as agentic AI security (5%) and AI browser/endpoint security (5%) are responding to the increased rollout of AI agents in enterprise environments.
-
We estimate there are 1,141 firms active in the UK providing software security services, an increase of 181 firms (+19%) since the previous baseline. Of these, 108 are specialist software security providers. Overall, almost half (44%) of all cyber security providers in the UK appear to be actively involved in software security provision.
-
Application security is offered by the vast majority of software security providers (97%), followed by cloud and container security (76%) and secure development (74%). Supply chain security (34%) and DevSecOps (41%) are also growing areas of provision.
7.1 Introduction
In March 2025, the research team conducted an analysis of the market for AI and software cyber security products and services, aligned to the annual Cyber Security Sectoral Analysis. This chapter provides an annual update to these findings, exploring cyber security firms involved in:
-
Cyber Security for AI: Providers specialising in securing AI systems and applications. This typically includes firms focused on the security of AI systems (e.g. LLM security, model protection), and providers of advisory or implementation support for AI system security.
-
Specialist Software Security Providers: Firms with clear specialisation in software security provision, including Application Security (AppSec) testing and tooling, Secure Development lifecycle solutions, software vulnerability assessments, DevSecOps implementation, code and API security, and container and supply chain security solutions.
-
Wider Software Security Provision, where firms offer support for software security as part of a broader offering. This typically includes firms with the ability to provide AppSec capabilities as part of wider security services, code review, vulnerability assessment, and broader software security testing for clients.
This chapter provides an updated assessment of these segments. Please see the AI and software cyber security market analysis for the full definitions, scope and methodology used.
7.2 AI security
We estimate, based on updated research, that there are 111 firms active and registered in the UK that clearly offer cyber security for AI systems as an explicit product or service offering. This represents an increase of 45 firms (+68%) since the previous 2025 baseline identification of 66 firms, highlighting significant market growth over the past year.
We estimate that 32 of these are specialist providers focused primarily or exclusively on providing cyber security for AI, with a further 79 cyber security firms providing AI security capabilities as part of a broader offering.
The product and service data (as shown in Figure 7.1) highlights that whilst these providers primarily cover areas expected such as AI/ML model security and infrastructure protection, it also highlights the emergence of novel areas such as responding to agentic AI adoption, including AI agent identity and access security and dedicated AI security frameworks. Figure 7.1 explores the percentage of cyber security for AI providers that mention a product or service offering online that falls under at least one of the following categories.
This highlights the breadth of provision in relation to cyber security for AI. We find that several providers offer multiple solutions depending on customer requirements and AI use cases, and these continue to evolve and adapt to market need. Given the continued adoption of Large Language Models (LLMs) and generative AI, it remains unsurprising that most vendors (57%) mention AI/ML model security. AI security advisory and consulting (43%) and AI runtime and infrastructure security (41%) also feature prominently.
A notable development since the previous baseline is the emergence of AI red teaming and penetration testing as a distinct service category (21%), reflecting increased demand for adversarial testing of AI systems. Additionally, whilst nascent, agentic AI security (5%) and AI browser/endpoint security (5%) have emerged as new categories responding to the increased rollout of AI agents and GenAI tools in enterprise environments. This is expected to grow rapidly as agentic AI adoption accelerates.
Figure 7.1: Product and service ‘focus areas’ for cyber security for AI providers
| AI/ML Model Security | 57% |
| AI Security Advisory and Consulting | 43% |
| AI Runtime and Infrastructure Security | 41% |
| AI Red Teaming and Pen Testing | 21% |
| AI Browser and Endpoint Security | 5% |
| Agentic Security (Identity and Access) | 5% |
| AI Security Frameworks | 4% |
Source: PE analysis of 111 security for AI providers with identified web data (7 classification areas)
Location and scale
For cyber security for AI providers, we find a mix of domestic and international firms operating in the UK, with 47% of firms being UK headquartered and 40% of providers headquartered in the United States, with the remainder (14%) across the European Union, Israel, India, and Japan.
Review of UK locations for firms highlights continued concentration in London (59%) and the South East (14%). Regional clusters show some presence in the North West (8%), East of England (5%), and Yorkshire and The Humber (5%), with the data suggesting more limited distribution of cyber security for AI capability across other regions including Scotland, Northern Ireland, and the North East (1% each).
As with the baseline study, for the Cyber Security for AI firms registered in the UK, review of company accounts and wider trading data suggests that there is a relatively even distribution between large, medium, small and micro firms. However, we find the percentage of small and micro firms has increased from 43% in the previous year to 55% in this study, suggesting an emergence of new startups in the sector.
7.3 Software security
We estimate there are 1,141 firms active in the UK providing software security services, of which:
-
108 are specialist software security providers (i.e. they appear to exclusively focus on the provision of software security)
-
1,033 firms offer some form of software security solutions to their clients as part of a wider cyber security offering
This represents an increase of 181 firms (+19%) since the previous baseline of 960 firms, with growth in both specialist providers (up from 93 to 108, +16%) and wider provision (up from 867 to 1,033, +19%). Overall, we estimate that almost half (44%) of cyber security providers in the UK appear to be actively involved in software security provision or capability for their customers. For each capability area, firms were rated as having ‘Strong’, ‘Partial’, or ‘No’ relevance based on evidence of relevant products or services, use of recognised software security tools and methodologies, alignment or mention of relevant standards and methodologies, and evidence of implementation and expertise via client case studies. Each provider has been reviewed against the following areas of software security: Application Security, Cloud and Container Security, Secure Development, Code Security, API Security, DevSecOps, and Supply Chain Security.
As highlighted in Figure 7.2, the vast majority of providers (97%) offer some form of application security, followed by cloud and container security (76%), secure development (74%), code security (46%), API security (42%), DevSecOps (41%), and supply chain security (34%).
Figure 7.2: Software security provision (by Provider Count)
| Capability | Strong | Partial | None | Total |
|---|---|---|---|---|
| Application Security | 295 | 819 | 27 | 1,141 |
| Cloud and Container Security | 180 | 691 | 270 | 1,141 |
| Secure Development | 111 | 738 | 292 | 1,141 |
| Code Security | 94 | 435 | 612 | 1,141 |
| API Security | 108 | 372 | 661 | 1,141 |
| DevSecOps | 87 | 387 | 667 | 1,141 |
| Supply Chain Security | 47 | 342 | 752 | 1,141 |
Source: PE analysis of 1,141 providers
Location and scale
For specialist software security providers (n=108), registration data shows continued concentration in London (53%) and the South East (19%). Regional distribution remains limited, with the South West (9%, 10 firms) and North West (7%, 8 firms) representing other clusters outside of London and the South East. This represents a slight increase in London concentration compared to the previous baseline (49%).
Wider (partial) provision of software security (n=1,033) demonstrates a more distributed pattern. While London maintains the highest concentration (39%), there are substantial regional counts from the South East (16%), North West (8%), South West (8%), and East of England (7%). Every UK region continues to contain firms offering some form of software security provision, which remains beneficial from a market access perspective.
For specialist providers of software security, there is a relatively balanced size distribution. An estimated 37% of providers have a large or medium presence in the UK, suggesting a maturing specialist market that has developed over time.
In contrast, partial providers continue to show a skew towards micro enterprises, with 57% in this category (up from 52% in the previous baseline). This distribution may reflect the continued growth in IT consultancies, managed service providers, and wider cyber security firms that offer software security as part of their broader portfolio, particularly services such as application security testing and penetration testing.
7.4 Sizing estimates
The DSIT Cyber Security Sectoral Analysis (2026) estimates the annual revenue and employment of the UK’s cyber security sector each year. This report estimates the annual revenue of the sector at £14.7 billion with c. 69,600 Full Time Equivalent employees. This reflects a ‘best estimate’ by the research team, based upon agreed estimation techniques drawing on accounts data, survey findings, and web data.
Estimating revenue and employment specifically for Cyber Security for AI and Software Security sub-sectors presents additional methodological challenges. These segments represent emerging categories within the broader cyber security sector, comprising both large providers (requiring careful segmentation of relevant workforce) and smaller firms that fall below statutory reporting thresholds.
Drawing on available data and cross-referencing with ongoing DSIT Cyber Security Sectoral Analysis internal estimates, we can provide indicative estimates for AI and Software Security markets:
For cyber security for AI:
-
Dedicated specialist Cyber Security for AI providers (n=32) account for an estimated £69.4 million in revenue and 417 FTEs. This suggests employment growth of 51% since the previous study (277 FTEs) highlighting nascent but rapid growth.
-
The broader Cyber Security for AI provider base (n=111) employs over 171,000 people in total, with approximately 14,720 working in cyber security roles. The specific proportion focused on Cyber Security for AI activities cannot be determined from available data. However, we note this also reflects a 51% growth rate in cyber security related roles (from 9,740 to 14,720) given expanded coverage of AI security offering. Please note this does not mean these are new roles or AI related; but rather, reflects that AI security and wider AI assurance and governance is increasingly becoming embedded within the cyber security sector’s overall offering.
For software security:
-
Overall, we estimate that specialist software security providers (n=108) employ an estimated 8,570 FTEs specifically in cyber security roles, with the wider software security ecosystem (n=1,033) employing approximately 29,850 FTEs working in cyber security roles.
-
These figures represent growth from the previous baseline estimates of 7,960 and 19,940 FTEs for AI security and software security respectively. In total, approximately 38,420 cyber security professionals now work in companies with software security capability, suggesting that such capabilities are expanding across providers, particularly in application security testing and penetration testing.
As noted in the baseline study, these estimates should be treated as indicative rather than definitive, given the complex nature of segmenting revenue and employment in overlapping domains. This is particularly challenging when attempting to isolate Cyber Security for AI activities within larger organisations’ cyber security operations. Additional modelling and data collection would be required for more precise estimates, particularly regarding revenue attribution across service lines.
8. Regional snapshots
Introduction
Whilst this report focuses upon the cyber security sector across the entire UK, we set out snapshots[footnote 36] of the number of cyber security firms, offices, and estimated percentage of UK cyber security related employment.
East Midlands
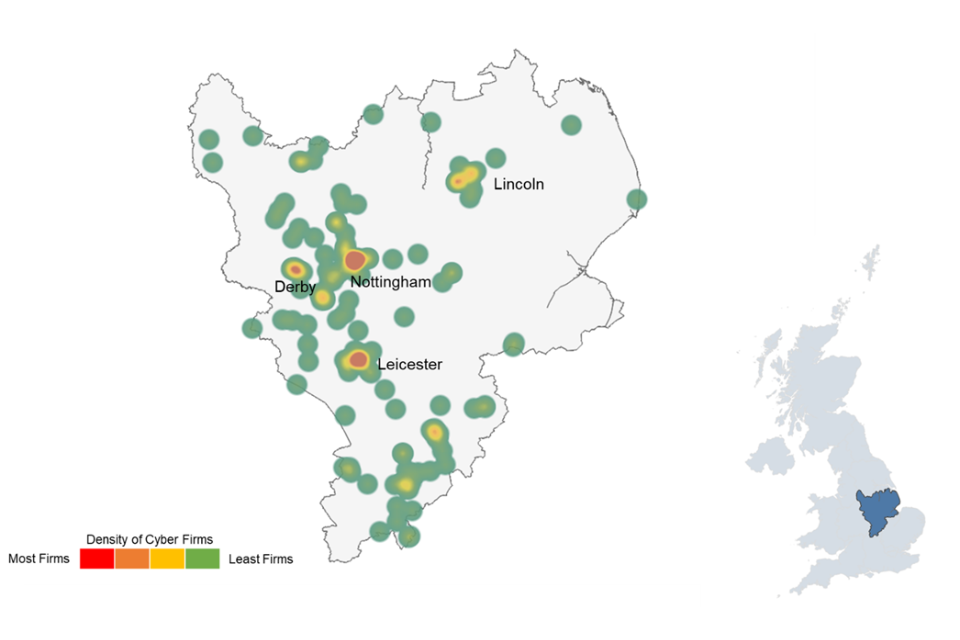
| Percentage of UK cyber security offices | Estimated percentage of UK based cyber security employment | Mean Advertised Salaries (2025) in core cyber security roles |
|---|---|---|
| 3% | 4% | £58,300 |
East of England
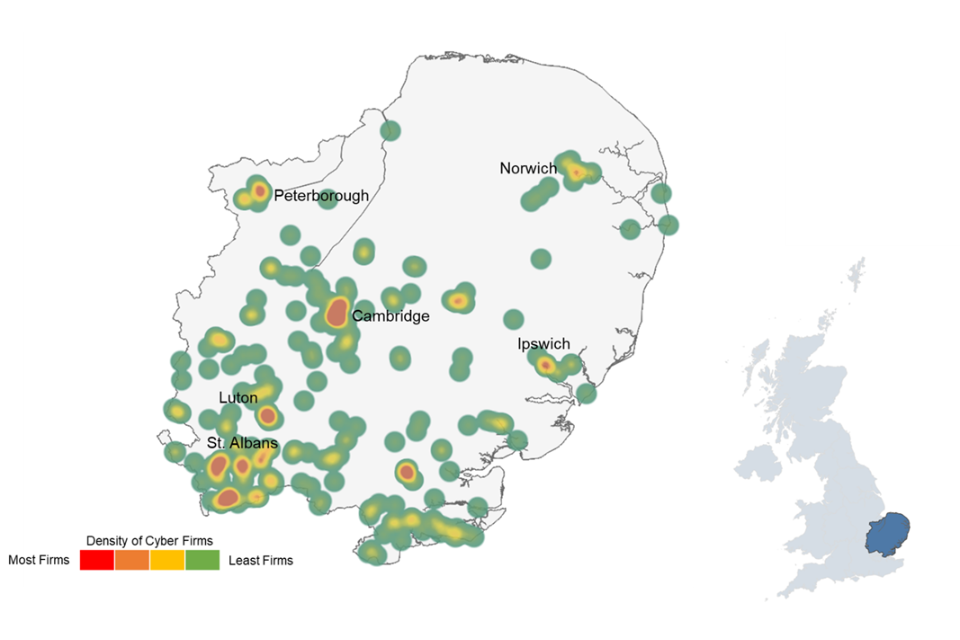
| Percentage of UK cyber security offices | Estimated percentage of UK based cyber security employment | Mean Advertised Salaries (2025) in core cyber security roles |
|---|---|---|
| 7% | 5% | £56,300 |
Greater London
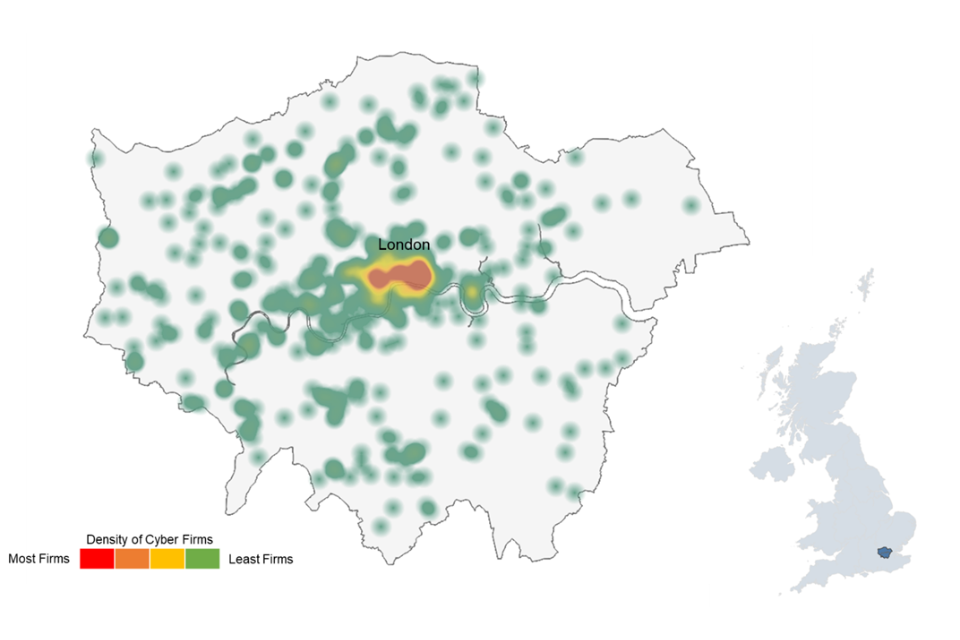
| Percentage of UK cyber security offices | Estimated percentage of UK based cyber security employment | Mean Advertised Salaries (2025) in core cyber security roles |
|---|---|---|
| 33% | 30% | £70,200 |
North East
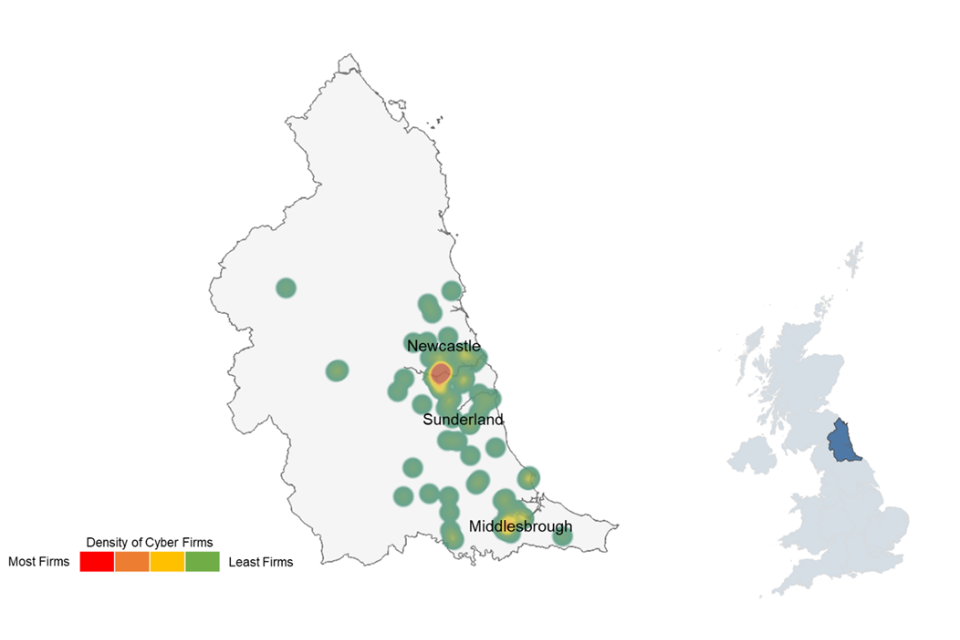
| Percentage of UK cyber security offices | Estimated percentage of UK based cyber security employment | Mean Advertised Salaries (2025) in core cyber security roles |
|---|---|---|
| 2% | 3% | £55,200 |
North West
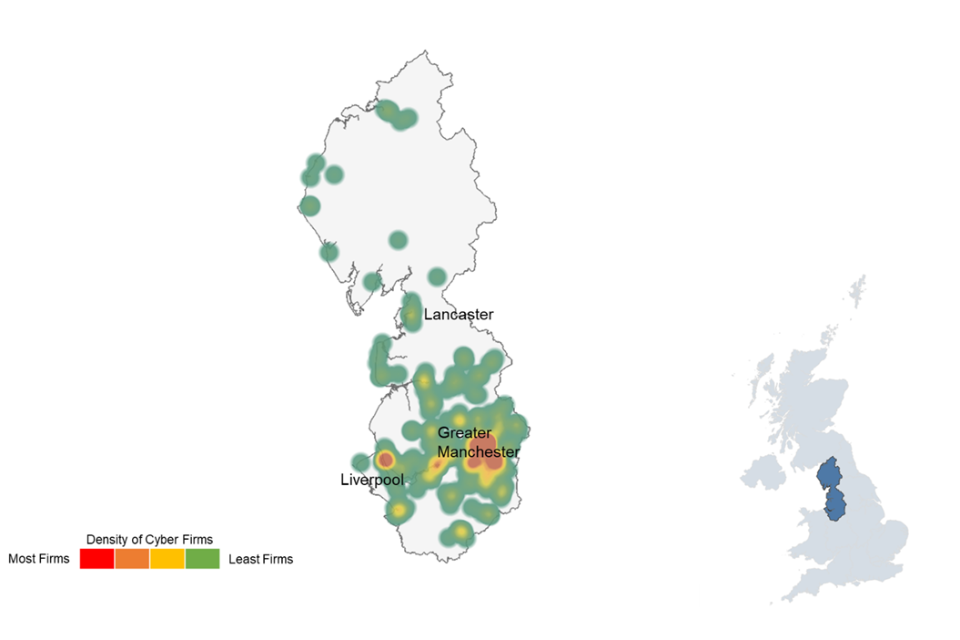
| Percentage of UK cyber security offices | Estimated percentage of UK based cyber security employment | Mean Advertised Salaries (2025) in core cyber security roles |
|---|---|---|
| 9% | 10% | £57,600 |
South East
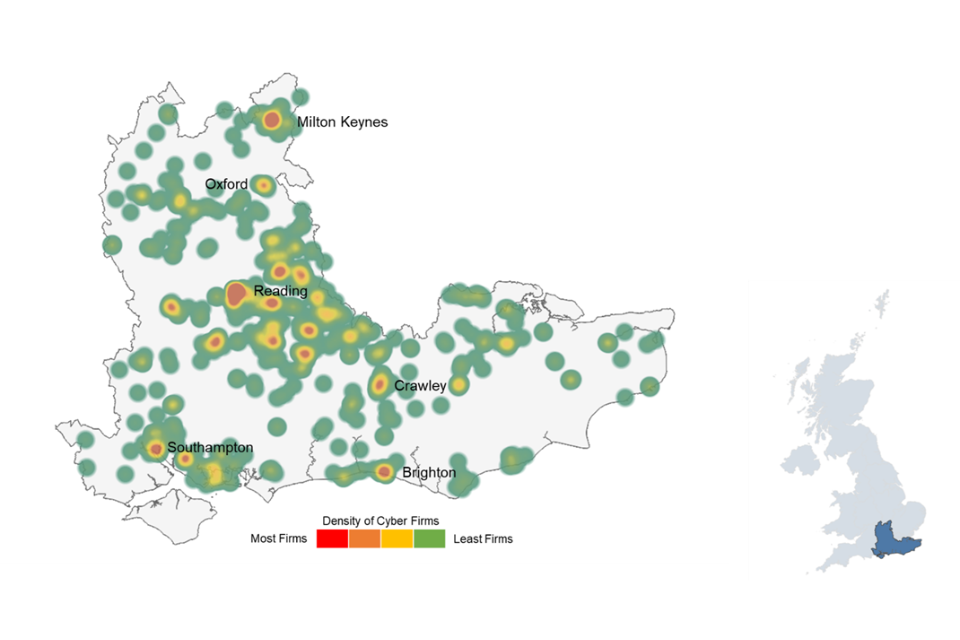
| Percentage of UK cyber security offices | Estimated percentage of UK based cyber security employment | Mean Advertised Salaries (2025) in core cyber security roles |
|---|---|---|
| 16% | 13% | £59,300 |
South West
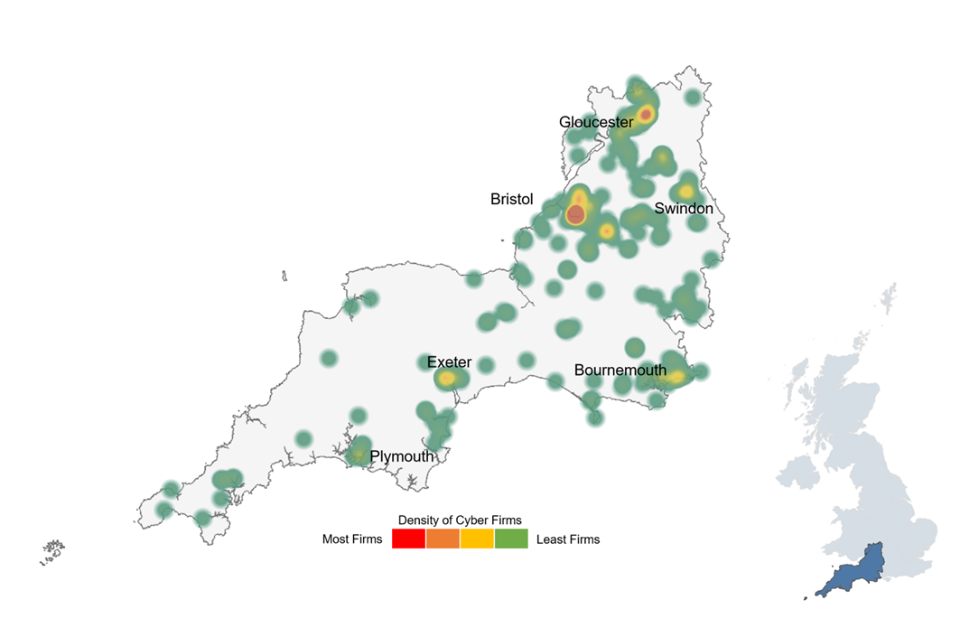
| Percentage of UK cyber security offices | Estimated percentage of UK based cyber security employment | Mean Advertised Salaries (2025) in core cyber security roles |
|---|---|---|
| 8% | 9% | £57,700 |
West Midlands
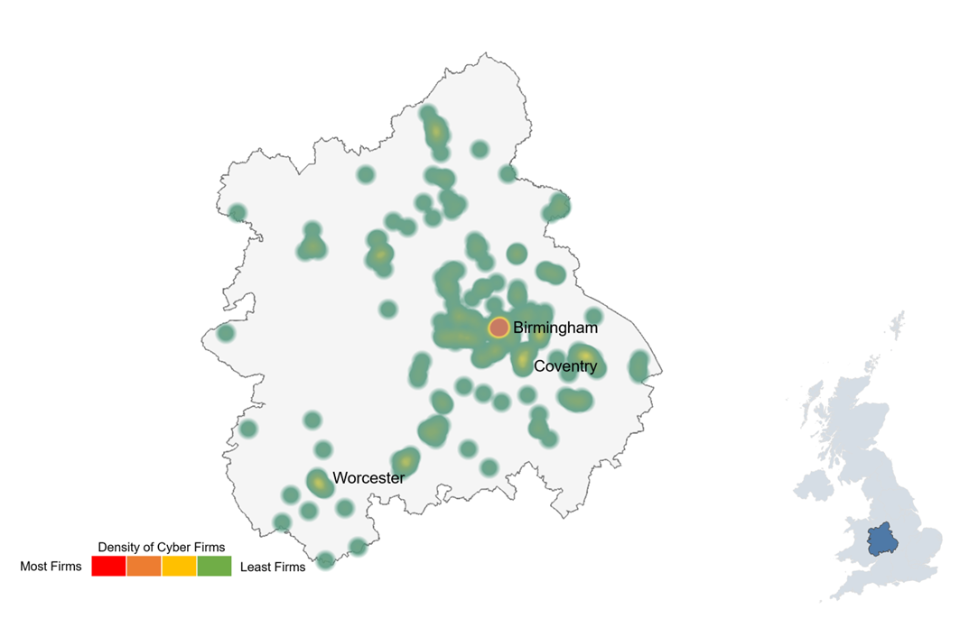
| Percentage of UK cyber security offices | Estimated percentage of UK based cyber security employment | Mean Advertised Salaries (2025) in core cyber security roles |
|---|---|---|
| 6% | 8% | £58,100 |
Yorkshire and the Humber
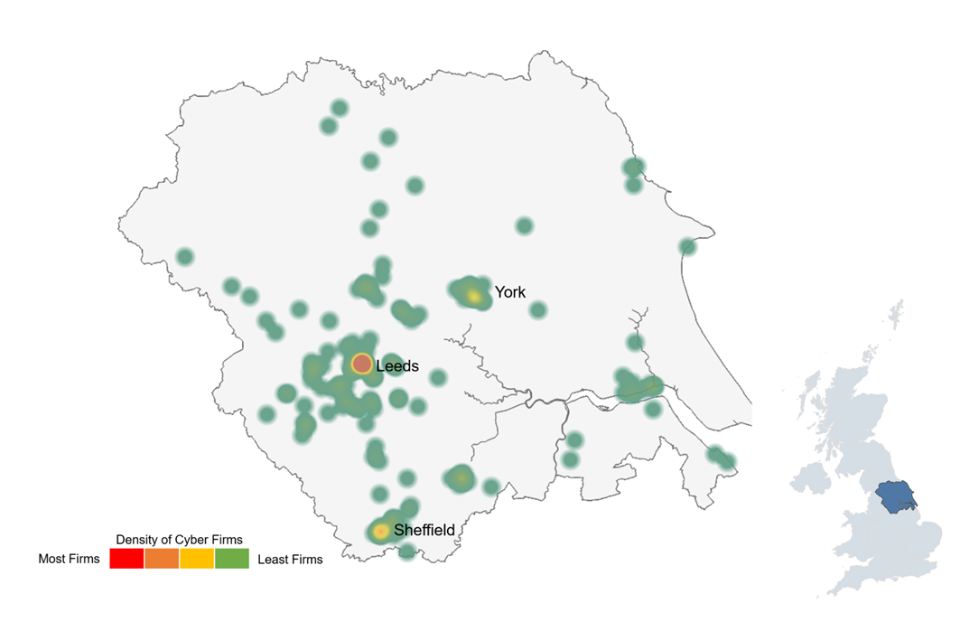
| Percentage of UK cyber security offices | Estimated percentage of UK based cyber security employment | Mean Advertised Salaries (2025) in core cyber security roles |
|---|---|---|
| 5% | 5% | £58,800 |
Northern Ireland
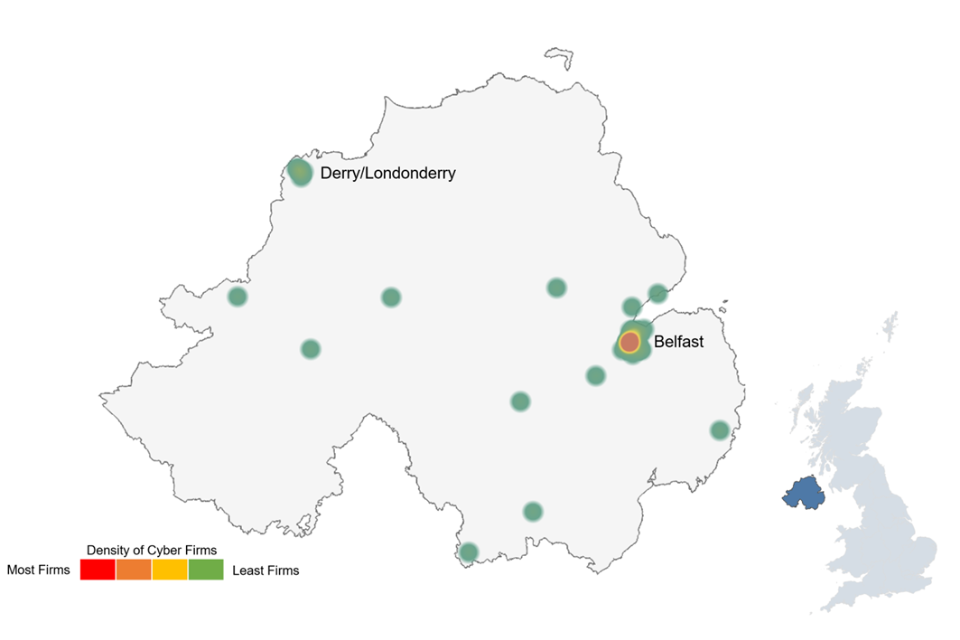
| Percentage of UK cyber security offices | Estimated percentage of UK based cyber security employment | Mean Advertised Salaries (2025) in core cyber security roles |
|---|---|---|
| 2% | 4% | £51,600 |
Scotland
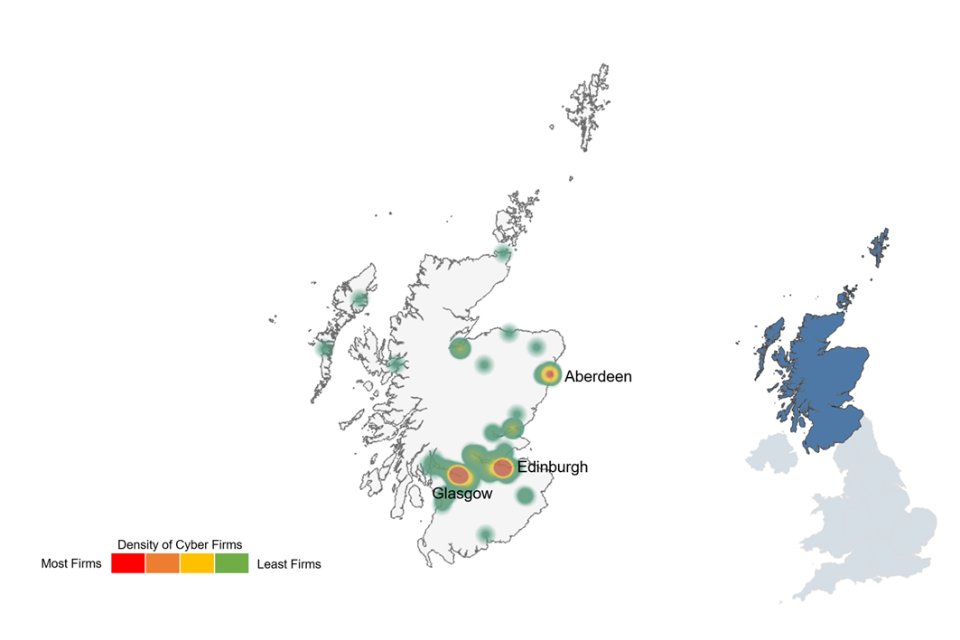
| Percentage of UK cyber security offices | Estimated percentage of UK based cyber security employment | Mean Advertised Salaries (2025) in core cyber security roles |
|---|---|---|
| 7% | 7% | £63,100 |
Wales
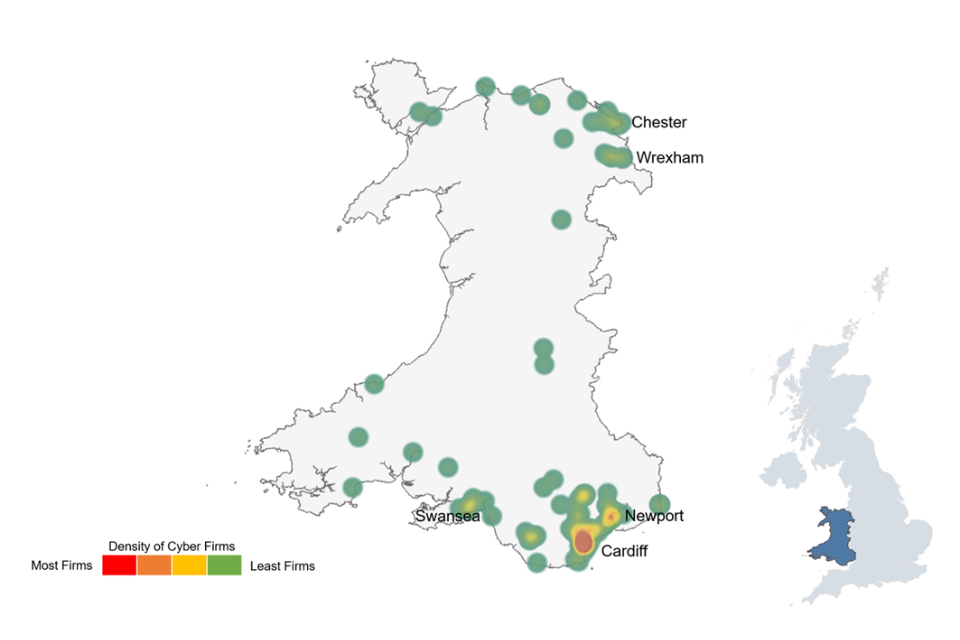
| Percentage of UK cyber security offices | Estimated percentage of UK based cyber security employment | Mean Advertised Salaries (2025) in core cyber security roles |
|---|---|---|
| 2% | 3% | £55,200 |
-
Gross Value Added (GVA) is a measure of the increase in the value of the economy due to the production of goods and services. In this study, this captures the estimated direct contribution of the cyber security sector to the UK economy. ↩
-
All firms identified were also subject to additional automated and human review by the Perspective Economics analyst team for final inclusion in the cyber security sectoral dataset. ↩
-
Based on 95% confidence intervals. ↩
-
RegTech refers to ‘regulatory technology’ used to enhance and assist organisations with regulatory and compliance processes. ↩
-
Safety tech providers deliver products and services that enable safer online experiences for citizens. DSIT sector research is available in the UK Safety Tech sectoral analysis ↩
-
Full size definitions: Large: Employees ≥250 and Turnover >£54 million or Balance sheet total >£27 million; Medium: Employees ≥50 and <250 and Turnover ≤£54 million or Balance sheet total ≤£27 million; Small: Employees ≥10 and <50 and Turnover ≤£15 million or Balance sheet total ≤£7.5 million; Micro: Employees <10 and Turnover ≤£1 million or Balance sheet total ≤£500k. Please note that size definitions have been updated from the EU SME classification (used in prior reports) to the UK Companies Act 2006 thresholds, as amended from 6 April 2025. ↩
-
Figures may not sum due to rounding. ↩
-
As set out in the methodology, size classifications for the current year (2026) use the updated UK Companies Act thresholds (effective April 2025), replacing the EU SME definitions used in previous reports. The employee thresholds remain unchanged (Micro <10, Small 10-49, Medium 50-249, Large ≥250), with minor adjustments to turnover and balance sheet criteria. This change is not expected to have a material impact on comparability, though a small number of firms may have moved between bands as a result. ↩
-
The keywords underpinning Awareness, Training and Education have been broadened to include firms offering awareness or training courses without formal accreditation (e.g., online modules in cyber security awareness). ↩
-
For a full explanation of TTWAs, see the ONS website. TTWAs are a ‘self-contained labour market in which all commuting occurs within the boundary of that area. At least 75% of the area’s resident workforce work in the area, and at least 75% of the people who work in the area also live in the area.’ There is a total of 228 TTWAs. Our Location Quotient calculations are based on 2016 Annual Population Survey (APS) data, and the TTWA calculations are based on the April 2011 TTWAs. ↩
-
As marked by international presence with a known office / location. Many firms will trade globally without a physical office presence. This is explored further in Section 6.4. ↩
-
£13,234 million in 2025 study to £14,735 million in 2026 study = Growth Rate (CAGR) of 11%. ↩
-
Combined revenue among dedicated SMEs (£3,647 million) = 83% of all SME cyber security revenue (£4,372 million). ↩
-
Managed Service Providers (MSPs) typically deliver outsourced IT infrastructure and operational support, covering areas such as network management, cloud services, and IT support functions. Managed Security Service Providers (MSSPs) are a specialised subset that focus specifically on security operations, including threat monitoring, incident response, vulnerability management, and security information and event management (SIEM). In practice, several MSPs have expanded their offerings to include security services, and some MSSPs also provide broader IT management alongside their core security capabilities. ↩
-
Note: Smaller values include Services and MSSPs, Micro £178 million; Product, Micro £73 million. ↩
-
The research team also models regional estimates of cyber security employment and labour force estimates within the annual Cyber Security Skills in the UK research with Ipsos. Within this, vacancy data and estimated workforce data is used to estimate regional estimates of cyber workforce size (as a proportion of the UK). ↩
-
This consists of an estimated 27,160 in ‘service’ firms and 15,265 in MSSPs. ↩
-
This estimates the annual compound growth rate regarding the number of firms, employment, revenue, and Gross Value Added (GVA) between 2020–2025. Each year corresponds to the financial year within each Cyber Security Sectoral Analysis report available on GOV.UK, e.g. ‘2025’ refers to data set out in this study, where the financial year corresponds to FY24/25. Please note we do not calculate investment CAGR due to limited sample size, and that these figures can be prone to annual fluctuations driven by large individual deals. ↩
-
The Beauhurst platform tracks investments in these companies from 2006–2025. ↩
-
https://www.beauhurst.com/research/state-of-uk-investment-h1-2025/ ↩
-
https://www.british-business-bank.co.uk/news-and-events/news/british-business-bank-commits-up-to-ps36m-to-osney-capitals-fund-1 ↩
-
Capstone Partners (2025) Cybersecurity M&A Update – Sept 2025 ↩
-
Kroll (2025) Cybersecurity Sector Update – Fall 2025 ↩
-
Darktrace (2025): https://www.darktrace.com/news/darktrace-announces-proposed-acquisition-of-cado-security-a-cloud-investigation-and-response-specialist ↩
-
Thoma Bravo (2025): https://www.thomabravo.com/press-releases/darktrace-announces-acquisition-of-mira-security-a-leading-provider-of-network-traffic-visibility-solutions ↩
-
Sophos (2025): https://www.sophos.com/en-us/press/press-releases/2025/02/sophos-completes-secureworks-acquisition ↩
-
Limerston Capital (2025): https://www.limerstoncap.com/post/limerston-capital-announces-further-investment-in-cyber-services-platform-xypher-with-aristi-acqui ↩
-
Prolific North (2025): https://www.prolificnorth.co.uk/news/200m-boost-for-north-east-cybersecurity-it-and-cloud-specialist/ ↩
-
https://redsquid.co.uk/industry-news/redsquid-acquires-uk-based-cybersecurity-provider-cyberseer-marking-its-5th-acquisition-of-2025-uniting-it-cloud-and-cybersecurity-under-one-roof/ ↩
-
https://www.ek.co/publications/ekco-strengthens-its-cyber-security-offering-with-acquisition-of-predatech/ ↩
-
https://acora.com/news/announcements/acora-completes-the-acquisition-of-hydras/ ↩
-
https://betakit.com/1password-builds-on-b2b-growth-with-acquisition-of-uk-based-trelica-to-help-companies-secure-unmanaged-apps/ ↩
-
https://www.huntress.com/press-release/huntress-acquires-inside-agent-to-strengthen-identity-security-posture-management ↩
-
Each of the regional snapshot sections sets out a heatmap of active offices within each region, count of registered cyber firms, count of active cyber offices, percentage of active UK cyber security offices within the region, and an estimated percentage of UK cyber security sectoral employment within the region. The average advertised salary is derived for 2025 using the Lightcast Analyst tool, consistent with the methodology from the Cyber Skills in the UK Labour Market research (published in 2025), and updates those figures using labour market data from 2025. ↩