Impact of COVID-19 on childhood vaccination counts up to week 11, 2021
Updated 14 September 2021
Applies to England

© Crown copyright 2021
This publication is licensed under the terms of the Open Government Licence v3.0 except where otherwise stated. To view this licence, visit nationalarchives.gov.uk/doc/open-government-licence/version/3 or write to the Information Policy Team, The National Archives, Kew, London TW9 4DU, or email: psi@nationalarchives.gov.uk.
Where we have identified any third party copyright information you will need to obtain permission from the copyright holders concerned.
This publication is available at https://www.gov.uk/government/publications/covid-19-impact-on-vaccination-programmes/impact-of-covid-19-on-childhood-vaccination-counts-up-to-week-11-2021
Introduction to the report to week 11, 2021
This report presents vaccination counts data up to week 11 of 2021 (compared with the same period in 2020 and 2019) in the charts below, and should be read in conjunction with the last published full report: Impact of COVID-19 on childhood vaccination counts to week 9, and vaccine coverage to January 2021 in England, HPR 15(5).
The charts below show that:
- the number of dose 1 Hexavalent vaccine doses delivered in England in week 11 (Figure 1) were lower than during the same week in 2019 and 2020, and the overall difference in vaccination counts delivered in 2021 was lower than in 2019 and 2020 (Figures 1 and 3)
- the number of dose 1 MMR vaccine doses delivered in England in week 11 (Figure 2) were lower than during the same week in 2019 but were higher compared to doses given during the same week in 2020. The overall difference in vaccination counts delivered in 2021 was lower than in 2019 and 2020 (Figures 2 and 4)
- in 2021, vaccination counts for Hexavalent and MMR vaccine were 10.7% and 2.7% lower in week 11, compared to week 11 in 2019, respectively
It should be noted that the vaccine count data presented here is a proxy measure for the vaccine coverage data that is being reported on a monthly basis.
In figures 1 and 2 it should be noted that direct comparisons for the weekly data between 2019, 2020 and 2021 should be made with caution since the days do not map the same weeks (week 1 data for 2021 only accounts for 3 days). Also, that school holidays (often coinciding with family holidays) are for the 2020 calendar year. These holidays may vary slightly by year and by local area. School holidays for the 2019 to 2020 academic year were in weeks 43, 52, 53, 1, 8, 15, 16, 19, 22, 30 to 36. School holidays for the 2020 to 2021 academic year are in weeks 44, 52, 53, 7, 13, 14, 18, 22, 29 to 35.
Hexavalent vaccination counts to week 11
Figure 1 below shows weekly dose 1 Hexavalent vaccination counts in infants younger than 6 months in The Phoenix Partnership (TPP) practices open in both 2019 and 2020, or both 2019 and 2021, in England: 2019, 2020 and 2021. School holidays for the 2020 calendar year are shown in grey (see HPR 15(5) report for full notes on this graph).

Figure 1
MMR vaccination counts to week 11
Figure 2 below shows MMR 1 vaccination counts in infants aged 12 to 18 months in TPP practices open in both 2019 and 2020, or both 2019 and 2021, in England: 2019, 2020 and 2021. School holidays for the 2020 calendar year are shown in grey (see HPR 15(5) report for full notes on this graph).
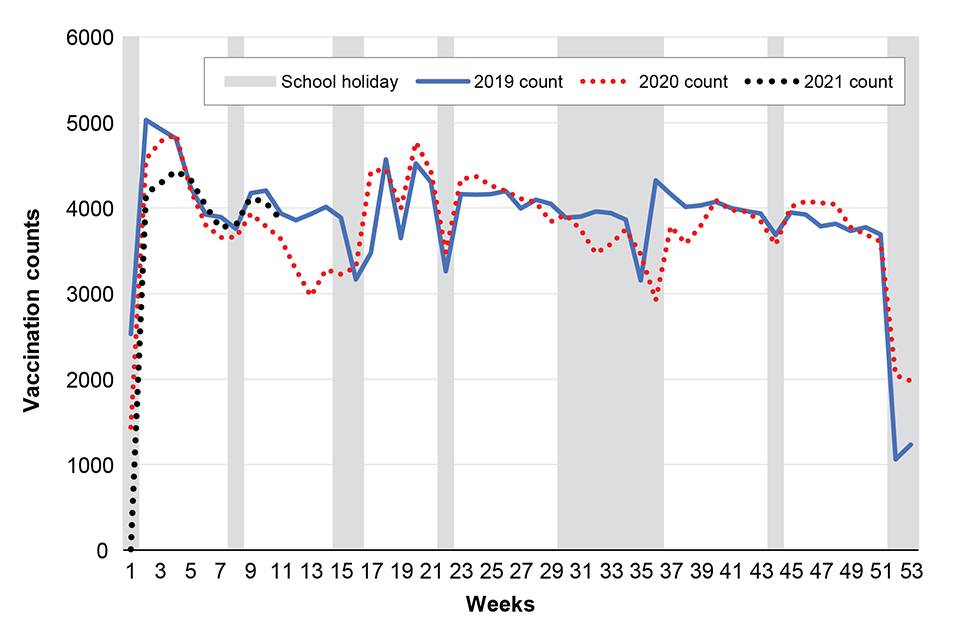
Figure 2
Percentage change in vaccination counts in 2021 and 2020 compared with 2019, to week 11
Figure 3 below shows percentage change in dose 1 Hexavalent vaccination counts (in infants under 6 months) in 2021 and 2020 compared to 2019, by week, in TPP practices in England. (Direct comparisons for the weekly data between 2019, 2020 and 2021 should be made with caution since the days do not map the same weeks: week 1 data for 2021 only accounts for 3 days.)
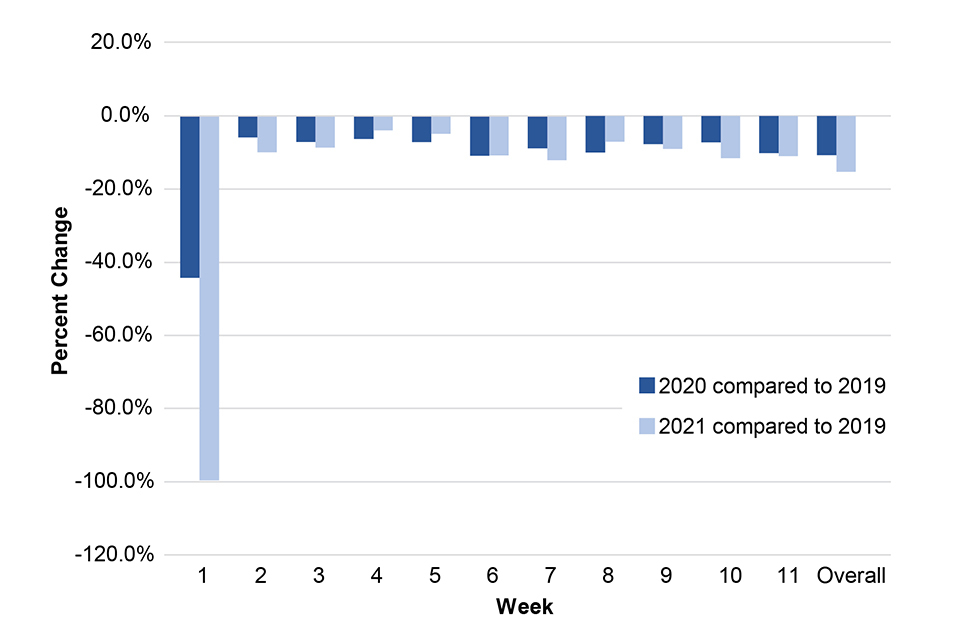
Figure 3
Figure 4 below shows MMR 1 vaccination counts (in infants aged 12 to 18 months) in 2021 and 2020 compared to 2019, by week, in TPP practices in England. (Direct comparisons for the weekly data between 2019, 2020 and 2021 should be made with caution since the days do not map the same weeks: week 1 data for 2021 only accounts for 3 days.)
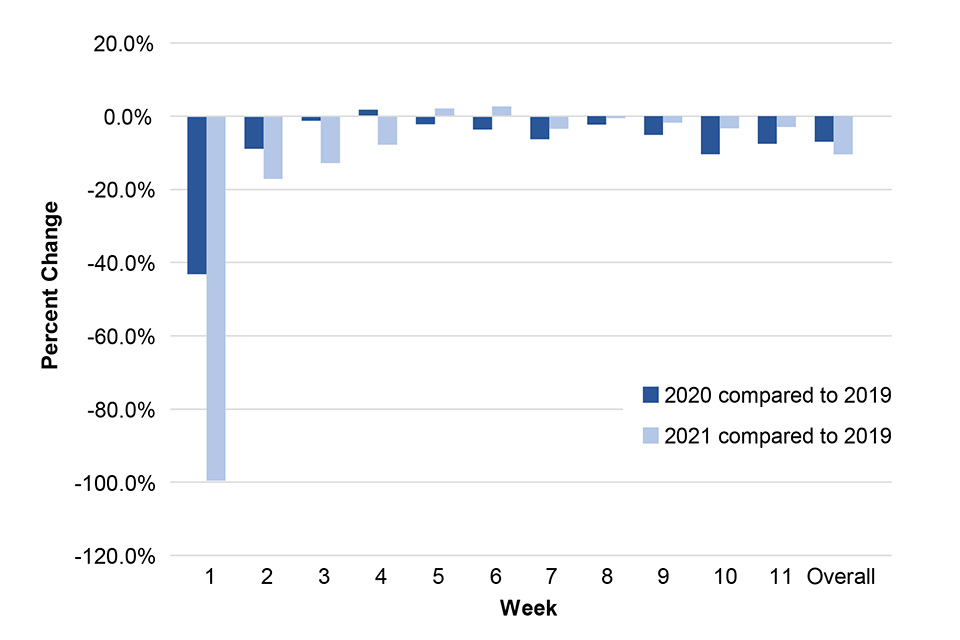
Figure 4
Methods
Aggregated weekly vaccination counts from 2019, 2020 and 2021 for dose 1 Hexavalent (diphtheria, tetanus, pertussis (whooping cough), polio, Haemophilus influenzae type b (Hib) and Hepatitis B) delivered to infants 6 months and younger, and MMR1 (first dose of measles, mumps and rubella vaccine) to children between the ages of 12 and 18 months, were provided by the general practice (GP) information technology supplier, TPP. Weekly trends in vaccination counts were compared between 2019, 2020 and 2021.
TPP represents approximately 38% of data for all GP practices in England and some regions are less represented than others.