Decreases in chlamydia tests, diagnoses and positivity in young people, England 2023 to 2024
Published 18 December 2025
Applies to England

© Crown copyright 2025
This publication is licensed under the terms of the Open Government Licence v3.0 except where otherwise stated. To view this licence, visit nationalarchives.gov.uk/doc/open-government-licence/version/3 or write to the Information Policy Team, The National Archives, Kew, London TW9 4DU, or email: psi@nationalarchives.gov.uk.
Where we have identified any third party copyright information you will need to obtain permission from the copyright holders concerned.
This publication is available at https://www.gov.uk/government/publications/chlamydia-analyses-to-inform-control-interventions/decreases-in-chlamydia-tests-diagnoses-and-positivity-in-young-people-england-2023-to-2024
Main points
Principal conclusions of this report are that:
- in England in 2024, total chlamydia tests decreased 1% and diagnoses decreased 13% compared to 2023
- the largest decreases were seen in young people 15 to 24 years old, with tests decreasing 11% and diagnoses decreasing 18% – positivity also decreased
- in young people, decreases in tests, diagnoses and positivity were seen relatively consistently across regions and demographics
- diagnoses of some other sexually transmitted infections (STIs) and pelvic inflammatory disease (PID), a consequence of STIs, also decreased in young people
- the underlying reason for the observed lower diagnoses and positivity could be fewer chlamydia infections in young people in England, or changes in who is being tested, or a combination of those factors
Background
Chlamydia is the most commonly diagnosed sexually transmitted infection (STI) in England. Chlamydia testing is available in sexual health services, other healthcare settings and through online postal self-sampling services (henceforth ‘internet testing’). The National Chlamydia Screening Programme (NCSP) promotes opportunistic testing of sexually-active women 15 to 24 years old, aiming to reduce the harms of untreated infection (1). Views on the effectiveness of asymptomatic chlamydia testing vary worldwide (2,3).
In 2024, total chlamydia tests decreased 1% and diagnoses decreased 13% compared to 2023. The largest decreases were in people 15 to 24 years of age, with tests decreasing 11% and diagnoses 18% (4,5). When chlamydia testing decreases, fewer diagnoses are expected, but typically diagnoses decrease less than tests, and positivity increases. In 2024 however, the decreases in diagnoses in young people exceeded that in tests, and positivity decreased. Young people have much higher positivity for chlamydia and young women are a focal group for chlamydia control policies in England. This report describes initial investigations into the unusual decreases in young people and considers potential reasons. Data from the Chlamydia Testing Activity Dataset (CTAD) Chlamydia Surveillance System and GUMCAD (previously the Genitourinary Medicine Clinic Activity Dataset) STI Surveillance System is used.
Trends of chlamydia within surveillance data
An investigation of surveillance data was undertaken. This explored when the larger decrease in diagnoses than tests was first observed, in which demographics, and where in England.
The greater decrease in diagnoses than tests in young people began in 2023, with falls of 4% and 2% respectively, compared to 2022. Figure 1 shows quarterly trends of chlamydia diagnoses and tests in 15- to 24-year-olds. In Q2 2020, both diagnoses and tests dropped due to the impact on services during COVID-19, then increased in Q3 2020. From Q3 2020 to Q1 2022 tests remained stable whereas diagnoses decreased, then substantially increased. From Q1 2022 onwards tests and diagnoses decreased, except for a peak in both in Q1 2023, and increased tests in Q1 2024. Neither testing nor diagnoses have returned to 2019 levels amongst 15 to 24-year-olds.
Figure 1. Chlamydia diagnoses and tests in 15- to 24-year-olds, England 2019 to 2024 (note different axis scales)
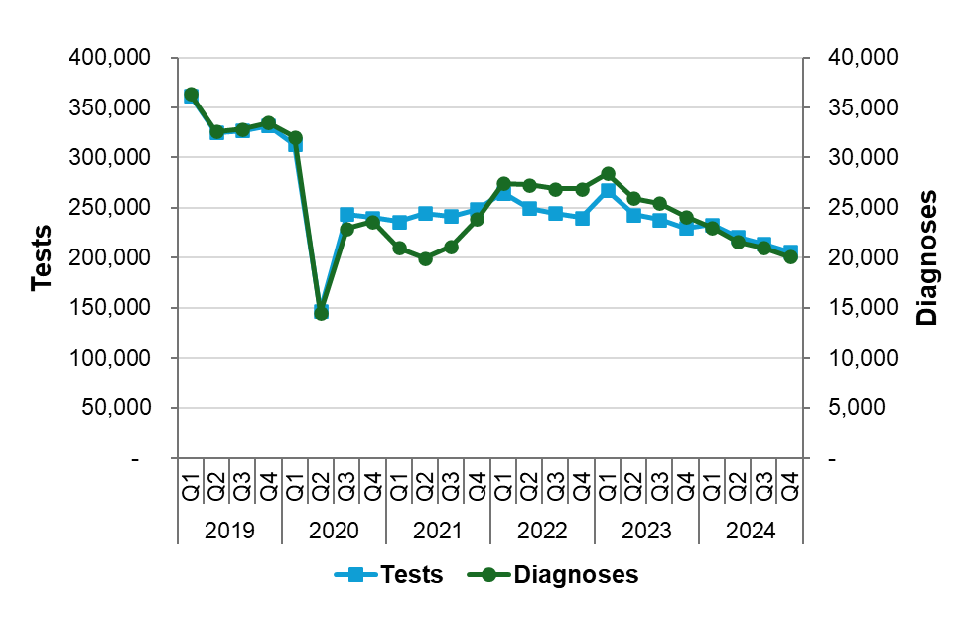
Source: CTAD Chlamydia Surveillance System and GUMCAD STI Surveillance System.
Tables 1a to 1f show the percentage change from 2023 to 2024 in tests, diagnoses and positivity, stratified by demographic variables. The greater decrease in diagnoses than tests, and hence decreased positivity, was observed in young people across most testing settings, and across all ethnic groups and area-level deprivation quintiles. It was observed in all regions of England, however, was less consistent across smaller geographies (data not shown). The scale of decreases varied between sub-groups. This shows that decreases in diagnoses, tests, and positivity were not confined to any sub-group investigated but occurred relatively consistently across young people in England.
Table 1a. Percentage change in chlamydia diagnoses, tests and positivity between 2023 and 2024 stratified by gender identity (15- to 24-year-olds)
| Gender identity | Diagnoses 2023 | Tests 2023 | Positivity 2023 | Diagnoses 2024 | Tests 2024 | Positivity 2024 | Diagnoses % change 2023 to 2024 | Tests % change 2023 to 2024 | Positivity % change 2023 to 2024 |
|---|---|---|---|---|---|---|---|---|---|
| Females | 64,802 | 673,102 | 10% | 53,166 | 601,295 | 9% | -18% | -11% | -8% |
| Males | 35,749 | 275,171 | 13% | 29,438 | 244,136 | 12% | -18% | -11% | -7% |
| Not specified | 1,053 | 9,340 | 11% | 962 | 10,155 | 9% | -9% | +9% | -16% |
| Unknown | 2,404 | 20,535 | 12% | 2,191 | 18,608 | 12% | -9% | -9% | +1% |
| All genders | 104,008 | 978,148 | 11% | 85,757 | 874,194 | 10% | -18% | -11% | -8% |
Use the scroll bar to view the full range of data.
Table 1b. Percentage change in chlamydia diagnoses, tests and positivity between 2023 and 2024 stratified by age group (all genders)
| Age group | Diagnoses 2023 | Tests 2023 | Positivity 2023 | Diagnoses 2024 | Tests 2024 | Positivity 2024 | Diagnoses % change 2023 to 2024 | Tests % change 2023 to 2024 | Positivity % change 2023 to 2024 |
|---|---|---|---|---|---|---|---|---|---|
| 15-19 | 36,783 | 265,638 | 14% | 29,886 | 233,780 | 13% | -19% | -12% | -8% |
| 20-24 | 67,225 | 712,510 | 9% | 55,871 | 640,414 | 9% | -17% | -10% | -8% |
| 25-29 | 36,199 | 697,091 | 5% | 32,820 | 687,771 | 5% | -9% | -1% | -8% |
| 30-34 | 21,923 | 556,545 | 4% | 19,829 | 567,606 | 3% | -10% | +2% | -11% |
| 35-44 | 20,219 | 634,298 | 3% | 19,326 | 679,084 | 3% | -4% | +7% | -11% |
| 45-64 | 10,250 | 358,308 | 3% | 9,618 | 384,219 | 3% | -6% | +7% | -12% |
| 65+ | 753 | 31,080 | 2% | 758 | 35,712 | 2% | +1% | +15% | -12% |
| All ages | 194,143 | 3,266,474 | 6% | 168,889 | 3,240,203 | 5% | -13% | -1% | -12% |
Use the scroll bar to view the full range of data.
Table 1c. Percentage change in chlamydia diagnoses, tests and positivity between 2023 and 2024 stratified by testing setting (all genders, 15- to 24-year-olds)
| Testing setting | Diagnoses 2023 | Tests 2023 | Positivity 2023 | Diagnoses 2024 | Tests 2024 | Positivity 2024 | Diagnoses % change 2023 to 2024 | Tests % change 2023 to 2024 | Positivity % change 2023 to 2024 |
|---|---|---|---|---|---|---|---|---|---|
| Internet | 42,769 | 430,351 | 10% | 32,855 | 360,402 | 9% | -23% | -16% | -8% |
| Specialist SHSs | 39,009 | 273,376 | 14% | 34,606 | 266,914 | 13% | -11% | -2% | -9% |
| Non-specialist SHSs | 3,018 | 22,295 | 14% | 2,425 | 19,476 | 12% | -20% | -13% | -8% |
| GP | 8,412 | 136,105 | 6% | 6,605 | 122,854 | 5% | -21% | -10% | -13% |
| Pharmacy | 393 | 3,060 | 13% | 323 | 2,574 | 13% | -18% | -16% | -2% |
| ToP | 555 | 5,711 | 10% | 461 | 5,876 | 8% | -17% | +3% | -19% |
| Other | 9,207 | 98,166 | 9% | 7,885 | 87,579 | 9% | -14% | -11% | -4% |
| Unknown | 645 | 9,084 | 7% | 597 | 8,519 | 7% | -7% | -6% | -1% |
Use the scroll bar to view the full range of data.
Note. In the above table:
GP = General Practice
SHS = Sexual health service
ToP = Termination of pregnancy
Table 1d. Percentage change in chlamydia diagnoses, tests and positivity between 2023 and 2024 stratified by area-level deprivation quintile (all genders, 15- to 24-year-olds)
| Deprivation quintile | Diagnoses 2023 | Tests 2023 | Positivity 2023 | Diagnoses 2024 | Tests 2024 | Positivity 2024 | Diagnoses % change 2023 to 2024 | Tests % change 2023 to 2024 | Positivity % change 2023 to 2024 |
|---|---|---|---|---|---|---|---|---|---|
| Most deprived | 27,055 | 224,736 | 12% | 22,613 | 203,156 | 11% | -16% | -10% | -8% |
| Second-most deprived | 25,561 | 236,834 | 11% | 20,427 | 205,968 | 10% | -20% | -13% | -8% |
| Third-most deprived | 19,755 | 195,152 | 10% | 15,958 | 171,742 | 9% | -19% | -12% | -8% |
| Second-least deprived | 15,369 | 159,719 | 10% | 12,367 | 139,331 | 9% | -20% | -13% | -8% |
| Least deprived | 12,682 | 133,721 | 9% | 10,390 | 121,363 | 9% | -18% | -9% | -10% |
Use the scroll bar to view the full range of data.
Note. In the above table, socioeconomic area-level deprivation was determined using the Index of Multiple Deprivation 2019
Table 1e. Percentage change in chlamydia diagnoses, tests and positivity between 2023 and 2024 stratified by ethnic group (all genders, 15- to 24-year-olds)
| Ethnic group | Diagnoses 2023 | Tests 2023 | Positivity 2023 | Diagnoses 2024 | Tests 2024 | Positivity 2024 | Diagnoses % change 2023 to 2024 | Tests % change 2023 to 2024 | Positivity % change 2023 to 2024 |
|---|---|---|---|---|---|---|---|---|---|
| Asian | 3,009 | 35,699 | 8% | 2,706 | 35,388 | 8% | -10% | -1% | -9% |
| Black | 9,945 | 70,773 | 14% | 9,170 | 68,295 | 13% | -8% | -4% | -4% |
| Mixed | 6,515 | 53,786 | 12% | 5,441 | 49,622 | 11% | -16% | -8% | -9% |
| White | 60,224 | 559,655 | 11% | 48,773 | 488,629 | 10% | -19% | -1%3 | -7% |
| Other | 1,277 | 11,948 | 11% | 1,065 | 11,574 | 9% | -17% | -3% | -14% |
| Unknown | 23,038 | 246,287 | 9% | 18,602 | 220,686 | 8% | -19% | -10% | -10% |
Use the scroll bar to view the full range of data.
Table 1f. Percentage change in chlamydia diagnoses, tests and positivity between 2023 and 2024 stratified by region of England (all genders, 15- to 24-year-olds)
| Region | Diagnoses 2023 | Tests 2023 | Positivity 2023 | Diagnoses 2024 | Tests 2024 | Positivity 2024 | Diagnoses % change 2023 to 2024 | Tests % change 2023 to 2024 | Positivity % change 2023 to 2024 |
|---|---|---|---|---|---|---|---|---|---|
| East Midlands | 10,237 | 92,376 | 11% | 8,211 | 78,805 | 10% | -20% | -15% | -6% |
| East (of England) | 8,617 | 89,277 | 10% | 6,821 | 71,158 | 10% | -21% | -20% | -1% |
| London | 19,312 | 212,753 | 9% | 16,595 | 191,041 | 9% | -14% | -10% | -4% |
| North East | 5,299 | 45,159 | 12% | 4,858 | 44,615 | 11% | -8% | -1% | -7% |
| North West | 16,126 | 133,898 | 12% | 12,831 | 118,229 | 11% | -20% | -12% | -10% |
| South East | 12,215 | 121,504 | 10% | 10,226 | 110,046 | 9% | -16% | -9% | -8% |
| South West | 9,475 | 89,269 | 11% | 7,664 | 86,742 | 9% | -19% | -3% | -17% |
| West Midlands | 8,730 | 75,178 | 12% | 7,215 | 68,260 | 11% | -17% | -9% | -9% |
| Yorkshire and the Humber | 11,215 | 97,672 | 11% | 9,002 | 87,142 | 10% | -20% | -11% | -10% |
| Unknown | 2,782 | 21,062 | 13% | 2,334 | 18,156 | 13% | -16% | -14% | -3% |
Use the scroll bar to view the full range of data.
Source of data for the above tables: CTAD Chlamydia Surveillance System and GUMCAD STI Surveillance System.
Trends of other sexually transmitted infections and pelvic inflammatory disease within surveillance data
Trends in other STIs were explored for similarities. Gonorrhoea and herpes tests, diagnoses and positivity in 15- to 24-year-olds decreased from 2023 to 2024 (Tables 2a,c). Syphilis tests decreased in all young people, with diagnoses and positivity decreasing in women but not men (Table 2b). Chlamydia causes an estimated 35% (95% credible interval 11-69%) of pelvic inflammatory disease (PID) in young women (6). PID diagnoses in sexual health services decreased 15% in 15 to 24-year-old women from 2023 to 2024 (Table 2d).
Table 2a. Gonorrhoea tests and positivity in 2023 and 2024 and percentage change in diagnoses, tests and positivity between 2023 and 2024 by gender identity, 15- to 24-year-olds
| Gender identity | Diagnoses 2023 | Tests 2023 | Positivity 2023 | Diagnoses 2024 | Tests 2024 | Positivity 2024 | Diagnoses % change 2023 to 2024 | Tests % change 2023 to 2024 | Positivity % change 2023 to 2024 |
|---|---|---|---|---|---|---|---|---|---|
| Females | 13,531 | 444,230 | 3.0% | 7,513 | 397,657 | 1.9% | -44% | -10% | -38% |
| Males | 14,948 | 221,837 | 6.7% | 10,816 | 198,596 | 5.4% | -28% | -10% | -19% |
| All genders | 30,045 | 694,433 | 4.3% | 19,114 | 621,385 | 3.1% | -36% | -11% | -29% |
Use the scroll bar to view the full range of data.
Table 2b. Syphilis tests and positivity in 2023 and 2024 and percentage change in diagnoses, tests and positivity between 2023 and 2024 by gender identity, 15- to 24-year-olds
| Gender identity | Diagnoses 2023 | Tests 2023 | Positivity 2023 | Diagnoses 2024 | Tests 2024 | Positivity 2024 | Diagnoses % change 2023 to 2024 | Tests % change 2023 to 2024 | Positivity % change 2023 to 2024 |
|---|---|---|---|---|---|---|---|---|---|
| Females | 262 | 243,468 | 0.1% | 204 | 224,631 | 0.1% | -22% | -8% | -16% |
| Males | 768 | 155,139 | 0.5% | 789 | 146,047 | 0.5% | +3% | -6% | +9% |
| All genders | 1,105 | 416,093 | 0.3% | 1,051 | 386,721 | 0.3% | -5% | -7% | +2% |
Use the scroll bar to view the full range of data.
Table 2c. Herpes tests and positivity in 2023 and 2024 and percentage change in diagnoses, tests and positivity between 2023 and 2024 by gender identity, 15- to 24-year-olds
| Gender identity | Diagnoses 2023 | Tests 2023 | Positivity 2023 | Diagnoses 2024 | Tests 2024 | Positivity 2024 | Diagnoses % change 2023 to 2024 | Tests % change 2023 to 2024 | Positivity % change 2023 to 2024 |
|---|---|---|---|---|---|---|---|---|---|
| Females | 6,577 | 11,140 | 59.0% | 6,123 | 10,582 | 57.9% | -7% | -5% | -2% |
| Males | 2,217 | 5,600 | 39.6% | 2,123 | 5,528 | 38.4% | -4% | -1% | -3% |
| All genders | 9,410 | 17,779 | 52.9% | 8,751 | 17,004 | 51.5% | -7% | -4% | -3% |
Use the scroll bar to view the full range of data.
Table 2d. PID diagnoses in 2023 and 2024 and percentage change in diagnoses between 2023 and 2024, 15 to 24-year-olds
| Gender identity | Diagnoses 2023 | Tests 2023 | Positivity 2023 | Diagnoses 2024 | Tests 2024 | Positivity 2024 | Diagnoses % change 2023 to 2024 | Tests % change 2023 to 2024 | Positivity % change 2023 to 2024 |
|---|---|---|---|---|---|---|---|---|---|
| Females | 2,949 | N/A | N/A | 2,519 | N/A | N/A | -15% | N/A | N/A |
Use the scroll bar to view the full range of data.
Source of data for the above tables: GUMCAD STI Surveillance System.
Discussion
These investigations gave insight into the decreases in chlamydia tests, diagnoses and positivity seen in young people in England. Other countries have also reported decreases in chlamydia diagnoses, including Denmark, Australia, the Republic of Ireland and Scotland (7 to 10). Possible reasons for these decreases are discussed here.
Fewer incident infections
A genuine decrease in chlamydia, with fewer incident infections, may be a result of COVID-19 restrictions acting as a ‘circuit breaker’ event. During lockdowns, less sexual mixing may have disrupted transmission and sexual debut may have been delayed for some, resulting in lower prevalence of chlamydia. Several studies have suggested sexual behaviours changed during the pandemic (11 to 12). Heightened sexual mixing and risk-taking behaviour immediately post-lockdown may have caused the increased diagnoses from Q3 2021 to Q1 2022 (Figure 1). With sexual mixing then returning to steady state, chlamydia diagnoses could now reflect a lower, post-COVID prevalence. A study modelling the impact of COVID-19 restrictions on STIs in men who have sex with men illustrates this hypothesis, projecting that 18 months of service interruption and sexual distancing may reduce STI incidence for multiple years (13). Alternatively, or in addition, changes in sexual behaviour in young people may be resulting in lower risk of transmission. Possible reasons include mandatory sex education in schools (introduced 2020) and increased awareness around infectious diseases due to COVID-19.
The consistency of decreases across sub-groups and testing settings is in line with a population-level change within young people. Decreases in other STIs and PID also support this hypothesis. Further evidence regarding prevalence and changes in sexual behaviour is required to evaluate this hypothesis.
Change in the population being tested
Changes in the population being tested, with fewer individuals at higher-risk of chlamydia being tested, may have resulted in a larger decrease in chlamydia diagnoses than tests. Potential reasons for this include individuals at higher-risk experiencing difficulties or lower propensity to accessing testing, or changes in awareness and health-seeking behaviours.
In recent years, the testing landscape has changed. In 2020, internet testing in young people surpassed all other testing settings, climbing while other, face-to-face settings, dropped (4 to 5). Internet testing is generally recommended for asymptomatic patients. Studies have found that internet testing uptake is associated with individuals at lower-risk compared to those accessing face-to-face appointments (14). To manage demand, some internet testing services may cap the number of self-sampling kits provided (16). The testing landscape regarding age has also changed. Post-COVID testing of over 25-year-olds, in whom positivity is lower, has increased beyond 2019 levels while testing of 15 to 24-year-olds has not. In 2015, 55% of chlamydia tests were in over 25s, increasing to 73% by 2024 (data not shown). Changes in the testing landscape, possibly related to access and capacity of internet and face-to-face testing could have resulted in fewer young people at higher-risk accessing services, and therefore a greater drop in diagnoses than tests.
The similar observations for gonorrhoea align with this hypothesis as combined chlamydia and gonorrhoea assays are routinely used. Therefore, changes in the population testing would affect diagnoses of both infections. Further information about testing uptake and commissioning of services is required to explore this hypothesis.
Discounted hypotheses
Two other hypotheses were presented: a change in the ability to detect positives cases, and data quality issues. Investigation into both did not find any supporting evidence.
Conclusion
This report describes initial investigations into the notable decrease in chlamydia diagnoses, tests and positivity from 2023 to 2024 in young people in England. Two hypotheses, a decrease in incident chlamydia infections, and changes in the population being tested, are consistent with initial investigations. A combination of reasons is plausible. Further work is required to evaluate these hypotheses and possible causal pathways. There are policy implications for both hypotheses, the common ground being a need to better understand how testing services can efficiently detect and treat chlamydia to reduce harms of infection.
Acknowledgements
This report was prepared by Miranda Ferguson, Ubah Daahir, Erna Buitendam, Clare Macdonald, Alireza Talebi, Stephanie J Migchelsen, Hamish Mohammed, John Saunders, Kate Soldan and Kate Folkard on behalf of UKHSA’s Blood Safety, Hepatitis, Sexually Transmitted Infections (STIs) and HIV Division.
References
1. Public Health England. ‘Changes to the National Chlamydia Screening Programme (NCSP)’ 2021 [policy paper]
2. White JA, Dukers-Muijrers NH, Hoebe CJ, Kenyon CR, Dc Ross J, Unemo M. ‘European guideline on the management of Chlamydia trachomatis infections’ International Journal of STD and AIDS 2025: volume 36, issue 6, pages 434 to 449
3. Dukers-Muijrers NHTM, Evers YJ, Hoebe CJPA, Wolffs PFG, de Vries HJC, Hoenderboom B, and others. ‘Controversies and evidence on Chlamydia testing and treatment in asymptomatic women and men who have sex with men: a narrative review’ BMC Infectious Diseases 2022: volume 22, issue 1, page 255
4. UKHSA. ‘NCSP: chlamydia testing in people aged 15 to 24 years in England, 2015 to 2024’ 2025 Official statistics
5. UKHSA. ‘Sexually transmitted infections and screening for chlamydia in England, 2024 report’ 2025
6. Price MJ, Ades AE, Welton NJ, Simms I, Macleod J, Horner PJ. ‘Proportion of pelvic inflammatory disease cases caused by Chlamydia trachomatis: consistent picture from different methods’ Journal of Infectious Diseases 2016: volume 214, pages 617 to 624
7. Pedersen TR, Salado-Rasmussen K, Hoffmann S, Wessman M, Skov Jensen J. ‘Chlamydia trachomatis infections: a rapid decrease in Denmark from 2022 to 2024 is driven by the young population’ Acta Dermato Venereologica 2025: volume 105
8. Australian Government Department of Health, Disability and Ageing. ‘National Notifiable Disease Surveillance System (NNDSS) data visualisation tool’ 2025
9. Health Protection Surveillance Centre (Ireland). ‘Surveillance of STIs in Ireland: 2024’ 2025
10. Public Health Scotland. ‘Sexually transmitted infections in Scotland: 2015 to 2024’ 2025 Official statistics
11. Mourikis I, Kokka I, Koumantarou-Malisiova E, Kontoangelos K, Konstantakopoulos G, Papageorgiou C. ‘Exploring the adult sexual wellbeing and behavior during the COVID-19 pandemic: a systematic review and meta-analysis’ Frontiers in Psychiatry 2022: volume 13
12. Mitchell KR, Willis M, Dema E, Baxter AJ, Connolly A, Riddell J and others. ‘Sexual and reproductive health in Britain during the first year of the COVID-19 pandemic: cross-sectional population survey (Natsal-COVID-Wave 2) and national surveillance data’ Sexually Transmitted Infections 2023: volume 99, issue 6, pages 386 to 397
13. Jenness SM, Le Guillou A, Chandra C, Mann LM, Sanchez T, Westreich D and others. ‘Projected HIV and bacterial sexually transmitted infection incidence following COVID-19-related sexual distancing and clinical service interruption’ Journal of Infectious Diseases 2021: volume 223, issue 6, pages 1,019 to 1,028
14. Sumray K, Lloyd KC, Estcourt CS, Burns F, Gibbs J. ‘Access to, usage and clinic outcomes of, online postal sexually transmitted infection services: a scoping review’ Sexually Transmitted Infections 2022: volume 98, pages 528 to 535
15. Sonubi T, Sheik-Mohamud D, Ratna N, Bell J, Talebi A, Mercer CH and others. ‘STI testing, diagnoses and online chlamydia self-sampling among young people during the first year of the COVID-19 pandemic in England’ International Journal of STD and AIDS 2023: volume 34, pages 841 to 853
16. Spence T, Howarth A, Reid D, Sheringham J, Apea V, Crundwell D and others. ‘How does online postal self-sampling (OPSS) shape access to testing for sexually transmitted infections (STIs)? A qualitative study of service users’ BMC Public Health 2024: volume 24, page 2,339