Children’s Social Care in England 2019
Updated 22 September 2020

© Crown copyright 2020
This publication is licensed under the terms of the Open Government Licence v3.0 except where otherwise stated. To view this licence, visit nationalarchives.gov.uk/doc/open-government-licence/version/3 or write to the Information Policy Team, The National Archives, Kew, London TW9 4DU, or email: psi@nationalarchives.gov.uk.
Where we have identified any third party copyright information you will need to obtain permission from the copyright holders concerned.
This publication is available at https://www.gov.uk/government/statistics/childrens-social-care-data-in-england-2019/childrens-social-care-in-england-2019
This release contains:
-
inspection outcomes for local authority (LA) children’s services inspections from 1 November 2013, covering all inspections published by 30 April 2019
-
the number of providers of children’s social care, and the number of places they are registered for, as at 31 March 2019
-
the most recent inspections and outcomes for all regulated and inspected children’s social care provisions, as at 31 March 2019, and published by 30 April 2019
-
outcomes for all regulated and inspected children’s social care provision inspections conducted between 1 April 2018 and 31 March 2019, and published by 30 April 2019
The overall effectiveness profile of local authorities has improved.
As at 31 March 2019, the proportion of LAs judged good or outstanding for overall effectiveness increased to 46%. After each LA’s first Single Inspection Framework (SIF) inspection it was 36%. The proportion judged inadequate has dropped from 22% after each LA’s first SIF, to 13%.
The percentage of LAs judged good or outstanding in the judgment “help and protection” remains low.
The percentage of LAs judged good or outstanding in the judgment of help and protection has improved to 35%. After each LA’s first SIF inspection it was 28%.
The overall number of children’s homes continues to rise but the number of local authority-run homes continues to decrease.
As at 31 March 2019, there were 2,304 children’s homes of all types, a 4% increase on the previous year (2,209). LAs reduced the number of homes they run from 423 in March 2018 to 418 in March 2019. Nearly 1 in 3 LAs do not run any children’s homes.
Four in five children’s homes are judged good or outstanding.
At the end of March 2019, 80% of active and inspected children’s homes were judged good or outstanding at their most recent inspection. This is one percentage point lower than at 31 March 2018.
Ofsted cancelled 14 registrations in 2018-19, the highest number in one year.
During 2018-19, Ofsted cancelled 12 registrations of children’s homes and two registrations of independent fostering agencies. This is the highest number ever cancelled in one year.
Introduction
Ofsted reports annually on social care inspections and outcomes for local authorities (LAs) and regulated social care provisions in England.
Out of the 12 million children living in England just over 400,000 (3%) are in the social care system at any one time. More than 75,000 of these children are children in care. Across England, there are 152 LAs responsible for ensuring and overseeing the effective delivery of social care services for children. We inspect these LAs to see how their children’s services are performing.
LA children’s services are inspected under the Inspections of Local Authorities’ Children’s Services (ILACS) framework, which was introduced on 1 January 2018. This year, 1 April 2018 to 31 March 2019, represents the first full year of ILACS inspections.
The previous framework, Single Inspection Framework (SIF), ended in October 2017 but it was agreed that Ofsted would still use the SIF for some re-inspections of inadequate LAs up until summer 2018. The last re-inspection under the SIF took place in June 2018. Throughout this release, when we refer to LAs improving or declining, we are comparing the current position to the picture after each LA’s first SIF inspection.
Between 1 April 2018 and 31 March 2019, Ofsted visited 121 LAs under the ILACS framework. In an average year of SIF inspections, only around 40 LAs were visited.
Ofsted regulates and inspects providers who offer placements for children in care, and inspects providers of residential accommodation for children in boarding schools and further education colleges in England. As at 31 March 2019, there were 3,018 active providers of these services. More information about the different types of providers can be found in the glossary.
In this release, when we talk about children’s homes we refer to all three sub-types of homes, unless stated otherwise.
The three sub-types are:
- children’s homes
- residential special schools registered as children’s homes
- and secure children’s homes
All social care providers are inspected by Regulatory Inspectors and Her Majesty Inspectors under the Social Care Common Inspection Framework (SCCIF), except for secure training centres where there is a joint inspection with other inspectorates. [footnote 1]
Most of the providers are inspected annually. These include:
-
children’s homes
-
residential special schools
-
secure training centres
-
and residential holiday schemes for disabled children
Other social care providers receive an inspection once every three years unless there is a cause for concern (and may receive extra concern-driven inspections).
Inspection of local authority children’s services
The SIF was replaced by the ILACS programme in January 2018, so this year, 1 April 2018 to 31 March 2019, represents the first full financial year of ILACS.
Under the ILACS framework, Ofsted inspects LAs based on the intelligence we have about them, including their most recent inspection judgment. The inspection judgment profile for LAs continues to improve compared to after each LA’s first SIF. More LAs are now judged good or outstanding, and fewer judged inadequate. All those that are judged inadequate continue to receive a series of monitoring visits, followed by a standard inspection, to monitor their progress.
Regionally, the picture is also improving with half of the regions increasing their percentage of LAs judged good or outstanding. This year saw the end of the SIF programme, with the last re-inspection taking place in June 2018.
Overall LA effectiveness as at 31 March 2019
The picture for all LAs as at 31 March 2019 continues to improve, with 46% of LAs now judged good or outstanding. The position after each LA’s first SIF inspection was 36%, and as at 31 March 2018 it was 38%. There has also continued to be a fall in the percentage judged inadequate, decreasing to 13% from 22% after each LA’s first SIF, and from 15% as at 31 March 2018.
Figure 1: LA overall effectiveness after each LA’s first SIF inspection and at 31 March 2018 and 2019
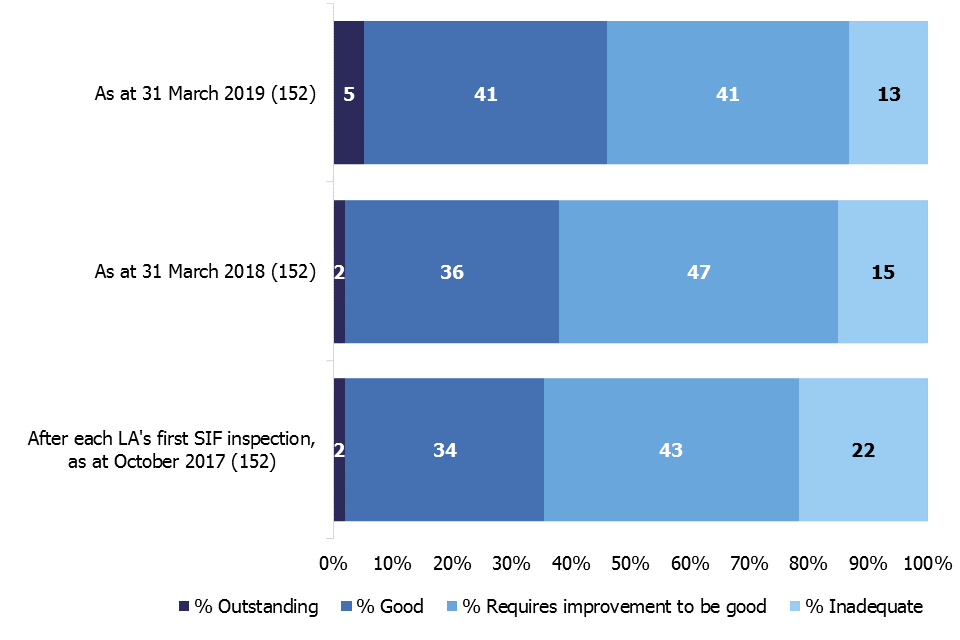
This chart shows the overall effectiveness profiles for LAs after each LA's first SIF inspection, at 31 March 2018 and 2019. The chart shows the grade profile is continuing to improve with more LAs now judged good or outstanding.
Figure 2: LA overall effectiveness judgments as at 31 March 2019
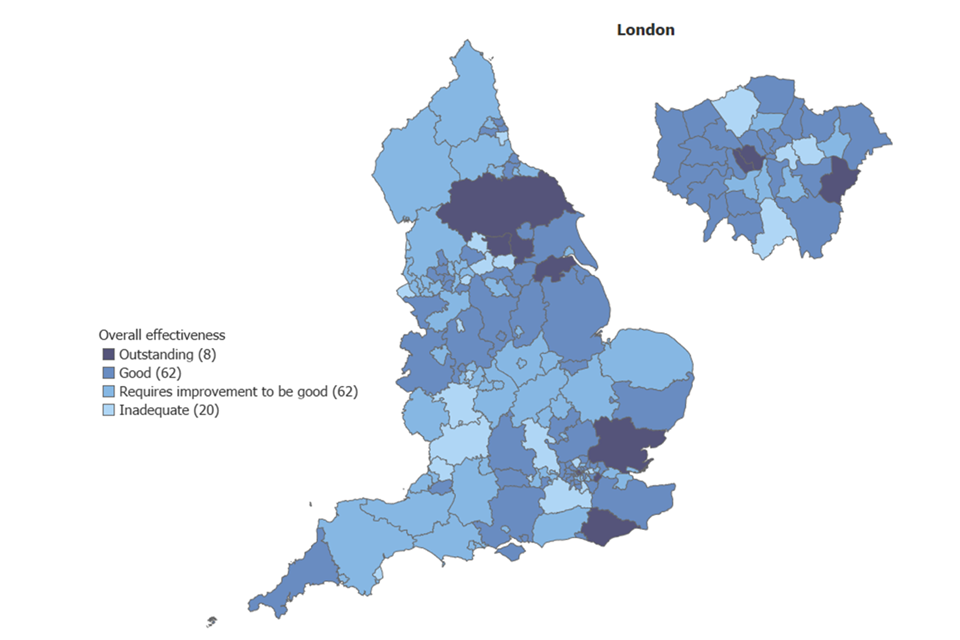
A map of England showing the overall effectiveness breakdown by local authority as at 31 March 2019.
Regional breakdown as at 31 March 2019
As at 31 March 2019, half of all regions had improved on the percentage of LAs judged good or outstanding compared with after each LA’s first SIF inspection. The other half remained at the same percentage; no regions declined.
Figure 3: Percentage of LAs judged good or outstanding by region, at 31 March 2019
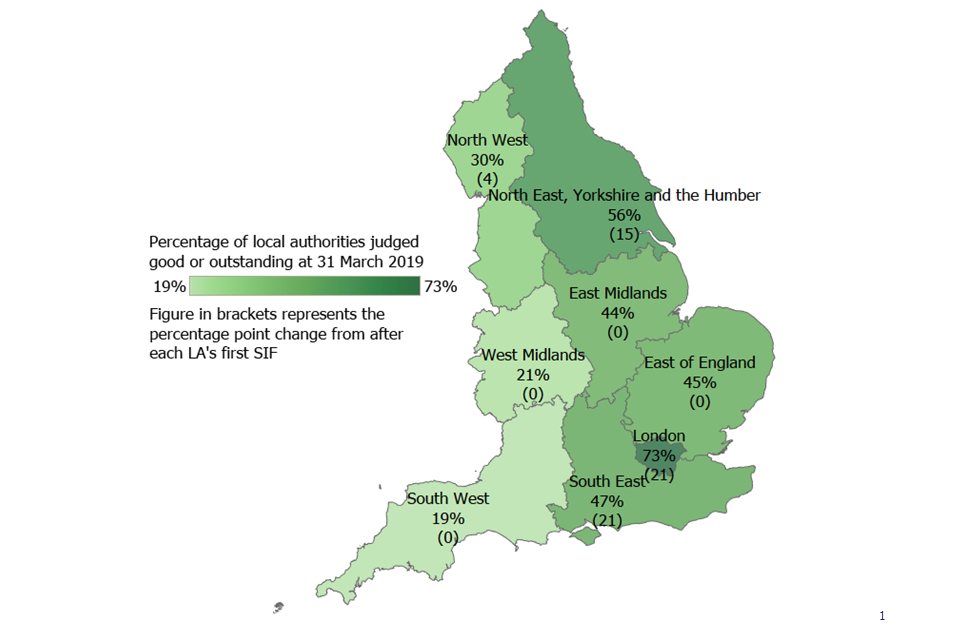
A map of England showing a breakdown by region of LAs judged good or outstanding as at 31 March 2019. The map also shows the percentage point change from after each LA’s first SIF inspection.
Breakdown by local authority type
As at 31 March 2019, when we look at the breakdown of overall effectiveness by the main types of LAs, the London boroughs have the highest percentage of LAs judged good or outstanding at 73%. They also had the highest percentage the previous year. Unitary authorities have the lowest percentage judged good or outstanding at 35%; again, the same picture as last year.
Figure 4: LA overall effectiveness judgment split by LA type, at 31 March 2019
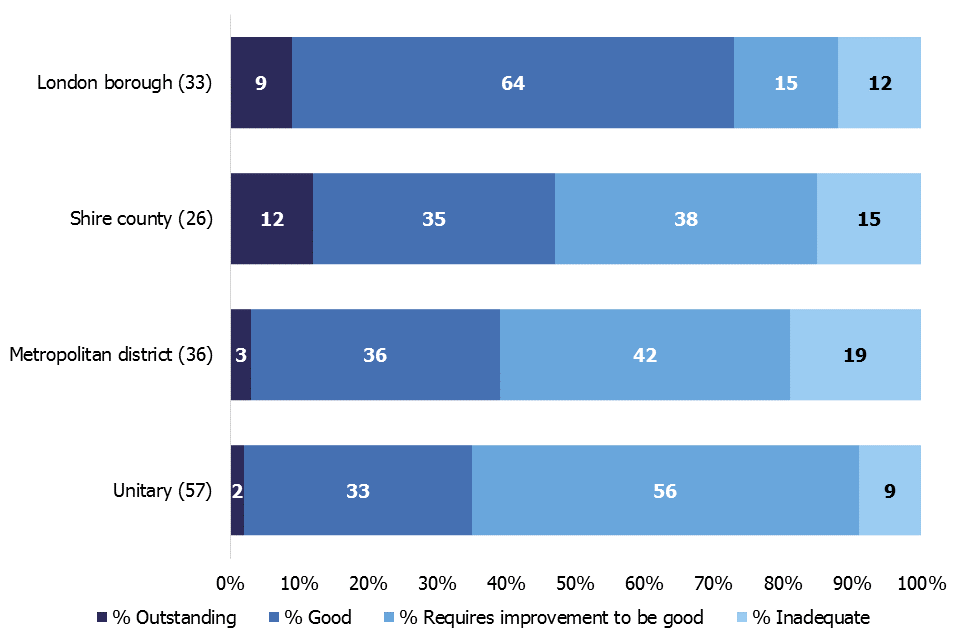
This bar chart shows the overall effectiveness breakdown of LAs by LA type as at 31 March 2019.
ILACS activity as at 31 March 2019
Since the ILACS framework came into effect in January 2018, Ofsted has conducted 43 short or standard ILACS inspections. All but one of these inspections was carried out between 1 April 2018 and 31 March 2019. Of these 43 inspections, 33 were standard inspections and 10 were short inspections. Over half of these inspections were judged good or outstanding (56%), 33% requires improvement to be good, and 12% inadequate.
Judgments as at 31 March 2019
Under the ILACS programme, “children in need of help and protection”, and “children in care and care leavers” remain comparable judgments to the SIF.
For both judgments, the percentage of LAs judged to be good or outstanding has increased, from 28% to 35% for help and protection, and from 38% to 46% for children in care and care leavers. Although both have seen an improvement, the percentage remains low for help and protection.
In the judgment of children in need of help and protection, four LAs are now judged to be outstanding. After each LA’s first SIF, none had received this judgment in this area.
ILACS activity between 1 April 2018 and 31 March 2019
Between 1 April 2018 and 31 March 2019, 121 LAs had some sort of ILACS inspection activity. A total of 165 visits or inspections were carried out to these LAs.
Figure 5: ILACS inspection activity between 1 April 2018 and 31 March 2019
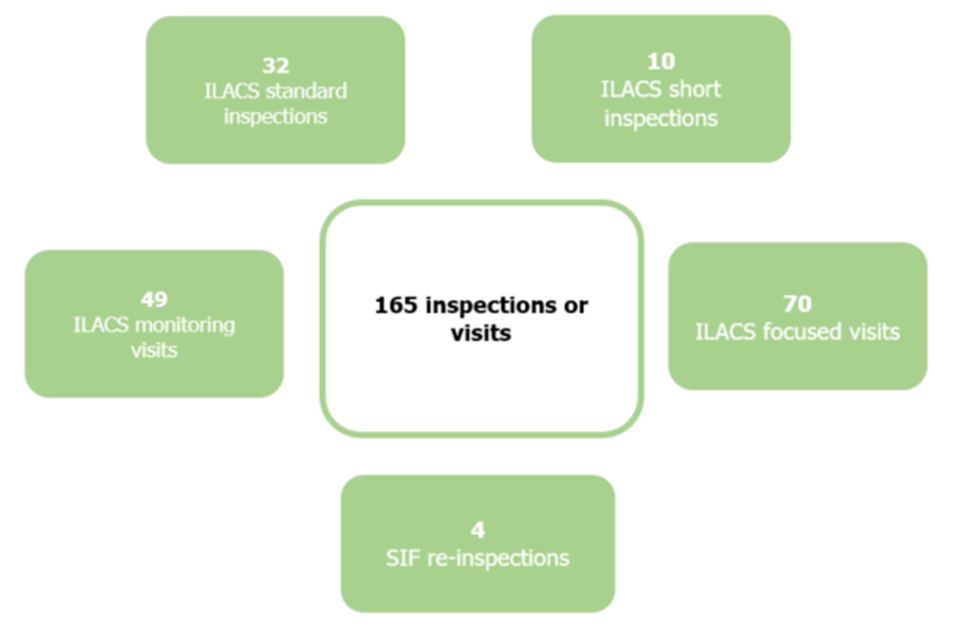
This image shows the breakdown of ILACS inspection activity between 1 April 2018 and 31 March 2019.
ILACS short and standard inspections
Between 1 April 2018 and 31 March 2019, Ofsted carried out 42 ILACS standard or short inspections. Of these 42 inspections, more LAs improved than declined their overall effectiveness judgment. Twenty-one LAs improved their judgment, 15 retained the same judgment, and six declined, as shown in figure 6 below.
Two of the 21 LAs which improved did so by two inspection grades: Bromley from inadequate to good, and Bexley from requires improvement to be good to outstanding.
Figure 6: Improvement in England between 1 April 2018 and 31 March 2019 - overall effectiveness (number)
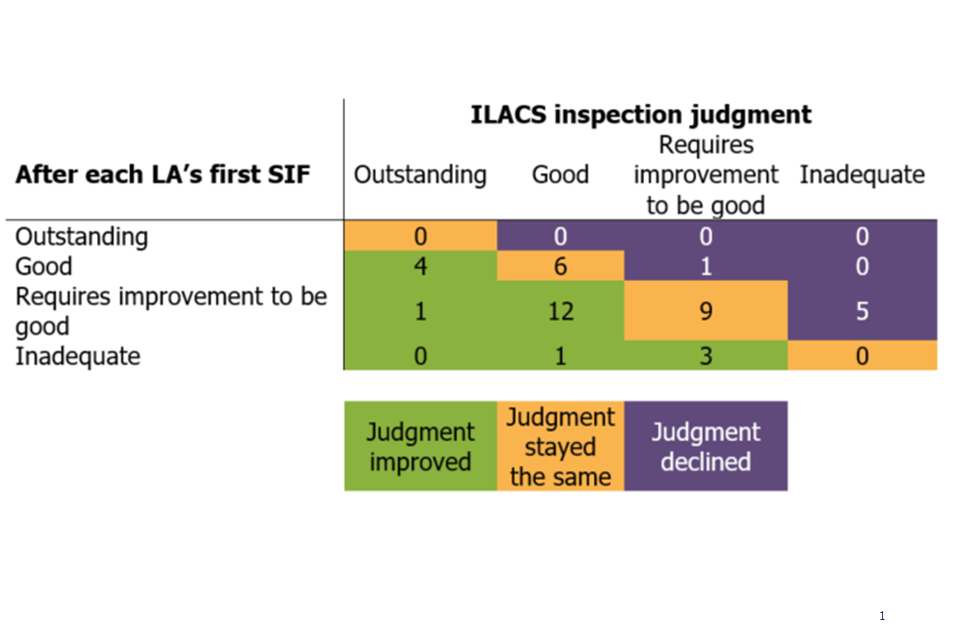
This chart shows the improvement in overall effectiveness outcomes for ILACS standard or short inspections that took place between 1 April 2018 and 31 March 2019 compared with after each LA’s first SIF.
Inadequate local authorities and their monitoring visits
Of the 23 LAs judged inadequate as at 31 March 2018, all saw inspection activity during 2018-2019.
Ten of these LAs received either a standard ILACS inspection or a SIF re-inspection, where they could change their overall effectiveness judgment. [footnote 2] Eight LAs improved, one LA by two grades. All other inadequate LAs received at least one monitoring visit during the year.
Monitoring visits are carried out on a regular basis to LAs judged inadequate to support them in improving their services for children. The visits are bespoke to each LA, depending on the LA’s areas for improvement and the stage which they are at on their improvement journeys. Between 1 April 2018 and 31 March 2019, Ofsted carried out 49 monitoring visits to 21 LAs.
ILACS focused visits
Focused visits are for inspectors to evaluate an aspect of service, a theme, or the experiences of a cohort of children. This type of visit does not result in a judgment. Instead, the LA is issued with a letter setting out narrative findings about strengths and areas to improve. This is also published on the Ofsted website. Between 1 April 2018 and 31 March 2019, Ofsted carried out 70 focused visits to 67 LAs.
The 2 most common themes for visits are ‘front door’ (41%) and ‘children in need/subject to a plan’ (26%). The frequency of these types of themed visits is to be expected since this is the first full year of ILACS inspections.
Figure 7: ILACS focused visits by theme between 1 April 2018 and 31 March 2019
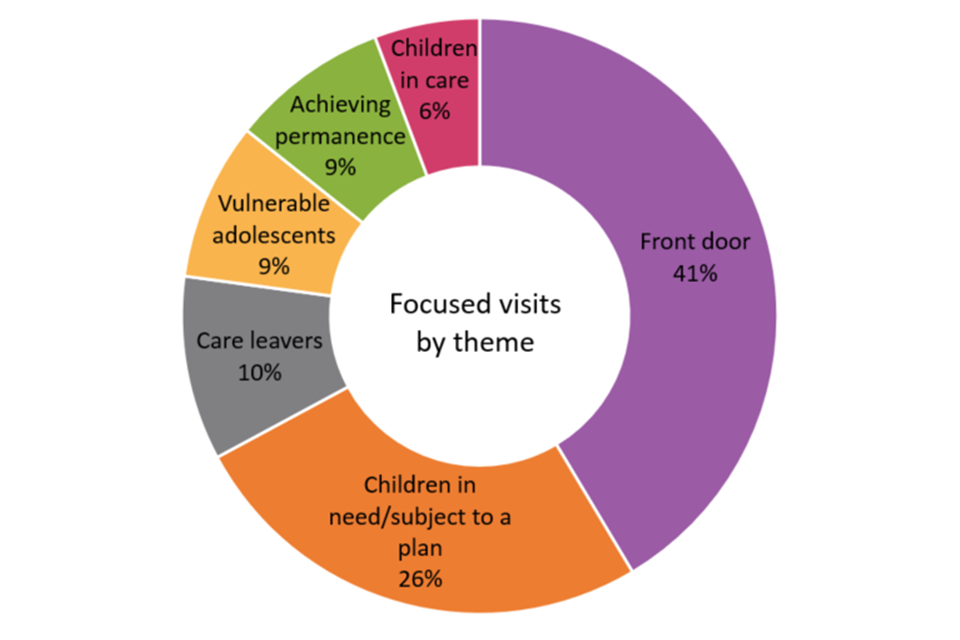
This donut chart shows the breakdown of ILACS focused visits by theme between 1 April 2018 and 31 March 2019.
Only 4 of these 67 focused visits to LAs (2 ‘front door’ and 2 ‘vulnerable adults’) were then followed by an ILACS standard or short inspection. At these subsequent ILACS inspections, 2 of these LAs were judged good, one requires improvement to be good, and one inadequate.
Children’s homes
In this section we report on the three types of children’s homes:
- children’s homes
- residential special schools registered as children’s homes
- and secure children’s homes
The sub-category of children’s homes also includes respite/short breaks only children’s homes.
The number of children’s homes in England continues to increase, as more privately-run homes open. The number of registered places has also increased since 2018, albeit at a slower rate. However there was a drop in the number of places in residential special schools registered as children’s homes.
The inspection profile of children’s homes as at 31 March 2019 remains positive overall, with small changes within the sectors and provision types. Nationally, most homes continue to be judged good or outstanding. However, fewer homes improved in 2018 to 2019 than in the previous year in both full and interim inspections.
A small number of homes were judged inadequate in 2018 to 2019. They received inspections throughout the year to check the improvement activity, and most had improved by the end of the year.
LA-run homes perform better than homes in the private and voluntary sectors. Compared to the previous year, fewer secure children’s homes and residential special schools registered as children’s homes were judged good or outstanding.
Providers and places as at 31 March 2019
There were 2,304 children’s homes as at 31 March 2019, a 4% increase (95 homes) from the previous year (2,209). These homes were registered for 12,035 places, a 2% increase from 11,746 as at 31 March 2018.
The rise in the number of places did not keep pace with the increase in the number of homes. The consistent pattern over the last 4 years has been of homes increasing at a greater rate than places. While the number of all children’s homes increased by 11% between March 2015 and March 2019, the number of places increased by 3% over the same period.
Joiners and leavers in 2018 to 2019
Between 1 April 2018 and 31 March 2019, 204 children’s homes and 5 residential special schools registered as children’s homes opened (with 918 places). Meanwhile, 110 children’s homes and 4 residential special schools registered as children’s homes closed (650 places). This resulted in a net increase of 95 homes and 268 places.
Of the 4 residential special schools registered as children’s homes that closed, 2 re-registered as children’s homes due to change in ownership, one closed completely, and one registered and closed within the same year. A further 3 schools of this type have become children’s homes in 2018 to 2019.
Twelve homes were cancelled by Ofsted, the highest number of cancellations in one year since 2007. The majority of these were due to the cancellation of 2 provider chains, one with 5 homes and one with 4 homes. The remaining 102 homes that closed during the year were voluntary de-registrations, where the home applies to close their registration with Ofsted. However, 1 in 4 of these voluntary de-registrations followed compliance activity by Ofsted. Compliance activity involved Ofsted issuing a non-compliance notice, restriction of accommodation, suspension or a notice of proposal to cancel. Two children’s homes both opened and closed within the year.
Out of 206 newly registered homes that were still active as at 31 March 2019 (excluding 3 children’s homes of all types that both opened and closed within the same year), 17 (8%) were re-registrations of children’s homes which closed at some point in the previous 12 months. All bar one re-registration was due to a change in ownership. Of the remaining 189 homes which opened in 2018 to 2019, 125 were opened by organisations that already owned at least one other children’s home. Of these, 2 in 5 were opened by large organisations (those which own more than 10 homes).
Figure 8: The change in the number of children’s homes of all types between 31 March 2018 and 31 March 2019
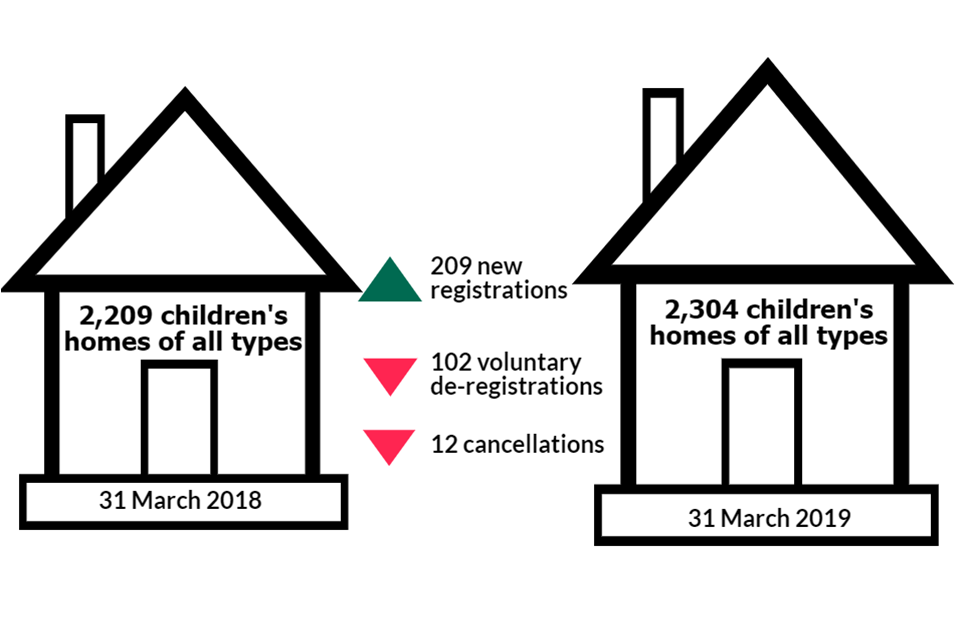
This image shows the number of children's homes of all types as at 31 March 2018 compared with the number as at 31 March 2019 and the number of new registrations, voluntary de-registrations and cancellations in 2018 to 2019.
Children’s homes are not distributed evenly across the country see Additional charts tab in underlying data. Nearly a quarter of all children’s homes, and 1 in 5 available places, are in the North West region. Only 1 in 20 homes, and 1 in 18 places, is in London.
Table 1: The number of children’s homes and the residential special schools registered as children’s homes and the number of places as at 31 March 2019 by region
| Region | Number of children’s homes | Number of places in children’s homes | Number of residential special schools registered as children’s homes | Number of places at residential special schools registered as children’s homes |
|---|---|---|---|---|
| England | 2,221 | 9,791 | 69 | 2,006 |
| North West | 543 | 2,060 | 9 | 224 |
| West Midlands | 389 | 1,450 | 13 | 333 |
| South East | 282 | 1,532 | 14 | 552 |
| East Midlands | 224 | 996 | 10 | 338 |
| Yorkshire and The Humber | 203 | 938 | 8 | 163 |
| South West | 169 | 622 | 10 | 310 |
| East | 167 | 876 | 5 | 86 |
| North East | 134 | 666 | 0 | 0 |
| London | 110 | 651 | 0 | 0 |
Five out of 8 regions saw an increase in the number of children’s homes during 2018 to 2019. The highest gains were in the regions that already have the highest number of homes:
- North West (34 homes, 7% increase)
- West Midlands (24 homes, 6% increase)
- East Midlands (24 homes, 11% increase)
The 3 regions with a net loss in homes were:
- South West (4 homes)
- London (3 homes) – 2 of the regions that already had the fewest homes
- South East (1 home).
The children placed from LAs in London and South West have the furthest to travel on average of any children.
The distribution of the children’s homes necessarily has an impact on the distances that children travel to be placed in those homes. Some analysis of the most recent available data on these distances, as at 31 March 2018, demonstrates this: [footnote 3]
Table 2: Average distance from home to the children’s home, by region, as at 31 March 2018
| Region where child originally lived | Average distance in miles from home to the children’s home |
|---|---|
| England | 36 |
| North West | 21 |
| Yorkshire and Humber | 25 |
| West Midlands | 26 |
| North East | 28 |
| East Midlands | 29 |
| South East | 43 |
| East | 49 |
| South West | 54 |
| London | 60 |
Children from the North West (around 1,100 as at March 2018), where around a quarter of children’s home were located, travelled the shortest distances on average.
Children from London (around 780 as at March 2018), where around one twentieth of homes were located, had the furthest to travel. This subject, and its many nuances, will be further explored in the Ofsted Annual Report, published later this year.
Split between sectors
Not all sectors saw an increase in the number of homes. While the number of privately-owned homes increased by 102 homes, the homes owned by LAs and voluntary organisations decreased by 5 and 2 respectively compared with March 2018. This is a continuation of the trend in recent years.
In the past 4 years, there has been a 19% increase in the private sector, an 8% decrease in LA-run homes, and a 5% decrease in voluntary-run homes. Nearly 3 in 4 children’s homes in England are now owned by organisations that are run for profit.
Figure 9: The increase in the number of children’s homes run by private companies in England since 31 March 2016

This line chart shows the number of children's homes (of all types) by sector. The data compares the numbers as at 31 March 2016 and 31 March 2019.
Of the newly registered homes in 2018 to 2019, 86% were opened by private organisations, 10% by LAs and 4% by voluntary sector organisations.
The number of children’s homes run by LAs continues to fall (see Figure 9). The number of LAs which run their own children’s homes has been decreasing year on year from 76% (115 out of 152) in March 2016 to 69% (105 out of 152) in March 2019. As at 31 March 2019, nearly 1 in 3 (47) LAs in England did not run any children’s homes in their area.
During 2018 to 2019, 19 LAs reduced the number of homes they run, and 11 LAs opened more homes. Most LAs (8 out of 11) opened one new home, while Devon opened 4 new homes - the largest increase among LAs. Five LAs closed their remaining homes: Cambridge, Leicestershire, Ealing, Haringey and Tower Hamlets.
The number of places per children’s home
In this section we are only focussing on children’s homes, as they are where most children live. This excludes residential special schools registered as children’s homes, and secure children’s homes.
The greatest number of children’s homes are registered to accommodate 3 or 4 children. They accounted for 44% of children’s homes in England as at 31 March 2019.
Nearly half of newly opened children’s homes (excluding the 2 children’s homes that opened and closed within the year) in 2018 to 2019 (95 out of 202) were registered to accommodate 3 or 4 children. This is very similar to previous years.
Figure 10: Distribution of children’s homes by the number of registered places as at 31 March 2019

This bubble chart splits children's homes by the numbers of children each can accommodate. The largest group are children's homes that can accommodate 3 to 4 children.
Residential special schools registered as children’s homes
In addition to the above findings about the overall number of children’s homes providers and places, the following 2 sections provide additional information about 2 specific types of children’s homes: residential special schools registered as children’s homes, and secure children’s homes.
The number of residential special schools registered as children’s homes continues to fall but at a slower rate than in previous years. There were 69 residential special schools as at 31 March 2019, compared with 71 at 31 March 2018. Over the last 5 years, the number of homes decreased by 22% (from 88 in March 2014). The number of places has fluctuated over the same period, but has decreased by 14% overall, from 2,331 places in March 2014 to 2,006 in March 2019.
As at 31 March 2019, 49 homes (with 1,384 places) were run by private companies, 16 (with 520 places) by voluntary organisations, and 4 (with 102 places) by LAs.
Overall, during 2018 to 2019, 2 regions (East Midlands and West Midlands) gained at least one new residential special school registered as a children’s home, and the remaining 5 regions had one less each. The South East continues to have the largest number with 14 homes and 552 places, and the East has the fewest with 5 homes and 86 places– (See table 1 for more information).
Secure children’s homes
As at 31 March 2019 there were 14 secure children’s homes offering 238 places. However, one home (with 7 places) is not operating at the moment due to renovation works. The number of homes has stayed at 14 over the last 4 years. However, the number of places has changed slightly year on year and increased by 4 over the last year. All bar one secure children’s homes are run by LAs.
Inspection profile as at 31 March 2019
As at 31 March 2019, 2,192 (95% of active children’s homes of all types) had an inspection judgment. The remaining 112 homes had not yet received a full inspection as at 31 March 2019, either because they were newly registered or had not yet had any children in placement. For 4 children’s homes the overall effectiveness judgment was changed at the monitoring visit: 3 homes improved from inadequate to requires improvement to be good, and one home from inadequate to good. These are the latest inspections outcomes for these 4 homes.
Figure 11: Grade profile of all types of children’s homes as at 31 March 2019

This bar chart shows the grade profile of all children's homes and of each type of children's homes: children's homes, residential special schools registered as children's homes, and secure children's homes as at 31 March 2019.
Across all inspected children’s homes, the grade profile was similar to previous years. Four in five homes (1,755 out of 2,192, 80%) were judged good or outstanding, slightly lower than the previous year (1,728 out of 2,123, 81%). Although more homes were judged outstanding, fewer were judged good compared with 31 March 2018.
Figure 12: Change in overall effectiveness of children’s homes at their most recent inspection at 31 March over the last 4 years

This line chart shows the overall effectiveness grade profile of children's homes as at 31 March 2016 compared with the grade profile as at 31 March 2019.
As shown in figure 11, the grade profile of children’s homes is very similar to the overall grade profile of all types of children’s homes. The most notable change in the overall effectiveness grade profile between 31 March 2018 and 31 March 2019 was in secure children’s homes. Two homes previously judged outstanding dropped to good, and 3 homes declined from good to requires improvement to be good. Over the last 4 years there was a decline in the grade profile of secure children’s homes from all being judged good and outstanding as at 31 March 2016 to two thirds as at 31 March 2019.
Figure 13: Change in the grade profile of secure children’s homes at their most recent inspection between 31 March 2016 compared with 31 March 2019

This bar chart shows the decline in grade profile of secure children's homes as at 31 March from 2016 to 2019.
There has also been a decrease in the percentage of good or outstanding residential special schools registered as children’s homes from 79% as at 31 March 2018 to 71% as at 31 March 2019. Looking over the last 4 years, following the 2 years of improved performance, the percentage of good and outstanding homes returned to the level seen as at 31 March 2016. This change could be attributed to the fact that two thirds of the settings that closed over the last 3 years were either good or outstanding.
Figure 14: Change in the grade profile of residential special schools registered as children’s homes at their most recent inspection between 31 March 2016 compared with 31 March 2019

This bar chart shows the change in the grade profile of residential special schools registered as children's homes as at 31 March from 2016 to 2019.
Unlike the previous year, in most regions the percentage of children’s homes judged good or outstanding has decreased, in 3 of them by 5 percentage points. The West Midlands and South West have seen an increase in the percentage of homes judged good or outstanding (by 2 and 1 percentage points respectively). Because of all these changes, the gap between the regions with the highest and the lowest percentages of children’s homes judged good or outstanding reduced from 25 percentage points at 31 March 2018 to 21 percentage points as at 31 March 2019.
Figure 15: All children’s homes overall effectiveness at their most recent inspection as at 31 March 2019

This map shows the percentage of children's homes of all types judged good or outstanding in each region as at 31 March 2019 and the percentage point change from 31 March 2018.
Overall, LA-run homes have performed better than privately-run homes over the last 5 years. More LA-run homes were judged either good or outstanding as at 31 March 2019 (86%) than any other sector. While the LA sector saw an increase in the percentage of homes judged good or outstanding, the other sectors saw a decline in 2018 to 2019.
The voluntary sector saw a drop in the percentage of good or outstanding homes from 85% as at 31 March 2018 to 77% as at 31 March 2019. Good and outstanding homes in the private sector decreased by one percentage point from 80% to 79% as at 31 March 2019.
Figure 16: All children’s homes overall effectiveness as at 31 March 2019 by sector

This bar chart shows the grade profile of all children's homes overall and for each sector: local authority, private and voluntary. Local authority-run homes have the best grade profile of all sectors.
Inspections of children’s homes during 2018 to 2019
Between 1 April 2018 and 31 March 2019, there were 3,074 inspections of children’s homes of all types, a small increase from 3,065 inspections in 2017 to 2018. However, there has been a change in the makeup of inspections. Ofsted conducted more full inspections this year, as more new homes opened. There were also more monitoring visits but fewer interim inspections compared with the previous year.
Figure 17: Children’s homes inspections in 2018 to 2019 by type

This pie chart shows the split of all children's homes inspections completed in 2018 to 2019 by the type of inspection. Nearly three quarters of inspections were full inspections and the remainder were interim inspections and monitoring visits.
The 2,274 full inspections in 2018 to 2019 covered 2,183 children’s homes as some homes had more than one inspection in the year. Of these homes, 2,006 also had an inspection grade at 31 March 2018.
More homes improved their overall effectiveness judgment at their first inspection in 2018-19 (389 out of 2,006) compared to the previous year (313 out of 1,872). Despite this, the proportion and the number of homes that declined was higher (412 out of 2,006). Fewer homes retained their previous inspection judgment compared with the last year.
Looking over the four-year period, before and after the Social Care Common Inspection Framework (SCCIF) was introduced, it appears that 2017 to 2018 was an isolated year when there was a decline in the performance of children’s homes. This is expected following the introduction of the new inspection framework. In 2018 to 2019, the proportion of homes that improved at their first inspection in year was higher and returned to the level seen in 2016 to 2017, before the SCCIF framework.
Figure 18: Change in the children’s homes inspection grade on the first full inspection compared with the previous inspection grade between 2015 to 2016 and 2018 to 2019

This stacked column chart shows the change in percentage of children's homes whose overall effectiveness grade improved, remained the same or declined over the last 4 years.
Of the 2,183 children’s homes which received a full inspection in 2018 to 2019, 121 were initially judged inadequate. Of these, 94 had a subsequent full inspection or a monitoring visit where the judgment was changed (3 homes changed to requires improvement to be good, and 1 to good).
The remaining 27 homes judged inadequate in 2018 to 2019 did not have a subsequent full inspection during the year (see figure 19 for full breakdown). As figure 19 shows, 8 homes had no further inspection activity of any type in year. One of them resigned, and the remaining 7 received an inadequate judgment in the last quarter of the year hence were not due for their next inspection.
Figure 19: Inspection activity of children’s homes initially judged inadequate in 2018 to 2019
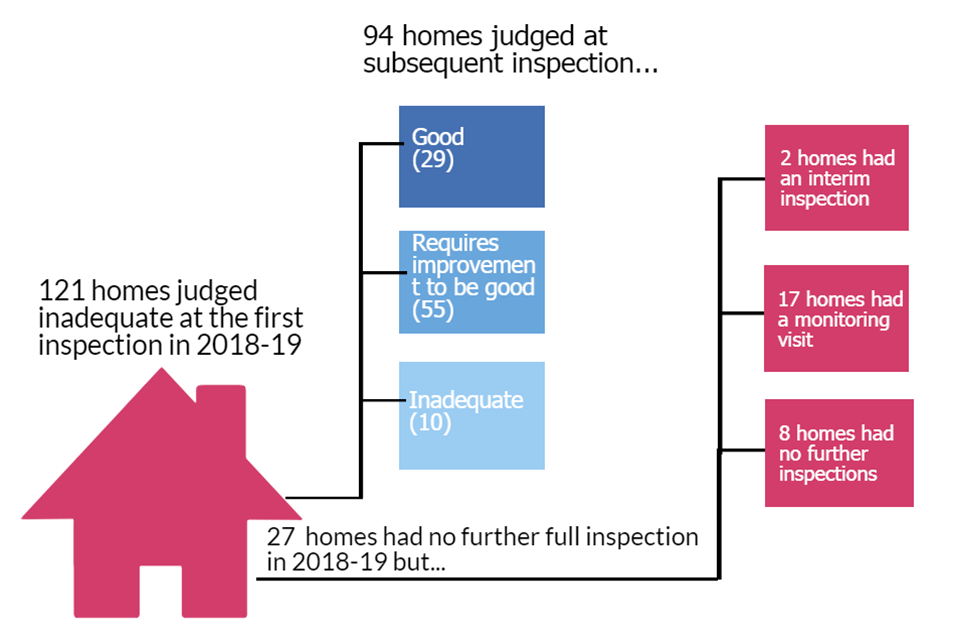
This image shows the number of children's homes judged inadequate at the first inspection in 2018 to 2019 and their subsequent inspection activity in 2018 to 2019.
Interim inspections
The period covered by this publication (1 April 2018 to 31 March 2019) was the second year of a new approach to interim inspections: a measure introduced under the SCCIF legislation. Only children’s homes which have been judged requires improvement to be good or inadequate, and homes judged good or outstanding which had been subsequently assessed as high-risk, receive interim inspections.
There were 503 interim inspections conducted in 2018 to 2019, a drop from 576 in 2017 to 2018, but a substantial change from 2016 to 2017 (1,823), the year before the introduction of the SCCIF.
There was a change in the outcomes of interim inspections in comparison with the previous year. A smaller proportion of homes were judged to have improved effectiveness or declined effectiveness but a higher proportion – nearly half (226 out of 461) - were judged to have sustained their effectiveness. The low proportion of homes judged to have improved effectiveness is expected as the interim inspections are concern-driven. [footnote 4]
Figure 20: Children’s homes interim inspection outcomes, 2016 to 2017 to 2018 to 2019
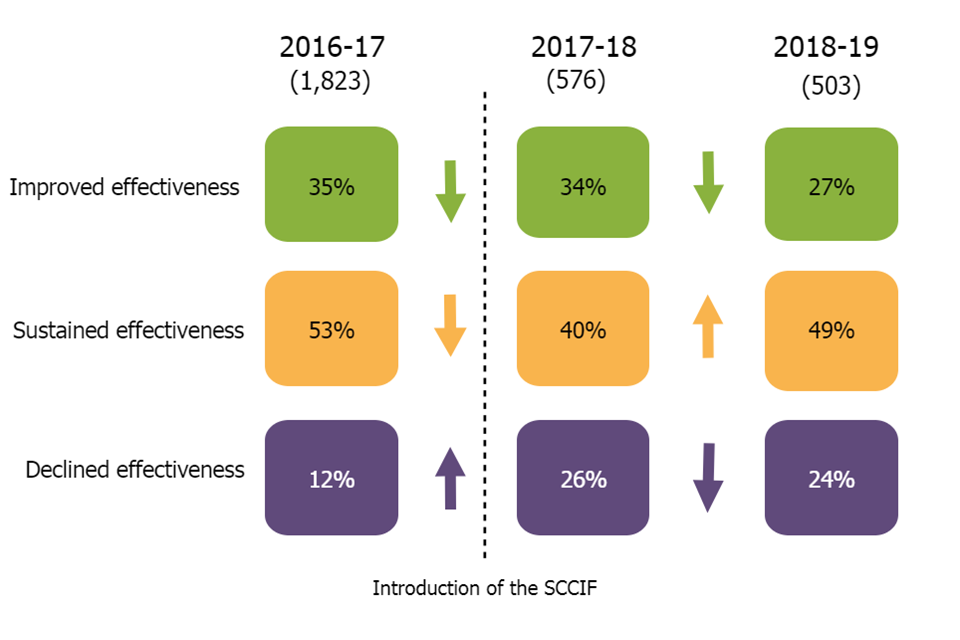
This image shows the change in the outcomes of interim inspections in comparison with the previous year over the 3 year period from 2016 to 2017 to 2018 to 2019.
In total, 464 interim inspections in 2018 to 2019 followed a full inspection in the same year. [footnote 5]
Nearly 40% of homes judged requires improvement to be good received a subsequent interim inspection in the same year (159 out of 409), a drop from nearly 50% the previous year (177 of 366).
More inadequate homes received a subsequent interim inspection than in the previous year (7% compared with 3% in 2017-18) but they were still the least likely to have an interim inspection. This is because inadequate homes continue to receive full inspections and/or monitoring visits until the home improves.
Table 3: Number and percentage of full inspections followed by an interim inspection in 2018 to 2019, by preceding full inspection judgment in the same year
| Previous full inspection judgement in 2018 to 2019 | Total full inspections | Number of interim inspections in 2018 to 2019 | Percentage of interim inspections in 2018 to 2019 |
|---|---|---|---|
| Outstanding | 396 | 19 | 5% |
| Good | 1,338 | 277 | 21% |
| Requires improvement to be good | 409 | 159 | 39% |
| Inadequate | 131 | 9 | 7% |
| Total | 2,274 | 464 | 20% |
Children’s homes judged good at the full inspection in 2018 to 2019 were more likely to receive a judgment of sustained effectiveness at the subsequent interim inspection (54%) than those judged requires improvement to be good (39%).
Independent Fostering Agencies
The number of independent fostering agencies (IFAs) remains stable. Several independent agencies provide fostering services on behalf of LAs and although most agencies are owned by private companies those run by voluntary organisations perform slightly better.
Nationally, the percentage of all IFAs judged good or outstanding remains high and increased further over the last year.
Providers and places as at 31 March 2019
Most children in care (73%) are in foster placements, which are provided by LA fostering agencies or independent fostering agencies (IFAs). According to Ofsted’s most recent statistics, over a third of all fostered children (around 18,000) are placed through IFAs. The number of IFAs has varied over the years. As at 31 March 2019 there were 305 IFAs, a small decrease of 1% from 308 as at 31 March 2018, but similar to the end of March 2017 figure of 304. Four in five IFAs are owned by a private company; the rest are run by voluntary organisations.
In summer 2019 Ofsted intends to publish data on the biggest organisations that own IFAs.
During 2018 to 2019, 13 new IFAs opened and 13 resigned. Two IFAs were cancelled by Ofsted; both were run by private companies.
The IFAs operate across large areas of the country and often provide foster placements across several LAs or regions. It is therefore difficult to know if the number of agencies in the region reflects the number of available fostering places in that area.
As at 31 March 2019, the highest number of IFAs were based in the South East region (61 out of 305, 20%), followed by London (56 agencies, 18%). The East Midlands region had the smallest number of IFAs in England at 15 (5%).
Inspection profile as at 31 March 2019
LA fostering agencies are inspected as part of Inspections of Local Authority Children’s Services (ILACS), and IFAs are inspected under the SCCIF, on a three-year inspection cycle.
Nine LAs have alternative delivery models where all the statutory functions are delegated to third party bodies, a Children’s Trust or a not-for-profit organisation. [footnote 6] There is also a small number of LAs who have delegated part of their functions to other organisations. All agencies who perform the fostering function of LA must register with Ofsted as an IFA. They are included in the analysis and the grade profile of IFAs.
As at 31 March 2019, 284 of the 305 active IFAs (93%) had received a full inspection. Ninty-two percent of IFAs were judged good or outstanding, an increase of 3 percentage points from 89% in the previous 2 years. The agencies run by the voluntary sector have a slightly better grade profile than those run by private companies.
Figure 21: Grade profile of IFAs as at 31 March 2019
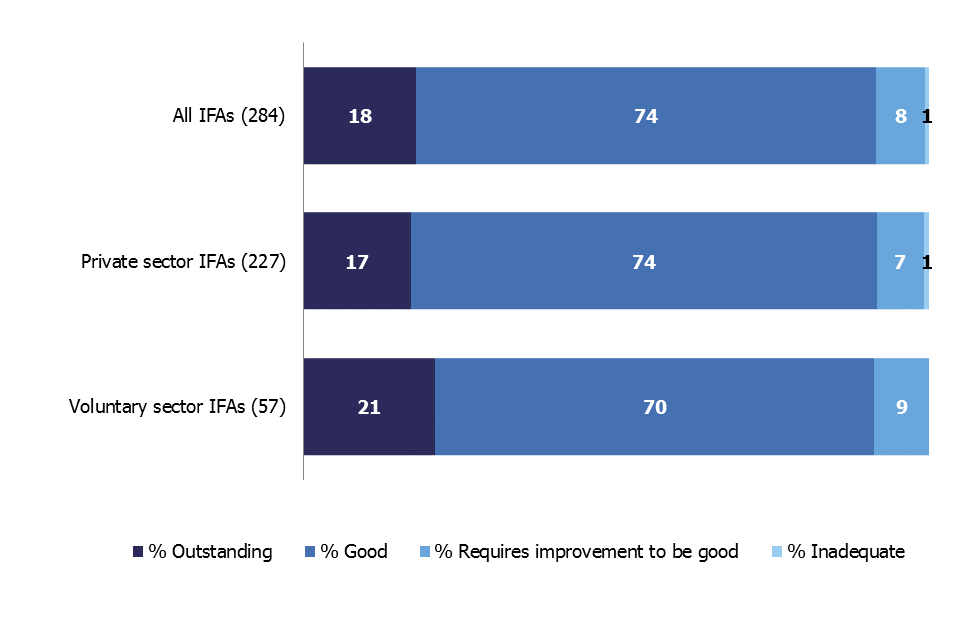
This bar chart shows the grade profile of all independent fostering agencies overall and for each sector: private and voluntary. The agencies run by the voluntary sector have a slightly better grade profile than those run by private companies.
In total, there were 138 full inspections of IFAs between 1 April 2018 and 31 March 2019, similar to the previous year (133). Four IFAs also had a monitoring visit during the year (one IFA had 2). In most cases this was following a previous inadequate judgment. Of these 4 agencies, 2 remain active, one has resigned and one had their registration cancelled by Ofsted.
Other social care providers
In this release, when we talk about ‘other social care providers’, we are referring to all providers other than children’s homes (all 3 types) and IFAs, as these providers have been discussed in their own sections within this release.
Providers and places as at 31 March 2019
For most provider types, the number of settings decreased from 31 March 2018 to 31 March 2019. The exceptions are residential family centres and voluntary adoption agencies, where the numbers increased (by 6 and 2 respectively). The increases for these 2 provider types are part of a continuing trend. The number of further education colleges also increased by one (from 42 in 2018 to 43 in 2019).
Since 2016, there has been a continued fall in the number of residential special schools, from 165 in 2016, to 139 in 2019; a 16% decrease.
Figure 22: Decrease in number of providers by type, 2016 to 2019
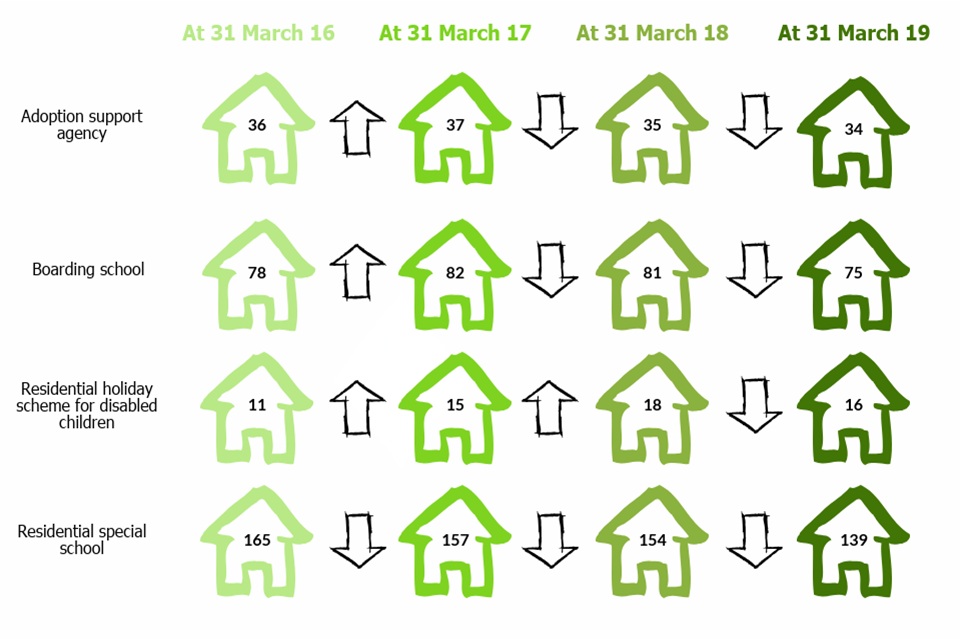
This image shows the decrease in the number of providers between 2016 to 2019 for four provider types: adoption support agencies, boarding schools, residential holiday scheme for disabled children, and residential special schools.
Data on the number of places is only available for these 4 provider types:
- residential special schools (the number of places fell by 20% to 4,034)
- boarding schools (the number of places fell by 6% to 10,067)
- further education colleges with residential accommodation (the number of places rose by 12% to 6,264)
- residential family centres (the number of places rose by 10% to 268)
Inspections of other social care providers during 2018-19
As at 31 March 2019, not including children’s homes and IFAs, there were 409 active settings; a decrease from 424 settings in the previous year. Of these 409 settings, the majority, 388 (95%), had a full inspection outcome as at 31 March 2019. Just under two thirds of these settings (235) were inspected during 2018-19. [footnote 7]
Figure 23: Inspection judgment profile at 31 March 2019
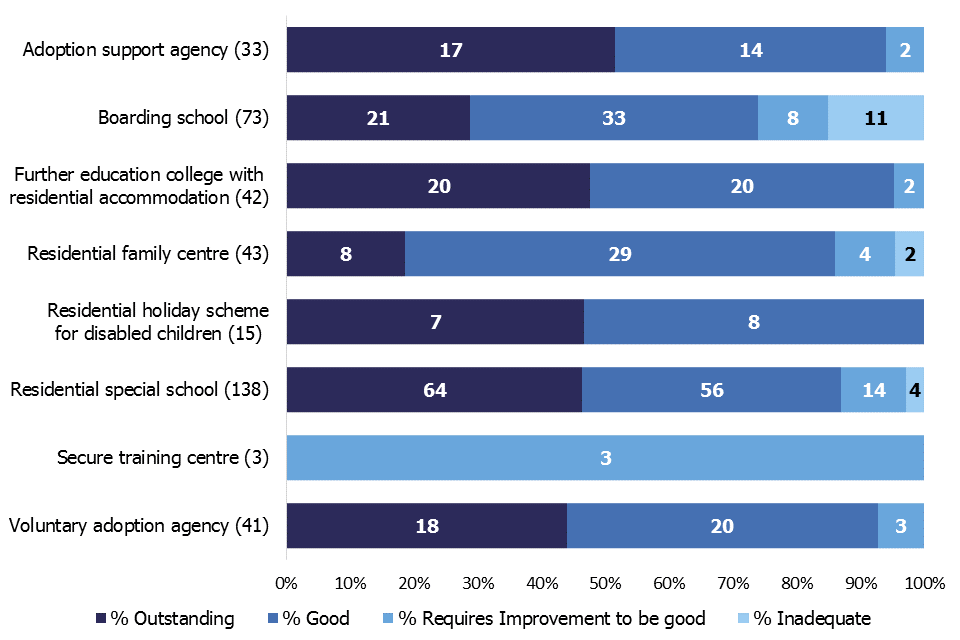
This bar chart shows the inspection judgment profile of all other social care providers as at 31 March 2019.
Between 1 April 2018 and 31 March 2019, Ofsted carried out a total of 263 inspections to 251 other social care providers.
All 3 secure training centres were inspected in the year. All 3 were judged as requires improvement to be good, which is an improvement on the previous year when 2 were judged inadequate and one requires improvement to be good.
The judgment profile for adoption support agencies has improved from last year, with 94% of providers judged good or outstanding at 31 March 2019; a 3 percentage point increase.
The picture for residential holiday schemes for disabled children has also improved, with all of them being judged either good or outstanding. In the previous year one was judged as requires improvement to be good.
Although boarding schools have the highest percentage of providers judged inadequate at 15%, this is an improvement from 17% at 31 March 2018. However, this improvement in the inspection profile for boarding schools, and residential special schools, could be attributed to the de-registration of providers judged less than good.
Six boarding schools, and 4 residential specials schools, de-registered in the year. Their overall effectiveness grades were either requires improvement to be good or inadequate. This therefore impacted the percentage of providers judged good or outstanding at 31 March 2019.
For many provider types, they returned to their 2017 good or outstanding levels, as shown in figure 22 below.
Figure 24: Change over time in percentage of settings judged good or outstanding, 2016 to 2018
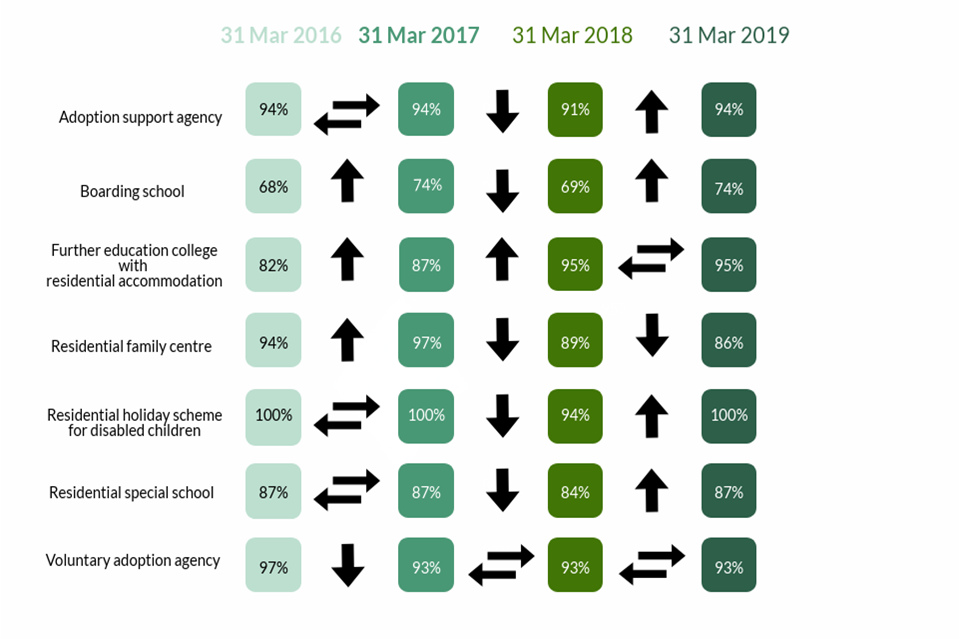
This image shows the change over time in the percentage of other social care providers judged good or outstanding from 2016 to 2019.
Acknowledgements
Thanks to the following for their contribution to this statistical release: Klara Davies & Anna Otczyk
Revisions to previous release
Revised data covering children’s homes in the period 1 April 2018 to 30 September 2018 has been released and can be found on the Ofsted website as part of this release: www.gov.uk/government/collections/childrens-social-care-statistics.
The revision of statistics relating to 1 April 2018 to 30 September 2018 from ‘provisional’ to ‘revised’ status includes outcomes relating to a further 13 inspections. These consist of an additional 12 full inspections and one interim inspection of children’s homes, which took place in this period and have been published since 31 October 2018.
Of the additional 12 full inspections, 11 were of children’s homes and one of a residential special school registered as a children’s home. Of these homes, 8 received good or outstanding overall effectiveness judgments and 4 received requires improvement to be good or inadequate judgments.
These revisions did not result in any changes to the main findings identified in the previous publication.
Revisions to data in this publication are published in line with Ofsted’s revisions policy for official statistics.
Notes
In March 2019, Ofsted consulted with users to seek views on our proposals for revisions to the frequency and content of social care inspection official statistics and management information. This is described in more detail in the accompanying quality and methodology report. Following the consultation, we removed interactive tables from the underlying data file but no other changes have been made to the frequency or content of this statistical release.
In a small number of cases, where data on the number of places for other social care providers is not available, estimates have been used. For the full picture of changes in the number of providers and places since September 2011 please see the underlying data file ‘Providers+places six monthly’ tab.
The difference in the number of newly registered places (joiners) and de-registered places (leavers) from 31 March 2018 to 31 March 2019 does not always match the actual change in the number of places over the year. It is not always possible to easily distinguish residential special schools registered as children’s homes from children’s homes, and as such, changes in the number of places are sometimes the result of updated information rather than new registrations or de-registrations. Secondly, for all provision types in this data, providers who were active at both the start and end period can also change the number of places they have; these are known as steady state places.
When discussing the number of children’s homes and places across regions, we displayed North East, Yorkshire and Humber Ofsted region as 2 separate Government Office Regions (GOR): North East, and Yorkshire and Humber to show the differences in the number of homes located in each region.
Children’s homes run by health authorities have not been included as a separate entry as there are so few of them (7 are judged good, 3 requires improvement to be good, one is not judged yet). They have been included in the England figure.
Due to rounding, percentages might not add up to 100.
The quality and methodology report can be found at the following webpage: (page link to be added here)
Glossary
For a full definition of the terms below, please see the Glossary tab within the underlying data tables.
Adoption agencies
Adoption agencies can be voluntary- or LA-run, and aim to place children successfully into adoptive families recruited and prepared by the service.
Adoption support agencies
Adoption support agencies provide services to anyone touched by adoption, as children and adults.
Boarding schools
Although most boarding schools are independent and inspected by Independent Schools Inspectorate, some are maintained boarding schools where both education and the welfare of boarders are the subject of Ofsted inspection.
Children’s homes
A children’s home is an establishment that provides care and accommodation wholly or mainly for children. Children’s homes vary in size and nature, and fulfil a range of purposes to meet the different needs of children and young people.
Fostering agencies
Fostering agencies can be independent or LA-run, and work to recruit, prepare, assess, train, and support foster carers.
Further education colleges with residential accommodation
The care provision of further education colleges that provide, or arrange, residential accommodation for one or more students under the age of 18 years.
Places
The term ‘places’ used in this report refers to the number of places for which the social care provider (usually of residential care) has capacity; this will not usually be the same as the actual number of children receiving services.
Providers
The institutions, organisations, or agencies that provide services to the relevant children and young people.
Residential family centres
Residential family centres provide accommodation, assessment and guidance for children and their parents.
Residential holiday schemes for disabled children
A residential holiday scheme for disabled children provides care and accommodation wholly or mainly for disabled children for a specified period for the purposes of a holiday, or for recreational, sporting, cultural or educational purposes.
Residential special schools
Residential special schools provide education and accommodation to both full boarders and children resident only during the week, including children with very specialist needs.
Sector
‘Sector’ refers to the type of provider that owns the children’s social care provision.
Academy: These are publicly funded independent schools who are run by trusts
Health Authority: These are NHS Trust-run
LA: These are public bodies responsible for the children’s social care provision
Private: These are for-profit organisations mostly with limited company status. These can also be individually owned children’s social care provisions and run for profit
Voluntary: These are mostly not-for-profit organisations, mainly with charitable status; and individually owned provisions run on a not-for-profit basis.
Secure children’s homes
Secure children’s homes accommodate children and young people who are remanded or have been sentenced for committing a criminal offence, or whose behaviour is deemed to present a significant threat to their own and others’ safety.
Secure training centres
Secure training centres accommodate young people between the ages of 12 and 17 who have been remanded or sentenced by the courts.
Further information
If you have any comments or feedback on this publication, please contact the Social Care Data Team on 03000 130020 or socialcaredata@ofsted.gov.uk.
-
From 1 April 2019 secure training centres are inspected under a new joint framework with the Care Quality Commission and HM Inspectorate of Prisons. ↩
-
Two of these SIF re-inspections took place in January and February 2018 but were not published until May 2018 so have been included in this year’s numbers. Both LAs improved to requires improvement to be good but were reported as inadequate as at 31 March 2018. ↩
-
Analysis of c.6,200 children identified as living in children’s homes in England in the DfE SSDA903 data collection 2017-18, as at 31 March 2018, where distance data was available. ↩
-
Forty-two interim inspections in 2018 to 2019 did not result in a judgment. ↩
-
Of the 464 interim inspections in 2018 to 2019 which followed a full inspection in the same year, 14 did not result in a judgment. ↩
-
These are Birmingham, Doncaster, Kingston upon Thames, Richmond upon Thames, Reading, Sandwell, Slough, Sunderland, Winsor and Maidenhead. ↩
-
One boarding school was inspected in year by Ofsted but has been excluded from this state of the nation figure as it is normally inspected by the Independent Schools Inspectorate. ↩