Children’s social care data in England 2017 to 2018: main findings
Updated 4 February 2019
Applies to England

© Crown copyright 2019
This publication is licensed under the terms of the Open Government Licence v3.0 except where otherwise stated. To view this licence, visit nationalarchives.gov.uk/doc/open-government-licence/version/3 or write to the Information Policy Team, The National Archives, Kew, London TW9 4DU, or email: psi@nationalarchives.gov.uk.
Where we have identified any third party copyright information you will need to obtain permission from the copyright holders concerned.
This publication is available at https://www.gov.uk/government/statistics/childrens-social-care-data-in-england-2018/childrens-social-care-data-in-england-2017-to-2018-main-findings
This release contains:
-
information about the number of providers of children’s social care, including the numbers of places, as at 31 March 2018
-
the most recent inspections and outcomes for all regulated and inspected children’s social care provisions, as at 31 March 2018, and published by 30 April 2018
-
outcomes for all regulated and inspected children’s social care provision inspections conducted between 1 April 2017 and 31 March 2018, and published by 30 April 2018
-
inspection outcomes for local authority (LA) children’s services inspections from 1 November 2013, covering all inspections published by 30 April 2018
The number of children’s homes of all types continues to rise overall, but the number of homes run by local authorities continues to fall.
As at 31 March 2018, there were 2,209 children’s homes, of all types, a 3% increase on the previous year (2,145). At the same time, LAs have reduced the number of children’s homes they run by 3%, from 434 as at 31 March 2017 to 423 as at 31 March 2018 (Figure 1).
Residential special schools performed best across inspection sub-judgements in 2017 to 2018.
Of the 142 residential special schools inspected in 2017 to 2018, 46% were judged outstanding for leadership and management, and 36% for help and protection. In both cases, this was around twice the level for other providers.
The Children and Family Court Advisory and Support Service (Cafcass) was inspected in 2017 to 2018 and judged to be outstanding.
Cafcass is inspected every 3 years. In February 2018, it improved from good to outstanding.
The judgement profile for LAs has improved since the end of the Single Inspection Framework programme.
The proportion of LAs judged inadequate has dropped from 19% to 15%, while the proportion judged good or outstanding for overall effectiveness has increased from 36% as at 31 October 2017 to 38% as at 31 March 2018.
Figure 1: Number of children’s homes of all types and of homes run by LAs, 31 March 2015 to 31 March 2018

The chart showing the 4-year trend of growing number of children's homes of all types and the falling number of children's homes run by local authorities
1. Introduction
Ofsted reports annually on social care inspections and outcomes for local authorities (LAs) and regulated social care provisions. We use this data for a wide range of purposes to make improvements in the sector. These include: policy development; enhancing insight into the sector; and contributing to the reviews of inspection frameworks. Further details of the purpose and relevance of this report are available in the quality and methodology report accompanying this release.
Ofsted inspects the LAs in England responsible for ensuring and overseeing the effective delivery of social care services for children. It also inspects The Children and Family Court Advisory and Support Service (Cafcass) who looks after the interests of children involved in family proceedings. Ofsted also regulates and/or inspects providers who offer placements for these children. Of 12 million children in England in 2018, around 1% are in care (73,000) or on a child protection plan (50,000). Most children are in the care of LAs under a care order. The Department for Education (DfE) reported that as at 31 March 2017, 62 children per 10,000 of the population of children under 18 years were in care. The number has gone up in each of the last 9 years. This can put pressure on the LAs to provide placements.
Children in care (also referred to as children looked after) most commonly (around 75%) live in foster placements (52,000 children as at 31 March 2017). Of the other children, 11% (7,890) live in secure units, children’s homes and semi-independent living accommodation. Around 1% (1,080) live in other residential settings. The DfE reported that there were 130 children looked after placed in residential schools as at 31 March 2017. [footnote 1]
1.1 Children’s social care providers
This report covers inspections of children’s social care providers, and providers of residential accommodation for children in boarding schools and further education colleges in England. At the end of March 2018, there were 2,941 active providers of these services.
Most of these providers are registered and regulated by Ofsted. They are mainly inspected by Regulatory Inspectors under the Social Care Common Inspection Framework (SCCIF). These providers include children’s homes, independent fostering agencies, and voluntary adoption agencies. Ofsted also inspects but does not regulate the social care provision of some providers, including boarding schools and secure training centres. More information about the different types of providers can be found in the glossary.
Most of the providers are inspected annually. These include:
-
children’s homes (including secure children’s homes and residential special schools dual registered as children’s homes)
-
residential special schools
-
secure training centres
-
residential holiday schemes for disabled children
Other children’s social care providers will receive an inspection once every 3 years, unless there is cause for concern (and may receive extra concern-driven inspections).
1.2 LA inspections
Across England, there are 152 LAs responsible for ensuring and overseeing the effective delivery of social care services for children. Five of these LAs have their children’s services managed by independent Children’s Trusts.[footnote 2] Until the end of December 2017, LAs were inspected under the single inspection framework (SIF). The SIF was replaced by the inspections of local authority children’s services (ILACS) programme in January 2018. These statistics cover both periods, therefore it includes data on both frameworks and the inspections under them.
Under the ILACS, Ofsted inspects LAs based on the intelligence we have about them, including their most recent inspection judgement. There are multiple inspection options available to Ofsted, described in the chart below, however in this transitional year of the new framework, there may also be some variations to the inspection pathways.
Figure 2: Inspection pathways under ILACS
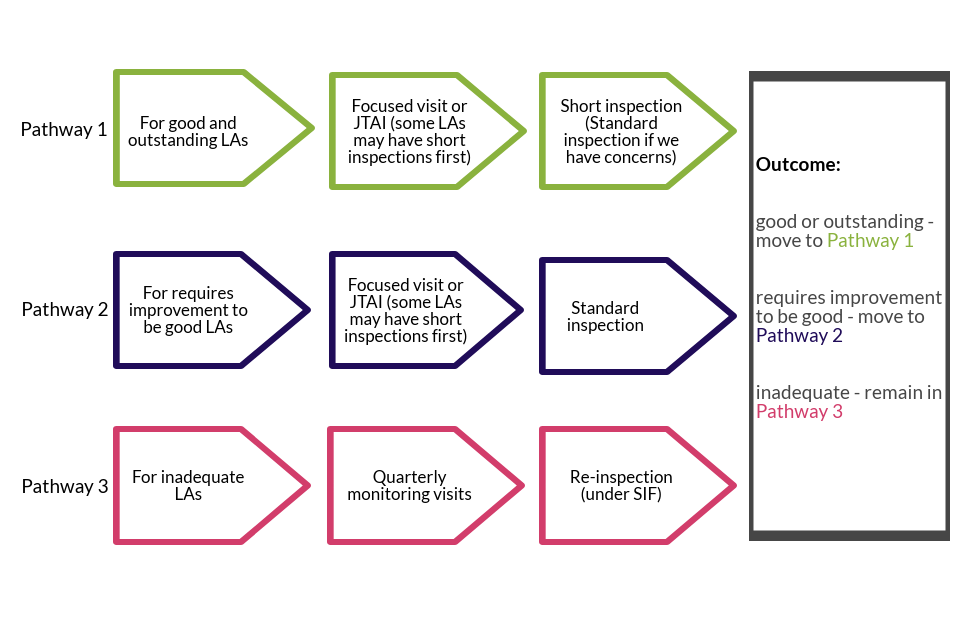
Three inspection pathways under the ILACS framework
2. Providers and places as at 31 March 2018
As at 31 March 2018 there were 2,941 providers of social care and providers of residential accommodation for children in boarding schools and further education colleges. They provided 33,264 places. The number of providers increased by 3% (75 providers), and the number of places decreased by 4% (1,233 places) in comparison with the figures the previous year (2,866 providers and 34,497 places).
The change in the number of providers came mainly from an increase in the number of children’s homes, along with small increases in voluntary adoption agencies and residential family centres. The decrease in the number of places was due to fewer places in the boarding schools, residential special schools, and further education colleges with residential accommodation.
2.1 All children’s homes
There has been an increase in the number of children’s homes in England as more privately run, for-profit, homes open. At the same time LAs have reduced the number of children’s homes they run. Once Ofsted has access to the detailed data about the children looked after placements, we will know whether this means LAs likely place more children in homes owned by the private sector. The number of available places also increased but at a slower rate and there were fewer places in residential special schools registered as children’s homes and in the secure children’s homes. The distribution of homes and places across England remained very similar to the previous years, with 3 or 4 bed homes being the most common size.
There are 3 types of homes which care for children:
-
children’s homes – these are most of the homes in England and are defined as any home that does not fall within the other 2 sub types below, that is, is not a residential special school registered as a children’s home and is not a secure children’s home
-
residential special school registered as a children’s home – these are residential schools which, due to the number of days they look after children, must register as children’s homes
-
secure children’s homes
Throughout this publication, whenever we talk about all children’s homes, we are referring to all types of homes, and when we talk about children’s homes we are referring to the first subtype of homes listed above.
Children’s homes of all types account for three-quarters of all social care providers in England, the same proportion as in the previous year. There were 2,209 children’s homes, of all types, at 31 March 2018. This was an increase of 64 children’s homes (3%, similar to the previous year’s increase) from the figure at the same time last year (2,145).
While the number of all children’s homes continues to rise overall, there is a variation within the sectors. The number of privately owned homes has increased year on year (now 1,610 or 73%). However, the number of LA-run homes continues to fall, and currently 423 homes (19%) are run by LAs, which means more children’s homes are owned by organisations that are run for profit. The number of homes run by voluntary organisations (165 or 7%) remains stable. [footnote 3]
Figure 3: The number of all children’s homes run by each sector, 31 March 2015 to 31 March 2018

The chart showing the number of children's homes of all types and by each sector over the last four years
Although the number of children’s homes increased, the number of places changed by less than 1% (from 11,664 to 11,746). This smaller increase is because of the drop in the number of places in residential special schools registered as children’s homes.
2.2 Joiners and leavers
Between 1 April 2017 and 31 March 2018, a total of 204 children’s homes registered and began to operate. These offered 912 places. In the same period, 140 children’s homes de-registered, mainly through voluntary de-registration. They accounted for 772 places. Five of the new children’s homes both registered and de-registered within the same year; they offered 21 places. Eight children’s homes had their registration cancelled by Ofsted. [footnote 4]
Figure 4: The change in the number of children’s homes, by all types, from 31 March 2017 to 31 March 2018

The change in the number of children’s homes, by all types, including the number of joiners and leavers from 31 March 2017 to 31 March 2018
Seven of the 127 voluntary de-registrations were residential special schools registered as children’s homes (139 places):
-
3 closed completely
-
3 re-registered as children’s homes
-
1 re-registered with the DfE as a residential special school not registered as a children’s home
2.3 Children’s homes
Sector
The large majority of children’s homes were run by private providers: 1,561 homes (73%) compared to 1,481 (72%) in 2017. Voluntary organisations ran 145 homes (7%), an increase of 3 homes from 2017. The remainder were run by LAs. [footnote 5] The map below shows the distribution of children’s homes in England by sector.
Figure 5: Location and sector of active children’s homes, 31 March 2018 [footnote 6]

The map showing the location and sector of all active children's homes as at 31 March 2018
The number of children’s homes run by LAs fell for the third consecutive year in 2018, by 3%. From 2016 to 2017, it fell by 4%, and 5% in the year before. As at 31 March 2018 there were 44 LAs (29%) in England that did not run any children’s home in their area. Despite the falling national numbers, during 2017 to 2018 6 LAs had increased the number of homes they ran.
Size of the homes
More children’s homes offered 3 or 4 beds than any other size. These accounted for 44% of children’s homes in England as at 31 March 2018. Forty-five per cent (91 out of 204) of newly registered children’s homes in 2017 to 2018 were registered for 3 or 4 beds.
Figure 6: Children’s homes by size, as at 31 March 2018

The percentage split of all children's homes by the size of the home as at 31 March 2018
There are variations in the size of the children’s homes across the regions. The proportion of small homes (1 or 2 beds) ranges from 2% in London to 31% in the South West. London has the highest proportion of large homes (10 beds or more) at 8%. The South West and the North West have the smallest proportions with 1% of their homes having 10 beds or more.
Table 1: Proportion of children’s homes by region and size of home, 31 March 2018

The percentage breakdown of children's homes in England by region and the size of the home (number of beds)
2.4 Residential special schools registered as children’s homes
The number of residential special schools registered as children’s homes has seen a gradual decrease over the last 5 years, from 88 at 31 March 2014 to 71 at 31 March 2018 (19% decrease). The number of places has fluctuated over the same period, overall it has also decreased, by 11% (from 2,331 in March 2014 to 2,082 at 31 March 2018).
Over two-thirds of the 71 homes active as at 31 March 2018 were privately run (49 homes, with 1,391 places). The remainder were run by voluntary organisations (19 homes, with 592 places), or LAs (3 homes, with 99 places).
The South East continues to have the highest number of residential special schools registered as children’s homes (15 homes, 554 places). The region with the smallest number of homes of this type is the East of England region, with 6 homes (144 places).
2.5 Secure children’s homes
As at 31 March 2018 there were 14 secure children’s homes offering 234 places. The number of secure children’s homes has stayed at 14 over the last 3 years, having previously stayed at 16 between March 2012 and March 2014. The number of places dropped by 4 in comparison with 238 places at the end of March last year. In total, the number of places in secure children’s homes decreased by 17% between 31 March 2012 (281 places) and 31 March 2018 (234 places).
The DfE recently reported on occupancy and availability rates in secure children’s homes, which is data not collected or held by Ofsted. According to the DfE’s report, of 233 approved places as at 31 March 2018, 204 were available, of which 189 were occupied.
2.6 Other social care providers
For most provider types, the number of settings increased from 31 March 2017 to 2018; they also saw an increase the previous year. The exception to this is residential special schools. For these, the numbers have decreased (from 157 in 2017 to 154 in 2018).
As well as a general pattern of increasing numbers of providers since 2016, some providers have seen a particular increase since 2017. For voluntary adoption agencies, this is mainly due to services at 5 LAs now being run by a children’s trust, so that their adoption services are provided by a voluntary adoption agency. Residential holiday scheme and residential family centre numbers were also expected to increase as demand for these newer provision types increased.
Figure 7: Provider types with an increase in number of providers, 2016 to 2018

Three children's social care provider types with an increase in the number of settings between 2016 and 2018
The largest group of children in care are in foster placements, provided by LA fostering agencies (inspected within the SIF/ILACS inspection) and independent fostering agencies (IFAs). Although the number of IFAs has varied over the years, overall it has increased. In 2012 there were 295 IFAs; by 2018 there were 308 (an increase of 13 agencies, 4% of the total).
Data on the number of places is only available for 4 provider types:
-
boarding schools (total places fell by 6%)
-
residential special schools (total places fell by 6%)
-
further education colleges with residential accommodation (total places fell by 6%)
-
residential family centres (total places rose by 10%)
For all 4 provision types, however, these should be treated with caution, as estimates have been used in cases where data is not available.
3. Social Care Common Inspection Framework (SCCIF)
The Social Care Common Inspection Framework (SCCIF) was introduced from 1 April 2017. It covers inspections of all social care provisions except secure training centres. This replaced the previous individual inspection frameworks for different provision types. The SCCIF aims to centralise the experiences and progress of children, and focus on the difference that providers make to their lives. Although this is a common framework, it is tailored for the different types of providers.
At least partially due to differences in the standards under which they are inspected, residential special schools generally performed better than residential special schools registered as children’s homes under the SCCIF. Although the percentage of all children’s homes judged good or outstanding remained high, fewer homes improved in 2017 to 2018 than in the previous 2 years at both full and interim inspections. The exception was inadequate homes; almost all of these either improved or closed. Cafcass was inspected, and judged to be outstanding.
3.1 SCCIF comparison during 2017 to 2018
Since the SCCIF began in April 2017, there have been 2,599 full inspections:
-
children’s homes (2,122 inspections)
-
residential special schools (143 inspections)
-
independent fostering agencies (133 inspections)
-
residential special schools registered as a children’s home (83 inspections)
-
other providers (118 inspections)
Setting types with fewer than 30 inspections each under the SCCIF have been excluded from the comparisons below. Data for these settings is available in the underlying tables.
Under the SCCIF, providers receive an overall effectiveness judgement (discussed further on in this release), and 2 sub-judgements: Leadership and management, and Help and protection.
3.2 Leadership and management
The percentage of providers with a good or outstanding judgement in this area was notably higher for residential special schools than for residential special schools registered as a children’s home. A much higher percentage of residential special schools were judged to be outstanding; the percentage judged good was closer to other provider types.
From the inspections conducted so far under the SCCIF, this may be partially explained by the differences in management between these 2 provision types. Residential special schools registered as a children’s home are usually managed by a single Registered Manager, while residential special schools are usually managed by a team including the head teacher. Residential special schools registered as children’s homes are also inspected under the National Minimum Standards, which are more stringent than those which apply to residential special schools. There are also a number of residential special schools which change to being registered as a children’s home under the Care Standards Act. These may take some time to adjust to the new leadership arrangements, which may impact their grade for this sub-judgement.
Figure 8: Leadership and management sub-judgement by grade, 2017 to 2018
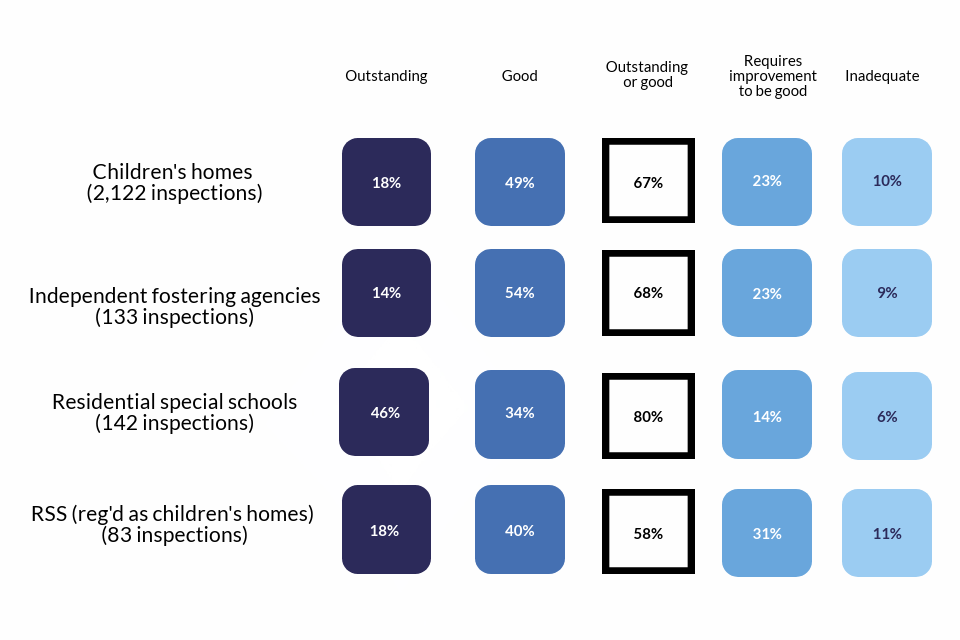
Leadership and management sub-judgement grade profile for inspections conducted under SCCIF between 2017 and 2018
3.3 Help and protection
The picture was similar for the help and protection sub-judgement. However, children’s homes and IFAs were closer to residential special schools when looking at the percentage judged outstanding or good.
Figure 9: Help and protection sub-judgement by grade, 2017 to 2018
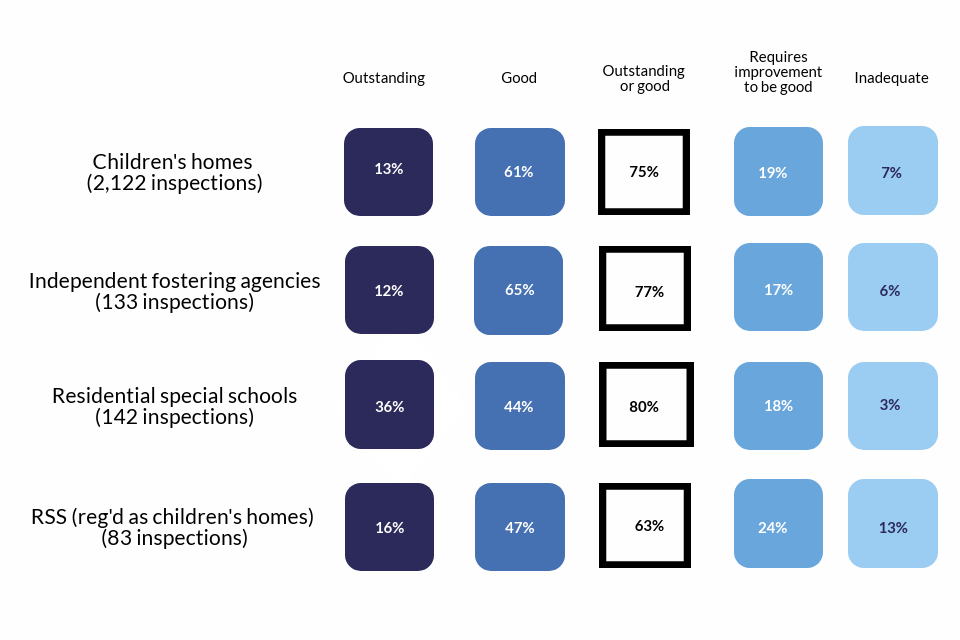
Help and protection sub-judgement grade profile for inspections conducted under SCCIF between 2017 and 2018
3.4 Inspections of children’s homes during 2017 to 2018
Between 1 April 2017 and 31 March 2018, there were 3,065 inspections of children’s homes of all types. As the chart below shows, these were mostly full inspections, with monitoring inspections being least common.
Figure 10: Children’s homes inspections by type, 2017 to 2018

The number of full, interim and monitoring inspections of children's homes from 1 April 2017 to 31 March 2018
The 2,218 full inspections covered 2,112 children’s homes of all types, as some homes had more than one inspection in the year. Of these homes, 1,872 (89%) also had an inspection grade at 31 March 2017. [footnote 7]
The percentage of settings which improved at their first inspection in 2017 to 2018 compared with the previous year shows a pattern of falling, before and after the SCCIF was introduced. In 2015 to 2016 it was 27%, and had fallen to 17% in 2017 to 2018.
Figure 11: Change in inspection grade compared to previous year, 2016 to 2018

Change in inspection grade of children's homes compared to previous year between 2016 and 2018
Comparing 2016 to 2017 with 2017 to 2018, children’s homes previously judged outstanding were just as likely to decline as to stay at outstanding. This was not the case for homes with other judgements. Those judged good were far more likely to stay good than either decline or improve. By contrast, those judged requires improvement to be good were more likely to improve than stay at this grade or decline.
Ofsted re-inspects inadequate provision until it either improves or ceases to be registered. This means that most children’s homes judged to be inadequate during the year will no longer be inadequate on 31 March 2018. Children’s homes inspected more than once in this year are addressed later in this release.
In their first inspection of 2017 to 2018, 132 homes (6%) were initially judged to be inadequate. Of these, 92 (70%) had a subsequent full inspection within the same year.
Figure 12: Judgements at subsequent inspections for homes initially judged inadequate in 2017 to 2018

Judgements at subsequent inspections for children's homes initially judged inadequate in 2017 to 2018
The remaining 40 homes judged inadequate in 2017 to 2018 did not have a subsequent full inspection during the year. However, the majority (30) did subsequently have either a monitoring or an interim inspection. Homes which continue to operate in 2018 to 2019 will continue to receive monitoring and/or interim inspections as appropriate, as well as full inspections.
Figure 13: Subsequent actions after inadequate judgement 2017 to 2018

Subsequent actions in children's homes after inadequate judgement in 2017 to 2018
3.5 Inspections of other social care providers during 2017 to 2018
As at 31 March 2018, not including children’s homes, there were 732 active settings. The majority of these, 673, had a full inspection outcome as at 31 March 2018. Just over half of these settings (380) were inspected during 2017 to 2018. [footnote 8]
As in previous years, the picture was generally positive, except for secure training centres.
Not included in the chart below is the inspection of Children and Family Court Advisory and Support Service (Cafcass). This service is inspected once every 3 years, and had its latest inspection in February 2018. It was judged to be outstanding for Overall effectiveness.
Figure 14: Inspection judgement profile at 31 March 2018
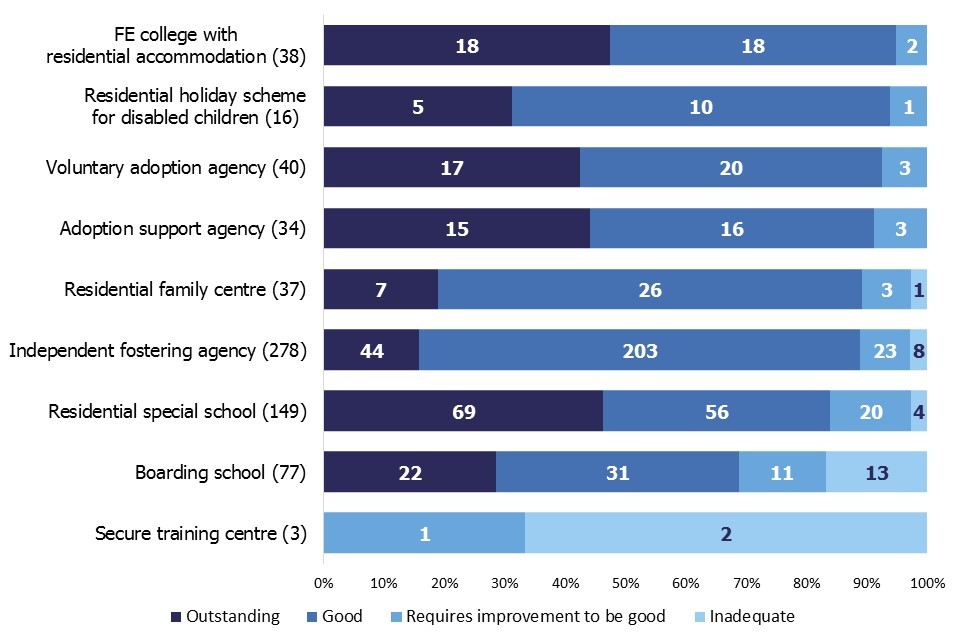
Inspection judgement profile of all social care providers except children's homes at 31 March 2018
Last year, 4 out of 9 setting types increased the percentage of providers judged good or outstanding. This year, that trend reversed, with 5 out of 9 seeing a decrease, and 1 seeing an increase. Although this may be as a result of the introduction of the SCCIF framework, it is currently too early to be sure. We are continuing to evaluate the framework and its impact on inspections over time.
Figure 15: Change over time in percentage of settings judged good or outstanding, 2016 to 2018

Change over time in percentage of social care settings judged good or outstanding from 2016 to 2018
3.6 Interim inspections of children’s homes
Under the SCCIF, Ofsted took a new approach to interim inspections. As a result, these were only conducted for children’s homes which had been judged requires improvement to be good, or inadequate, unless they had been judged good or outstanding in the previous year; or which had been rated as high risk based on various factors which meant it was appropriate to re-inspect. The number of interim inspections therefore fell by more than two thirds from 1,823 in 2016 to 2017 to 576 in 2017 to 2018.
The percentage of inspections with a judgement of declined effectiveness also increased compared to the previous 2 years. This change is expected with the change in Ofsted’s approach to interim inspections and particularly the risk assessment driven nature of this.
Figure 16: Interim inspection outcomes, 2015 to 2016 to 2017 to 2018
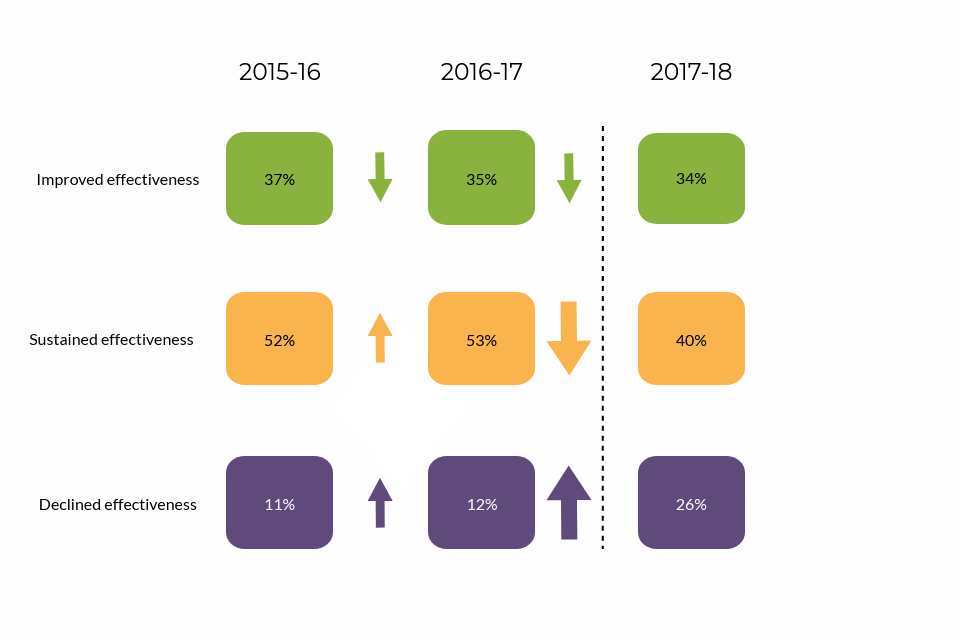
Comparison between the children's homes interim inspection outcomes in each of the last 3 years: 2015 to 2016, 2016 to 2017 and 2017 to 2018
In total, 481 interim inspections in 2017 to 2018 directly followed a full inspection in the same year. Homes previously judged requires improvement to be good were most likely to receive an interim inspection (48% of full inspections were followed by interim inspections, 177 of 366). Almost all of the remainder either were not required to receive an interim inspection as they were judged good or outstanding in the previous year, or received their full inspection at the end of the year, so that they were not yet due an interim inspection by 31 March 2018. Inadequate homes were least likely to receive a subsequent interim inspection. In most cases, this was because the children’s home continued to receive full inspections and/or monitoring visits until it improved, rather than receiving interim inspections.
Table 2: Number and percentage of full inspections followed by an interim inspection, by preceding full inspection judgement

The number and percentage of full inspections of children's homes followed by an interim inspecrtion
Children’s homes previously judged good were more likely to receive a judgement of sustained effectiveness at their interim inspection (47%) than those judged requires improvement to be good (28%).
4. Inspection profile at 31 March 2018
Nationally, children’s homes of all types continue to be mainly judged to be good or outstanding, as do independent fostering agencies. LA-run and voluntary-run homes are now equally as likely as each other to be judged good or outstanding.
4.1 Children’s homes of all types
In total, 2,120 (96%) children’s homes (including secure children’s homes and those registered as residential special schools) had a full inspection outcome as at 31 March 2018. [footnote 9]
Across children’s homes of all types, the grade profile was very similar to 31 March 2017, with the majority of homes judged to be good or outstanding, increasing by one percentage point. Although the percentage of inadequate homes appears to have doubled, this is mainly due to rounding: the actual increase is from 1.2% to 1.5%.
Figure 17: Grade profile for all children’s homes at 31 March 2017 and 2018

Comparison of the grade profile for all children’s homes as at 31 March 2017 and as at 31 March 2018
In most regions, the percentage of homes judged good or outstanding has increased or stayed the same compared to 2017. As a result, the gap between the regions with the highest and lowest percentages has shrunk from 27 percentage points to 25.
Figure 18: Percentage of homes judged good or outstanding by region, 31 March 2018

The map showing the percentage of children's homes judged good or outstanding in each region as at 31 March 2018
More LA-owned homes were judged outstanding at 31 March 2018 than any other sector (25%). Along with voluntary sector homes, they had the highest percentage of homes judged good or outstanding (85%).
In total, 1,679 (80%) children’s homes were judged to be good or outstanding as at 31 March 2018, based on an inspection which took place in year. Of these, 1,124 had also received a full inspection in each of the previous 3 years. The majority of these 1,124 homes have a history of being good or outstanding (827, 74%).
4.2 Independent fostering agencies
Of the 308 active independent fostering agencies (IFAs) on 31 March 2018, 278 (90%) had received a full inspection. The percentage judged good or outstanding remained at 89% for the second consecutive year.
In total, there were 133 full inspections of IFAs between 1 April 2017 and 31 March 2018. This follows a reduced programme of IFA inspections in 2016-17, when only 37 inspections took place.
The profile for inspection judgements in the year is now similar to past years. [footnote 10] In total, 83% of inspections resulted in a judgement of good or outstanding.
5. Inspection of local authority children’s services
In January 2018 Ofsted introduced a new framework for inspections of local authority children’s services (ILACS). This replaced the single inspection framework (SIF) which ended in October 2017. Ofsted will still use the SIF for some re-inspections of inadequate children’s services, but they will be inspected under the umbrella of the ILACS programme.
The new ILACS programme comprises the following:
-
standard inspections
-
short inspections
-
focused visits
-
monitoring visits (followed by re-inspection)
-
activity outside inspection (self-evaluation of social work practice and annual engagement meetings)
All 152 LAs have been inspected at least once under the SIF framework. The evaluation of the LA inspections under the SIF is included in our December statistical release.
5.1 Local authorities that had SIF re-inspections
This publication covers 8 re-inspections of inadequate LAs that took place after the period covered by the December release. Of these, 2 LAs improved to good, 4 improved to requires improvement to be good, and 2 LAs remained inadequate.
5.2 ILACS visits
Since the introduction of ILACS in January 2018, Ofsted had carried out 13 focused visits. This type of visit does not result in a judgment. Instead, the LA is issued a letter setting out narrative findings about strengths and areas to improve. This is also published on the Ofsted website. Focused visits evaluate an aspect of a service, a theme, or the experiences of a cohort of children. Each focused visit also looks into leadership, especially the impact of leaders on practice with children and families. Inspectors use findings from focused visits when planning their next short or standard inspection. [footnote 11]
Of 13 LAs that received a focused visit under ILACS:
-
9 had previously been judged requires improvement to be good
-
4 had previously been judged good
The focus of the majority of the visits (10 out of 13) was the ‘front door’ service, children in need and those subject to a child protection plan. Nine of these LAs had previously been judged requires improvement to be good for Children who need help and protection key judgment. One had been judged good.
One LA received a focused visit in the area of children in care (judged good in the Children looked after and achieving permanence key judgment at their SIF inspection). Two LAs had visits focused on Care leavers, which had been judged requires improvement to be good at their SIF inspections.
5.3 ILACS inspections
Since the introduction of the ILACS framework, and in the reporting period of this release, Ofsted has carried out the standard inspection of 1 local authority. It retained its overall effectiveness judgment as requires improvement to be good. Children looked after and achieving permanence key judgment improved to good from requires improvement to be good.
The judgement profile for LAs has improved as a result of the 8 re-inspections and one standard ILACS inspection. There are now 38% of LAs judged good or outstanding for overall effectiveness, up from 36% as at 31 October 2017. There was also improvement in the proportion of LAs judged inadequate. This fell from 19% at the end of the SIF programme to 15% as at 31 March 2018.
Figure 19: The local authorities inspected since the end of the SIF programme and their inspection outcomes as at 31 March 2018

The map showing the local authorities inspected since the end of the SIF programme and their inspection outcomes as at 31 March 2018
6. Revisions to previous release
The revision of statistics relating to 1 April 2017 to 30 September 2017 from ‘provisional’ to ‘revised’ status includes outcomes relating to a further 42 inspections. These consist of an additional 38 full inspections, 1 interim inspection, and 3 monitoring inspections of children’s homes, which took place in this period and have been published since 31 October 2017.
Of the additional 38 full inspections, 30 were of children’s homes. Of these homes, 26 received good or outstanding overall effectiveness judgements and 4 received requires improvement to be good or inadequate.
These revisions did not result in any changes to the main findings identified in the previous publication.
Revisions to data in this publication are published in line with Ofsted’s revisions policy for official statistics.
7. Notes
Ofsted consulted with users in 2014 to seek views on the proposed arrangements for the frequency and content of social care inspection official statistics, which is described in more detail in the accompanying quality and methodology report. Ofsted also has representation at relevant meetings and forums to seek feedback about whether our publications meet user needs, which include regional meetings of performance leads from LAs. Ofsted’s participation helps inform about user views, and suggested improvements are taken on board. Ofsted also engages with other organisations including the Department for Education (DfE) and representations from the private and voluntary sectors.
An explanation about key uses of this data, and further contextual information and the arrangements for quality assurance are provided in the accompanying quality and methodology report.
Ofsted also publishes data for all remits, including social care, as part of the annual Data View.
8. Glossary
For a full definition of the terms below, please see the Glossary tab within the underlying data tables.
Adoption agencies
Adoption agencies can be voluntary- or LA-run, and aim to place children successfully into adoptive families recruited and prepared by the service.
Adoption support agencies
Adoption support agencies provide services to anyone touched by adoption, as children and adults.
Boarding schools
Although the majority of boarding schools are independent and inspected by other inspectorates, some are maintained boarding schools where both education and the welfare of boarders are the subject of Ofsted inspection.
Cafcass (The Children and Family Court Advisory and Support Service)
Cafcass looks after the interests of children involved in family proceedings.
Children’s homes
A children’s home is an establishment that provides care and accommodation wholly or mainly for children. Children’s homes vary in size and nature, and fulfil a range of purposes to meet the different needs of children and young people.
Fostering agencies
Fostering agencies can be independent or LA-run, and work to recruit, prepare, assess, train, and support foster carers.
Further education colleges with residential accommodation
The care provision of further education colleges that provide, or arrange, residential accommodation for one or more students under the age of 18 years.
JTAI
Joint Targeted Area Inspections (JTAI) are joint inspections by Ofsted, Care Quality Commission, HM Inspectorate of Constabulary, Fire and Rescue Services and HM Inspectorate of Probation. The inspections include a ‘deep dive’ investigation – an evaluation of children and young people’s experiences. This changes periodically to investigate different themes in detail.
Places
The term ‘places’ used in this report refers to the number of places for which the social care provider (usually of residential care) has capacity; this will not usually be the same as the actual number of children receiving services.
Providers
The institutions, organisations, or agencies that provide services to the relevant children and young people.
Residential family centres
Residential family centres provide accommodation, assessment and guidance for children and their parents.
Residential holiday schemes for disabled children
A residential holiday scheme for disabled children provides care and accommodation wholly or mainly for disabled children for a specified period for the purposes of a holiday, or for recreational, sporting, cultural or educational purposes.
Residential special schools
Residential special schools provide education and accommodation to both full boarders and children resident only during the week, including children with very specialist needs.
Sector
‘Sector’ refers to the type of provider that owns the children’s social care provision.
Academy: These are publicly funded independent schools who are run by trusts
Health Authority: These are NHS Trust-run
LA: These are public bodies responsible for the children’s social care provision
Private: These are for-profit organisations mostly with limited company status. These can also be individually owned children’s social care provisions and run for profit
Voluntary: These are mostly not-for-profit organisations, mainly with charitable status; and individually owned provisions run on a not-for-profit basis.
Secure children’s homes
Secure children’s homes accommodate children and young people who are remanded or have been sentenced for committing a criminal offence, or whose behaviour is deemed to present a significant threat to their own and others’ safety.
Secure training centres
Secure training centres accommodate young people between the ages of 12 and 17 who have been remanded or sentenced by the courts.
9. Further information
If you have any comments or feedback on this publication, please contact Adam King on 03000 130020 or socialcaredata@ofsted.gov.uk
9.1 Acknowledgements
Thanks to Emily Moreton and Anna Otczyk for their contribution to this statistical release.
-
The DfE reported that there were 72,670 children in care in total as at 31 March 2017 and of these 74% (53,420) were fostered. ‘Children looked after in England including adoption: 2016 to 2017’, DfE, Table A2, 2017; https://www.gov.uk/government/statistics/children-looked-after-in-england-including-adoption-2016-to-2017 ↩
-
These are Slough, Doncaster, Sandwell, Sunderland and Birmingham. ↩
-
Eleven homes are also run by health authorities and are excluded here. This is an increase on 9 homes reported in the previous year. ↩
-
The difference in the number of newly registered places (joiners) and de-registered places (leavers) from 31 March 2017 to 31 March 2018 does not always match the actual change in the number of places over the year. It is not always possible to easily distinguish residential special schools registered as children’s homes from children’s homes and as such changes in the numbers of places are sometimes the result of updated information rather than new registrations or de-registrations. Secondly, for all provision types in these data, providers who were active at both the start and end period can also change the number of places they have; these are known as steady state places. ↩
-
Eleven homes are also run by health authorities. This is an increase on 9 homes reported in the previous year. ↩
-
Eleven homes are also run by health authorities and are excluded here. This is an increase on 9 homes reported in the previous year. ↩
-
Reasons for a home not to have a prior year inspection grade include, for example, because they opened in 2017 to 2018, or too late in 2016 to 2017 to receive an inspection; because they had only received interim or monitoring inspections prior to 2017 to 2018; or because their full inspection outcome was withheld for some reason. ↩
-
One residential special school received a “not judged” outcome at their full inspection, and has been excluded from the figure below. ↩
-
An additional 3 had a monitoring outcome only, and 86 (4%) had not yet received a full or monitoring inspection by 31 March 2018. All of these were children’s homes. ↩
-
2016 to 2017 was the exception, as only a small number of IFAs were inspected in that year, due to the inspection cycle. ↩
-
[Framework for the inspections of local authority children’s services (p25-28) https://www.gov.uk/government/publications/inspecting-local-authority-childrens-services-from-2018 ↩