Children’s social care data in England 2017: main findings
Published 31 August 2017

© Crown copyright 2017
This publication is licensed under the terms of the Open Government Licence v3.0 except where otherwise stated. To view this licence, visit nationalarchives.gov.uk/doc/open-government-licence/version/3 or write to the Information Policy Team, The National Archives, Kew, London TW9 4DU, or email: psi@nationalarchives.gov.uk.
Where we have identified any third party copyright information you will need to obtain permission from the copyright holders concerned.
This publication is available at https://www.gov.uk/government/statistics/childrens-social-care-data-in-england-2017/childrens-social-care-data-in-england-2017-main-findings
This annual release covers:
-
inspection outcomes for local authority children’s services inspections from November 2013, covering all inspections published by 30 April 2017
-
inspection outcomes for all regulated, and other, children’s social care provision 1 April 2016 to 31 March 2017
-
outcome of most recent inspections, for all regulated, and other, children’s social care provisions, as at 31 March 2017
-
information about the providers of children’s social care, including the numbers of providers and places, as at 31 March 2017
More of the local authorities (LAs) inspected to date were judged good or outstanding than inadequate for the Single Inspection Framework (SIF).
Thirty-seven LAs were judged to be good or outstanding, and 30 were judged to be inadequate, of 127 inspected LAs.
Only a very small number of LAs were judged inadequate across all 3 key judgements and overall effectiveness.
Only 8% (10 LAs) of inspected LAs were judged inadequate for overall effectiveness and for all 3 key judgements as at 31 March 2017.
LAs’ prior grades are not an effective predictor of their SIF grade.
For example, LAs judged adequate for Safeguarding pre-SIF were as likely to be graded good as to be graded inadequate for Help and protection under the SIF.
The number of children’s homes increased by a larger amount than at any other time in the last 5 years.
As at 31 March 2017, there were 2,145 active children’s homes – an increase of 74 homes compared with 31 March 2016 (2,071).
There is a continuing reduction in local authority-run children’s homes.
As at 31 March 2017, LAs ran 20% of children’s homes compared with 22% last year and 26% as at 31 March 2013.
The majority of children’s homes judged to be inadequate at their first inspection in 2016 to 2017 improved during the year.
In 2016 to 2017, 85% of children’s homes judged to be inadequate at their first inspection had improved to either good or requires improvement to be good by 31 March 2017, predominantly at their subsequent inspection.
1. Introduction
Ofsted inspects the 152 local authorities (LAs) responsible for ensuring and overseeing the effective delivery of social care services for children.
Her Majesty’s Inspectors (HMI) conduct these inspections of local authority services for children who need help and protection, children looked after, and care leavers, under the single inspection framework (SIF). All LAs will be inspected at least once between November 2013 and December 2017.
In addition to the SIF, and conducted at the same time, Her Majesty’s Inspectors (HMI) conduct reviews of the Local Safeguarding Children Boards (LSCBs) that are responsible for safeguarding, and promoting the welfare of, children.
There were 2,691 providers of children’s social care and providers of residential accommodation for children in boarding schools and further education colleges in England, as at the end of March 2017. This figure includes 3 secure training centres, which are not included in the interactive tables in the accompanying Excel document.
Most of these providers are registered and regulated by Ofsted, and inspected, in the main, by regulatory inspectors. These include children’s homes, independent fostering agencies, and voluntary adoption agencies. Some providers are registered but not regulated, including boarding schools (some of which are inspected by other inspectorates, and some by Ofsted) and secure training centres.
Most types of provision receive an inspection once in a 3 year period and may receive additional concern-driven inspections. The exceptions to this are children’s homes (including secure children’s homes and residential special schools dual registered as children’s homes), residential special schools, secure training centres, and residential holiday schemes for disabled children. These are inspected annually.
Social care inspection outcomes provide important information for policy development, as well as for planning and providing public services, for example by informing LAs about the quality of social care provisions nationally and by area. Further details of the purpose and relevance of this report are available in the quality and methodology report.
2. Inspection of local authority children’s services
There are approximately 12 million children in England, of whom just over 3% are classified at any one time as children in need (394,000 children). Around 1% are children looked after (70,000 children) or on a child protection plan (50,000 children).
2.1 Overall effectiveness from November 2013 to March 2017
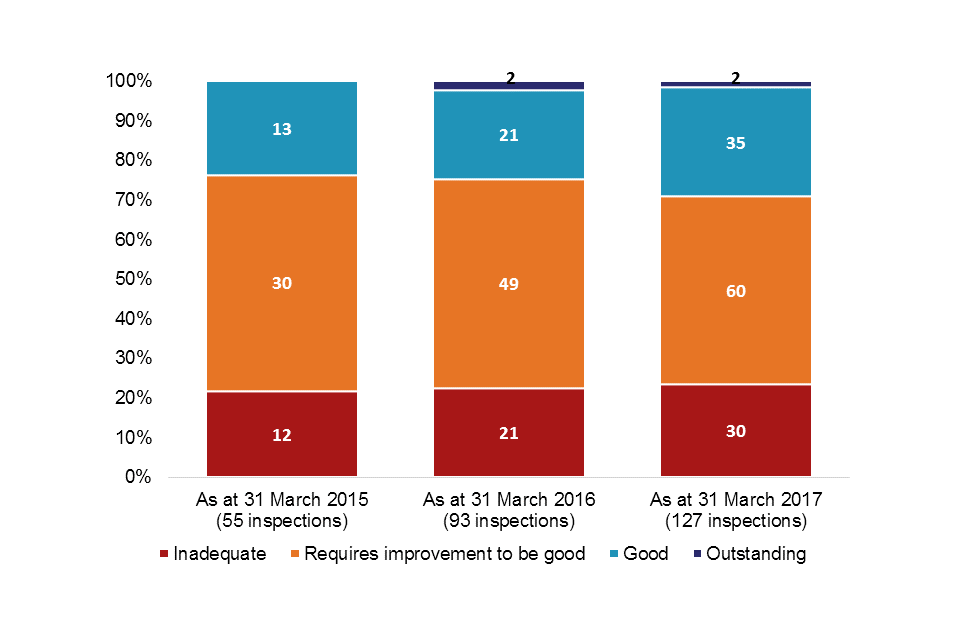
There were 127 SIF inspections published by 30 April 2017. This makes up 84% of all LAs responsible for children’s social care in England and is quite close to being a full picture of all LAs in England. View the underlying data tables.
Compared with 31 March 2016, the percentage of LAs judged good increased as at 31 March 2017, while the percentage judged requires improvement to be good fell. In 2016 to 2017, children were more likely to be living in LAs judged to be good or outstanding than in those judged to be inadequate. Children living in the east of the country were more likely than those living in the west to be in good or outstanding LAs.
Chart 1: SIF Overall effectiveness judgement to March 2017
SIF Overall effectiveness to March 2017
Map 1: SIF inspection Overall effectiveness judgements to March 2017
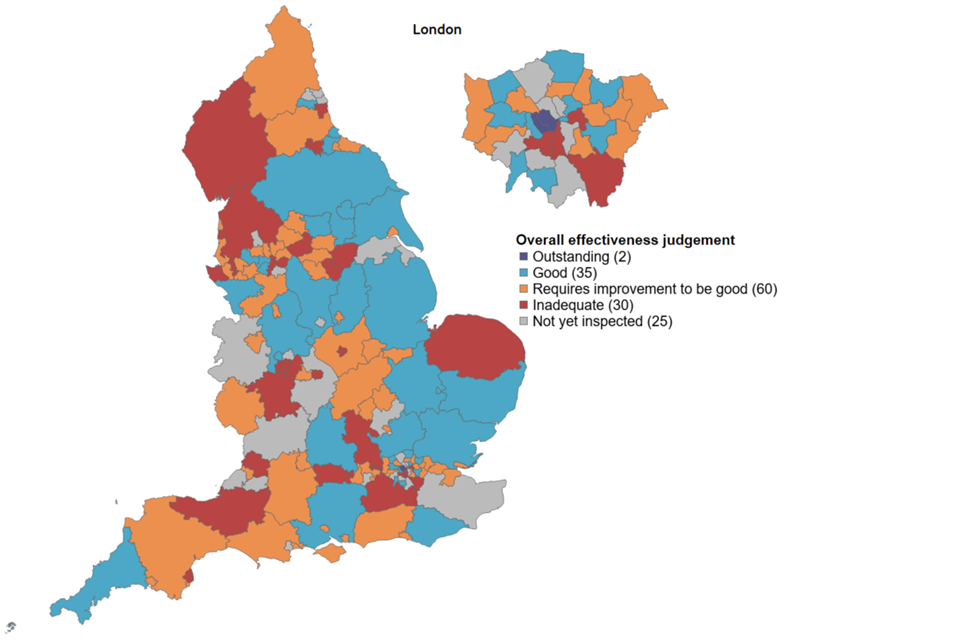
SIF inspection Overall effectiveness judgements to March 2017
2.2 Key judgements from November 2013 to March 2017
The Overall effectiveness judgement for the SIF is derived from 3 key judgements:
- the experiences and progress of children who need Help and protection
- the experiences and progress of Children looked after and achieving permanence, including sub-judgements for Adoption performance and Experiences and progress of care leavers
- leadership, management and governance
There has not been much change in the percentage of LAs judged to be good or outstanding for each key judgement, compared with 31 March 2016. View the underlying data tables.
Chart 2: Key judgement grades to March 2017
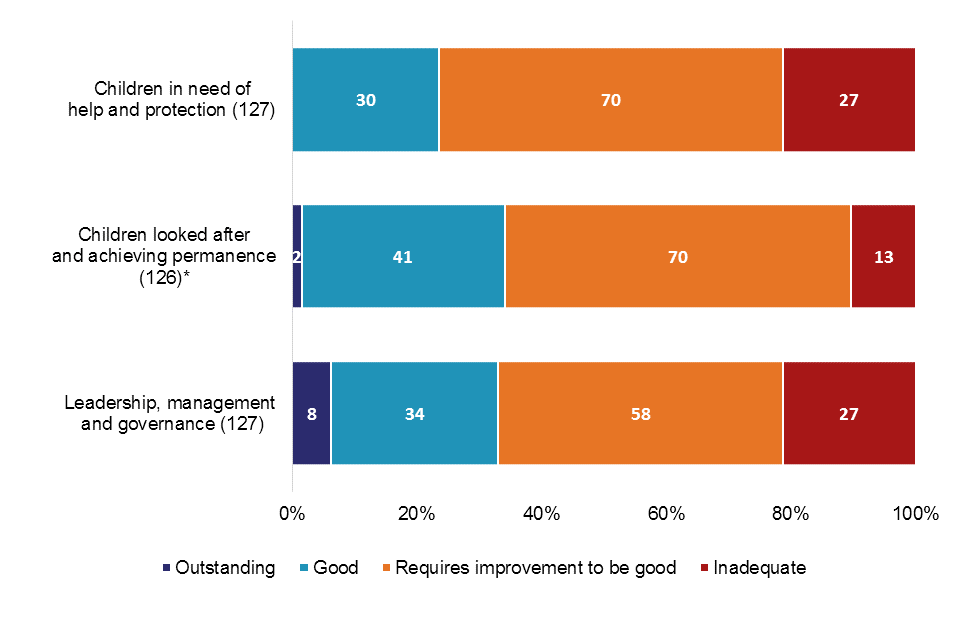
Key judgement grades to March 2017
Help and protection appears to be the key judgement where achieving a good or better grade is most challenging, with only 24% of LAs achieving a good judgement, and none achieving outstanding. There are many factors that go into the eventual judgement for an LA around Help and protection, and it is not currently possible to draw conclusions about why fewer LAs are being judged good or better in this area than in others.[footnote 1]
Children looked after and achieving permanence is the key judgement where LAs perform most strongly, with the highest percentage of good or outstanding judgements (34%) and the lowest percentage of inadequate (10%).
However, Leadership, management and governance is the area where LAs were most likely to be judged outstanding (6%).
2.3 Outcomes across all key judgements
Only a very small number of LAs (10, or 8%) were judged inadequate across all 3 key judgements. Of these 10 LAs, only 2 (Bromley and Sunderland) were also judged inadequate for both sub-judgements. View the underlying data tables.
Map 2: LAs judged inadequate for Help and protection & Leadership and management

LAs judged inadequate for Help and protection & Leadership and management
Twenty-five LAs (20%) were judged inadequate for both Help and protection and Leadership and management key judgements. This increase was disproportionate to the increase in inspections overall: the number of LAs inspected increased by a third, while the number judged inadequate for these 2 key judgements doubled. This was despite there being no change in how Ofsted inspected between the years.
Ten of these LAs (40%) were in the West Midlands or the North West, despite only 25% of inspected LAs being in those regions.
2.4 Children looked after sub-judgements to March 2017
The key judgement area Children looked after has 2 sub-judgements: Adoption performance and Experiences and progress of care leavers.
Chart 3: SIF Adoption performance sub-judgement to March 2017
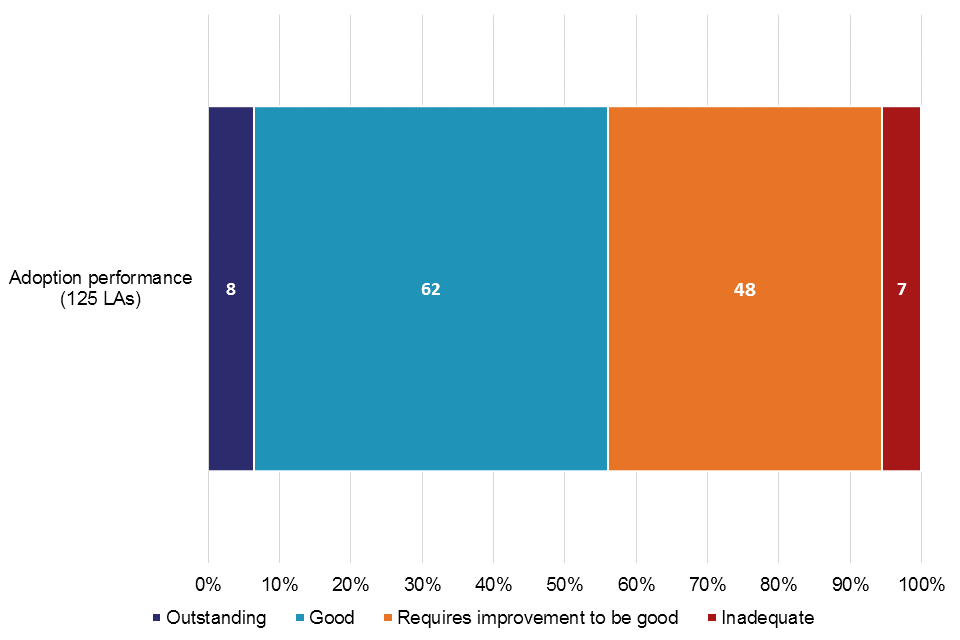
SIF Adoption performance sub-judgement to March 2017
The percentage of LAs judged to be good or outstanding for Adoption performance remains at 56%; City of London and Isles of Scilly were not judged for Adoption performance, as they have no adopted children. View the underlying data tables.
Fewer LAs were judged inadequate during 2016 to 2017 for the Adoption performance sub-judgement (4) than for the Care leavers sub-judgement (7).
Chart 4: SIF Experiences and progress of care leavers sub-judgement to March 2017

SIF Experiences and progress of care leavers sub-judgement to March 2017
The percentage of LAs judged to be good or outstanding for Experiences and progress of care leavers has increased slightly since March 2016, from 37% to 40%. Isles of Scilly is not judged for Care leavers, as they have no children in care.View the underlying data tables.
Within this, there has also been a larger increase in the number of LAs judged to be outstanding, from 2 to 6. The 4 LAs judged outstanding in 2016 to 2017 for this sub-judgement were from London (Ealing and Hackney) and North East, Yorkshire and the Humber regions (East Riding of Yorkshire and Stockton-on-Tees).
One LA (Birmingham) was reinspected during the year, and improved from inadequate to requires improvement to be good for this sub-judgement. Four newly inspected LAs (Bromley, Havering, Wirral, and Worcestershire) were judged to be inadequate for this sub-judgement. As a result, the number of LAs judged inadequate for this sub-judgement increased from 12 to 15.
There are many factors that go into the eventual judgement for an LA around children leaving care. However, one that shows a clear split between LAs judged outstanding for this sub-judgement and those judged inadequate is around appropriate housing for children leaving care. All 4 LAs judged outstanding for this sub-judgement in 2016 to 2017 were reported to have very high numbers of care leavers in appropriate accommodation. By comparison, 3 of the 4 LAs judged inadequate for this sub-judgement in 2016 to 2017 struggled in this area.
2.5 Overall effectiveness by LA type and location to March 2017
Each region in England varies in terms of geographical size and the number of LAs within it, and not all regions have yet been inspected proportionate to the number of LAs within them.
All regions now have at least 1 LA judged good or better for Overall effectiveness, after the South West had its first 2 good outcomes in 2016 to 2017 (Cornwall and Isles of Scilly). View the underlying data tables.
Chart 5: Regional Overall effectiveness grades to March 2017
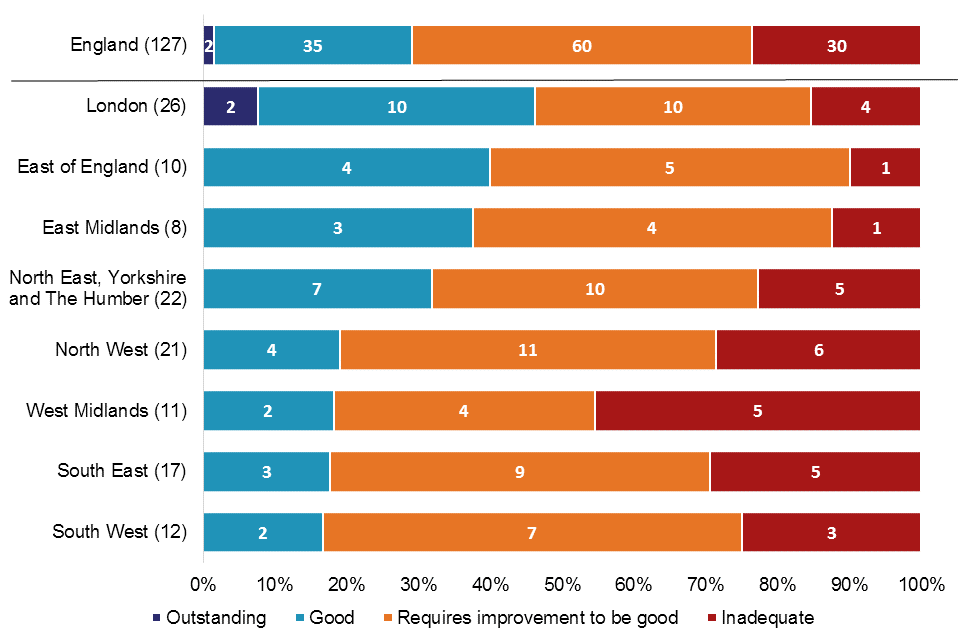
Regional Overall effectiveness grades to March 2017
The South East has fallen from being the region with the second highest percentage of its LAs judged good or better to being the second lowest, since March 2016. This is mainly due to the first 3 LAs inspected in the region under the SIF being judged good, and all subsequently inspected LAs being judged requires improvement to be good or inadequate. This is unlike other regions, where good or outstanding outcomes have occurred throughout the inspection period.
The West Midlands continues to have the highest percentage of LAs judged to be inadequate, at 45%, with only 3 LAs still to be inspected. However, there does not appear to be anything specific to the region that might explain this.
Map 3: Percentage of inspected LAs judged to be good or outstanding to March 2017

Percentage of inspected LAs judged to be good or outstanding to March 2017
There is a higher percentage of LAs judged to be good or better in regions on the east of country, compared with the west of the country. Although the reasons for this are unclear, strong leadership is an important factor in achieving a good or better Overall effectiveness grade.
Other factors
It is difficult, without in-depth research, to fully understand the reasons behind some of the changes and variations that are seen in the data relating to SIF inspections. It is also difficult to say in many cases whether a pattern is causation or correlation. Below, we have included some patterns in the data that are of interest, and may warrant more in-depth investigation to fully understand if, and how, they are related to inspection outcomes.
LA type:
A higher percentage of shire counties were judged good or better (50%) than any other type. London boroughs had the next highest percentage, at 46%. However, this does not necessarily mean that regions with higher numbers of shire counties also have higher numbers of LAs judged good or better.
Unitary authorities were more likely than any other LA type to be judged requires improvement to be good (70%). These make up the majority (11 of 17) of the South East’s inspected LAs, and so the recent inspections of these LA types in that region may partially explain the fall in the percentage of good or better LAs in the South East over time. However, despite research into other factors, such as numbers of children and level of deprivation, no other pattern to explain this has become evident. View the underlying data tables.
Social worker percentage turnover:
Chart 6: Changes in social worker percentage turnover post-SIF, by Overall effectiveness grade

Changes in social worker percentage turnover post-SIF, by Overall effectiveness grade
Because this chart, sourced from the DfE Information on Children’s Social Care Workforce, uses data from the year after the SIF inspection, commentary is not available for LAs inspected in 2016 to 2017.
For those LAs inspected in 2013 to 2015, more LAs judged good or better saw increased staff turnover after their SIF than for any other Overall effectiveness judgement. This is contrary to the widely held belief that staff turnover is more likely following an inadequate judgement.
Rate of children in need (CiN):
This refers to the number of children in need per 10,000 children aged under 18. A higher rate indicates more children in need as a proportion of all children in the LA.
Chart 7: Number of LAs judged good or better and inadequate, by rate of CiN

Number of LAs judged good or better and inadequate, by rate of CiN
More LAs judged good or outstanding fell within Quartile 1 for the lowest rate of children in need than did LAs judged inadequate. The reverse was true when looking at Quartile 4, for the highest rate of children in need.
Level of deprivation:
Chart 8: Level of deprivation, by SIF Overall effectiveness
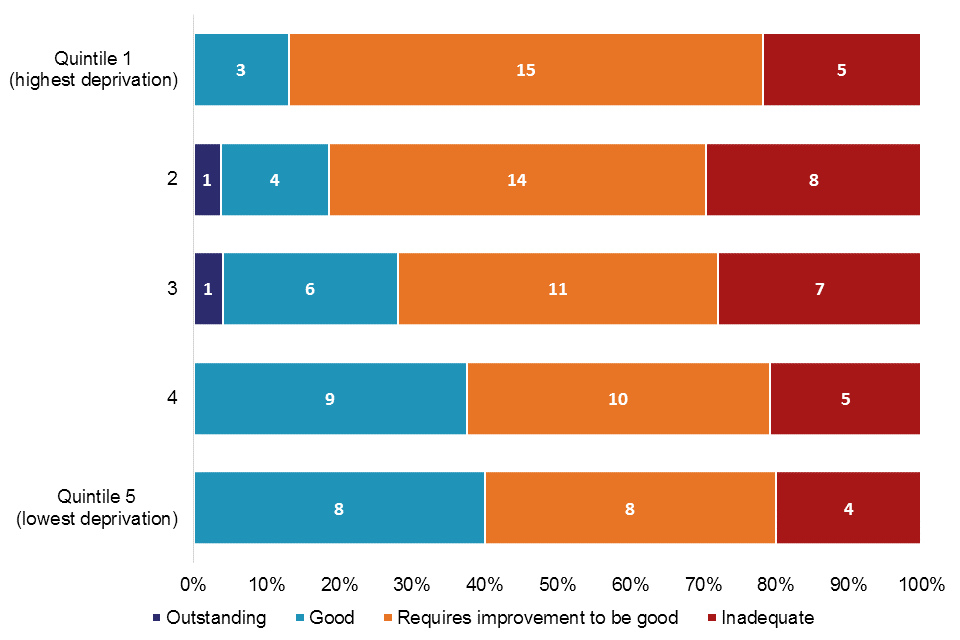
Level of deprivation, by SIF Overall effectiveness
Although there appears to be some relationship between levels of deprivation and good Overall effectiveness outcomes, this is not the case for LAs with inadequate outcomes. LAs with the lowest levels of deprivation were more commonly judged good or outstanding than LAs with the highest levels, and less commonly judged requires improvement to be good. However, the numbers of LAs judged to be inadequate were very similar for the highest and lowest levels of deprivation.
2.6 Inspections of local authorities: some comparisons
Because of the different frameworks used to inspect LAs since 2009, it is difficult to compare the SIF Overall effectiveness judgement with those from previous inspection frameworks.[footnote 2] Generally, LAs were more likely to receive a lower grade under the SIF compared with previous judgements; however, this was not true for LAs previously judged adequate, and suggests that previous grade cannot be used as a predictor of an LA’s grade under the SIF for these key judgements.
There are 2 key judgements in the SIF inspections, though, where it is possible to draw some comparisons to a previous inspection judgement:
- children who need help and protection with outcomes from the Safeguarding (from July 2009 to July 2012) or Child protection (from July 2012 to July 2013) inspections
- children looked after and achieving permanence with outcomes from the Looked after children inspections (from July 2009 to July 2012, including a handful of Targeted Looked after children inspections conducted in the summer of 2013)
Table 1: Children who need help & protection, change from previous inspection
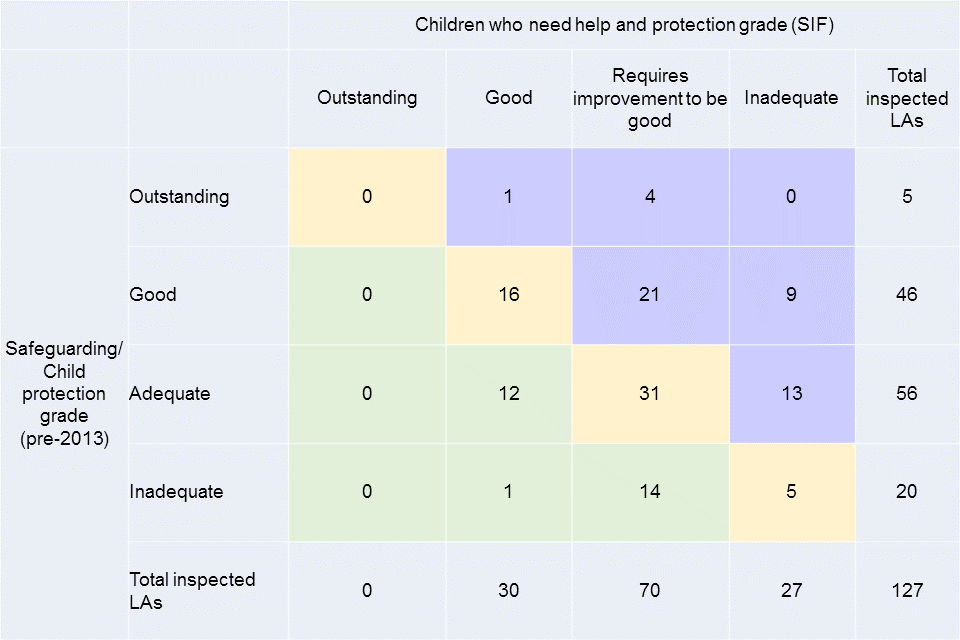
Children who need help & protection, change from previous inspection
As part of the move to the SIF framework, Ofsted focused more on the experiences of children, including how they are helped and protected. As a result, more LAs received a lower grade for Help and protection (38%) than received a higher one (21%), compared with grades for Safeguarding/Child protection. Of those LAs which did receive a higher grade for Help and protection, 60% (16) had their SIF within 2 years of their previous inspection. The timing of a SIF inspection is influenced by a number of factors, and so the gap between pre-SIF and SIF inspections varies depending on inspection scheduling. Two LAs have had a second SIF; both of them remained inadequate.[^3] View the underlying data tables.
However, the pattern of change was not the same for all previous grades. For example, of the 56 LAs previously judged adequate, broadly the same percentage received a higher grade (21%) as received a lower one (23%) under the SIF.
Table 2: Children looked after & achieving permanence, change from previous inspection
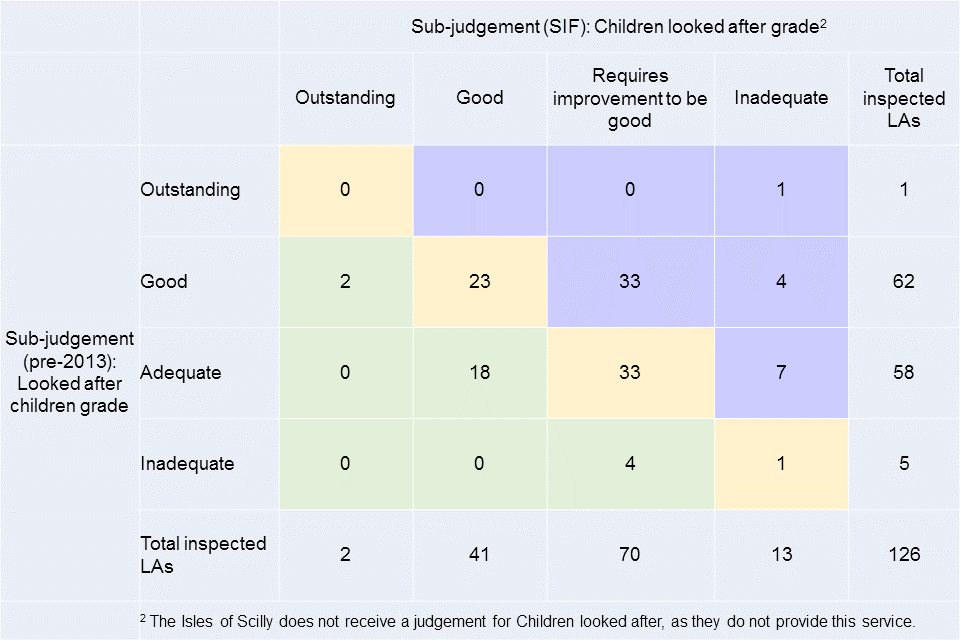
Children looked after & achieving permanence, change from previous inspection
Similar to the shift in focus for Help and protection, there was also a move to focus more on children’s experiences around being looked after. As a result, there were again more LAs receiving a lower grade for this sub-judgement (37%) than a higher grade (17%), compared with the Looked after children grade (pre-2013). However, only 25% (6) of LAs which received a higher grade for Children looked after had their SIF within 2 years of their previous inspection. View the underlying data tables.
Again, as with Help and protection, the pattern of change was not the same for all previous grades. Of the 58 LAs judged adequate for Looked after children (pre-2013), more than twice as many (31%, 18 LAs) received a higher grade under the SIF as received a lower grade (12%, 7 LAs).
3. Reviews of Local Safeguarding Children Boards
Ofsted conducts reviews of Local Safeguarding Children Boards (LSCBs) alongside the SIF inspections of LA children’s services. Their LSCB Overall effectiveness judgement is not, however, directly comparable to the SIF Overall effectiveness judgement. This review arrangement has been in place since November 2013.
There were 127 reviews of LSCBs up to 31 March 2017. View the underlying data tables.
Map 4: Overall effectiveness judgements for LSCB reviews to March 2017

Overall effectiveness judgements for LSCB reviews to March 2017
Three LSCBs have now been judged outstanding; these were all judged good for SIF Overall effectiveness. The 3 LSCBs (City of London, Hackney, and City of York) were all judged good or better for Children looked after, and Leadership and management sub-judgements. Hackney and City of London were judged good for Children in need of help and protection; City of York was judged requires improvement to be good. For the majority of inspected LAs (65%, 83), Help and protection and LSCB grades were the same. Where there was a difference, the LSCB grade was more likely to be higher (25% of LAs compared with 9% where it was lower).
4. All children’s homes
4.1 Providers and places as at 31 March 2017
There has been an increase in the number of children’s homes – a far greater increase than at any other point in the last 5 years. Privately run, for-profit, homes continue to account for the majority of all homes, whilst the number of LA-run homes continues to fall. If short break only homes are excluded, then more than one-third of LAs nationally (and more than two-thirds of the LAs in London) do not run any homes. 7% of homes active at 31 March 2016 either closed or were re-registered in 2016 to 2017.
Children’s homes, of all types, accounted for three-quarters of all social care providers in England at the end of March 2017.
There were 2,145 active children’s homes at the end of the year, a 4% increase from the previous year (2,071). View the underlying data tables.
There were 11,664 registered places in all children’s homes, representing less than a 1% (25) increase from the figure at the same time the previous year (11,639).
Chart 9: Percentage of children’s homes run by each sector

Percentage of children’s homes run by each sector
- LAs ran 434, or 20%, of all homes
- private organisations ran 1,538, or 72%, of all homes. These organisations are run for profit
- voluntary organisations ran 164, or 8%, of all homes. These are run as non-profit making organisations
- 9 homes are also run by health authorities and are excluded from the chart above.
As at 31 March 2017, children’s homes were made up of the following sub-types:
- 2,050 children’s homes, with 9,124 places - this was an increase of 78 homes and 247 places from last year
- 81 residential special schools registered as children’s homes, with 2,302 places - this was a decrease of 4 schools and 225 places from last year[footnote 5]
- 14 secure children’s homes, with 238 places - this was no change in the number of homes and an increase of 3 places from last year
Between 1 April 2016 and 31 March 2017, a total of 228 children’s homes registered and began to operate, and offered 1,016 places. Of these, 75 were re-registrations. In the same period, 154 children’s homes with 834 places were de-registered, predominately via resignations/voluntary cancellations, with 3 Ofsted-initiated cancellations.[footnote 6]
In this release, “children’s home” as a sub-type means any home that does not fall within the other 2 sub types, that is, is not a residential special school registered as a children’s home and is not a secure children’s home.
Children’s homes, as distinct from residential special schools registered as children’s homes and secure children’s homes, provide care that meets the various, diverse needs of children looked after. Some specialise in a particular set of needs, such as children on the autistic spectrum or children with behavioural difficulties. They are inspected at least once every year.
Children’s homes
Around 11% of children’s homes as at 31 March 2017 registered within the year; 2 homes both registered and de-registered within the same year (7 places).
Re-registrations:
Almost all re-registrations, 72 of 75, were children’s homes, the majority of which were due to a change in ownership. The other 3 were re-registrations of residential special schools registered as children’s homes. Of these 3, 1 had previously been registered as a residential special school, and the other 2 were re-registered due to new ownership. Most of the re-registrations (49) were of children’s homes that had de-registered in 2016 to 2017. Of these 49 homes: 36 were the result of a change in ownership, including 13 which left the LA sector; 13 stayed under the same ownership, 3 of which changed provider type from residential special school to children’s home.
Seven children’s homes were re-registrations of homes that had closed in 2015 to 2016 and 16 were re-registrations of children’s homes that had closed prior to April 2015.
Regions:
Chart 10: Number of children’s homes and places, by region
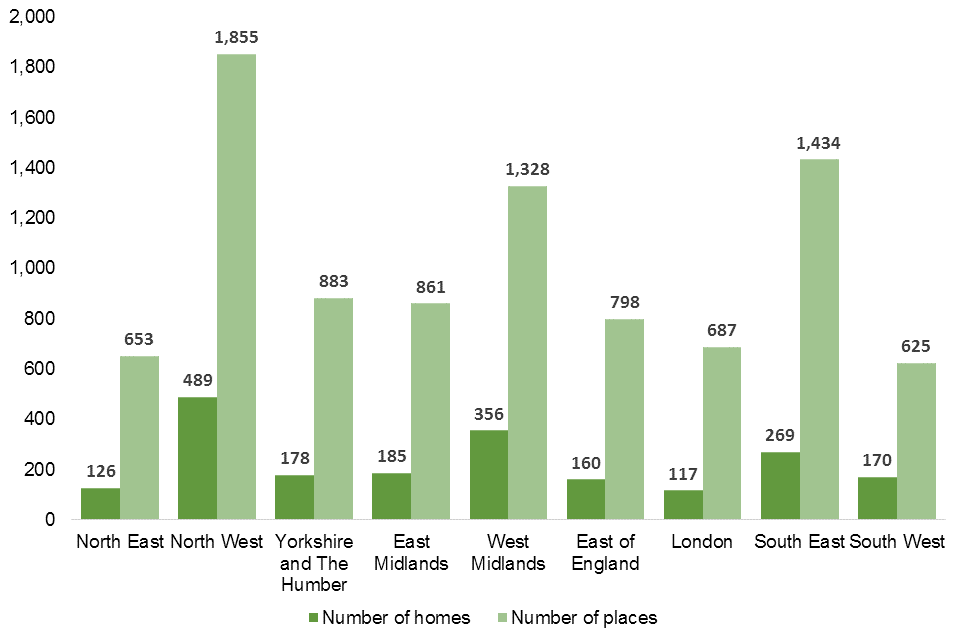
Number of children’s homes and places, by region
The regional distribution of homes and the regional distribution of places are similar but not identical. View the underlying data tables.
The regional picture of where children’s homes are located has remained largely unchanged since March 2016, with no regional proportion changing by more than 1 percentage point since last year. The North West still has almost one-quarter of all homes and only 2 regions had fewer homes than last year – London (8 fewer) and the East of England (1 fewer).
The regional picture of where children’s home places were located also remained largely unchanged since last year – again, no regional proportion changed by more than 1 percentage point. The South West had fewer places to offer despite having 5 more children’s homes than at 31 March 2016.
Sector:
The majority of children’s homes were run by private providers. Private providers ran 1,481 homes (72%), similar to 2016. Voluntary organisations ran 142 homes (7%), a decrease of 2 homes from 2016. The remainder (20%) were run by LAs. View the underlying data tables.
The number of LA-run homes fell by 4% from 2016, continuing the trend of reducing numbers of LA-run homes: a reduction of 5% from 2015 to 2016 and of 8% from 2014 to 2015. Despite this, the overall percentage of homes run by LAs decreased by only 2 percentage points (from 22% to 20%).
There are 111 LAs which run some or all of the children’s homes in their area, including short-break only homes. When short-break only homes are not counted, there are 96 LAs running some or all of the homes in their area; one-third of LAs do not run any of the homes in their area. These figures represent a decrease of 4 and 6 LAs, respectively, from last year.
Around 9% of all children’s homes across England are short breaks only homes, accounting for around 12% of all places. This was a small reduction from the previous year (10% and 14% respectively).
The regions in which short break homes provide the largest proportions of their places are: London (17% of their available children’s homes places), the North East and the South West (both 15%).
Table 3: Children’s homes at 31 March 2017, by number of beds and region

Children’s homes at 31 March 2017, by number of beds and region
There are large regional variations in the size of children’s homes. The proportions of small homes (1 or 2 beds) range from just 1% in London and 4% in the East of England to 25% in the West Midlands and 28% in the North West. As for large homes (10 or more beds), proportions range from 1% in both the South West and the North West to 7% in the South East and 9% in London. In terms of the regional size profile, there has been very little change since last year. View the underlying data tables.
Comparing the latest data with historical data revealed no substantial change in the national size profile. However, there has been a tendency towards smaller homes with the proportion of homes with 7 or more beds reducing from 16% at 31 March 2013 to 12% at 31 March 2017, and the proportion of 3- or 4-bed homes increasing from 38% to 42% in the same period.
Residential special schools registered as children’s homes
Residential special schools registered as children’s homes specialise in educational provision for very vulnerable children, some of whom (those who are resident for more than 295 days in a year) are children looked after. Residential special schools, which are often large in size, tend to be in more rural areas.
The region with the highest number of residential special schools registered as children’s homes is the South East (17). All but 3 of these homes are private or voluntary-run, with just over two-thirds (57) run by the private sector.
Secure children’s homes
Secure children’s homes provide services to young people who have placed themselves, or others, at risk of harm. These homes meet the young people’s needs within a secure environment, including residential care, educational facilities and healthcare provision.
All but 1 secure children’s home are LA-run; the sole exception is voluntary-run.
The DfE recently reported that, at 31 March 2017, the 14 secure children’s homes open in England offered 232 approved places (no change from their reported figures for the previous year). They also reported occupancy and availability rates, which is data not collected or held by Ofsted. Of the 232 approved places reported by the DfE, 205 (88%) were available, of which 184 were occupied.
Although there has been some suggestion that the number of secure children’s homes places has fallen over time because of an increase in 1-bed non-secure homes, the figures above suggest that this is not the case. Of the 151 children’s homes that newly registered in 2016 to 2017, only 4% (6 homes) were 1-bed homes, and only 23% (34 homes) were 1- or 2-bed homes. View the underlying data tables.
4.2 Overall effectiveness for all children’s homes
There are 2 ways to look at information about Overall effectiveness:
State of the nation: this looks at all providers active on 31 March 2017, and what their most recent inspection judgement was at this date; for each provider, only their most recent full inspection is included. Providers that have not yet had an inspection are excluded; providers inspected prior to 1 April 2016 but not since will have their pre-2016 judgement included.
In year: this looks at all inspections that took place between 1 April 2016 and 31 March 2017, and what judgement these resulted in; this will include providers that closed before the end of the year. For some providers, this will include more than 1 inspection: generally, these are homes that were found at some point to be inadequate, or for which concerns were raised which required additional inspections. Some providers will be excluded as they were not inspected in the year: for example, homes with no children on roll and no plans to accept children in the 3 months following the planned inspection date; and homes that registered too late in the year to receive a full inspection prior to the end of March.
4.3 State of the nation for all children’s homes as at 31 March 2017
The proportion of children’s homes judged to be good or better was at its highest in the last 5 years. Homes in the North East, the South East, and Yorkshire and the Humber were most likely to be judged good or better. A slightly larger proportion of LA-run homes were judged to be good or better than of private or voluntary-run homes.
Of the 2,145 active homes of all types as at 31 March 2017, in total 2,018 had received a full inspection. The inspection is the most recent full inspection the provision had received and is not necessarily from 2016 to 2017. View the underlying data tables.
Chart 11: Children’s homes latest Overall effectiveness judgement, as at 31 March 2017

Children’s homes latest Overall effectiveness judgement, as at 31 March 2017
As at 31 March 2017, 82% of all children’s homes were good or better, compared with 79% the previous year. This continued the increase seen last year (from 70% as at 31 March 2015) and surpassed the previous highest level of 81% good or better as at 31 March 2012. This ongoing increase is believed to be in part due to the impact of the quality standards on the quality of care, as well as swift and firm responses by Ofsted to providers who do not meet these standards, demonstrated in increased enforcement work over time.
Nationally, LA-run homes (85%) had a slightly higher percentage of good or better homes than both the voluntary (83%) and the private (80%) sectors.
All but 1 of the 8 health authority-run homes inspected were judged good or better.
Chart 12: Children’s homes latest Overall effectiveness inspection judgement, as at 31 March 2017, by region

Children’s homes latest Overall effectiveness inspection judgement, as at 31 March 2017, by region
The North East, the South East, and the Yorkshire and the Humber regions had the highest percentages of good or better homes, all at 89%. The region with the lowest percentage of good or better homes was the South West (62%).
Ofsted re-inspects inadequate provision until it either improves or ceases to be registered. For this reason, the number of inadequate homes in the state of the nation is much lower than the number of inspections resulting in an inadequate judgement in 2016 to 2017. Children’s homes inspected more than once in 2016 to 2017 are addressed later in this release.
4.4 All children’s homes inspections in year 2016 to 2017
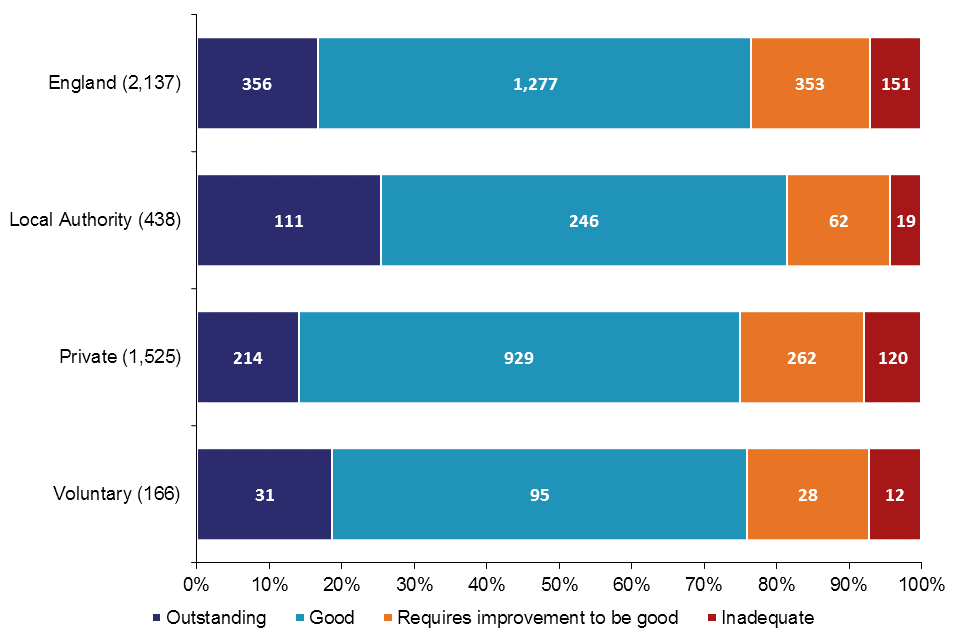
Whilst a similar proportion of inspections in 2016 to 2017 resulted in a good or better outcome compared with 2015 to 2016, proportionally fewer homes this year were judged requires improvement to be good. This meant that proportionally more homes were judged inadequate this year than in 2015 to 2016.
Chart 13: Children’s homes Overall effectiveness judgements 2016 to 2017
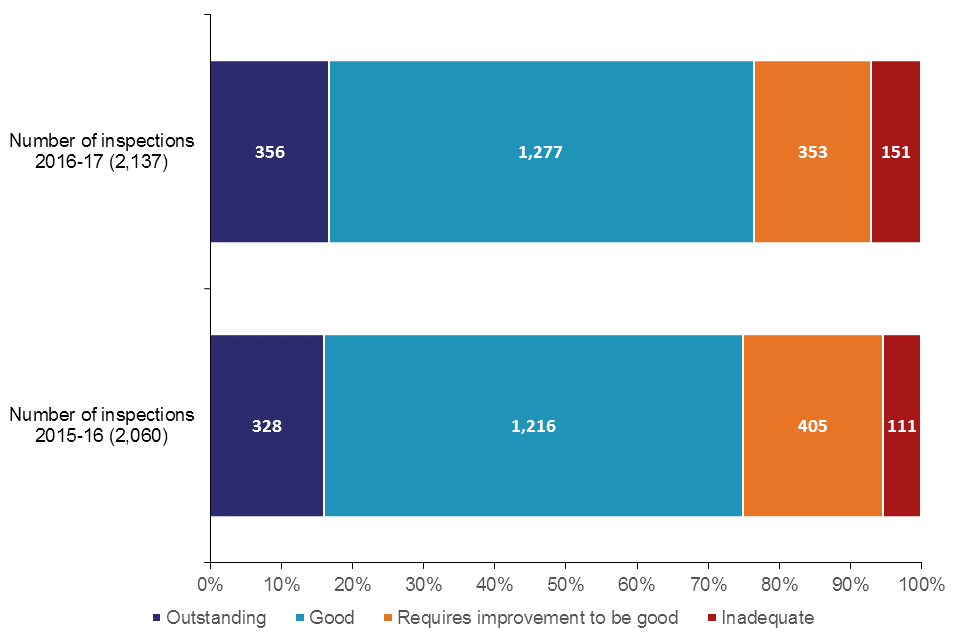
Children’s homes Overall effectiveness judgements 2016-17
There were 2,137 full inspections of all types of children’s homes between 1 April 2016 and 31 March 2017, equating to 77 more than in the previous year. Most of these (2,028) were inspections of children’s homes, while 4% (94) were inspections of residential special schools registered as children’s homes, and less than 1% (15) were of secure children’s homes. View the underlying data tables.
The pattern of outcome judgements was very similar to the previous year. The percentage of children’s homes judged good or better increased by 1 percentage point to 76%; for homes judged inadequate, the increase was 2 percentage points (to 7%). In contrast, the percentage of requires improvement to be good outcomes decreased by 3 percentage points (to 17%); prior to the change in the inspection framework in April 2015, this was “adequate”. These changes are likely to be a result of further embedding of the quality standards since their introduction in 2015, leading both to improved quality of care, and, where homes have not been able to address continued issues in their practice, those being judged as inadequate.
One hundred and twenty-eight homes were judged inadequate at least once during the year. All but 3 of these homes were judged inadequate at their first full inspection of the 2016 to 2017 inspection cycle; of the remaining 3, 2 were originally found to be requires improvement to be good, and the third was originally good. Of the 128 homes in total, 22 were judged inadequate twice and 1 judged inadequate on 3 occasions. Failures in safeguarding, leadership and management, and restraint and restrictive practices are 3 common factors leading to an inadequate Overall effectiveness judgement.
As the above indicates, homes inspected on more than 1 occasion, and judged inadequate, generally improved at their subsequent inspection in year. In total, 103 children’s homes, of all types, received more than 1 full inspection in 2016 to 2017. Ninety-four of these were children’s homes, 8 were residential special schools registered as children’s homes, and 1 was a secure children’s home.
Of these, 100 were judged inadequate at their first inspection in the year:
- 79 improved to either requires improvement to be good (46) or good (33) at their second inspection in the year
- 14 remained inadequate at their second inspection and were not inspected again within the year (6 of which subsequently resigned)
- 6, having already been judged to be inadequate twice in the year, improved to either requires improvement to be good (5) or good (1)
- 1 was judged inadequate for a third time and remained so as at 31 March 2017
Inadequate provision, therefore, improved more quickly than last year. As shown above, 85% of provisions judged to be inadequate in 2016 to 2017 improved to either good or requires improvement to be good during the year (79% at the subsequent inspection). This compares with 68% of provisions judged to be inadequate in 2015 to 2016 (62% at the subsequent inspection).
4.5 Overall effectiveness for all children’s homes inspections – change since last inspection
Most homes achieved the same inspection judgement as the previous year. Very similar numbers of homes improved as declined.
Chart 14: Change to Overall effectiveness judgement compared with previous inspection
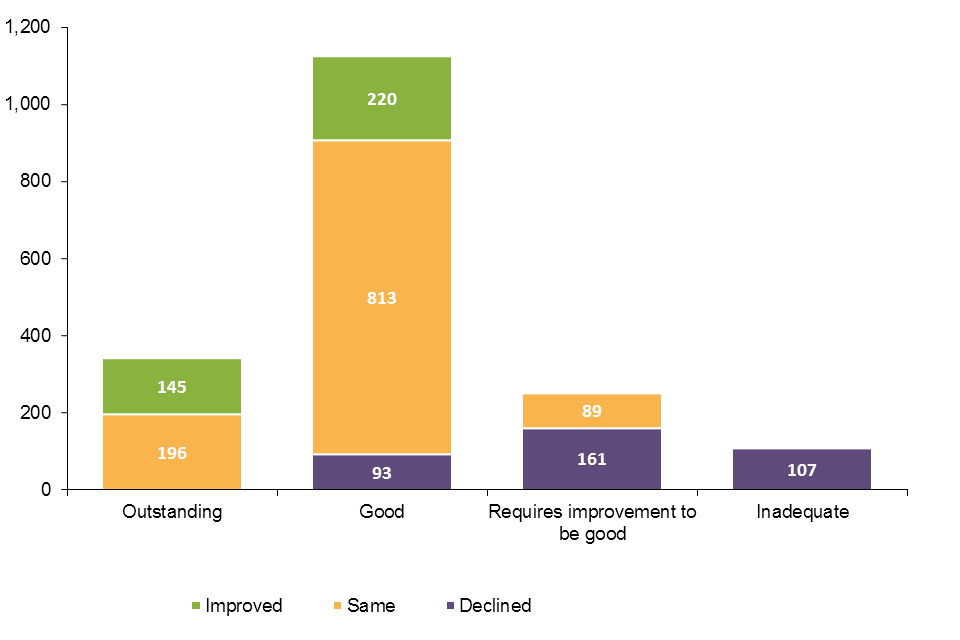
Change to Overall effectiveness judgement compared to previous inspection
There were 1,829 homes inspected in the period 1 April 2016 to 31 March 2017 that had also been inspected in 2015 to 2016 (90% of all homes inspected in 2016 to 2017). Of these, 60% remained unchanged in their judgement (1,099); unlike last year, when more homes improved than declined, this year, when there were changes, homes were just as likely to decline (361) as improve (369). Around 10% (196) of children’s homes inspected in 2016 to 2017 had no comparable judgement in 2015 to 2016. This is because, for example, a provider was registered late in the year and had not yet received their first inspection by the end of the period.
Of the 18 homes still judged inadequate as at 31 March 2016: 8 were judged to be good in 2016 to 2017; 4 requires improvement to be good; 1 inadequate again; and 3 resigned. A further 2 homes did not receive full inspections in 2016 to 2017 due to having no children in placement as a result of having restriction of accommodation notices in place, and as such remain inadequate.
Just over a third of the homes judged outstanding in 2015 to 2016 that were subsequently inspected in 2016 to 2017 declined (112 homes), predominantly to good (93 homes). Homes previously judged to be good were most likely to remain at good. Of the good homes that declined, 60 out of 204 homes (29%) were judged to be inadequate in 2016 to 2017, compared with 28 out of 184 homes (15%) in 2015 to 2016. Two-thirds of the 60 homes judged inadequate in 2016 to 2017 having been judged good in 2015 to 2016 subsequently improved to either good or requires improvement to be good during the year.
This is likely to be due to the impact that an unexpected change – such as a change of manager, admittance of a child with more challenging needs, or even a series of emergency placements – can have on children’s homes. Because many homes are quite small, these factors can have a greater impact than for other provision types, where there are often more children, or children are not all placed together (such as fostering placements).
Ten homes remained inadequate (5 having been inspected at least once more in 2016 to 2017) and 10 homes closed during the year (1 of which was judged inadequate for a second time in 2016 to 2017 before closing).
4.6 Regional outcomes for all children’s homes in year 2016 to 2017
There is a regional variation in the Overall effectiveness outcomes for children’s homes. Nationally, homes with a previous inspection judgement of requires improvement to be good or inadequate were more likely to have improved to good or better than to have stayed the same or declined. However, this was not the case in London or the South West. View the underlying data tables.
Chart 15: Children’s homes Overall effectiveness 2016 to 2017, by region
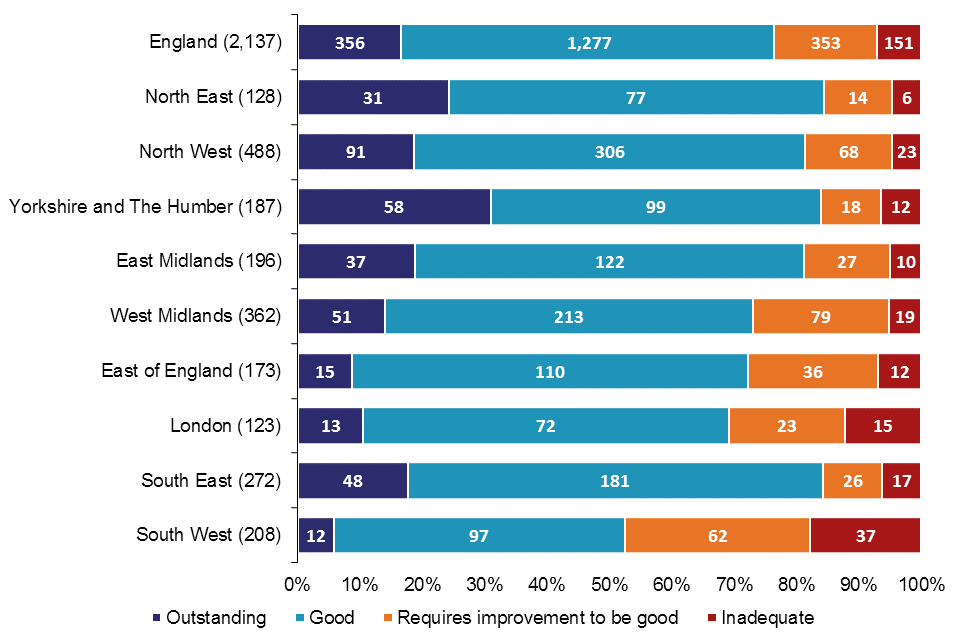
Children’s homes Overall effectiveness 2016-17, by region
The regions with the highest percentages of good or better inspection judgements between 1 April 2016 and 31 March 2017 were the North East, the South East, and Yorkshire and the Humber (all 84%).
The regions with the lowest percentages of inspections resulting in good or better judgements were the South West (52%) and London (69%). These were 2 of only 3 regions to have a lower proportion of inspections resulting in good or better judgements in 2016 to 2017 than in 2015 to 2016 – the South West saw the biggest decline (4 percentage points) despite already achieving by far the lowest proportion of good or better judgements.
The 3 regions to have the highest percentages of homes declining in their Overall effectiveness judgements were the South West (27%), the North West (23%) and the West Midlands (22%).
Chart 16: Change for children’s homes previously judged requires improvement to be good for Overall effectiveness, by region

Change for children’s homes previously judged requires improvement to be good for Overall effectiveness, by region
Of the 360 homes judged requires improvement to be good in 2015 to 2016 and inspected in 2016 to 2017, almost two-thirds (226) are now judged good or better. The North East (80%), South East (76%), and Yorkshire and the Humber (75%) showed the most marked improvement. A large number of factors can lead to improvement, 1 of which is strong relationships and partnership working: between providers and outside agencies (to see what they can offer children looked after); and across sectors between providers themselves. The regions with the least improvement were the South West (39%) and London (50%).
4.7 Sector data for all children’s homes in year 2016 to 2017
In a change from last year, LA-run homes outperformed both private- and voluntary-run homes in 2016 to 2017, with a larger proportion of LA-run homes being judged good or better compared with private- or voluntary-run homes.
Chart 17: Children’s homes Overall effectiveness 2016 to 2017, by sector
Children’s homes Overall effectiveness 2016-17, by sector
LA-run homes, which make up 20% of all children’s homes, had the best performance profile, with a higher percentage of good or better homes, when compared with privately-run and voluntary-run homes, which make up 72% and 8% respectively. This contrasts with 2015 to 2016, when voluntary-run homes had the best performance profile, though the reasons for this shift are unclear.
LA-run homes also had the highest percentage of outstanding Overall effectiveness judgements for the period, at 25%. In comparison, privately-run and voluntary-run homes had 14% and 19% respectively.
Seven of the 8 health authority-run homes inspected during 2016 to 2017 were judged good and 1 was judged requires improvement to be good.
Map 5: Local authority-run children’s homes receiving a good or better overall effectiveness judgement at full inspection, by region, in 2016 to 2017

Local authority-run children’s homes receiving a good or better overall effectiveness judgement at full inspection, by region, in 2016-17
Map 6: Private and voluntary-run children’s homes receiving a good or better overall effectiveness judgement at full inspection, by region, in 2016 to 2017

Private and voluntary-run children’s homes receiving a good or better overall effectiveness judgement at full inspection, by region, in 2016-17
In line with the national sectorial picture, LA-run homes, when compared with privately-run and voluntary-run homes combined, had a higher percentage of homes judged good or better in 7 of the 9 regions. London had the biggest difference between the 2 groups (90% for LA-run homes compared with 64% for private- and voluntary-run homes), followed by the East Midlands (90% compared with 78%), and the East of England (81% compared with 70%).
The 2 regions where voluntary-run and privately-run homes combined outperformed LA-run homes in having a higher percentage of good or better homes were Yorkshire and the Humber (86% for private- and voluntary-run homes compared with 81% for LA-run homes), and the South East (85% compared with 82%).
4.8 Interim inspections for all children’s homes in year 2016 to 2017
Chart 18: Children’s homes interim inspections judgements 2016 to 2017
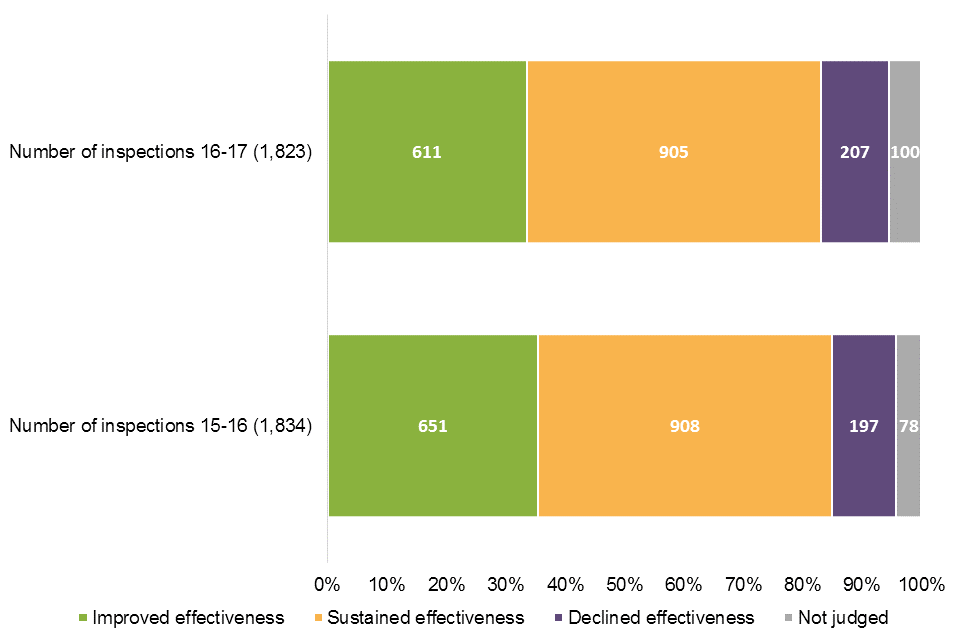
Children’s homes interim inspections judgements 2016-17
Between 1 April 2016 and 31 March 2017, there were 1,823 interim inspections of all types of children’s homes. Half of these resulted in sustained effectiveness judgements, with a third receiving an improved effectiveness judgement. One hundred (5%) interim inspections did not result in an inspection judgement as no children were being cared for at the time of the inspection.
Chart 19: Interim inspections judgements compared with subsequent full inspection
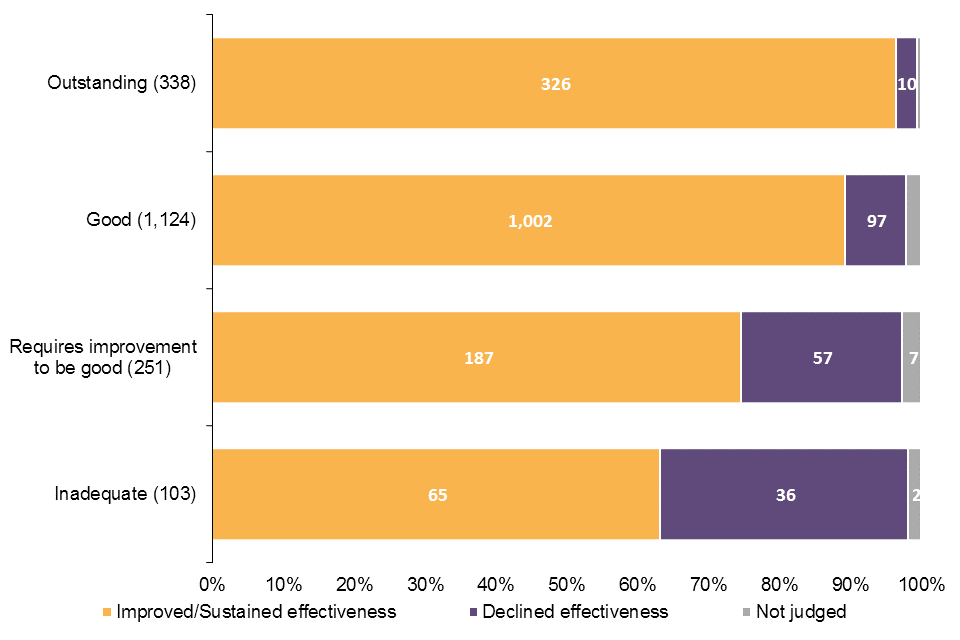
Interim inspections judgements compared to subsequent full inspection
The majority of homes, regardless of their eventual full inspection grade, were judged to have sustained or improved effectiveness at the preceding interim inspection.
The North East (65%) had by far the highest percentage of interim inspections resulting in improved effectiveness judgements. The region with the next highest percentage was the East Midlands (47%).
The South East and the South West (17% each) had the highest percentage of inspections resulting in a declined effectiveness judgement.
The number of interim inspections will be very different in 2017 to 2018, as might be the judgement profile. Following a change in the regulations, good or outstanding children’s homes not identified as high risk will not routinely receive an interim inspection. All secure children’s homes, however, will still receive 2 inspections in the year, with 1 of them likely to be an interim inspection, regardless of inspection outcomes.
5. Other social care providers
The grade profile of independent fostering agencies as at 31 March 2017 improved from the previous year, with almost 9 out of every 10 agencies judged good or better. The grade profile of voluntary adoption agencies remains very high, but in 2016 to 2017 2 agencies were judged inadequate when there were previously no inadequate voluntary adoption agencies. LAs continue to run the most residential special schools, but there is a continuing trend of LA-run schools closing and the number of schools with academy status increasing. View the underlying data tables.
The number of providers and places offered by social care providers other than children’s homes as at 31 March 2017 is relatively similar to that offered a year earlier. There were, though, some differences:
Residential special schools: a decrease of 8 (5%), to 157, compared with last year, and a decrease of 37 (19%) from 31 March 2012. The number of places (5,336) decreased by 193 (3%) from last year and by 992 (16%) from 31 March 2012.[footnote 9] This decrease in providers and places can be partly attributed to re-registrations as children’s homes, although this is not as prevalent as we had thought it might be (accounting for less than a quarter of residential special school closures in the last 5 years);
Further education colleges with residential accommodation: an increase of 4, to 42, from the previous year. The increase in places was 28% over the last 2 years (4,641 in March 2015 to 5,926 in March 2017);
Residential holiday schemes for disabled children: an increase to 15 schemes; more than a doubling of the number of schemes since 31 March 2015.
Whilst the overall numbers of providers and/or places has not altered greatly compared with the 2016 snapshot, the sector has seen some change in terms of the actual providers. For instance, the increase by 7 in independent fostering agencies was brought about by 25 in-year registrations and 18 de-registrations. Similarly, the increase in boarding schools of 4 was the result of 7 in-year registrations and 3 de-registrations.
The sector profile of social care providers other than children’s homes has remained relatively static, with the exception of residential special schools. As at 31 March 2017, just over two-fifths of all residential special schools were run by LAs (64, down from 79) and about a sixth were academies (26, up from 16). This continues the trend towards fewer LA-run schools and more academies. The proportions of residential special schools run by the private and voluntary sectors were consistent with the previous year.
Chart 20: Other social care providers’ latest Overall effectiveness judgement, as at 31 March 2017

Other social care providers’ latest Overall effectiveness judgement, as at 31 March 2017
The state of the nation picture for these providers is generally very positive indeed, with the exception of secure training centres which were judged requires improvement to be good (2) or inadequate (1) in 2016 to 2017.[footnote 8] The 2016 to 2017 Chief Inspector of Prisons Annual Report also commented on outcomes for secure training centres, highlighting insufficient safety, high levels of violence, and overuse of force to manage children, as well as the impact of staffing shortages and uncertainty about the future. By contrast, 79% of secure children’s homes were judged to be good or better (11) as at 31 March 2017; and 71% of secure children’s homes were judged to be good or better (10) for the Help and protection key judgement.
Four provider types have improved their proportion of good or better provisions in comparison to the state of the nation as at 31 March 2016: 89% of independent fostering agencies (IFAs) were good or better as at 31 March 2017 (85% previously); as were 74% of boarding schools (68% previously); 87% of further education colleges with residential accommodation (82% previously); and 97% of residential family centres (94% previously).
Whilst still high (93%), voluntary adoption agencies had a lower proportion of good or better provision than as at 31 March 2016 (97%). This is due to the fact that 2 agencies were judged to be inadequate during 2016 to 2017 whereas previously there were no inadequate voluntary adoption agencies. One of the agencies was judged to be inadequate at its first inspection, whilst the other declined from good.
Chart 21: Other social care providers’ Overall effectiveness judgements at inspections which took place in 2016 to 2017

Other social care providers’ Overall effectiveness judgements at inspections which took place in 2016-17
With regards to inspections in 2016 to 2017, Ofsted carried out 263 inspections of social care providers other than children’s homes, 133 fewer than in 2015 to 2016.[footnote 7] This was predominantly as a result of a reduction in independent fostering agency inspection activity.
Adoption support agencies are inspected once in every 3 year period, of which 2016 to 2017 was the final year. Seven of the 9 agencies inspected in 2016 to 2017 had been inspected before and, of those, 5 (71%) remained at the same grade (4 remained good and 1 was judged requires improvement to be good having previously been judged to be adequate). All but 1 of the 136 residential special schools inspected in 2016 to 2017 had been inspected before – 91 of these (67%) remained at the same grade, all but 6 of which were good or better. Of the remaining 21 residential special schools active as at 31 March 2017, a further 20 were also inspected in 2016 to 2017 but the reports were not published by 30 April 2017. As such they have not been included in this release.
6. Revisions to previous release
View revised data covering children’s homes from 1 April 2016 to 30 September 2016.
The revision of statistics relating to 1 April 2016 to 30 September 2016 from ‘provisional’ to ‘revised’ status includes outcomes relating to a further 47 inspections. These consist of an additional 39 full inspections, 6 interim inspections, and 2 monitoring inspections of children’s homes, which took place in this period and have been published since 31 October 2016.
Of the additional 39 full inspections, 32 children’s homes received good or better Overall effectiveness judgements and 7 received requires improvement to be good or inadequate.
These additional inspections had no impact on the grade profile presented in the previous provisional data. The grade profile for the 6-month period remained the same.
7. Notes
Ofsted consulted with users in 2014 to seek views on the proposed arrangements for the frequency and content of social care inspection official statistics, which is described in more detail in the accompanying quality and methodology report. Ofsted also has representation at relevant meetings and forums to seek feedback about whether our publications meet user needs, which include regional meetings of performance leads from LAs. Ofsted’s participation helps inform about user views, and suggested improvements are taken on board. Ofsted also engages with other organisations including the Department for Education (DfE) and representations from the private and voluntary sectors.
An explanation about key uses of this data, and further contextual information and the arrangements for quality assurance are provided in the accompanying quality and methodology report.
Ofsted also publishes data for all remits, including social care, on the Data View tool.
8. Glossary
For a full definition of the terms above, please see the Glossary tab within the underlying data tables.
9. Further information
Contact for comments or feedback
If you have any comments or feedback on this publication, please contact the Social Care Data Team on 03000 130020 or socialcaredata@ofsted.gov.uk.
Acknowledgements
Thanks to the following for their contribution to this statistical release: Jeremy Honeywill, Emily Moreton, and Rich Jones.
-
A recently published research study by the University of Manchester also found that more than 50% of children referred to children’s services in 2010 to 2011 were re-referred within the next 5 years, and that this was particularly an issue in LAs where social workers held high caseloads (more than 10 children in need). Children’s services in England: repeat referrals, 2017. ↩
-
The terminology changed from “adequate” judgements, in LA inspections prior to 2013, to “requires improvement to be good” judgements, from 2013 onwards, in the SIF. ↩
-
It is not always possible to easily distinguish residential special schools registered as children’s homes from children’s homes and as such changes in the numbers of these homes are sometimes the result of updated information rather than new registrations or de-registrations. ↩
-
The difference in the number of newly registered places (joiners) and de-registered places (leavers) from 31 March 2016 to 31 March 2017 does not always match the actual change in the number of places over the year. It is not always possible to easily distinguish residential special schools registered as children’s homes from children’s homes and as such changes in the numbers of places are sometimes the result of updated information rather than new registrations or de-registrations. Secondly, for all provision types in these data, providers who were active at both the start and end period can also change the number of places they have; these are known as steady state places. ↩
-
For all provision types in this data, the change in overall places from 31 March 2016 to 31 March 2017 does not necessarily equal the difference between the number of places in newly registered provisions (joiners) and the number of places in de-registered provisions (leavers). This is because provisions which were active at the start of the period and the end of the period may also have changed the number of places they are registered for/estimated to have. ↩
-
For residential special schools, boarding schools and further education colleges with residential accommodation, the social care inspection looks at the welfare of the child/young person. The education they receive is not part of the social care inspection. View official education statistics on independent schools: inspections and outcomes and maintained schools and academies: inspections and outcomes. ↩
-
2016 to 2017 was the first year of a 3 year inspection period for boarding schools and residential family centres, and the final year of a 3 year inspection period for adoption support agencies, further education colleges with residential accommodation, and voluntary adoption agencies. Independent fostering agencies are inspected under a rolling 3 year programme of inspection. Residential holiday schemes for disabled children, residential special schools, and secure training centres are inspected on an annual basis. ↩