Children in low income families: local area statistics 2014/15 to 2018/19
Updated 30 June 2020
Applies to England, Scotland and Wales

© Crown copyright 2020
This publication is licensed under the terms of the Open Government Licence v3.0 except where otherwise stated. To view this licence, visit nationalarchives.gov.uk/doc/open-government-licence/version/3 or write to the Information Policy Team, The National Archives, Kew, London TW9 4DU, or email: psi@nationalarchives.gov.uk.
Where we have identified any third party copyright information you will need to obtain permission from the copyright holders concerned.
This publication is available at https://www.gov.uk/government/statistics/children-in-low-income-families-local-area-statistics-201415-to-201819/children-in-low-income-families-local-area-statistics-201415-to-201819
The latest release of these statistics can be found in the Children in low income families: local area statistics collection.
This is the first release of these statistics which have replaced DWP’s Children in out-of-work benefit households and HMRC’s Personal Tax Credits: Children in low income families local measure publications.
This is an annual release and the next release will be in Spring 2021.
Feedback and queries about the statistics can be sent by email.
1. Introduction
This release contains experimental Official Statistics on the number (and proportion) of children living in low income families across Great Britain by local area.
These new statistics complement and should be viewed as a companion release to the Households Below Average Income (HBAI) survey on children in low income households which provides National and Regional estimates but not local area estimates. These local area statistics are calibrated to, and thus match, the 3-year average HBAI survey estimates at Region and Country level for Great Britain.
This is the first release of these statistics which have replaced DWP’s Children in out-of-work benefit households and HMRC’s Personal Tax Credits: Children in low income families local measure. The limitations of the former releases have been addressed and the new statistics provide a more coherent picture of children in low income families for both Relative and Absolute measures Before Housing Costs (BHC).
The release covers data for the financial years 2014/15 to 2018/19 and is available for a range of local areas including at:
- Local Authority
- Westminster Parliamentary Constituency
- Ward
- Lower Super Output Area level
2. Main stories
- In 2018/19, there were 2.74 million children living in families in Relative low income and 2.27 million children in Absolute low income across Great Britain; 82% of children were aged under 16 for both measures
- At a local level, the proportion of children aged under 16 living in low income families varies greatly, ranging from 6% to 38% across Local Authorities for Relative Low Income and from 4% to 33% for Absolute Low Income
- Of the 10 Local Authorities with the highest proportion, 7 are in the North West, and the remaining 3 in the North East, West Midlands, and Yorkshire and The Humber respectively. These Local Authorities rank in the top 10 across both Relative and Absolute measures
- Of the 10 Local Authorities with the lowest proportion, the majority are located in the South East with the remaining in London, East Midlands and East of England for both Relative and Absolute measures.
- The proportion of children in low income families increased the most in Isles of Scilly and decreased the most in Nottingham since 2017/18
3. What you need to know
The statistics in this release relate to the number and proportion of children living in low income families by local area across Great Britain. These statistics are a measure of children and cannot be used to obtain the number of low income families.
The statistics complement and are calibrated to DWP’s Households Below Average Income (HBAI) statistics, which contains the headline measures for children in low income households at a National and Regional level, by providing local area statistics. Statistics are calibrated to the 3-year average HBAI Regional and work status aggregates, thus the Great Britain and Region totals in these statistics match equivalent statistics in the 3-year average HBAI statistics.
The Great Britain 2018/19 figure is formed from the HBAI 3-year average from 2016/17 to 2018/19.
DWP has a statutory obligation to publish measures of Absolute and Relative low income, and low income and material deprivation for children under section 4 of the Welfare Reform and Work Act 2016 and this is provided through the annual HBAI and Income Dynamics publications. HBAI is only able to provide estimates of children in low income at National and Regional level, however there is significant demand for local area measures from users such as Local Authorities.
A family must have claimed one or more of Universal Credit, Tax Credits or Housing Benefit at any point in the year to be classed as low income in these statistics. Relative low income measures families in low income in the reference year, whereas Absolute low income measures families in low income based on what low income looked like in 2010/11. Income is Before Housing Costs (BHC) and is equivalised to adjust for family size and composition. See definitions for more information about the terminology used throughout this release.
The statistics relate to activity throughout the financial year. The count of children refers to the age of the child at 31 March of each year.
More detailed breakdowns (including by individual Age of Child, Family Type and Work Status) by low-level geographies (including Westminster Parliamentary Constituency, Ward and Lower Super Output Area) can be found via DWP’s online tabulation tool Stat-Xplore. The statistics released on Stat-Xplore allows users to analyse the number (and proportion) of children in low income families within and across small areas over a 5-year period.
The background information and methodology gives more information on the construction of these statistics.
4. Proportion of children living in low income families
Figures on the proportion of children are presented for children aged under 16.
In 2018/19, there were 2.74 million children in families in Relative low income and 2.27 million children in Absolute low income families across Great Britain. 82% of children were aged under 16 for both Relative and Absolute measures.
At a local level, the proportion of children aged under 16 living in low income families varies greatly, ranging from 6% to 38% across Local Authorities for Relative low income families and from 4% to 33% for Absolute low income families. Figure 1 shows the distribution of the proportion of children across Local Authorities in 2018/19. The majority of Local Authorities have a rate of children in low income families that falls between 10% and 20%.
Over 65% of Local Authorities have a proportion of children in low income families between 10% and 20%.
Figure 1: Proportion of children aged under 16 in Relative and Absolute low income families by number of Local Authorities, 2018/19
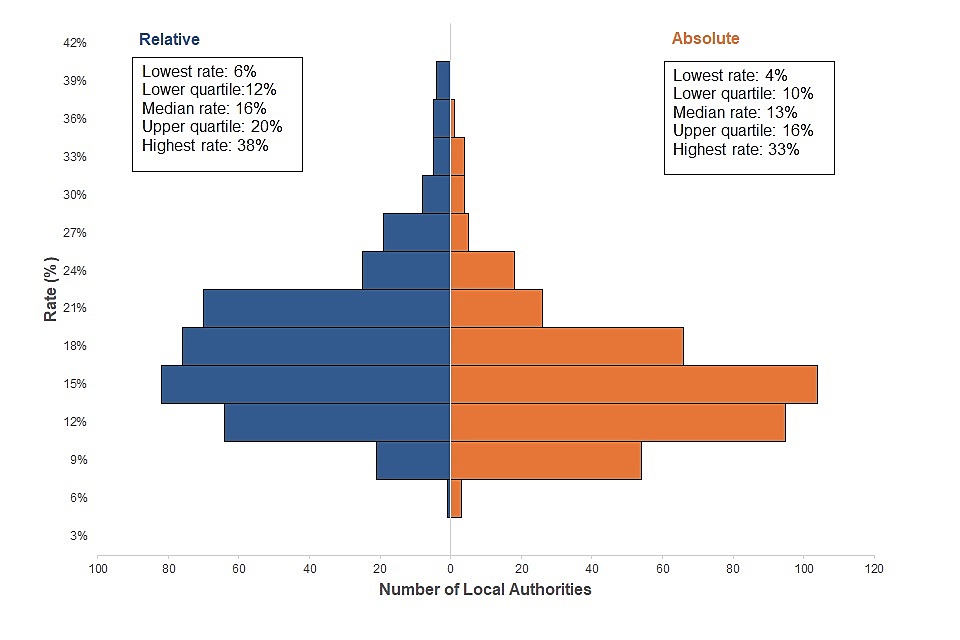
A mirrored histogram showing the proportion of children in Relative and Absolute low income families on the y-axis against the number of Local Authorities on the x-axis for 2018/19. Rates range from 6% to 38% for Relative and 4% to 33% for Absolute
Source: Children in Low Income Families statistics and ONS population estimates.
Figure 1 is based on unrounded percentages. Proportions are calculated by dividing the number of children aged under 16 in a geographical area (for example, a Local Authority), by the population aged under 16 in that geographical area. More information about the calculation of rates can be found in the background information and methodology.
For Relative low income families, only 4% of Local Authorities across Great Britain have a rate over 30%. For Absolute low income families, only 1% of Local Authorities have a rate over 30%. Figure 2 shows a map of the proportion of children aged under 16 in Relative and Absolute low income families by Local Authority in 2018/19. The darker areas show the Local Authorities containing the highest proportions of children living in low income families.
There are clusters of Local Authorities in the North West with higher proportions of children in low income families.
Figure 2: Proportion of children aged under 16 in Relative and Absolute low income families by Local Authority (quintiles), Great Britain, 2018/19
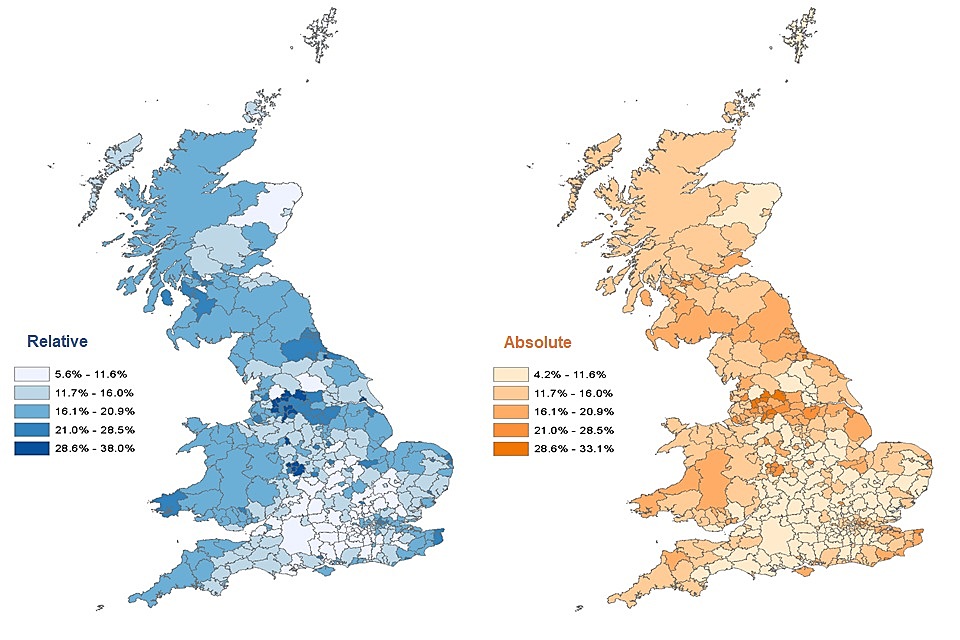
Relative and Absolute choropleth maps showing the proportion of children in low income families, banded by quintiles, in Great Britain by Local Authority. Darker shaded areas are more prominent in the North West indicating higher proportions.
Source: Children in Low Income Families statistics and ONS population estimates.
Notes about Figure 2:
- Data is banded using quintiles. This means group ranges are calculated to split Local Authorities evenly, so 20% of Local Authorities fit into each group.
- The bottom quintile (lightest shade) shows the group of Local Authorities which have the lowest rates of children in low income families. The top quintile (darkest shade) shows the group of areas which have the highest rates.
- The map legends show the highest and lowest rate for Relative and Absolute measures but bandings are based on Relative quintiles.
- Rates have been calculated using the mid-2018 population estimates as, at the time of release, this was the latest data available.
The maps show that areas with the highest and lowest rates are similar for Relative and Absolute low income measures. There are clusters of darker shaded areas in the North West indicating there are higher proportions of children living in low income families in Local Authorities within this region. Areas with the lowest proportions are represented by lighter shades, as is shown in Local Authorities towards the South East.
5. Areas with the highest and lowest proportions of children in low income families
Figures 3 and 4 show the 20 Local Authorities with the highest and lowest proportions of children under 16 in Relative and Absolute low income families in 2018/19. Oldham was the Local Authority with the highest proportions for both Relative and Absolute measures at 38% and 33% respectively. In contrast, City of London had the lowest proportion of children under 16 in low income families in 2018/19 (6% in Relative and 4% in Absolute).
The proportion of children in Relative low income families was highest in Oldham (38%) and lowest in City of London (6%).
Figure 3: The 20 Local Authorities with the highest and lowest proportions of children under 16 in Relative low income families, 2018/19
| Local Authority | Highest (%) | Local Authority | Lowest (%) |
|---|---|---|---|
| Oldham | 38% | City of London | 6% |
| Pendle | 37% | Elmbridge | 6% |
| Middlesbrough | 37% | Richmond upon Thames | 6% |
| Blackburn with Darwen | 37% | Hart | 7% |
| Bradford | 35% | Epsom and Ewell | 7% |
| Birmingham | 34% | Rushcliffe | 7% |
| Manchester | 34% | Waverley | 8% |
| Hyndburn | 33% | Wokingham | 8% |
| Burnley | 33% | East Hertfordshire | 8% |
| Bolton | 32% | South Northamptonshire | 8% |
| Sandwell | 32% | Kensington and Chelsea | 8% |
| Stoke-on-Trent | 32% | Mid Sussex | 8% |
| Kingston upon Hull, City of | 31% | St Albans | 8% |
| Rochdale | 30% | Guildford | 8% |
| Walsall | 29% | Windsor and Maidenhead | 8% |
| Wolverhampton | 29% | Rutland | 8% |
| Luton | 29% | Mole Valley | 9% |
| Newcastle upon Tyne | 28% | South Bucks | 9% |
| Glasgow City | 28% | Surrey Heath | 9% |
| Liverpool | 28% | South Cambridgeshire | 9% |
Source: Children in Low Income Families statistics and ONS population estimates.
Pendle had the second highest proportion of children under 16 in Relative low income families, followed by Middlesbrough. For Local Authorities with the lowest proportions, Elmbridge was the second lowest followed by Richmond upon Thames.
The proportion of children in Absolute low income families was highest in Oldham (33%) and lowest in City of London (4%).
Figure 4: The 20 Local Authorities with the highest and lowest proportions of children under 16 in Absolute low income families, 2018/19
| Local Authority | Highest (%) | Local Authority | Lowest (%) |
|---|---|---|---|
| Oldham | 33% | City of London | 4% |
| Pendle | 33% | Richmond upon Thames | 5% |
| Blackburn with Darwen | 31% | Elmbridge | 5% |
| Bradford | 30% | Rushcliffe | 6% |
| Middlesbrough | 30% | East Hertfordshire | 6% |
| Hyndburn | 29% | Epsom and Ewell | 6% |
| Manchester | 29% | Hart | 6% |
| Burnley | 29% | Kensington and Chelsea | 6% |
| Bolton | 28% | St Albans | 6% |
| Birmingham | 27% | Waverley | 7% |
| Kingston upon Hull, City of | 26% | Wokingham | 7% |
| Rochdale | 26% | South Northamptonshire | 7% |
| Stoke-on-Trent | 25% | Rutland | 7% |
| Sandwell | 25% | Mid Sussex | 7% |
| Liverpool | 24% | Three Rivers | 7% |
| Wolverhampton | 23% | Cotswold | 7% |
| Newcastle upon Tyne | 23% | South Cambridgeshire | 7% |
| Walsall | 23% | Guildford | 7% |
| Glasgow City | 23% | Windsor and Maidenhead | 7% |
| Kirklees | 23% | Surrey Heath | 8% |
Source: Children in Low Income Families statistics and ONS population estimates.
Percentages in Figures 3 and 4 are based on unrounded figures. Rates have been calculated using the mid-2018 population estimates as, at the time of release, this was the latest data available.
Similar to Relative low income families, Pendle had the second highest proportion of children under 16 in Absolute low income families, followed by Blackburn with Darwen. For Local Authorities with the lowest proportions, Richmond upon Thames was the second lowest followed by Elmbridge.
With the exception of Luton and Kirklees, Local Authorities rank in the top 20 highest proportions across both Relative and Absolute measures. The local areas with the lowest proportions shows a similar story with 18 out of the top 20 Local Authorities ranking in the Relative and Absolute top 20.
9 out of the top 20 Local Authorities with the highest proportions of children under 16 in Relative and Absolute low income families were in the North West.
11 out of the top 20 Local Authorities with the lowest proportions of children under 16 in Relative low income families and 9 out of 20 for Absolute were in the South East.
Figures 5 and 6 show the 20 Local Authorities where the proportion of children living in low income families has increased or decreased the most, based on percentage point difference, since the previous year.
The proportion of children in Relative low income families increased the most in Isles of Scilly and decreased the most in Nottingham since the previous year.
Figure 5: The 20 Local Authorities with the largest percentage point changes in the proportion of children under 16 in Relative low income families since the previous year, 2018/19
| Local Authority | Increase since previous year (percentage points) | Local Authority | Decrease since previous year (percentage points) |
|---|---|---|---|
| Isles of Scilly | 4pp | Nottingham | -5pp |
| Middlesbrough | 3pp | Leicester | -4pp |
| Ryedale | 3pp | Derby | -4pp |
| Kirklees | 2pp | Lincoln | -4pp |
| Bradford | 2pp | Mansfield | -3pp |
| Craven | 2pp | Wellingborough | -3pp |
| Calderdale | 2pp | Ashfield | -3pp |
| South Lakeland | 2pp | Chesterfield | -3pp |
| Rother | 2pp | Boston | -3pp |
| Hambleton | 2pp | Corby | -3pp |
| Torridge | 1pp | South Holland | -3pp |
| Harrow | 1pp | Northampton | -3pp |
| Barnsley | 1pp | East Lindsey | -3pp |
| Newcastle upon Tyne | 1pp | Kettering | -2pp |
| Gateshead | 1pp | Gedling | -2pp |
| Runnymede | 1pp | West Lindsey | -2pp |
| North Lincolnshire | 1pp | Charnwood | -2pp |
| Wyre Forest | 1pp | Bolsover | -2pp |
| Swale | 1pp | Erewash | -2pp |
| Leeds | 1pp | East Northamptonshire | -2pp |
Source: Children in Low Income Families statistics and ONS population estimates.
The proportion of children in Absolute low income families increased the most in Isles of Scilly and decreased the most in Nottingham since the previous year.
Figure 6: The 20 Local Authorities with the largest percentage point changes in the proportion of children under 16 in Absolute low income families since the previous year, 2018/19
| Local Authority | Increase since previous year (percentage points) | Local Authority | Decrease since previous year (percentage points) |
|---|---|---|---|
| Isles of Scilly | 7pp | Nottingham | -5pp |
| Middlesbrough | 3pp | Leicester | -4pp |
| Kirklees | 3pp | Derby | -3pp |
| Bradford | 2pp | Lincoln | -3pp |
| Ryedale | 2pp | Ashfield | -3pp |
| Craven | 2pp | Boston | -3pp |
| Calderdale | 2pp | Corby | -3pp |
| Newcastle upon Tyne | 2pp | Wellingborough | -3pp |
| Hyndburn | 2pp | Mansfield | -3pp |
| South Lakeland | 2pp | Chesterfield | -3pp |
| Wyre Forest | 2pp | East Lindsey | -3pp |
| Richmondshire | 2pp | South Holland | -2pp |
| Rother | 1pp | Bassetlaw | -2pp |
| Barnsley | 1pp | Northampton | -2pp |
| Torridge | 1pp | North East Derbyshire | -2pp |
| Swale | 1pp | Gedling | -2pp |
| North Lincolnshire | 1pp | Broxtowe | -2pp |
| Doncaster | 1pp | High Peak | -2pp |
| Hambleton | 1pp | Charnwood | -2pp |
| Runnymede | 1pp | Purbeck | -2pp |
Source: Children in Low Income Families statistics and ONS population estimates.
Figures 5 and 6 are based on unrounded figures and are calculated as the percentage point difference in the proportion of children in low income families between 2017/18 and 2018/19.
In 2018/19, Isles of Scilly had the largest increase in the proportion of children living in low income families. Although Isles of Scilly had the largest increase out of all Local Authorities, the proportion of children in low income families is relatively low in comparison to other areas; 12% Relative and 13% Absolute in the latest year.
Middlesbrough had the second largest increase, rising by 3 percentage points over the year for both measures. Over the last 5 years, Middlesbrough had the largest increase for Relative low income families with a rate of 23% in 2014/15 to 37% in the latest year; an increase of 13 percentage points. As shown in Figures 3 and 4, Middlesbrough ranked in the top 5 Local Authorities with the highest proportions of children in Relative and Absolute low income families.
Of the Local Authorities with the largest increases since the previous year, 16 rank in both the Relative and Absolute top 20.
In contrast, Nottingham had the largest decrease in the proportion of children living in low income families in 2018/19 since the previous year; a decrease of 5 percentage points for both Relative and Absolute measures.
Leicester had the second largest Relative and Absolute decrease, falling by 4 percentage points to 27% Relative and 22% Absolute since the previous year. In 2018/19, Leicester ranked outside of the top 20 Local Authorities with the highest proportions of children in low income families but was the highest ranking Local Authority in 2015/16 for both Relative and Absolute measures.
Of the Local Authorities with the largest increases since the previous year, 15 rank in both the Relative and Absolute top 20.
Figures on rates by Local Authority and Ward can be found as a 5 year timeseries via supporting data tables.
6. Family Type and Work Status
The published statistics on Stat-Xplore allow users to tabulate trends over time by family type and work status. Figures 7 and 8 illustrate the type of analyses this supports.
There were more children in couple low income families across all regions.
Figure 7: The number of children (aged 0-19) in Relative and Absolute low income families, Region, Family Type, 2018/19
| Relative | Absolute | |||||
|---|---|---|---|---|---|---|
| Region | Lone parent | Couple | Total | Lone Parent | Couple | Total |
| North East | 66,000 | 69,000 | 135,000 | 51,000 | 59,000 | 111,000 |
| North West | 161,000 | 227,000 | 388,000 | 135,000 | 200,000 | 335,000 |
| Yorkshire and The Humber | 115,000 | 180,000 | 295,000 | 98,000 | 160,000 | 258,000 |
| East Midlands | 75,000 | 105,000 | 180,000 | 57,000 | 91,000 | 148,000 |
| West Midlands | 125,000 | 210,000 | 335,000 | 98,000 | 169,000 | 266,000 |
| East of England | 90,000 | 135,000 | 225,000 | 68,000 | 110,000 | 178,000 |
| London | 161,000 | 240,000 | 401,000 | 127,000 | 196,000 | 323,000 |
| South East | 127,000 | 165,000 | 293,000 | 109,000 | 146,000 | 256,000 |
| South West | 65,000 | 98,000 | 163,000 | 52,000 | 84,000 | 136,000 |
| Wales | 54,000 | 71,000 | 125,000 | 42,000 | 58,000 | 100,000 |
| Scotland | 99,000 | 100,000 | 198,000 | 78,000 | 86,000 | 164,000 |
Source: Children in Low Income Families statistics.
Totals shown in Figure 7 may not sum due to rounding
For all regions across Great Britain, there were fewer children in low income families where the family type was lone parent for both Relative and Absolute measures. Figure 7 shows some regional variation in 2018/19, for example over two thirds of all children in Relative low income families in the West Midlands are in couple families, whereas the family type split is almost even in the North East, i.e. of the 135,000 children in Relative low income families in the North East, 49% were in lone parent families compared to 51% in couple families.
There were more children in working low income families across all regions.
Figure 8: The number of children (aged 0-19) in Relative and Absolute low income families, Region, Work Status, 2018/19
| Relative | Absolute | |||||
|---|---|---|---|---|---|---|
| Region | In working families | Not in working families | Total | In working families | Not in working families | Total |
| North East | 78,000 | 57,000 | 135,000 | 64,000 | 47,000 | 111,000 |
| North West | 256,000 | 132,000 | 388,000 | 218,000 | 117,000 | 335,000 |
| Yorkshire and The Humber | 195,000 | 99,000 | 295,000 | 170,000 | 88,000 | 258,000 |
| East Midlands | 119,000 | 60,000 | 180,000 | 103,000 | 45,000 | 148,000 |
| West Midlands | 231,000 | 103,000 | 335,000 | 176,000 | 90,000 | 266,000 |
| East of England | 168,000 | 57,000 | 225,000 | 131,000 | 47,000 | 178,000 |
| London | 302,000 | 99,000 | 401,000 | 238,000 | 85,000 | 323,000 |
| South East | 204,000 | 89,000 | 293,000 | 175,000 | 80,000 | 256,000 |
| South West | 118,000 | 45,000 | 163,000 | 98,000 | 38,000 | 136,000 |
| Wales | 81,000 | 44,000 | 125,000 | 62,000 | 38,000 | 100,000 |
| Scotland | 127,000 | 71,000 | 198,000 | 106,000 | 58,000 | 164,000 |
Source: Children in Low Income Families statistics.
Totals shown in Figure 8 may not sum due to rounding
Figure 8 shows that for both Relative and Absolute measures, more children were in working low income families than in low income families who were not working across Great Britain in 2018/19. With the exception of the North East, over two thirds of all children in Relative and Absolute low income within each region were in working low income families. 58% of all children in low income families in the North East were in working low income families across both measures.
These statistics provide a count of the number of children in low income families by family type and work status. They do not provide information on the proportion of children in low income by family type and work status. More information on these can be found in the HBAI release.
More detailed statistics are available on Stat-Xplore which allows users to produce bespoke tabulations showing local area analyses by a range of breakdowns over time.
7. About these statistics
Figures for the latest year (2018/19) are provisional and subject to revision in subsequent releases. The statistics in this release are not directly comparable to the former DWP (children in out-of-work benefit households) or HMRC (children in low income families local measure) releases. Whilst they complement the statistics released in the Households Below Average Income (HBAI) publication, please note that they are produced from an entirely different data source with some differences in methodology, for example HBAI considers household incomes whereas these statistics cover family incomes (multiple families may live in the same household).
Definitions
| Term | Definition |
|---|---|
| Children | Dependent individuals aged under 16; or aged 16 to 19 in full-time non-advanced education. Figures on the proportion of children living in low income families are derived for children under 16 as a percentage of the under 16 population. |
| Family | A single adult; or a married or cohabitating couple; or a Civil Partnership; and any dependent children. |
| Equivalised income | Income is gross income Before Housing Costs (BHC) and includes contributions from earnings, state support and pensions. Equivalisation adjusts incomes for family size and composition; taking an adult couple with no children as the reference point. |
| Relative low income | A family in low income Before Housing Costs (BHC) in the reference year. A family must have claimed one or more of Universal Credit, Tax Credits or Housing Benefit at any point in the year to be classed as low income in these statistics. |
| Absolute low income | A family in low income Before Housing Costs (BHC) in the reference year in comparison with incomes in 2010/11. A family must have claimed one or more of Universal Credit, Tax Credits or Housing Benefit at any point in the year to be classed as low income in these statistics. |
| Work status | A family is defined as ‘in-work’ if they have an accumulated period of at least 26 weeks paid employment or self-employment within the 52-week tax year. |
| Family type | Family type accounts for changes in family composition throughout the year (for example, re-partnering, multiple partners). A Lone Parent family type means the parent/guardian has had no partnerships at any point in the year. |
Rounding policy
Numbers over 1 million are rounded to the nearest 10,000. Numbers less than 1 million are rounded to the nearest 1,000. Percentages are rounded to the nearest whole number, with the exception of the maps which are shown to 1 decimal place. Unrounded figures can be obtained from Stat-Xplore.
Where to find out more
This statistical summary gives an overview of the key points and trends. More detailed breakdowns can be found via the supporting data tables or DWP’s online tabulation tool Stat-Xplore.
The statistics within this release have been primarily sourced from the DWP RAPID (Registration and Population Interaction Database) longitudinal dataset which provides a single coherent view of citizen interactions with DWP and HMRC within the tax year. The background information and methodology provides a fuller explanation on the purpose, coverage, construction, sources and limitations of the statistics.
Experimental statistics
These statistics are experimental Official Statistics, badged as provisional (for the latest year) and are subject to revision in future releases. Experimental statistics are official statistics which are published in order to involve users and stakeholders in the assessment of their suitability and quality at an early stage, in compliance with the UK Statistics Authority’s Code of Practice for Statistics.
Contact information and feedback
DWP would like to hear your views on these statistics. We would be interested in hearing what you use them for and how well they meet your requirements as well as interest in extending the analyses to Working and Pension Age claimants. Feedback and queries about the statistics can be sent via email.
Press enquiries should be directed to the DWP Press Office: 020 3267 5144
Lead Statisticians: Luke Stockham and Katie Wong
8. Related statistics
DWP Households Below Average Income (HBAI)
DWP Children in out of work benefit households
HMRC Personal Tax Credits: Children in low income families
ONS working and workless households
English Indices of Deprivation
Welsh Index of Multiple Deprivation
Scottish Index of Multiple Deprivation
ISBN: 978-1-78659-216-3