Childcare providers and inspections key findings as at 31 August 2016
Updated 26 August 2021

© Crown copyright 2021
This publication is licensed under the terms of the Open Government Licence v3.0 except where otherwise stated. To view this licence, visit nationalarchives.gov.uk/doc/open-government-licence/version/3 or write to the Information Policy Team, The National Archives, Kew, London TW9 4DU, or email: psi@nationalarchives.gov.uk.
Where we have identified any third party copyright information you will need to obtain permission from the copyright holders concerned.
This publication is available at https://www.gov.uk/government/statistics/childcare-providers-and-inspections-as-at-31-august-2016/childcare-providers-and-inspections-key-findings-as-at-31-august-2016
This release contains:
- the numbers of registered childcare providers, places and most recent inspection outcomes as at 31 August 2016
- movement in the childcare sector between 31 March 2016 and 31 August 2016
- provisional data for inspections completed between 1 April 2016 and 31 August 2016
- revised data for inspections completed between 1 January 2016 and 31 March 2016
The proportion of providers on the Early Years Register (EYR) judged good or outstanding is at its highest ever
As at 31 August 2016, the proportion of providers on the EYR judged to be good or outstanding was 91%. This is up from 86% as at 31 March 2016 and up from 74% since 31 August 2012 (Chart 1).
The number of places offered by childcare providers on the EYR has decreased slightly
The number of childcare places offered by non-domestic providers on the EYR has shown little change since 31 March 2016, while the number of childminder places has decreased by 1%. Since 31 August 2012, the number of places offered by non-domestic providers has remained relatively stable, however, childminder places have decreased by 9%.
The number of childminders registered with Ofsted has continued to decrease
Since 31 March 2016, the number of childminders registered with Ofsted either on the EYR or the Childcare Register (CR) has decreased by 3%, while the number of non-domestic providers has decreased by less than 1%.
Since 31 August 2012, the number of childminders has decreased by more than a fifth (22%).
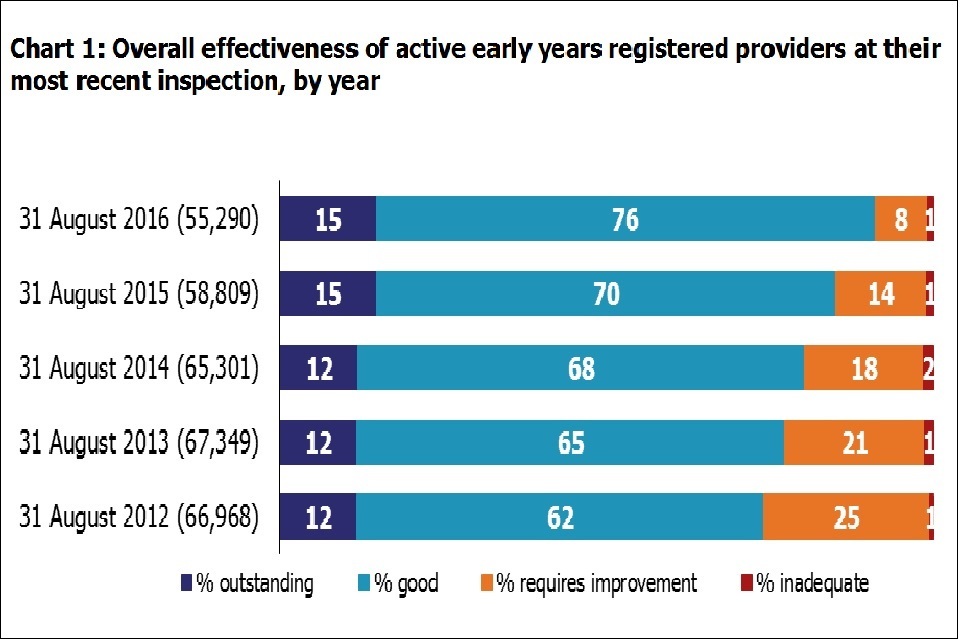
Chart 1: Overall effectiveness of active early years registered providers at their most recent inspection, by year
1. Number of providers
There were 82,696 childcare providers registered with Ofsted as at 31 August 2016. This is a decrease of 2.7% since 31 March 2016. The number of childminders has fallen by 3.5% (1,601) and the number of providers of childcare on non-domestic premises has fallen by 0.9% (246).
Under the Childcare Act 2006, childcare providers register on either or both of 2 registers: the Early Years Register and the Childcare Register. See the glossary for further details.
Since 31 August 2012, the number of childminders has decreased by more than a fifth (22%) from 57,400 to 44,700 (to the nearest 100 providers). By contrast, the number of providers on non-domestic premises has decreased more modestly, falling by 3.5% since August 2012, from 27,800 to 26,900 (Chart 2).
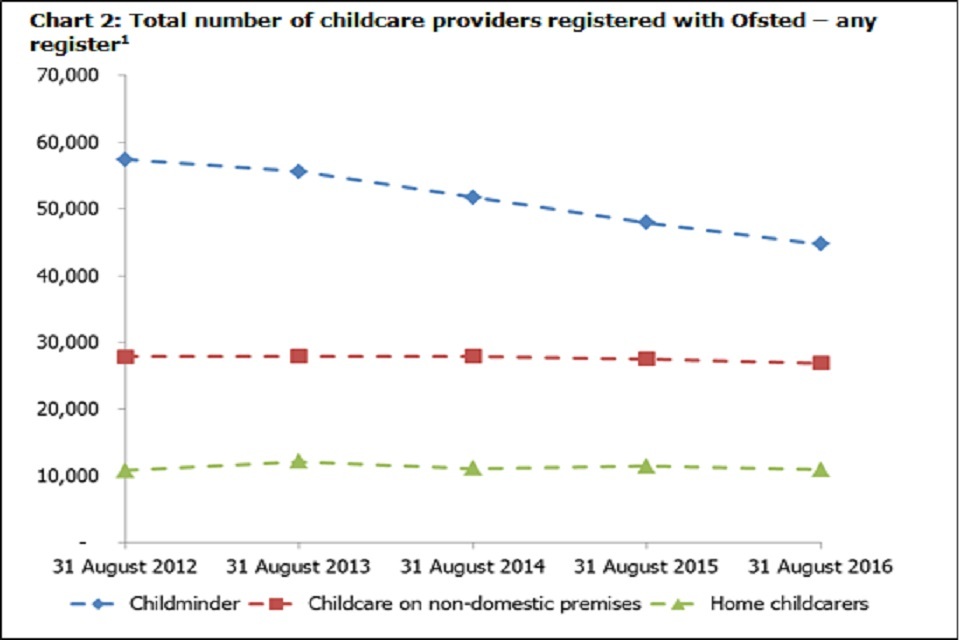
Chart 2: Total number of childcare providers registered with Ofsted – any register
The decrease in the number of childminders registered with Ofsted over time is considerable. However, we don’t know all of the reasons for this and it is likely to be due to a combination of factors. Childminders can now register with childminder agencies rather than register directly with Ofsted, which means that we cannot report on their individual registrations. However, only 8 childminder agencies were active as at the end of August 2016, therefore the effect of this is likely to be minimal.
For non-domestic providers, a legislation change in May 2015 means that schools are no longer required to register their early years provision for 2-year-olds with Ofsted. This could account for some of the decrease in the number of non-domestic providers.
2. Providers and places on the Early Years Register
As at 31 August 2016, 81% of all registered providers were on the Early Years Register (EYR). These providers care for children in the early years age range, from birth to 31 August following their fifth birthday. Data on places are only collected for providers registered on the Early Years Register (EYR). This is the same proportion as at 31 March 2016.
Some 80% of childcare places on the EYR were offered by childcare on non-domestic premises, with over 1 million places. The remaining 20% were offered by childminders (257,500 places) with less than 1% offered by childcare on domestic premises. Percentages do not sum to 100 due to rounding. This was a small shift since 31 August 2012, when a slightly lower proportion of places were offered by non-domestic providers (78%), and childminders offered over a fifth (22%).
Despite the decrease in the number of providers, the total number of places offered as at 31 August 2016 has shown a modest decline of 0.3% since 31 March 2016. This is a continuation of a longer-term trend of a 2.5% decline in places since 31 August 2012. However, this was different for different types of early years provider: The number of places offered by childminders has decreased 9% compared with a relatively modest decrease of 0.8% of places offered by childcare on non-domestic premises.
Since May 2015, schools have been exempt from registering their early years provision for 2-year-olds. Therefore, some schools continue to provide early years provision but are no longer registered with Ofsted. This legislative change means that Ofsted is not able to report on the total number of early years places available nationally, as only places on the EYR are included in Ofsted data.
3. Inspection outcomes of providers on the Early Years Register
Ofsted had inspected 82% of active providers on the Early Years Register (EYR) as at 31 August 2016. This included 85% of providers of childcare on non-domestic premises and 81% of childminders. Providers joining the EYR are inspected within 30 months of registration. Please see ‘Being inspected as a childcare provider or childminder’ for more information on the process of being inspected. Therefore, the childminders and childcare providers on non-domestic premises that remain to be inspected are mainly providers that have joined the sector within the last 30 months.
As at 31 August 2012, nearly 3 quarters of active providers were judged to be good or outstanding. However, as at 31 August 2016, of the 55,300 active providers that had been inspected by Ofsted, 91% were judged good or outstanding. This is the highest ever level. This is a substantial increase from 2012, and is a marked increase from the figure of 86% as at the end of March 2016.
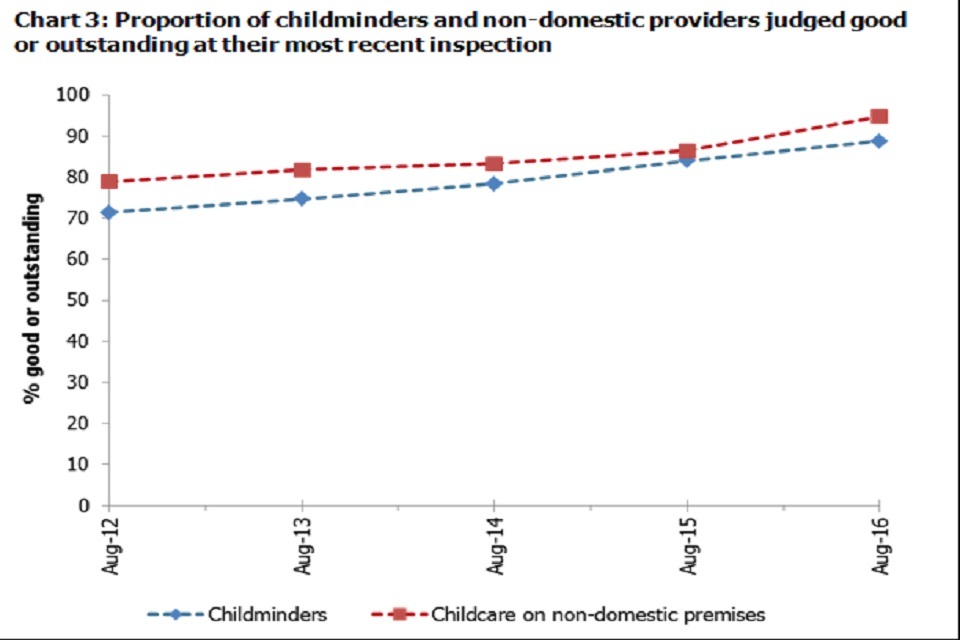
Chart 3: Proportion of childminders and non-domestic providers judged good or outstanding at their most recent inspection
The proportion of active providers judged good or outstanding has increased for both childminders and childcare on non-domestic premises (Chart 3). As has been the case since 31 August 2012, the proportion of providers judged good or outstanding at their most recent inspection was higher for non-domestic providers (95%) than for childminders (89%). However, the difference between these 2 provider types, while wider than at the end of August 2015, has decreased from 7 percentage points as at 31 March 2016 to 6 percentage points as at 31 August 2016.
The difference in the proportion of childminders and non-domestic childcare providers judged good or outstanding is due in part to a difference in the inspection policy between the 2 types of providers. From 4 November 2013, childcare on non-domestic premises judged requires improvement must be re-inspected within 12 months, whereas this is not the case for childminders. See announcement of update in early years inspection policy from Her Majesty’s Chief Inspector in August 2013. This means that non-domestic providers will have more opportunity to demonstrate improvement than childminders.
4. Childminder agencies
Childminder agencies were introduced in September 2014; childminders can now register with childminder agencies that are registered with Ofsted, rather than registering with Ofsted directly.
As at 31 August 2016, 8 active childminder agencies were registered with Ofsted. One of these has been inspected and was judged as ‘effective’.
Childminder agencies data is available on the provider level data file on the Official Statistics releases page as at 31 August 2016.
5. Regional and local authority area inspection outcomes of providers on the Early Years Register
All regions demonstrated improvement in the proportion of childcare providers judged good or outstanding since 31 March 2016, improving between 1 percentage point (in North East) and 7 percentage points (in London). Similarly, childminders demonstrated improvement in all regions, with the proportions judged good or outstanding rising 4 percentage points (in East of England) and 8 percentage points (in North East).
In all regions in England, both childcare on non-domestic premises and childminders demonstrated their highest recorded proportions of providers judged good or outstanding (Chart 4). London had the largest difference (9 percentage points) between proportions of childcare on non-domestic premises judged good or outstanding compared with childminders judged good or outstanding, with South West having the smallest difference (3 percentage points).
For the most recent inspection of active providers of childcare on non-domestic premises as at 31 August 2016:
- North East continued to have the highest proportion (97%) of providers judged good or outstanding for overall effectiveness
- London showed the largest improvement of all the regions. As at 31 March 2016, London had 87% judged good or outstanding, rising up to 94% at the end of August 2016
For the most recent inspection of active childminders as at 31 August 2016:
- South West continued to have the highest proportion (93%) of childminders judged good or outstanding for overall effectiveness, rising markedly from 86% as at 31 March 2016
- South East had also risen considerably, from 86% in March to 91% in August 2016
- London continued to have the lowest proportion (85%) of childminders judged good or outstanding, despite improving by 5 percentage points since 31 March 2016
- West Midlands and East Midlands showed the largest improvement of 7 percentage points to 88%
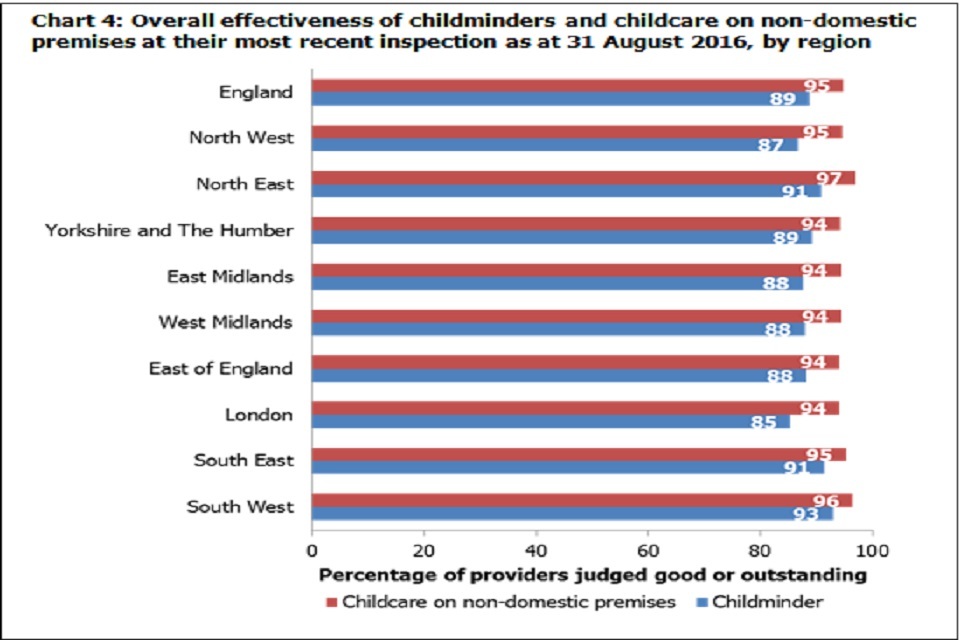
Chart 4: Overall effectiveness of childminders and childcare on non-domestic premises at their most recent inspection as at 31 August 2016, by region
6. Notes
An explanation about key uses of this data, further contextual information and the arrangements for quality assurance is provided in the methodology and quality report under the heading Childcare providers and inspections as at 31 August 2016.
The methodology and quality report also provides information on the strengths and limitations of the statistics.
6.1 Revisions to previous release
The provisional data in the previous release related to inspections between 1 January 2016 and 31 March 2016, published as at 30 April 2016. A revised list of inspections in this period is provided in the data for this publication in Tables 14-19, which include inspections that were published as at 30 September 2016.
These revisions did not result in any changes to the key findings identified in the previous publication.
Revisions to data in this publication are published in line with Ofsted’s revisions policy for official statistics.
6.2 Common inspection framework (CIF)
Inspections from 1 September 2015 were carried out under the common inspection framework (CIF), such that the inspection judgements are common across the early years, schools and further education and skills remits. Ofsted evaluates the overall quality and standards of the early years provision in line with the principles and requirements of the EYFS. Inspectors judge the overall effectiveness of the early years provision, taking into account 4 key judgements:
- quality of teaching, learning and assessment
- personal development, behaviour and welfare
- effectiveness of leadership and management
- outcomes for children
Ofsted was required to inspect all providers that were on the Early Years Register (EYR) on 1 September 2012 at least once by 31 July 2016. Providers that have registered after this date will normally be inspected within 30 months of registration.
6.3 Further information
Ofsted publishes the following information on the inspection of early years providers:
- early years and childcare statistics
- common inspection framework: education skills and early years from September 2015
- regulation of services on Childcare Register
Contact for comments or feedback If you have any comments or feedback on this publication, please contact Selina Gibb on 03000 130 407 or Selina.Gibb@ofsted.gov.uk