Audit report
Published 24 October 2019

© Crown copyright 2019
This publication is licensed under the terms of the Open Government Licence v3.0 except where otherwise stated. To view this licence, visit nationalarchives.gov.uk/doc/open-government-licence/version/3 or write to the Information Policy Team, The National Archives, Kew, London TW9 4DU, or email: psi@nationalarchives.gov.uk.
Where we have identified any third party copyright information you will need to obtain permission from the copyright holders concerned.
This publication is available at https://www.gov.uk/government/publications/cervical-screening-invasive-cervical-cancer-audit-2013-to-2016/audit-report
1. The audit
The NHS Cervical Screening Programme (NHS CSP) aims to reduce the incidence of, and mortality from, invasive cervical cancer. It does this by regularly screening all people at risk, so that abnormalities that might otherwise develop into invasive cancer can be identified and treated. We use the term ‘people’ to include women and anyone with a cervix.
Unfortunately, despite the effectiveness of population-based screening, people continue to develop cervical cancer [footnote 1]. Purely monitoring changes in cervical cancer incidence and mortality rates can help to determine whether the programme is achieving its objectives. However this alone does not give a complete picture because it cannot assess whether alterations to the programme (for example, changes to the screening technologies employed, to the age range over which people are called for testing, or to the frequency of screening at different ages) are affecting the incidence of cervical cancer. Nor does it indicate the effectiveness of the screening programme under optimal conditions, for example if everyone attended when invited or the benefit of screening individuals who have never had a test. Audit of all cases of cervical cancer along with those people’s interactions with the screening programme and comparing them with people who do not develop cervical cancer is therefore essential.
The main purpose of the NHS CSP audit of invasive cervical cancer (hereafter ‘the audit’) is to:
- monitor the effectiveness of the cervical screening programme by comparing the screening histories of people who develop cervical cancer with those who do not
- identify areas of good practice and indicate where improvements might be made to support evidence-based policy and practice
- support the continuous learning and development of health professionals involved in the programme
For information to be reported consistently, all parties in the cervical screening programme follow the same national protocol for auditing cases of invasive cervical cancer [footnote 1].
All diagnosed cases of cervical cancer in England are included in the audit. Data are collected by financial year, which runs from 1 April to 31 March. There are currently 4 published national reports covering cases diagnosed from April 2007 to March 2013.
This, the fifth report, contains data for the 3 year period from 1 April 2013 to 31 March 2016 (financial years 2013 to 2014, 2014 to 2015, 2015 to 2016). Due to the reorganisation of the Screening Quality Assurance Service (SQAS) into 4 larger regional areas, results are no longer be presented by the 8 old quality assurance regions. Several tables shown in previous reports are not included or have been changed and thus it is not possible to directly map all the tables in this report to previous national audit publications.
This report prioritises timeliness over data completeness. We include cases for which not all details have yet been recorded within the audit. Readers should take note of the caveats attached to this approach.
Summary details of the audit methodology are available to read alongside this report, and the full national audit guidance is also available.
Lead authors
Professor Peter Sasieni: Academic Director of King’s Clinical Trials Unit and Professor of Cancer Prevention, King’s College London.
Dr Alejandra Castanon: Epidemiologist, King’s College London.
2. Background
Cervical cancer is a malignant neoplasm of the cervix uteri. In 2015, 2,517 cases were registered in England, with an incidence rate of 9.1 per 100,000 people [footnote 2].
There is consistent evidence from across the world that high-risk human papillomavirus (HR-HPV) infection is a necessary, but on its own not sufficient, cause of cervical cancer [footnote 3]. Cofactors that appear to increase the risk of developing cervical cancer in HPV-infected people include:
- use of oral contraceptives
- smoking
- high number of pregnancies
- previous exposure to other sexually transmitted diseases, such as chlamydia trachomatis and herpes virus type 2
Cervical screening is not a test for cancer, but a means of preventing it. The NHS CSP uses cervical cytology and human papillomavirus (HPV) testing to detect potential abnormalities or the presence of the HPV virus which could develop into cancer if left untreated. People identified with these results are referred for a detailed assessment of their cervix, and potential treatment, at a specialist colposcopy clinic.
Today, all individuals with a cervix between the ages of 25 and 64 are eligible for free NHS cervical screening. Cervical screening is not offered to people who have no cervix, or to those who have made an informed choice to opt out of the programme.
Table A: Current cervical screening intervals
| Age group (years) | Frequency of screening |
|---|---|
| 24.5 | First invitation received |
| 25 to 49 | Every 3 years |
| 50 to 64 | Every 5 years |
| 65+ | Invitation as required for people who have had recent abnormal tests. Individuals who have not had an adequate screening test reported since age 50 may be screened on request. |
3. Audit findings
This section analyses and discusses the audit’s main findings. Detailed data tables are presented in Appendix B: Data tables.
3.1 Invasive cervical cancer
Over the period April 2007 to March 2016, 19,792 cases of invasive cervical cancer were included in the audit. Their screening histories are compared to 38,560 individuals without cervical cancer. When a person is diagnosed with cancer in the UK information about them is automatically included in the national cancer registry. It is data from cancer registries that tells us how many people are diagnosed with cancer. Table B provides a broad assessment of the audit’s coverage (see also Appendix A: data completeness, Table A-1), comparing the number of cases of invasive cervical cancer included in each audit year (corresponding to the financial year) with the number reported nationally in the national cancer registry in each calendar year. Although some cases included in the audit are not included in cancer registry data, and vice versa, the number of cancers reported to registries is around 20% greater than the number included here.
Updated estimates from the Office for National Statistics (ONS) report 2,639 diagnoses of invasive cervical cancer during 2013 and 2,590 during 2014[footnote 4], whereas the audit comprises 2,118 cases between April 2013 and March 2014 and 2,093 between April 2014 and March 2015. The most recent year of data included in the audit report is usually the least complete, with 1,817 cases reported here for April 2015 to March 2016 compared with 2,517 reported nationally for 2015. SQAS staff work with hospital staff, Public Health England (PHE) and National Cancer Registration and Analysis Service (NCRAS) colleagues to minimise these discrepancies and to make both data sources more directly comparable.
Table B also presents a recent history of the number of cervical cancers included in each audit year. We have included this to illustrate the amount of new data received each year. Compared to national registrations, 80% of cancers diagnosed between April 2010 and March 2011 had been reported into the audit in time for inclusion in the 2011 report and 89% in the 2012 report. By comparison, 72% of cancers diagnosed between April 2015 and March 2016 had been reported into the audit in time for inclusion into this report.
Table B. Number of cases of cervical cancer included in each audit year compared with those reported nationally
| Audit Year (Apr to Mar) | Calendar year | Cases included in 2010 report | Cases included in 2011 report | Cases included in 2012 report | Cases included in 2013 report | Cases included in this report | Cancer Registrations* |
|---|---|---|---|---|---|---|---|
| 2007 to 2008 | 2007 | 2,089 | 2,136 | 2,158 | 2,144 | 2,163 | 2,337 |
| 2008 to 2009 | 2008 | 2,164 | 2,205 | 2,254 | 2,262 | 2,286 | 2,409 |
| 2009 to 2010 | 2009 | 1,978 | 2,349 | 2,452 | 2,474 | 2,528 | 2,766 |
| 2010 to 2011 | 2010 | 0 | 1,876 | 2,087 | 2,099 | 2,162 | 2,346 |
| 2011 to 2012 | 2011 | 0 | 0 | 1,969 | 2,191 | 2,363 | 2,511 |
| 2012 to 2013 | 2012 | 0 | 0 | 0 | 2,020 | 2,262 | 2,482 |
| 2013 to 2014 | 2013 | 0 | 0 | 0 | 0 | 2,118 | 2,639 |
| 2014 to 2015 | 2014 | 0 | 0 | 0 | 0 | 2,093 | 2,590 |
| 2015 to 2016 | 2015 | 0 | 0 | 0 | 0 | 1,817 | 2,517 |
| Total | 19,792 | 22,597 |
*Source: We have used the updated number of registrations from Table 8 of the Office for National Statistics MB1 publication 46 (2015). As with the audit, ONS receive notification of several additional cases after they have published their yearly statistics. MB1 Cancer registrations are published by calendar year; audit data are by financial year (1 April to 31 March).
There is a trade-off between presenting data in a timely manner and the completeness of that same data. For details on how timeliness affects our estimates of the International Federation of Gynecology and Obstetrics (FIGO) stage and age at diagnosis please refer to the summary methods document. In this report we focus only on the most recently diagnosed cervical cancers by restricting the data in this report to 6,028 cases diagnosed between April 2013 and March 2016 and comparing them to 11,580 people without cervical cancer. However, where relevant we have used all cancers reported to the audit.
When a person with cervical cancer is identified for inclusion into the audit up to 4 people without cervical cancer get identified from the screening database. The people without cervical cancer are referred to as population ‘controls’. Controls are selected (or matched) if they are born within 2 years of the person with cancer and to either have the same GP or live in the same area. Most cases submitted (n=5,616) to the audit have at least 2 age-matched population controls (GP and district). However, for a small number of cases (151), only one of these controls was identified, while 261 cases were submitted with no population control. For a defined subset of cases, up to 2 further controls were selected, resulting in 5,554 screened controls and 3,228 abnormal controls.
3.2 Age at which invasive cervical cancer is diagnosed
Figure 1 shows the number of cases of cervical cancer by age in the audit between April 2013 and March 2016, compared with the numbers reported nationally for January 2013 to December 2015. The peak number of cases in the audit is observed in the 25 to 29 year old age group (1,054 or 17.5%), followed closely by cases in women aged 30 to 34 (830 or 13.8%), and aged 35 to 39 (756 or 12.5%). Nationally, the results are similar. The under-reporting of cases to the audit is better illustrated in Appendix A: data completeness, Table A-1 where audit cases reported by calendar year are compared to cases reported in the national statistics. It shows that under-reporting to the audit increases with age at diagnosis, so that we are missing more cases for people over the age of 65 than for those under 65.
In this audit, 83.7% of all cases of invasive cervical cancer fell within the age group eligible for cervical screening (25 to 64 years, see Appendix B: data tables, Table 3) and 15.4% were diagnosed at age 65 or older. In 2015, people eligible for screening made up 79% of all cervical cancer registrations in England [footnote 4].
In December 2012, a change to the age at which people are first invited for screening came into effect. This saw people receive their first invitation to participate in screening at age 24.5 instead of 25. As a result, among people aged 20 to 25, the proportion diagnosed with cervical cancer at age 24.5 to 25 increased from 33% (88 out of 263) prior to December 2012 to 67% (139 out of 207) of people diagnosed from December 2012 to March 2016. To reflect the change in policy throughout this report we include people diagnosed age 24.5 to 25 in the 25 to 29 age group.
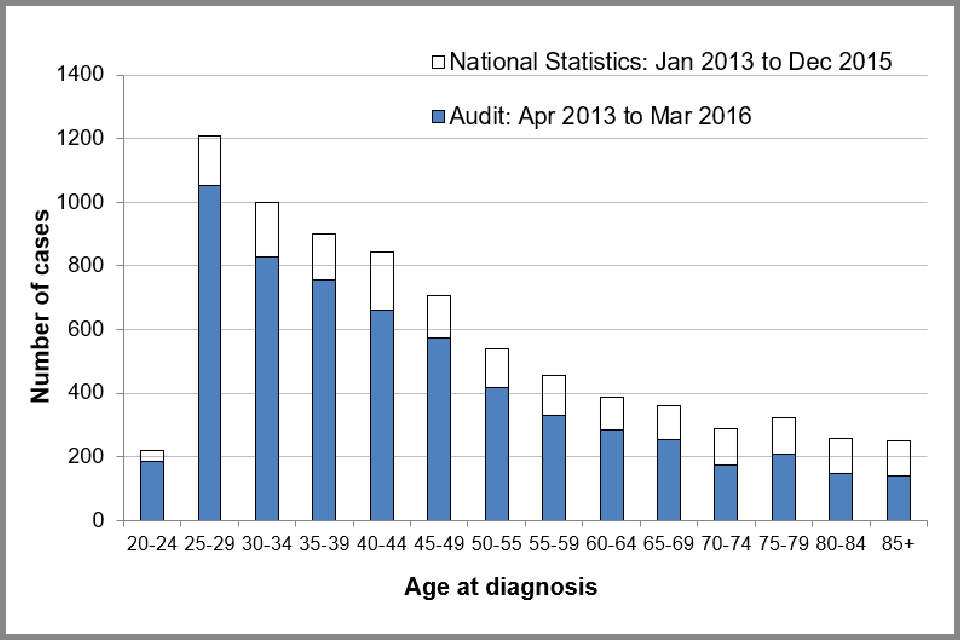
Bar chart showing number of cases of invasive cervical cancer submitted to the audit compared with the number registered by ONS for 2013 to 2015, by age at diagnosis.
3.3 FIGO stage of invasive cervical cancers
[Table C] below shows the observed and estimated proportion of cervical cancer cases in each FIGO stage. FIGO stage information is missing for 7.3% of cases and clinical staging was not possible for 2.2%, therefore no staging data is available for 9.5% of cases (see Appendix A: data completeness, Table A-3). Figures in this report suggest that of the 442 (7.3%) cases with missing stage, staging data was not available for most (n=310, 70%) as opposed to the information being available but not yet recorded within the audit.
The proportion of cases with missing stage has more than halved since the first audit report was published (from 21% to 9.5% in this report). We know that those cancers where the FIGO stage is unknown tend to be of a higher stage than those where stage is known (see summary methods document). Therefore, we estimate that had all the cancers been staged, 36% of cancers in the audit would be stage IA, 33% stage IB, 24% stage II or III and 7% stage IV (Table C).
The earlier the stage of cancer at diagnosis, the better the prognosis is for the individual and the less aggressive the treatment.
Table C Cases of invasive cervical cancer in the audit between April 2013 and March 2016 audit, by FIGO stage
| FIGO stage | Cases (n) | Observed proportion (%) | Estimated percent distribution (%) |
|---|---|---|---|
| IA | 1,972 | 32.7 | 35.7 |
| IB | 1,788 | 29.7 | 33.1 |
| II & III | 1319 | 21.9 | 24.1 |
| IV | 378 | 6.3 | 7.1 |
| IB(NOS)* | 131 | 2.2 | - |
| None recorded | 440 | 7.3 | - |
| Total | 6,028 | 100 | 100 |
*cases reported as IB(NOS) are known to be stage 1B or worse but detailed stage is not known. As a proportion of all cancers, invasive cervical cancer at FIGO stage II or worse was more likely to be diagnosed in people over the age of 50 than in those under 50, with stage IA disease becoming less frequent with increasing age. This is because people diagnosed with cervical cancer over 50 are much less likely to have been screened recently than people of the same age without cancer. Their cancers are more likely to be diagnosed following investigation of symptoms and therefore present at a later stage. By contrast, between the ages of 25 and 49, the majority (46.8%) of cervical cancers were found to be stage IA (see Appendix B: data tables, Table 5a).
The difference in the stage at diagnosis by age is even more apparent when looking at rates of cervical cancer by FIGO stage (see Figure 2 below). We used the observed rates of cervical cancer by age group reported in the MB1 series[footnote 4] in 2015 and applied the FIGO stage distribution by age observed in the audit dataset.
Detailed FIGO stage (for cases with known stage) by age group at diagnosis is presented in Figure 3 (see below). In 1,417 out of 1,971 cases of stage IA cancer, further details were provided, and these suggest that 92% are stage IA1 and only 8% stage IA2 (Appendix B: data tables, Table 4). 57% of stage IA1 cancers were diagnosed in people aged between 25 and 34, 32% were diagnosed in people aged 35 to 49 and 9% in those aged 50 to 64. Only 1.0% were diagnosed in people over the age of 65. Of the 1,788 people with stage 1B cervical cancer, further detail was known for 1,071. 89% of these people were diagnosed with stage IB1 cancer and 11% were stage IB2.
Figure 4 (see below) shows the estimated number of cervical cancer cases by FIGO stage, year of diagnosis, and age at diagnosis. Estimates for the last year of data included in the audit are dotted, as this more recent data is less complete, and we are less certain of the accuracy of the results. The ‘Jade Goody effect’ (a rise in the number of younger individuals attending cervical screening appointments following the diagnosis and untimely death of the reality TV star) can be seen in an increase in the number of stage IA and IB cancers diagnosed in people aged 25 to 34 (in particular) in between 2009 and 2010 (Figure 4b). No increase was observed in stage II or worse cancers.
The effect of raising the age at which people are first invited for screening from 20 to 25 can be seen from 2009 onwards (Figure 4b), with an increase in early stage IA cancers diagnosed in people aged 25 to 34 and a corresponding decrease in those under age 25 (Figure 4a).
Since people aged under 24.5 are not invited for screening, the likelihood of screen-detected cancer in this group is close to zero. Almost all people under age 25 have never been screened (97% of people without cancer and 95% of women with cancer, see Appendix B: data tables, Table 14). Therefore, it is mostly people who are investigated because of reported symptoms who are likely to be diagnosed at this age. Out of the 52 cases with recorded FIGO stage diagnosed in people aged 20 to 24.5, 46% were diagnosed as stage IB and a further 33% as stage II or worse. To put this in context, there were 1,898 people diagnosed with cervical cancer aged 25 to 34 and only 10% were diagnosed with stage II or worse (see Figure 3b below).
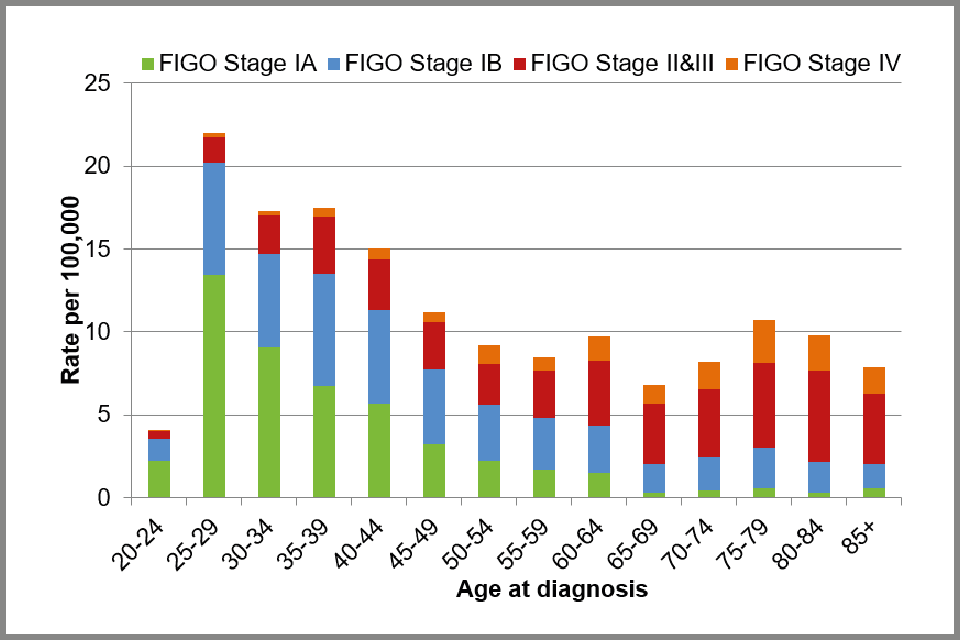
Bar chart showing observed incidence rates of cervical cancer per 100,000 women in England, 2015: by FIGO stage and age at diagnosis
People over the age of 50 at diagnosis, and particularly those diagnosed after the age of 65, are more likely to be diagnosed with advanced stage cancer than younger people. Although the absolute number of cancers diagnosed in people aged 65 to 74 has fallen from 119 between 2007 and 2008 to 107 between 2014 and 2015 (Figure 4e), there has been an increase in the proportion of cancers diagnosed as stage II or worse, from 64% between 2007 and 2008 to 73% between 2014 and 2015 (not shown). 35% of people diagnosed with cervical cancer aged 65 to 79 had not been screened between the ages of 50 and 64 compared with only 9% of people of the same age without cervical cancer (Appendix B: data tables, see Table 14). Of those screened between ages 50 and 64, only 38% of people with cancer had a negative test and were up-to-date with screening compared to 69% of people without cancer.
It is worth noting that people aged 75 at diagnosis (between 2007 and 2014) will have been aged between 49 and 56 when screening was first introduced in 1988. Therefore, people aged over 75 are unlikely to have participated more than once or twice in the screening programme.
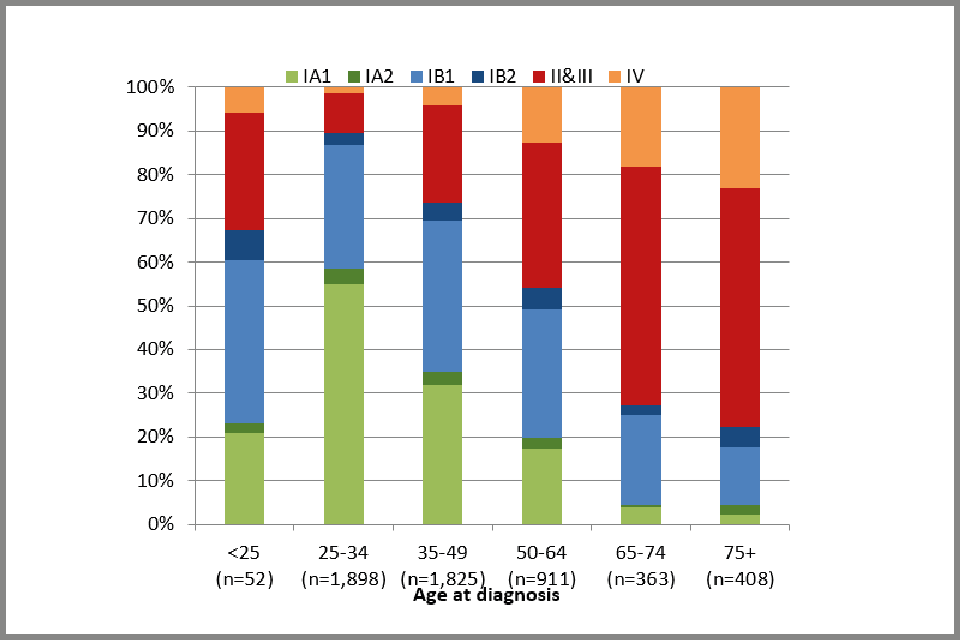
Bar chart showing FIGO stage of cervical cancer cases: percentage distribution, by age at diagnosis
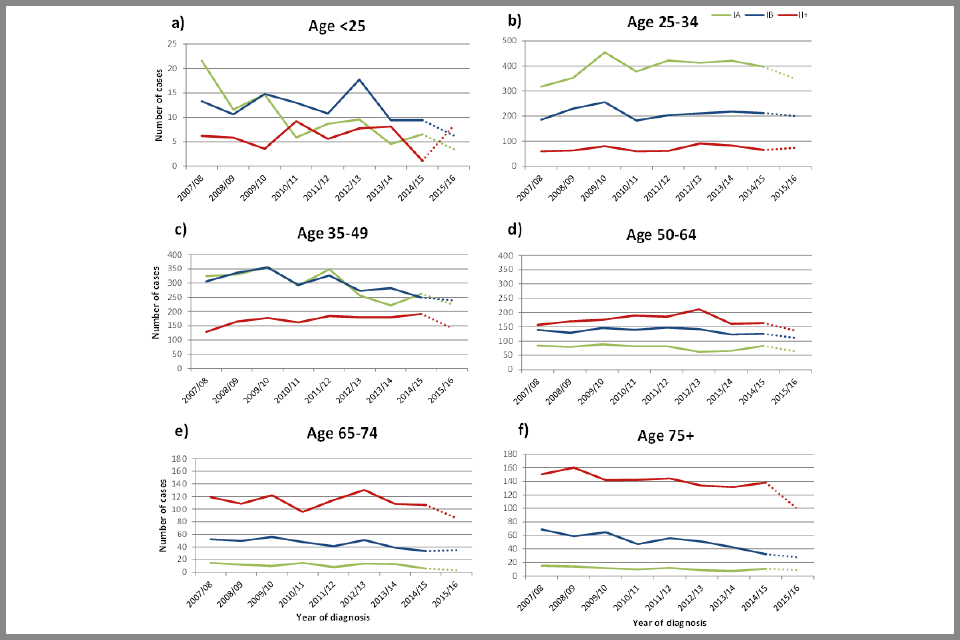
Plot chart showing trends in the number of cervical cancer cases diagnosed from April 2007 to March 2016, by FIGO stage and age at diagnosis
3.4 Histology of invasive cervical cancers
Figure 5 (below) shows the distribution of invasive cervical cancer cases by histological type. Most of the cases of cervical cancer show squamous histology (67%), while 20% are adenocarcinomas. Adenosquamous types are considerably less common (2.3%). Squamous carcinoma is more likely to be diagnosed as stage IA cancer than the other histological types. 40% of squamous carcinomas were stage IA compared to 27% of adenocarcinomas and 13% of adenosquamous cancers. 35% of the cases with undifferentiated and 32% of the other histological types were diagnosed as stage II cancer (with 27% and 17%, respectively, diagnosed as stage IV).
We have previously found that while cytology screening is capable of detecting early-stage invasive adenocarcinoma and thereby prevents stage IB and worse adenocarcinomas, it is substantially less good at detecting glandular rather than squamous precancerous lesions[footnote 5]. It therefore often fails to prevent stage IA adenocarcinoma. This means squamous carcinoma is much more likely to be diagnosed at an early stage.
Among cases with known histological type, there was a modest 3% increase (from 20% to 23%) in the proportion of cancers diagnosed as adenocarcinoma between April 2007 and March 2016. Such a small increase suggests that the proportion of cancers in each histological type has remained constant over time (see Figure 6 below).
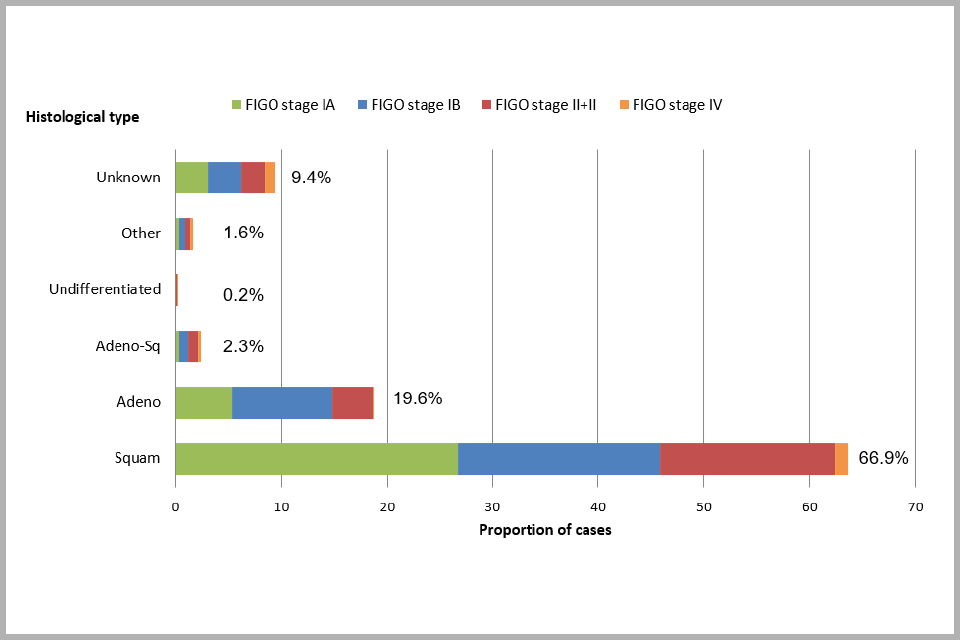
Bar chart showing proportion of cervical cancer cases diagnosed between April 2013 and March 2016, by histology and FIGO stage
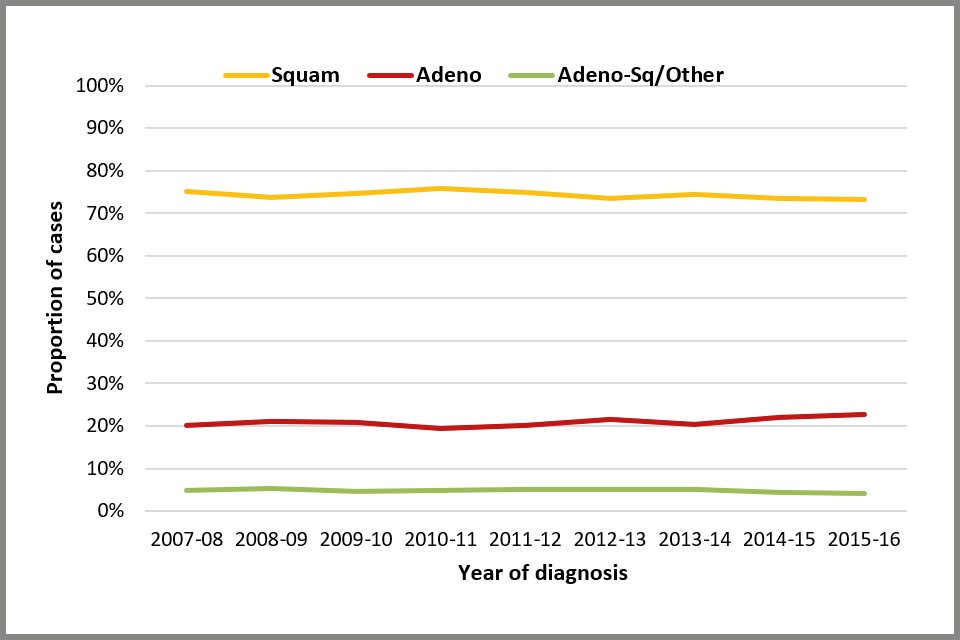
Line chart showing trends in the proportion of cervical cancer cases, by histological type
3.5 Treatment of invasive cervical cancers
Figure 7 (below) shows the distribution of treatment for cervical cancer, according to age (see also Appendix B: data tables, Table 10a). The most aggressive treatment employed in each case has been captured. Treatment was recorded in 4,244 cases (70.4%), and of these, the most common treatment was cone biopsy or ‘loop’ excision (30.7%), followed by radiotherapy plus chemotherapy with or without a hysterectomy (24.7%), and simple or radical hysterectomy (22.6%). Only 2.7% of cases were treated with a trachelectomy (which is a surgical treatment for cervical cancer intended to preserve fertility). 8.3% of known treatments were recorded as ‘none’. The proportion of cases with known treatment in the dataset has increased from 54.3% in the first report to 70.6% here (see Appendix A: data completeness, Table A-2b).
Age is an important consideration when deciding what treatment to offer people with early stage cancer (FIGO stage I). As people age they become less likely to have fertility-sparing treatments for early stage cancer. However, for stage II or worse cancers, chemotherapy plus radiotherapy with or without a hysterectomy is the most common form of treatment regardless of age at diagnosis.
Filtering the results by age reveals that for people aged 50 to 64, the most common treatment was chemotherapy plus radiotherapy with or without a hysterectomy (39%), followed by hysterectomy alone (28%). By contrast, 46% of people under 50 had fertility-sparing treatment (cone biopsy or loop excision, or trachelectomy) with only 25% undergoing a hysterectomy (simple or radical).
For people aged 65 to 79, chemotherapy plus radiotherapy with or without a hysterectomy (40%) was the most common treatment, followed by radiotherapy with or without a hysterectomy and no chemotherapy (22%) (Appendix B: data tables, Table 11). However, among people for whom treatment was recorded, 13% of people aged 65 or over reportedly received no treatment and 9% received palliative care (Figure 7). Given the substantially poorer relative survival of elderly cervical cancer patients nationally[footnote 6], this appears to warrant further investigation. It should be borne in mind however that ‘no treatment’ may be recorded because a record of treatment was not found, rather than because the patient was not treated.
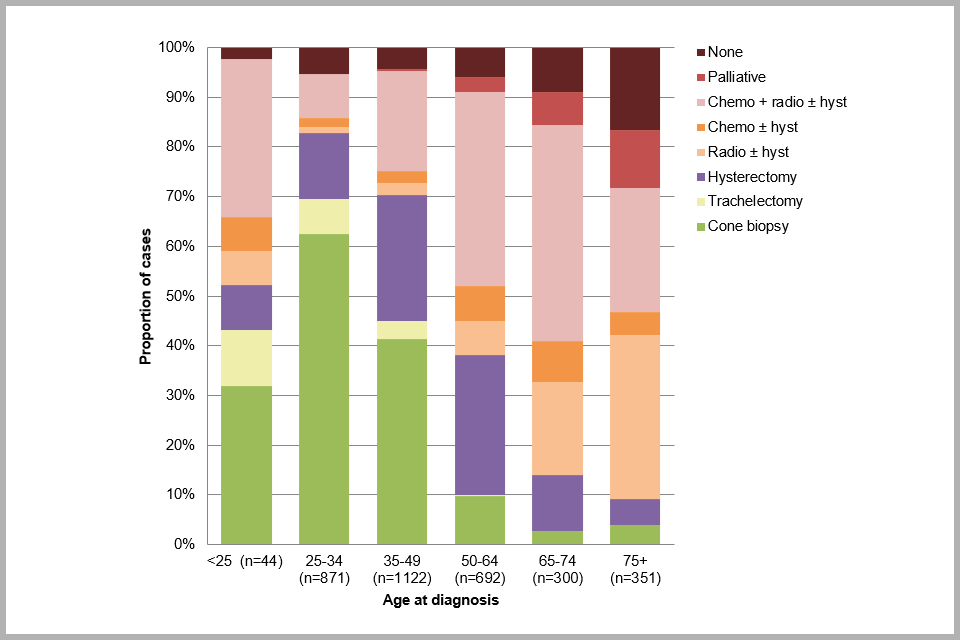
Bar chart showing proportion of cervical cancer cases by treatment received, by age at diagnosis
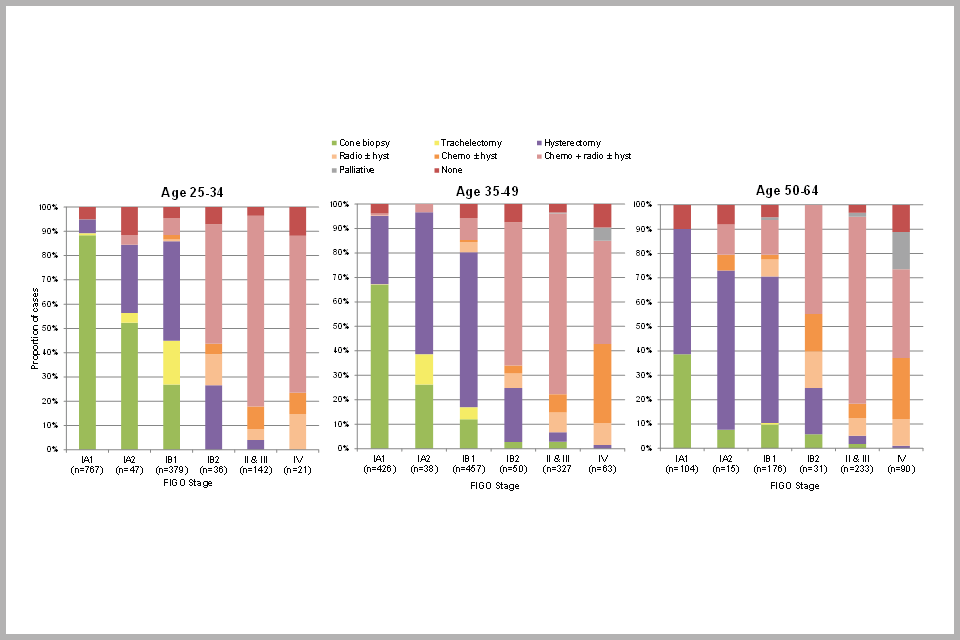
Bar chart showing proportion of cervical cancer cases by treatment received, by FIGO stage and age at diagnosis
Figure 8 (above) shows the distribution of treatment received for invasive cervical cancer by stage of disease and age at diagnosis. This graph shows that the majority of people diagnosed with FIGO stage IA1 cancer received cone biopsy/loop excision treatment, in particular those aged under 35 (88%). Loop excision is also the preferred treatment method for high grade abnormalities of the cervix (cervical intraepithelial neoplasia (CIN) grade 2 or 3).
Fertility-sparing trachelectomy was mostly received by people with stage IA2 or IB1 cancers who were under age 50. The majority of people diagnosed with stage II or worse disease at any age received chemotherapy plus radiotherapy with or without a hysterectomy. It is worth noting that a very small proportion (1%) of cancers diagnosed at stage IA1 are recorded as having been treated with chemotherapy plus radiotherapy with or without a hysterectomy. Similarly, 1% of stage II or worse cancers are recorded as having been treated with a cone biopsy. These are clearly misclassifications of stage and/or treatment which we are endeavouring to correct for the future.
3.6 Effect of HPV triage on diagnosis of cervical cancer
A test to detect high risk HPV (HR-HPV) has been incorporated into the screening programme. Roll out of HPV testing began in April 2012. HPV testing was introduced to triage people who have a cytology sample showing borderline nuclear changes or low grade dyskaryosis, and as a ‘test of cure’ for all people treated for CIN with negative, borderline or low grade dyskaryosis. People who were HR-HPV negative were returned to routine recall, but those who were HR-HPV positive were referred to colposcopy (people with high-grade cytology 6 months after treatment were referred immediately to colposcopy, without this additional HR-HPV test)[footnote 7].
By April 2013, most laboratories had rolled out HPV testing to triage people who had a cytology sample showing borderline nuclear changes or low-grade dyskaryosis. Here we present for the first time the impact of HPV triage on:
- the proportion of cytology tests that result in an early recall
- the time between the borderline or low-grade dyskaryosis cytology and diagnosis
- FIGO stage by HPV triage status
The proportion of cytology tests that resulted in early recall decreased from 22% (708/3,705) to 6% (73/1,234) among people with cervical cancer and from 22% (1,596/7,404) to 10% (110/1,086) among people without cancer (see Figure 9 below).
A total of 387 people with cervical cancer (6% of all cancers) had a borderline or low-grade cytology result within 2.5 years of diagnosis. Figure 10 below presents the time from this test to diagnosis among these 387 people. As of April 2013, the proportion of people diagnosed within 3 months of borderline or low-grade cytology increased from 20% between April 2007 and March 2009, to 35% between April 2013 and March 2016. Before HPV triage, people would have returned 6 months after the first borderline or low-grade test for another cytology, at which time if the cytology was still abnormal they would be referred. This means HPV triage has ensured a timelier route to diagnosis.
Of the 387 people with borderline or low-grade cytology, 149 (39%) had an HPV triage test within 2 years of diagnosis. A higher proportion of cancers were diagnosed as stage IA among people with an HPV triage test than among those with low-grade disease and no HPV triage ( see Figure 11 below). This suggests that quicker referral for further investigation has improved stage at diagnosis and therefore future prognosis.
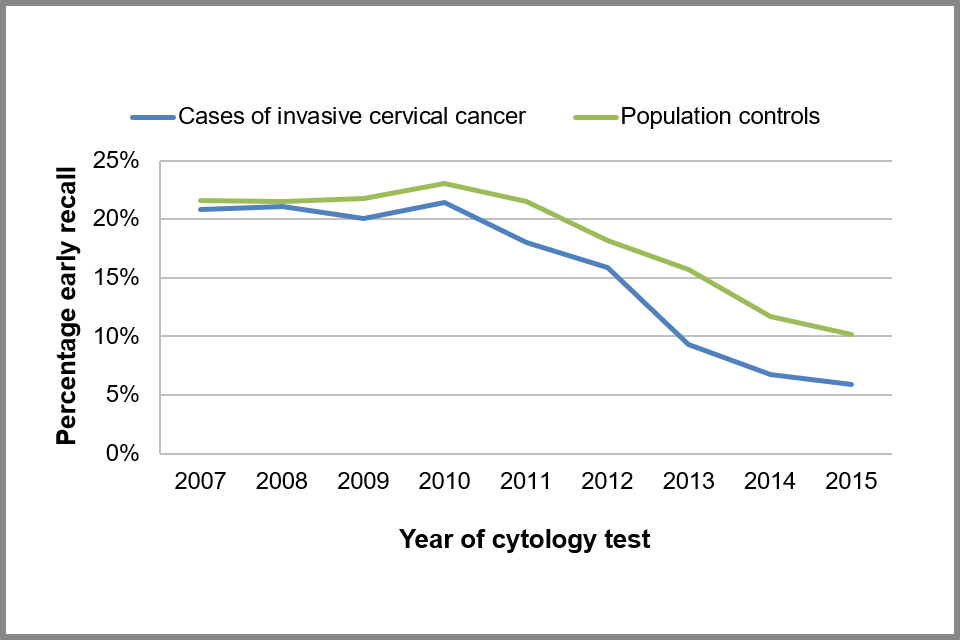
Line chart showing proportion of cytology tests that resulted in an early recall action code, by calendar year taken, for cases and controls
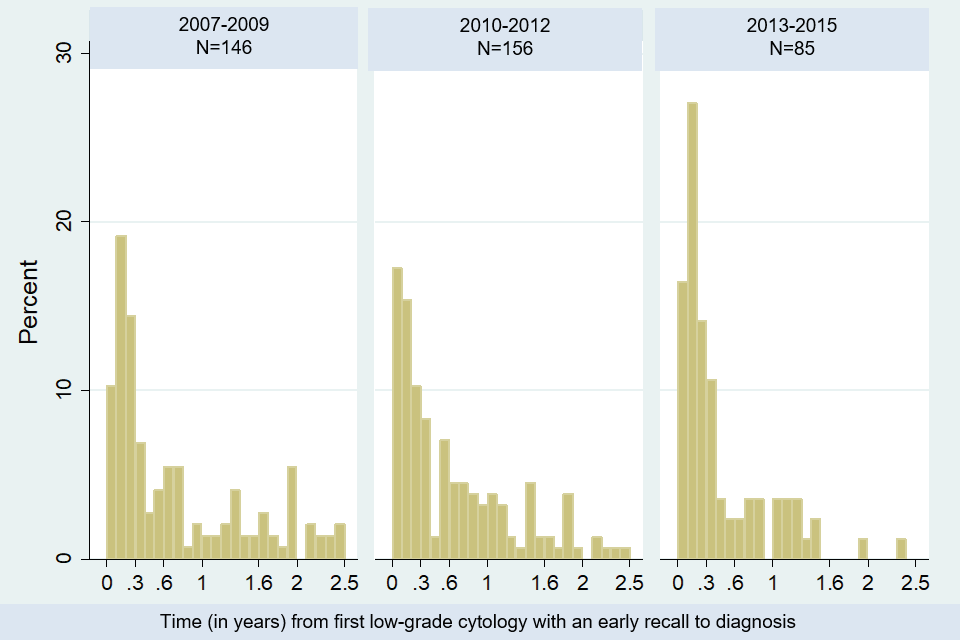
Bar chart showing time from first borderline or low-grade dyskaryosis test to diagnosis, by year the cytology test was taken: percentage of women with cervical cancer and a test within 2 years of diagnosis
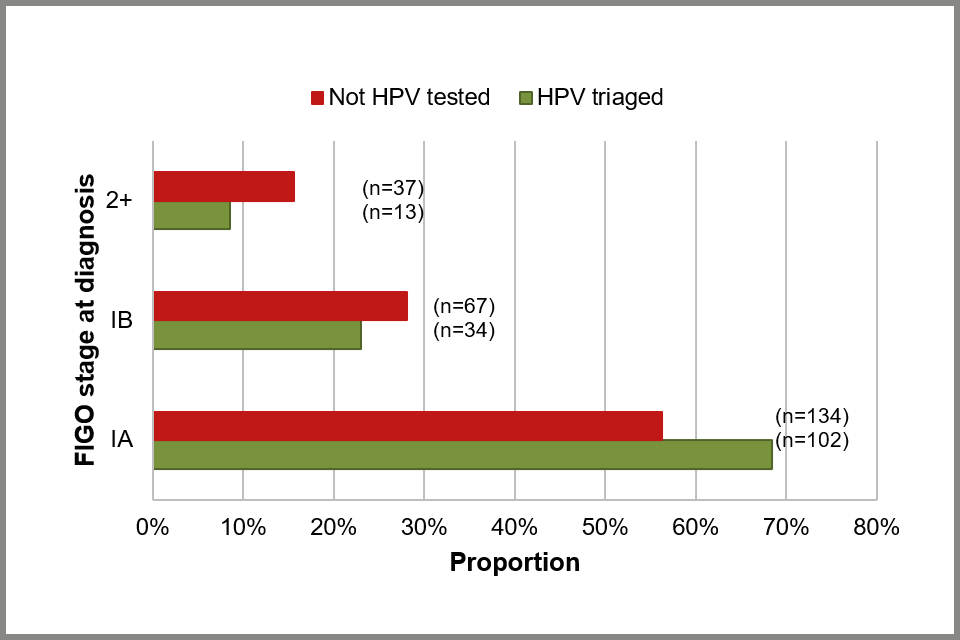
Bar chart showing estimated proportion of cervical cancer cases by FIGO stage, by HPV triage status among those with a borderline or low-grade cytology within 2 years of diagnosis
3.7 Screening histories in people diagnosed with cervical cancer and their controls (people without cervical cancer)
Figure 12 below shows the distribution of screening histories in people diagnosed with cancer and their controls (who did not have cancer) by date of diagnosis and stage. Tests taken within 6 months of diagnosis are not taken into account when establishing peoples’ screening histories. A person screened within 6 months of diagnosis is ‘screen detected’ but if they have no other tests they should not be considered to have a ‘screening history’. To compensate for this, people are considered to be up to date with screening if they have a test between 6 months and 3.5 (if age 25 to 49) or 5.5 years (if age 50 to 64) prior to diagnosis. We present the data in 3 time periods: April 2007 to March 2010, April 2010 to March 2013 and April 2013 to March 2016.
Overall, between April 2013 to March 2016 the proportion of people diagnosed with cervical cancer who were up-to-date with screening was statistically significantly lower among cases than controls (20 to 27% compared with 63%).
The proportion of people without cancer who have no screening history has remained at around 16% since the start of the audit in 2007, while the proportion screened and up-to-date (according to current guidelines) has remained at over 60%. These statistics are based on data included in the audit and are not directly comparable to national coverage statistics (which are calculated differently).
The proportion of people diagnosed with cancer who are up-to-date with screening has decreased over time, and a larger proportion have no screening history (other than within 6 months of diagnosis). Among people diagnosed with stage IA cancers between April 2007 and March 2010, 22% had no screening history compared with 42% of those diagnosed between April 2013 and March 2016, (see Figure 12 below). In other words, the overall proportion of people diagnosed with stage 1A cancer who have no screening history has doubled over this 6 year time period. Similarly, among those diagnosed with stage IB cancers, the proportion with no screening history increased from 22% to 35% over the same time period. Among those with stage II or worse cervical cancer, the proportion with no screening history remained constant (35% to 38%).
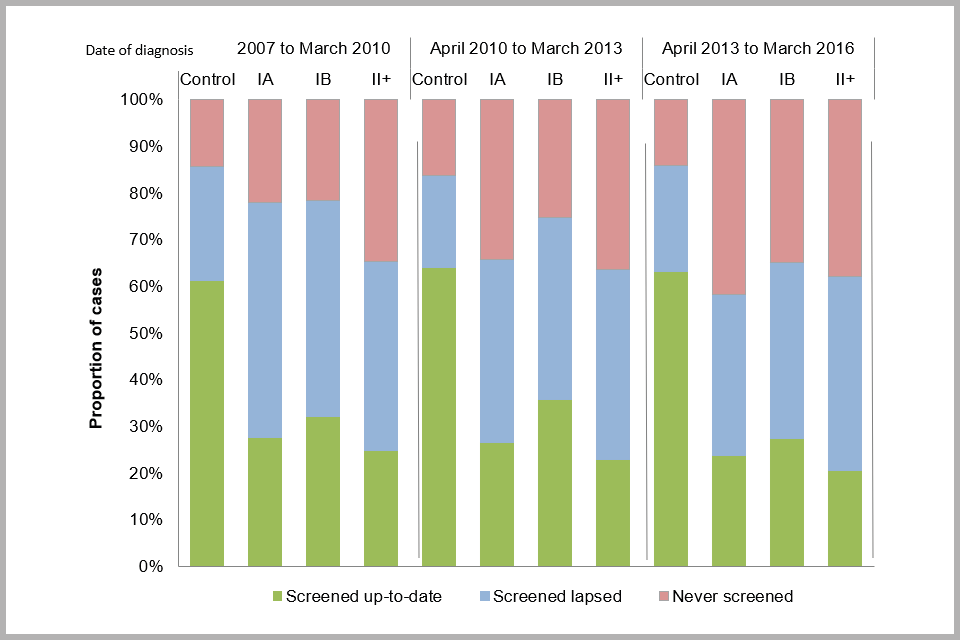
Bar chart showing screening history for cervical cancer cases (by FIGO stage) and controls, by date of diagnosis: proportion (excluding tests taken within 6 months of diagnosis)
To explore this further, we looked at the proportion of people with cervical cancer with no screening history, by age and stage at diagnosis (see Figure 13 below). We also assessed whether the odds ratio (OR) of being diagnosed with cervical cancer has changed over the 3 time periods (see Table D below).
There was no evidence that the proportion of people with cervical cancer aged 35 to 49 or 50 to 64 with no screening history has changed over time. However the proportion of people aged 25 to 34 with no screening history has increased over time. The increase is more evident for stage IA and IB cancers (around 25%). Nevertheless, a 13% increase is also seen for stage II+.
Between 2008 and 2009 the age of first cervical screening invitation in England was increased from 20 to 25. This was based on evidence that screening at ages 20 to 24 provides no population benefit in terms of cancer prevention. In 2012, the age of sending out the first screening invitation was changed again to 24.5 years to enable people to be screened by their 25th birthday.
This change in policy has resulted in an increase in the proportion of people aged 25 to 34 who attend their first screening test between the ages of 25 and 26, from 9.7% to 15.8%. For people aged 25 to 34 who are diagnosed with cancer, the proportion who are aged 25 to 26 at diagnosis increased from 12.6% to 25.9%.
Among people with no screening history who are aged 25 to 26 there has been no statistically significant change in the proportion who had a test within 6 months of diagnosis (92% (84 out of 91 people) between 2007 and 2010, 89% (255 out of 287) of those diagnosed between 2010 and 2013 and 86% (237 out of 277) of those diagnosed in the latest period (p=0.188)). In other words, although the numbers of people diagnosed aged 25 to 26 have tripled, it is still the case that most (86%) have their cancer detected as a result of their first screening test.
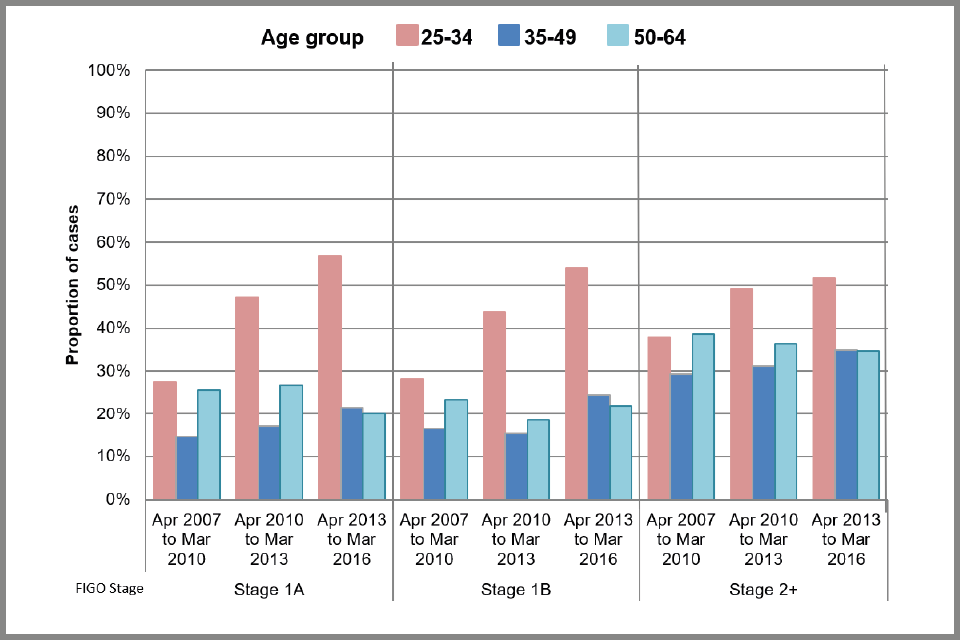
Bar chart showing proportion of cervical cancer cases with no ‘screening history’, by FIGO stage, date of diagnosis and age at diagnosis
Looking more closely at cancers in people aged 25 to 34, we found that the number of people with stage IA cancer in this age group was similar over the 3 time periods (1,035, 1,152 and 1,110 people respectively). However, the proportion with no screening history other than within 6 months of diagnosis increased from 27% between 1 April 2007 and 31 March 2010 to 57% between 1 April 2013 and 31 March 2016 (see Figure 13 above). Similar results were observed for stage IB cancers in people aged 25 to 34 over the same 3 time periods (594, 551 and 590 people respectively), where the proportion of people diagnosed aged 25 to 26 increased from 8.9% to 48.8%. Results indicate no increase in the total number of cancers in this age group, rather that people are being diagnosed on or around their first invitation for screening (between age 25 and 26).
Compared to people who attend screening every 3 years, the likelihood of being diagnosed aged 25 to 34 with stage 1A and 1B cervical cancer among those who have no screening history has increased over time. This was not observed for advanced stage cancers (stage II or worse) nor for any other age group (see Table D below). Diagnosing cervical cancer at an early (rather than late) stage should be considered a success, as survival is over 98% and in most cases fertility can be preserved.
It is too soon to say whether the increase in cancers diagnosed at age 25 to 26 has resulted in a decrease in cancers diagnosed age 27 to 30. We need to wait until 2019 for people invited at age 25 to reach the age of 30. However, it is reassuring to see no significant increase in the odds of being diagnosed with stage II or worse cancer over time.
Among those diagnosed with cervical cancer aged 35 to 49, there has been a much more moderate increase in the proportion with no screening history, and the total number of cancers has decreased over the 3 time periods (2,178, 2,089 and 1,828 women respectively).
For people diagnosed at age 50 to 64, there has been very little change both in the proportion never screened and in the number of cancers diagnosed over the 3 time periods (952, 1,048 and 909 women respectively).
Overall, these findings mean that taking action to encourage individuals to attend for cervical screening should continue to be a high priority.
Table D. Odds ratio of cervical cancer diagnosis in women with no history of cervical screening compared to those attending screening as recommended (every 3 or 5 years) by diagnosis period
| Age and FIGO stage | Diagnosed Apr 2007 to Mar 2010: OR | Diagnosed Apr 2007 to Mar 2010: (95% CI) | Diagnosed Apr 2010 to Mar 2013: OR | Diagnosed Apr 2010 to Mar 2013: (95% CI) | Diagnosed Apr 2013 to Mar 2016: OR | Diagnosed Apr 2013 to Mar 2016: (95% CI) |
|---|---|---|---|---|---|---|
| 25 to 34: 1A | 2.3 | (1.8-2.9) | 3.8 | (3.1-4.7) | 6.1 | (4.8-7.6) |
| 25 to 34: 1B | 2.5 | (1.9-3.4) | 3.2 | (2.4-4.2) | 5.9 | (4.4-7.8) |
| 25 to 34: II+ | 4.1 | (2.5-7.0) | 4.2 | (2.6-6.7) | 5.8 | (3.6-9.4) |
| 35 to 49: 1A | 4.7 | (3.3-6.6) | 6.1 | (4.3-8.6) | 7.6 | (5.4-10.9) |
| 35 to 49: 1B | 6.6 | (4.6-9.3) | 4.2 | (3.0-5.7) | 9.8 | (7.0-13.7) |
| 35 to 49: II+ | 14.3 | (8.9-22.9) | 19.3 | (12.1-30.9) | 23.9 | (14.9-38.3) |
| 50 to 64: 1A | 9.6 | (4.8-19.1) | 9.6 | (4.5-20.4) | 9.5 | (4.6-19.8) |
| 50 to 64: 1B | 8.4 | (5.0-14.0) | 5.9 | (3.7-9.7) | 16.6 | (8.6-32.0) |
| 50 to 64: II+ | 19.5 | (12.2-31.2) | 20.5 | (13.1-32.2) | 42.6 | (23.2-78.1) |
3.8 Cytology slide reviews
Cytology slide reviews help us understand the quality of screening. It is primarily a learning opportunity for health professionals involved in screening. Learning outcomes from cytology slide review reduces the chance of potentially overlooking abnormal cells in routine practice. We use the cytology slide reviews carried out as part of audit to establish the proportion of people with at least 1 negative cytology slide result within 3 or 5 years of diagnosis (depending on age) which was subsequently changed to an abnormal result of borderline or worse upon review.
When interpreting these results, it is important to consider that the slide reviews were not blinded. This means that the person reviewing the slide knew that the original result was negative, and that the individual was diagnosed with cancer at some point over the next 5 years. This increases the chance that they will find abnormal cells which could understandably be missed in routine screening practice.
Among people diagnosed with cervical cancer aged 25 to 49:
- 20.3% had a negative cytology test within 3.5 years of diagnosis (Appendix B, Table 14) resulting in a routine recall to screening
- 58.1% of these slides had the original result confirmed on review; the remainder were upgraded to borderline or worse cytology upon un-blinded review
This means 8.5% (0.203 x 0.419) of people with a negative cytology test within 3.5 years of diagnosis had a test where an abnormality was not identified at routine screening. This is equivalent to 69 people (1.7% (69/4,010) of all people aged 20 to 49 diagnosed with cervical cancer in this report).
Among people diagnosed with cervical cancer aged 50 to 64:
- 27.2% had a negative cytology test within 5.5 years of diagnosis (Appendix B, Table 14) resulting in a routine recall to screening
- 54.1% of these slides had the original result confirmed on review; the remainder were upgraded to borderline or worse upon un-blinded review
This means 12.5% (0.272 x 0.459) of people with a cytology test within 5.5 years of diagnosis had a test where an abnormality was not identified at routine screening. This is equivalent to 35 women (3.4% (35/1,034) of all people aged 50 to 64 diagnosed with cervical cancer in this report).
No screening test is perfect. False negative and false positive screening results will occur even when staff are properly trained, operating to the highest quality and meeting all screening programme standards. These data show that the quality of cytology in England is high and that situations in which a potential abnormality is not detected during screening are rare.
National guidance is that all people diagnosed with cervical cancer should be offered the results of the screening history review undertaken as part of the audit. They are told about any abnormality that was not identified at the time of screening if they have opted to receive their screening history review. Duty of Candour procedures are followed if the circumstances meet the criteria outlined.
3.9 Delays in diagnosis following referral to secondary care
Of the 6,028 people with cancer included in this report, 56.5% (3,404 people) had 1 screening test with a result indicating referral to colposcopy for further investigation was needed; 2.9% had more than 1 referral to colposcopy prior to diagnosis of cervical cancer. Of the 3,404 people with 1 referral to colposcopy only, 2,259 (66%) have a colposcopy recorded in the dataset.
Not all people diagnosed with cervical cancer are identified following an abnormal screening test; 40.6% did not have a screening result indicating a referral to colposcopy prior to their cancer diagnosis.
Screening programme guidelines state that following an abnormal screening test result that requires referral, an individual should be offered a colposcopy appointment within 6 weeks. For higher grade abnormalities, an appointment should be offered within 2 weeks.
To assess the colposcopy history of those people for whom a delay in diagnosis may have occurred, we will focus on those individuals with a delay of more than 4 months between referral and diagnosis. These represent 17.0% (384 out of 2,259) of all people for whom we have colposcopy data and 6.4% of all people diagnosed with cervical cancer between 1 April 2013 and 31 March 2016.
To establish whether any delay occurred because of a problem in management or a delay in people attending secondary care, we need to use colposcopy review data. Currently, colposcopy review results are only available for 213 colposcopy referral episodes. Colposcopy management summary measures were not always completed and therefore information on the outcome of the referral episode is only available for 164 episodes, relating to 155 individuals. Of these 155, 119 (77%) have a record for whether the management was appropriate. However 9 of the 119 were also recorded as having a management failure, raising questions about the quality of the data. A delay in treatment was recorded for 21 people. Given the small number of colposcopy reviews to date and the poor quality of the available data, it is not possible to report anything further here.
The proportion of people with a delay in diagnosis of more than 4 months is lower than that reported in the third national audit report (cases diagnosed between 1 April 2009 and 31 March 2013). In that report, 23% of people (605 out of 2606) had a delay of more than 4 months, representing 9.3% of all cancers in the dataset (605 out of 6508).
3.10 Glossary
Action code
This field (downloaded as part of the screening history from NHAIS) denotes the action to be taken in response to the result of each cytology test. The codes are:
A. Routine screening/call and recall.
H. Result recorded, but no change in current action code. (This code is normally used when privately-taken cytology tests are entered into the system).
R. Early recall at an interval specified by the laboratory.
S. Suspend recall pending referral.
Cases
People diagnosed with invasive cervical cancer in England.
Controls
People who have not been diagnosed with cervical cancer, who are registered with a GP in England. They are matched by age and place of residence with a case.
Cervical Screening Evaluation Group /Audit Management Group
The group charged with evaluating developments in the Cervical Screening Programme. The CSEG oversaw the NHS CSP national audit until February 2011, when an Audit Management Group was established, consisting of a subgroup of individuals from the Evaluation Group. The new Audit Management Group is charged with coordinating the development of audit protocols, and with gathering and disseminating recommendations for best practice.
Confidence interval
Confidence interval is a term used in inferential statistics that measures the probability that a population parameter will fall between 2 set values. The confidence interval can take any number of probabilities, with the most common being 95% or 99%.
Exeter call and recall system (NHAIS)
The system used to invite women for screening. Since 1988, it has stored screening records for all women registered with a GP
FIGO stage
The cancer staging classification developed by the International Federation of Gynaecology and Obstetrics (I, IA, IA1, IA2, IB, IB1, IB2, III, IIIA, IIIA, IV, IVA, IVB).
Hospital Based Programme Coordinator (HBPC)
The named individual within each NHS trust who is responsible for collating cases of invasive cervical cancer and initiating the audit process.
People
We use the term ‘people’ to refer to women and people with a cervix.
Screening Quality Assurance Service (SQAS)
In April 2013, quality assurance of screening programmes in England became the responsibility of Public Health England (PHE). This resulted in the 9 Quality Assurance Reference Centres (QARCs) in England being reorganised into 4 regions rather than 9 and renamed the Screening QA Service (SQAS).
-
NHS Cervical Screening Programme. Audit of Invasive Cervical Cancers. Sheffield 2006, updated December 2006. ↩ ↩2
-
Office for National Statistics. Cancer Statistics Registrations, England (Series MB1): 2015 2016. ↩
-
NHS Cervical Screening Programme. The Aetiology of Cervical Cancer. Sheffield; 2005. ↩
-
Office for National Statistics. Cancer Statistics: Registrations for Cancer Diagnosed in 2015, England. Series MB1 no 46. London; 2016. ↩ ↩2 ↩3
-
Castanon A, Landy R, Sasieni PD. Is cervical screening preventing adenocarcinoma and adenosquamous carcinoma of the cervix? International Journal of Cancer. 2016;139(5):1040-5. ↩
-
Cancer Research UK. CANCERSTATS: Cancer survival statistics by age, 2009. 2010 ↩
-
NHS Cervical Screening Programme. screening programme algorithm for HPV triage and test of cure algorithm 2013 (withdrawn April 2016). ↩