Bloodstream infection due to Candida (and species formerly part of the Candida genus) in England: 2022
Updated 25 June 2026
Applies to England

© Crown copyright 2026
This publication is licensed under the terms of the Open Government Licence v3.0 except where otherwise stated. To view this licence, visit nationalarchives.gov.uk/doc/open-government-licence/version/3 or write to the Information Policy Team, The National Archives, Kew, London TW9 4DU, or email: psi@nationalarchives.gov.uk.
Where we have identified any third party copyright information you will need to obtain permission from the copyright holders concerned.
This publication is available at https://www.gov.uk/government/publications/candidaemia-annual-data-from-voluntary-surveillance/bloodstream-infection-due-to-candida-and-species-formerly-part-of-the-candida-genus-in-england-2022
The yeast formerly known as Candida auris has been reclassified as Candidozyma auris following a taxonomic revision in 2023.
Introduction
The following analysis is based on voluntary surveillance of diagnoses of bloodstream infections (BSI) caused by yeast species reported by laboratories between 2013 and 2022 inclusive in England. Voluntary surveillance data for England was extracted on 15 June 2023 from both the communicable disease reporting (CDR) and antimicrobial resistance (AMR) modules of the UK Health Security Agency (UKHSA) Second Generation Surveillance System (SGSS). Work is ongoing to consolidate reporting of yeast species from BSI to SGSS with those submitted to national mycology reference laboratories.
Several taxonomic revisions to species previously classified as Candida have been implemented in the period covered by this Health Protection Report (HPR) (1). The focus has therefore shifted from candidemia in previous years to include BSI due to Candida and yeast species which have previously been named as Candida (as listed in the data tables associated with this report) and will continue to evolve while the taxonomy of this group becomes more clearly defined. In this report ‘yeast’ refers to those species both currently and formerly defined as Candida species. It should be noted that the data presented here for earlier years may differ from that in previous candidaemia publications due to the inclusion of late reports. The COVID-19 pandemic affected the general case-mix of hospital patients during much of 2020; this has likely impacted any trends reported here.
Rates of laboratory reported BSI due to yeast were calculated using Office for National Statistics (ONS) mid-year resident population estimates for the respective year and geography (2). Geographical analyses were based on the patient’s residential postcode. Where this information was unknown, the postcode of the patient’s general practitioner was used. Failing that, the postcode of the reporting laboratory was used. Cases were further assigned to one of nine local areas, formed from the administrative local authority boundaries, referred to as ONS regions.
This report looks at the trends and geographical distribution of BSI cases due to yeast in England. Cases are further broken down by species, age and sex. In addition, antimicrobial susceptibility trends since 2018 are reported.
Data tables are available featuring the data behind the findings of this report.
Main points
Principal conclusions of this report are that:
- there were 2,265 episodes of BSI due to yeast in England reported to SGSS in 2022; the overall rate of BSI due to yeast in England was 4.0 per 100,000 population in 2022, a slight increase from 2021 (3.8 per 100,000)
- within England, rates of BSI due to yeast ranged from 3.0 per 100,000 population in the Yorkshire and Humber region to 4.8 in the North East region
- highest rates of BSI due to yeast were seen in the elderly (aged 75 years and over; males: 20.3 per 100,000 population and females: 8.1 per 100,000 population)
- the majority of yeast isolates from BSI episodes (90%) were identified to species level in 2022
- in 2022, the 3 most frequently identified yeast species from blood were
Candida albicans (40%), Nakaseomyces glabratus (previously Candida glabrata, 29%) and Candida parapsilosis (13%) - antifungal resistance in Candida albicans was generally low in 2022, with resistance to fluconazole at 1%
Trends
In 2022, the rate of BSI due to yeast across England was 4.0 per 100,000 population, which represents an increase of 42% since 2013 and an increase of 4% from 2021 (Figure 1; a full list of included species is included within the data tables).
Figure 1. Rates of BSI per 100,000 population in England caused by yeast species, 2013 to 2022

This is the highest rate observed in the last 10 years. Previously, rates of BSI due to yeast had been stable until 2014. A slight increase was then observed, sustained until 2017, before the rate began to decrease again until 2019 (Figure 1).
The observed increase in BSI due to yeast from 2014 to 2017 may be due to increased reporting following the launch of the Second Generation Surveillance System (SGSS) in 2014, adoption of new laboratory testing methods such as MALDI-TOF which facilitate identification of fungal species, and raised awareness following the publication of the British Society for Medical Mycology (BSMM) guidance in 2015 and the widely reported Candida auris outbreaks within hospitals in 2015 and 2016 (3).
The increase in incidence from 2019 to 2020 may be due to increased number of patients being admitted to intensive care units (ICUs) in 2020, as a result of the COVID-19 pandemic (4). Patients on ICUs are at higher risk for BSI due to yeast as the setting allows the opportunistic pathogen to become invasive, with many risk factors for fungaemia overlapping with characteristics of patients on ICUs (5).
The English Surveillance Programme for Antimicrobial Utilisation and Resistance (ESPAUR) recently reported that Candida and allied yeast species were identified in 1.1% of mono-microbial (bacterial and fungal) bloodstream infections (BSI) and 4.0% of poly-microbial BSI in 2021 in England (6). The most common yeast species causing human infection, C. albicans, was the 18th most frequently identified organism in mono-microbial BSI, comprising 0.5% of BSI in 2021 (6).
Geographic distribution
Rates of BSI due to yeast varied by region. In 2022, all ONS regions had higher rates of fungaemia due to yeast compared to 2018, except for the North East where rates had decreased. Similarly, rates of fungaemia due to yeast increased in all ONS regions, except for London and for Midlands and East of England, from 2021 to 2022. The increase was most marked in the North West and South West ONS regions, from 3.7 and 3.4 per 100,000 population in 2021 to 4.8 and 4.5 per 100,000 population in 2022, respectively.
Table 1. BSI due to yeast per 100,000 population by region (England) 2018 to 2022
| Region/ONS Region | 2018 | 2019 | 2020 | 2021 | 2022 |
|---|---|---|---|---|---|
| North of England: North East | 5.0 | 2.8 | 3.6 | 3.7 | 4.8 |
| North of England: North West | 3.3 | 3.8 | 4.8 | 4.3 | 4.6 |
| North of England: Yorkshire and Humber | 2.3 | 2.2 | 2.5 | 2.5 | 3.0 |
| Midlands and East of England: East Midlands | 3.5 | 3.7 | 3.4 | 4.5 | 3.9 |
| Midlands and East of England: East of England | 3.6 | 3.5 | 4.1 | 4.5 | 4.0 |
| Midlands and East of England: West Midlands | 2.8 | 3.1 | 2.8 | 3.8 | 3.6 |
| London | 3.6 | 3.5 | 3.7 | 4.4 | 4.0 |
| South of England: South East | 2.8 | 2.8 | 3.2 | 3.3 | 3.9 |
| South of England: South West | 3.5 | 3.5 | 3.8 | 3.4 | 4.5 |
| England total | 3.3 | 3.3 | 3.6 | 3.8 | 4.0 |
Differences between regions may account for the variation observed. These include completeness of reporting, differing local epidemiology, differences in antibiotic and antifungal prescribing practices, as well as differences in the resident populations and distribution of specialist care units.
Figure 2. Geographical distribution of fungaemia rates due to yeast per 100,000 population (England) 2022

Species distribution
Ninety-one per cent of 2,265 yeast BSI reported in 2022 were identified to species level in England, similar to previous years (Table 2). The most frequently identified species was Candida albicans (881 reports, 39%), a decrease from 2021 (912 reports, 42%). The second most commonly reported yeast species in England in 2022 was Nakaseomyces glabratus (28%), followed by Candida parapsilosis (12%).
Table 2. Reports of fungaemia by yeast species (England) 2018 to 2022 [note 1]
| Named yeast | 2018 | (%) | 2019 | (%) | 2020 | (%) | 2021 | (%) | 2022 | (%) |
|---|---|---|---|---|---|---|---|---|---|---|
| Candida spp. | 1,809 | (100) | 1,833 | (100) | 2,033 | (100) | 2,172 | (100) | 2,265 | (100) |
| Candida albicans | 687 | (38) | 725 | (40) | 889 | (44) | 912 | (42) | 881 | (39) |
| Candida auris | 0 | (0) | 5 | (<1) | 1 | (<1) | 4 | (<1) | 1 | (<1) |
| Candida dubliniensis | 43 | (2) | 41 | (2) | 42 | (2) | 61 | (3) | 72 | (3) |
| Candida metapsilosis | 3 | (<1) | 1 | (<1) | 2 | (<1) | 4 | (<1) | 7 | (<1) |
| Candida parapsilosis | 200 | (11) | 201 | (11) | 251 | (12) | 294 | (14) | 274 | (12) |
| Candida tropicalis | 66 | (4) | 74 | (4) | 61 | (3) | 53 | (3) | 84 | (4) |
| Candida spp., sp. not recorded | 232 | (13) | 174 | (9) | 201 | (10) | 213 | (10) | 212 | (9) |
| Clavispora lusitaniae (previously Candida lusitaniae) | 18 | (1) | 31 | (2) | 31 | (2) | 42 | (2) | 42 | (2) |
| Kluveromyces marxianus (previously Candida kefyr) | 3 | (<1) | 6 | (<1) | 4 | (<1) | 11 | (<1) | 5 | (<1) |
| Nakaseomyces glabratus (previously Candida glabrata) | 516 | (29) | 522 | (28) | 508 | (25) | 529 | (24) | 630 | (28) |
| Pichia kudriavzevii (previously Candida krusei) | 18 | (1) | 28 | (2) | 19 | (1) | 30 | (1) | 33 | (1) |
| Yeast spp., other named [note 2] | 23 | (1) | 25 | (1) | 24 | (1) | 19 | (<1) | 22 | (1) |
[note 1] Data presented are for routine laboratory reports only and may not match those presented in other sources.
[note 2] Including C. africana, C. blankii, C. haemulonii, Pichia cactophila (C. inconspicua), Starmerella magnoliae (C. magnoliae), Nakaseomyces nivariensis (C. nivariensis), Pichia norvegensis (C. norvegensis), C. orthopsilosis, Nakazawaea peltata (C. peltata), C. sake, Starmerella sorbosivorans (C. sorbosivorans), Pichia jadinii (C. utilis).
Age and sex distribution
Fungaemia due to yeast continues to be the most prevalent in the youngest and oldest members of the population (Figure 3).
Figure 3. Rates of BSI due to yeast by age and sex (England) 2022
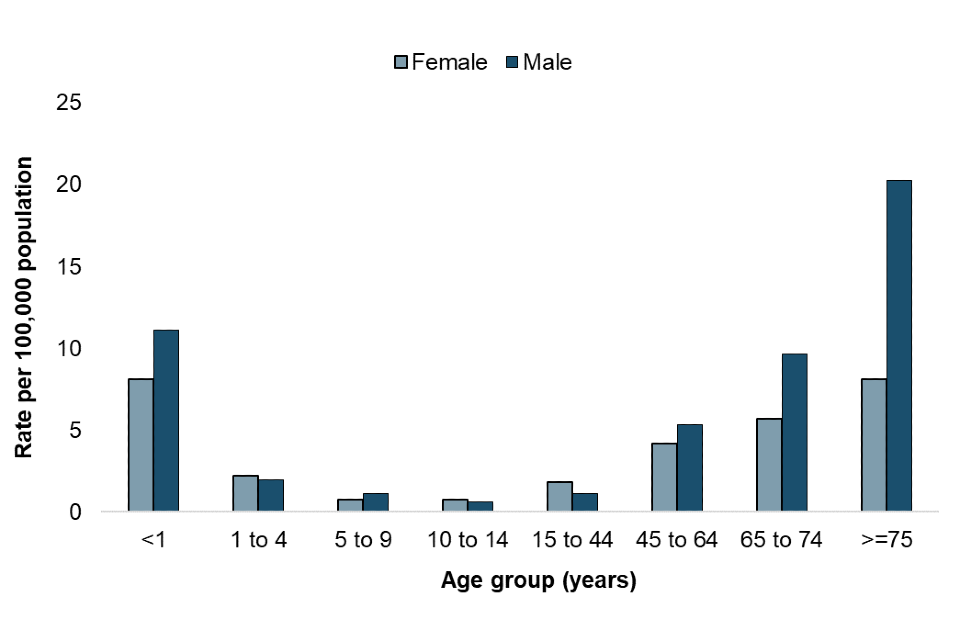
Children under 1 year of age had an overall rate of 9.7 per 100,000 population in 2022. This was higher in males than females (11.1 vs 8.1 per 100,000 population), and considerably higher than for older children. The rate of BSI due to yeast per 100,000 population in the 1 to 4 year, 5 to 9 year and 10 to 14 year age groups was 2.1, 0.9 and 0.7 respectively.
The highest overall rate of BSI due to yeast was seen in persons aged 75 years and over (13.3 per 100,000 population). This is consistent with findings in previous years (7) and is likely due to greater exposure to risk factors for invasive fungal disease such as invasive surgical procedures and prolonged use of broad spectrum antibiotics. Sex differences were more significant in older age groups; in persons aged 75 years and over, 12.2 more men (per 100,000 population) had BSI due to yeast in 2022 than women (males 20.3 per 100,000 and females 8.1 per 100,000). Whilst the highest rate for men was in the 75 years and over category, in females the highest rates of BSI due to yeast were seen in children under 1 year of age and females 75 years and over (both 8.1 per 100,000, Figure 3).
Antifungal resistance
Susceptibility test results for amphotericin B, caspofungin, fluconazole, flucytosine and voriconazole were obtained from the SGSS AMR module. The percentage of named yeast isolates with reported antifungal susceptibility testing results in 2022 ranged from 70% (1,587/2,265 isolates) for fluconazole to 37% (840/2,265 isolates) for flucytosine.
The percentage of yeast species from episodes of fungaemia reported as resistant to fluconazole was 6% in 2022, the same as in 2018 (Table 3a). The percentage resistant to voriconazole and caspofungin decreased between 2018 to 2022 from 5% to 4% and from 3% to 2% respectively. The percentage of yeast BSI isolates resistant to amphotericin B and flucytosine has remained stable over the 5 years.
Overall, the percentage of isolates of C. albicans displaying resistance to antifungal agents has remained low. Of isolates tested in 2022; no isolates were resistant to caspofungin, 1% (or less) were resistant to amphotericin B, fluconazole and voriconazole, 2% were resistant to flucytosine. The percentage of C. albicans with intermediate susceptibility to fluconazole increased to 2% from <1% in previous years. (Table 3b).
Abbreviations used in the following tables are as follows: S = susceptible; I = intermediate (reduced susceptibility); R = resistant.
Table 3a. Antifungal susceptibility for yeast isolates from fungaemia (England) 2018 to 2022
| Antifungal agent | 2018: number tested | 2018: S (%) | 2018: I (%) | 2018: R (%) | 2019: number tested | 2019: S (%) | 2019: I (%) | 2019: R (%) | 2020: number tested | 2020: S (%) | 2020: I (%) | 2020: R (%) | 2021: number tested | 2021: S (%) | 2021: I (%) | 2021: R (%) | 2022: number tested | 2022: S (%) | 2022: I (%) | 2022: R (%) |
|---|---|---|---|---|---|---|---|---|---|---|---|---|---|---|---|---|---|---|---|---|
| Amphotericin B | 1,197 | 99 | <1 | <1 | 1,276 | 98 | <1 | <1 | 1,312 | 98 | <1 | 1 | 1,530 | 99 | <1 | <1 | 1,563 | 99 | <1 | 1 |
| Caspofungin | 938 | 94 | 4 | 3 | 886 | 90 | 7 | 3 | 980 | 92 | 5 | 3 | 1,110 | 94 | 3 | 3 | 1,125 | 95 | 4 | 2 |
| Fluconazole | 1,221 | 84 | 10 | 6 | 1,250 | 85 | 9 | 6 | 1,313 | 88 | 8 | 4 | 1,568 | 87 | 7 | 5 | 1,587 | 83 | 11 | 6 |
| Flucytosine | 724 | 96 | <1 | 3 | 782 | 98 | <1 | 1 | 819 | 96 | <1 | 3 | 948 | 96 | <1 | 3 | 840 | 95 | 2 | 3 |
| Voriconazole | 1,143 | 91 | 4 | 5 | 1,233 | 91 | 5 | 4 | 1,255 | 93 | 3 | 4 | 1,397 | 94 | 2 | 4 | 1,344 | 92 | 4 | 4 |
View the corresponding table (“appendix table SI4a”) in the data tables file associated with this report ‘Bloodstream infection due to Candida etc (England, 2022): data tables’.
Table 3b. Antifungal susceptibility for C. albicans isolates from fungaemia (England) 2018 to 2022
| Antifungal agent | 2018: number tested | 2018: S (%) | 2018: I (%) | 2018: R (%) | 2019: number tested | 2019: S (%) | 2019: I (%) | 2019: R (%) | 2020: number tested | 2020: S (%) | 2020: I (%) | 2020: R (%) | 2021: number tested | 2021: S (%) | 2021: I (%) | 2021: R (%) | 2022: number tested | 2022: S (%) | 2022: I (%) | 2022: R (%) |
|---|---|---|---|---|---|---|---|---|---|---|---|---|---|---|---|---|---|---|---|---|
| Amphotericin B | 491 | 99 | 0 | <1 | 520 | 99 | <1 | 1 | 604 | 98 | <1 | 1 | 726 | 99 | <1 | <1 | 697 | 99 | <1 | <1 |
| Caspofungin | 413 | 98 | 0 | 2 | 401 | 99 | <1 | 1 | 494 | 98 | <1 | 1 | 566 | 98 | <1 | 1 | 518 | 100 | <1 | 0 |
| Fluconazole | 550 | 99 | <1 | <1 | 623 | 98 | <1 | 1 | 727 | 99 | <1 | 1 | 850 | 99 | <1 | 1 | 796 | 97 | 2 | 1 |
| Flucytosine | 299 | 97 | 0 | 3 | 312 | 99 | 0 | <1 | 383 | 97 | 0 | 3 | 470 | 97 | <1 | 3 | 415 | 98 | <1 | 2 |
| Voriconazole | 493 | 98 | 1 | 1 | 522 | 99 | 0 | 1 | 591 | 97 | <1 | 2 | 669 | 99 | <1 | <1 | 605 | 98 | <1 | <1 |
View the corresponding table (“appendix table SI4b”) in the data tables file associated with this report ‘Bloodstream infection due to Candida etc (England, 2022): data tables’.
Antifungal resistance was higher in Nakaseomyces glabratus isolates for amphotericin B, caspofungin, fluconazole and voriconazole compared to C. albicans, although it was lower for flucytosine (<1%) (Table 3c). Resistance in 2022 was highest to fluconazole and voriconazole, at 15% and 12% respectively. Conversely, the percentage of N. glabratus isolates resistant to caspofungin has reduced from a peak of 9% in 2020 to 4% in 2022. This is possibly due to more robust strip diffusion methodologies being employed for caspofungin in place of notoriously unreliable broth dilution methods for this drug.
Interpreting resistance trends in N. glabratus has been difficult due to differences in the standard breakpoints used by laboratories to define antifungal susceptibility. The European Committee on Antimicrobial Susceptibility Testing (EUCAST) and the Clinical and Laboratory Standards Institute (CLSI) breakpoints for fluconazole previously differed in their interpretation. However introduction of the EUCAST ‘Susceptible Increased exposure’ category now aligns more closely with the CLSI ‘susceptible-dose-dependent’ category (indicating that the isolate is susceptible with high doses of fluconazole) (8, 9); this could account for the decrease in the percentage of isolates resistant to fluconazole (Table 3c). EUCAST methodology does not currently have a N. glabratus breakpoint for voriconazole, due to insufficient evidence that this antifungal should be used in the treatment of N. glabratus (10). Further, for caspofungin susceptibility testing, only the Etest method is reliable, which requires expertise to read; many laboratories are moving to anidulafungin as a sentinel echinocandin instead, as resistance mutations in some yeast isolates confer resistance to both drugs (11).
For C. parapsilosis, consistently the third most common yeast species causing fungaemia in England, levels of resistance are generally low (Table 3d). In 2022, no C. parapsilosis isolates were found to be resistant to flucytosine, <1% were resistant to amphotericin B and voriconazole. Only 1% were resistant to caspofungin and 2% were resistant to fluconazole. The percentage of resistant C. parapsilosis isolates has remained relatively stable since 2018, except for fluconazole and voriconazole, for which resistance levels peaked in 2021 (fluconazole 2021: 4%, otherwise 2%; voriconazole 2021: 2% otherwise 1% or less). This should be monitored as there are increasing reports of fluconazole resistant C. parapsilosis from areas such as Spain, Italy, Turkey, South America and South Africa (12).
Table 3c. Antifungal susceptibility for Nakaseomyces glabratus isolates from fungaemia (England) 2018 to 2022
| Antifungal agent | 2018: number tested | 2018: S (%) | 2018: I (%) | 2018: R (%) | 2019: number tested | 2019: S (%) | 2019: I (%) | 2019: R (%) | 2020: number tested | 2020: S (%) | 2020: I (%) | 2020: R (%) | 2021: number tested | 2021: S (%) | 2021: I (%) | 2021: R (%) | 2022: number tested | 2022: S (%) | 2022: I (%) | 2022: R (%) |
|---|---|---|---|---|---|---|---|---|---|---|---|---|---|---|---|---|---|---|---|---|
| Amphotericin B | 412 | 99 | <1 | <1 | 403 | 99 | 1 | <1 | 385 | 99 | 0 | <1 | 410 | 100 | <1 | 0 | 452 | 98 | 0 | 2 |
| Caspofungin | 279 | 90 | 6 | 4 | 248 | 79 | 15 | 6 | 249 | 77 | 14 | 9 | 256 | 83 | 8 | 9 | 325 | 87 | 9 | 4 |
| Fluconazole | 340 | 91* | 91* | 9 | 285 | 89* | 89* | 11 | 268 | 91* | 91* | 9 | 302 | 88* | 88* | 12 | 372 | 85* | 85* | 15 |
| Flucytosine | 240 | 98 | <1 | 2 | 255 | 100 | 0 | <1 | 230 | 100 | <1 | 0 | 225 | 99 | 0.4 | <1 | 219 | 98 | 1 | <1 |
| Voriconazole | 332 | 80 | 10 | 10 | 356 | 76 | 13 | 11 | 321 | 80 | 8 | 12 | 323 | 84 | 4.0 | 12 | 326 | 75 | 13 | 12 |
*For Fluconazole susceptible and intermediate isolates have been combined to form a “susceptible-dose-dependent” (SDD) category, indicating that a higher dose should be employed if fluconazole chosen for treatment. Please note that SDD percentages have been entered into both “Susceptible” and “Intermediate” columns within this table.
View the corresponding table (“appendix table SI4c”) in the data tables file associated with this report ‘Bloodstream infection due to Candida etc (England, 2022): data tables’.
Table 3d. Antifungal susceptibility for Candida parapsilosis isolates from fungaemia (England) 2018 to 2022
| Antifungal agent | 2018: number tested | 2018: S (%) | 2018: I (%) | 2018: R (%) | 2019: number tested | 2019: S (%) | 2019: I (%) | 2019: R (%) | 2020: number tested | 2020: S (%) | 2020: I (%) | 2020: R (%) | 2021: number tested | 2021: S (%) | 2021: I (%) | 2021: R (%) | 2022: number tested | 2022: S (%) | 2022: I (%) | 2022: R (%) |
|---|---|---|---|---|---|---|---|---|---|---|---|---|---|---|---|---|---|---|---|---|
| Amphotericin B | 145 | 100 | 0 | 0 | 169 | 100 | 0 | 0 | 169 | 99 | <1 | <1 | 215 | 100 | 0 | 0 | 205 | 100 | 0 | <1 |
| Caspofungin | 139 | 90 | 9 | 1 | 139 | 90 | 9 | 1 | 156 | 96 | 4.5 | 0 | 191 | 98 | 2 | 0 | 155 | 97 | 3 | <1 |
| Fluconazole | 174 | 98 | 0 | 2 | 186 | 97 | 1 | 2 | 192 | 98 | 0 | 2 | 250 | 94 | 1 | 4 | 218 | 96 | 1 | 2 |
| Flucytosine | 95 | 99 | 0 | 1 | 116 | 100 | 0 | 0 | 111 | 99 | <1 | 0 | 138 | 99 | 0 | 1 | 95 | 99 | 1 | 0 |
| Voriconazole | 159 | 98 | <1 | 1 | 167 | 99 | 0 | 1 | 185 | 99 | <1 | 0 | 226 | 97 | <1 | 2 | 208 | 100 | 0 | <1 |
View the corresponding table (“appendix table SI4d”) in the data tables file associated with this report ‘Bloodstream infection due to Candida etc (England, 2022): data tables’.
However, British and European guidelines on fungal diagnostics and management (13, 14) emphasising the role of rapid diagnosis and identification of clinically significant fungal isolates to species level, as well as the need for susceptibility testing, may have also helped to raise awareness among healthcare professionals and therefore improved reporting of antifungal susceptibility test results. Further increases in the levels of antifungal susceptibility testing are needed to improve our understanding of resistance trends, inform antifungal stewardship activities and improve patient outcomes for yeast species bloodstream infections. However, there is an increasing literature that provides the usual antifungal susceptibility patterns for many species of Candida and allied genera that may aid to inform therapeutic decisions (15).
Acknowledgements
These reports would not be possible without the weekly contributions from microbiology colleagues in laboratories across England, without whom there would be no surveillance data. The support from mycology experts, colleagues within the UK Health Security Agency and the UKHSA Mycology Reference Laboratory (16) in particular, is valued in the preparation of the report.
Feedback and specific queries about this report are welcome and can be sent to hcai.amrdepartment@ukhsa.gov.uk
References
1. Borman AM and Johnson EM (2021). ‘Name changes for fungi of medical importance, 2018 to 2019.’ Journal of Clinical Microbiology: volume 59, issue 2
2. Office for National Statistics (ONS). ‘Mid-year population estimates for England, Wales and Northern Ireland’
3. Schelenz S and others (2015). ‘British Society for Medical Mycology best practice recommendations for the diagnosis of serious fungal diseases.’ Lancet Infectious Diseases: volume 15, issue 4, pages 461 to 474
4. Borman AM and others (2021). ‘The considerable impact of the SARS-CoV-2 pandemic and COVID-19 on the UK National Mycology Reference Laboratory activities and workload.’ Medical Mycology: doi:10.1093/mmy/myab038
5. Shoham S and Marwaha S (2009). ‘Invasive fungal infections in the ICU.’ Journal of Intensive Care Medicine: volume 25, issue 2, pages 78 to 92
6. UKHSA (2022). ‘ESPAUR report 2021 to 2022: chapter 2 data tables.’ ESPAUR report 2021 to 2022
7. UKHSA (2019). ‘Laboratory surveillance of candidaemia in England, Wales and Northern Ireland: 2020’. Health Protection Report: volume 15, number 15
8. Arendrup MC and others (2014). ‘EUCAST technical note on Candida and micafungin, anidulafungin and fluconazole.’ Mycoses: volume 57, issue 6, pages 377 to 379
9. Pfaller MA and others (2010). ‘Wild-type MIC distributions, epidemiological cut-off values and species-specific clinical breakpoints for fluconazole and candida: time for harmonization of CLSI and EUCAST broth microdilution methods.’ Drug Resistance Update: volume 13: pages 180 to 195
10. The European Committee on Antimicrobial Susceptibility Testing (2020). ‘Breakpoint tables for interpretations of MICs for antifungal agents’ (version 10.0)
11. Johnson EM and Arendrup MC (2019). ‘Susceptibility test methods: yeast and filamentous fungi.’ In: Manual of Clinical Microbiology (Twelfth edition; Volume 2: pages 351 to 2,375). Editors: Carroll KC, Pfaller MA, Landry ML, McAdam AJ, Patel R, Richter SS and Warnock DW. ASM Press
12. Daneshnia F and others (2023). ‘Worldwide emergence of fluconazole-resistant Candida parapsilosis: current framework and future research roadmap’. The Lancet Microbe Review: volume 4, issue 6, pages e470 to e480
13. Ashbee HR and others (2014). ‘Therapeutic drug monitoring (TDM) of antifungal agents: guidelines from the British Society for Medical Mycology.’ Journal of Antimicrobial Chemotherapy: volume 69, issue 5, pages 1,162 to 1,176
14. Cuenca-Estrella M and others (2012). ‘European Society for Clinical microbiology and Infectious Diseases guideline for diagnosis and management of Candida diseases 2012.’ Diagnostic Procedures: volume 18, issue 7, pages 9 to 18
15. Borman AM and others (2020). ‘MIC distributions for amphotericin B, fluconazole, itraconazole, voriconazole, flucytosine and anidulafungin and 35 uncommon pathogenic yeast species from the UK determined using the CLSI broth microdilution method’. Journal of Antimicrobial Chemotherapy: volume 75, issue 5, pages 1,194 to 1,205