Cancer registration statistics, England: first release, 2018
Updated 27 January 2020

© Crown copyright 2020
This publication is licensed under the terms of the Open Government Licence v3.0 except where otherwise stated. To view this licence, visit nationalarchives.gov.uk/doc/open-government-licence/version/3 or write to the Information Policy Team, The National Archives, Kew, London TW9 4DU, or email: psi@nationalarchives.gov.uk.
Where we have identified any third party copyright information you will need to obtain permission from the copyright holders concerned.
This publication is available at https://www.gov.uk/government/statistics/cancer-registration-statistics-england-2018/cancer-registration-statistics-england-first-release-2018
1. Main points
In England, on average there were 868 new diagnoses of invasive cancer each day in 2018, a total of 316,680 new diagnoses.
Prostate cancer was the most common cancer diagnosis in 2018.
The number of registrations of invasive cancers in males increased mainly because of the ‘Fry and Turnbull effect’ in prostate cancer.
2. Things you need to know
This is the first, provisional, release of Cancer registration statistics for diagnoses in 2018. The full release will be published in spring 2020. The date will be announced in the gov.uk release calendar.
These cancer registration statistics are National Statistics. This release contains provisional data of cancer registration counts in Table 1. Table 2 contains incidence rates. Each table contains data split by sex, five-year age groups and by cancer site (type) within the body.
This release follows the methods outlined in the Cancer registration statistics methodology report. The full release will use the same methods.
The number of cancers registered (incidence) is one way to measure the occurrence of cancer in England. Cancer incidence, mortality and survival help determine the burden of cancer for a country.
Cancer incidence data informs policy on the prevention of cancer. When combined with mortality data, incidence data is used to calculate cancer survival. Cancer incidence and survival supports policy on cancer prevention and treatment. Several performance indicators for the healthcare system use cancer survival.
3. There were large increases in the number of prostate and breast cancers diagnosed in 2018
In 2018, there were 316,680 new cases of invasive cancer (excluding non-melanoma skin cancers) diagnosed in England. This means that, on average, 868 cancers were diagnosed each day in 2018. There were more cancers diagnosed in males (165,228) than females (151,452).
The majority (93.2%) of cancer registrations were registered in 24 sites of the body. Just over half (54.0%) of all registrations were either breast, prostate, lung or bowel cancer.
Prostate cancer was the most commonly diagnosed cancer in 2018. This is the first time breast cancer has been overtaken as the most commonly diagnosed cancer. There were 7,828 more registrations of prostate cancer made in 2018 than in 2017. The ‘Fry and Turnbull effect’ raised symptom awareness of prostate cancer.
There were 1,686 more registrations of female breast cancer made in 2018 than in 2017.
The difference in the number of all invasive cancers registered between males and females increased from 7,205 cases in 2017 to 13,776 cases in 2018.
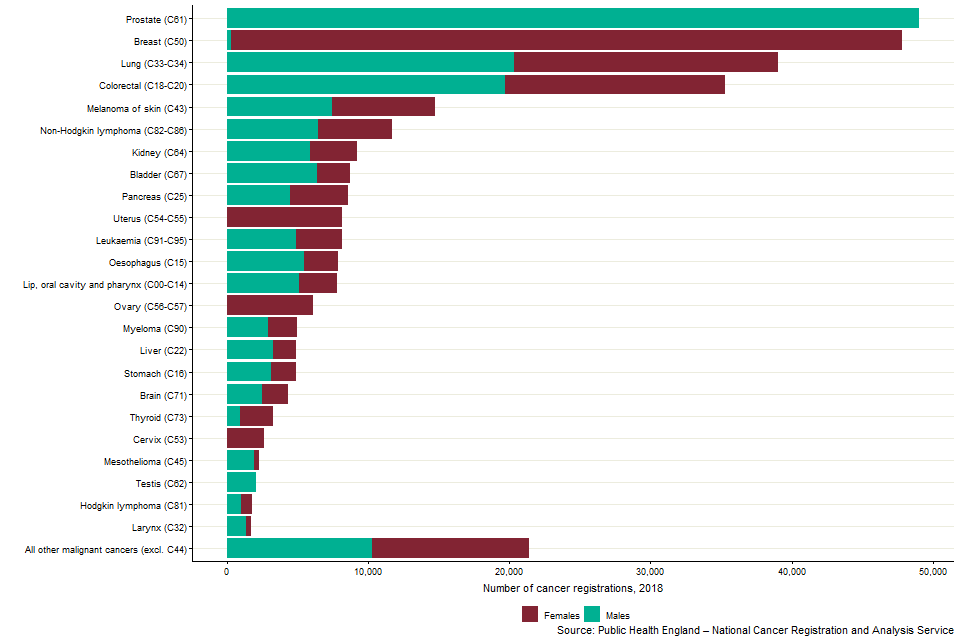
Figure 1: The number of cancer registrations by 24 common sites, England, 2018
Notes:
- The International Classification of Diseases 10th Revision (ICD-10) was used to classify cancer sites. Non-melanoma skin cancers (ICD-10 C44) were excluded.
- All ages combined.
4. Links to other related statistics
We use the cancer registrations from here and previous publications to produce:
- Cancer survival in England publishes estimates of adult cancer survival for common cancer types. We estimate survival by stage at diagnosis where possible. This publication also provides cancer survival estimates for children diagnosed with cancer. All output is for England only, with no regional reporting.
- Geographic patterns of cancer survival in England publishes estimates of adult cancer survival for common cancer types. We report using the regional geographies of Cancer Alliances (CAs) and Sustainability and Transformation Partnerships (STPs)
- Index of cancer survival for Clinical Commissioning Groups (CCGs) in England is presented for CCGs, CAs, STPs and England. We publish separate estimates for breast, colorectal and lung cancers.
You can find information on the contents and uses of all the cancer publications in the article ‘Cancer statistics explained: different data sources and when they should be used’.
5. Quality and methodology
The Cancer registration statistics Quality and Methodology Information report contains important information on:
- the strengths and limitations of the data and how it compares with related data
- uses and users of the data
- how the output was created
- the quality of the output including the accuracy of the data
When referring to “invasive cancer”, we refer to all invasive tumours excluding non-melanoma skin cancers. The International Classification of Diseases, tenth revision (ICD-10) defines the cancer sites. Using ICD-10 codes, ‘all invasive cancers’ is C00 to C97 excluding C44 (non-melanoma skin cancer).
Although non-melanoma skin cancer (NMSC) is very common, the available figures are known to be under-estimates and unreliable for comparison purposes. This is because the policies and practices for the recording of NMSC have varied among the cancer registries. We express the age-standardised rates in this release per 100,000 population. The rates use the European Standard Population 2013 to standardise them. Standardisation allows users to make robust comparisons between:
- males and females
- different registration years
- geographical areas.
Cancer incidence rates use the appropriate mid-year population estimates for the registration year.
The National Cancer Registration and Analysis Service (NCRAS) in Public Health England (PHE) collects cancer registrations in England. NCRAS collects data from healthcare providers, including pathology laboratories. NCRAS collates and validates all the data for each registration. Validated registrations are then used in statistical outputs.
We have taken care to ensure the data quality of this first release. Figures published here may be subject to change when we publish more detailed analysis in summer 2020. Any change from the provisional data is likely to be small.
Cancer registrations in England can take up to 5 years after the end of a calendar year to reach 100% completeness. This is because of the continuing accrual of late registrations. Further changes may still occur after 5 years following later diagnostic testing. These late changes are uncommon.
6. Authors
Responsible statistician: John Broggio
Production team: John Broggio, Kwok Wong
For queries relating to this bulletin contact ncrasenquiries@phe.gov.uk
7. Acknowledgements
Data for this work is based on patient-level information collected by the NHS, as part of the care and support of cancer patients. The data is collated, maintained and quality assured by the National Cancer Registration and Analysis Service, PHE.