Warwickshire (edge area) year end report 2021
Updated 16 February 2023

© Crown copyright 2023
This publication is licensed under the terms of the Open Government Licence v3.0 except where otherwise stated. To view this licence, visit nationalarchives.gov.uk/doc/open-government-licence/version/3 or write to the Information Policy Team, The National Archives, Kew, London TW9 4DU, or email: psi@nationalarchives.gov.uk.
Where we have identified any third party copyright information you will need to obtain permission from the copyright holders concerned.
This publication is available at https://www.gov.uk/government/publications/bovine-tb-epidemiology-reports-2021/warwickshire-edge-area-year-end-report-2021
Introduction
The Edge Area was originally established in 2013. In 2014, the bovine tuberculosis (TB) surveillance strategy for this area was incorporated into the UK Government’s Strategy to achieve Officially Bovine Tuberculosis-Free (OTF) status for England by 2038. A key action was to recognise the different levels of TB in different parts of the country and to vary the approach to control accordingly. The aim is to obtain OTF status for the Edge Area as soon as possible.
This report describes the frequency and geographical distribution of TB in 2021 in cattle herds in Warwickshire, which forms part of the Edge Area. It examines what factors are likely to be driving TB in this area, and the risks the disease in this county may pose to neighbouring areas.
County map of England showing the Edge Area and highlighting the county of Warwickshire.
TB in cattle and other mammals is primarily caused by the bacterium Mycobacterium bovis (M. bovis), and the disease is subsequently referred to in this report as TB. Although other sources may refer to TB ‘breakdowns’, this report will use the term ‘incidents’ throughout.
This report is intended for individuals involved in the control of TB, both locally and nationally. This includes, but is not limited to farmers, veterinarians, policy makers and the scientific community.
Details of the data handling methodology used in this report, a glossary of terms, and the TB control measures adopted in the Edge Area, can be found in the explanatory supplement for the annual reports 2021.
Types of TB incident
Unless otherwise specified, this report includes all new TB incidents detected during the reporting period. This includes ‘Officially Tuberculosis-Free Status Withdrawn’ (OTF-W) incidents and ‘Officially Tuberculosis-Free Status Suspended’ (OTF-S) incidents.
OTF-W incidents are those involving one or more test reactors with typical lesions of TB identified at post-mortem meat inspection, or one or more animals with M. bovis- positive culture results from tissue samples collected from carcases during the post-mortem inspection, or both.
OTF-S incidents are triggered by reactors to the Single Intradermal Comparative Cervical Tuberculin (SICCT) test, but without subsequent detection of TB lesions or positive culture results in any of those animals.
TB incidents in Approved Finishing Units (AFUs) without grazing are not included in the prevalence and incidence calculations in this report due to the limited epidemiological impact of these incidents.
Furthermore, herds restricted because of an overdue test rather than a TB incident are also excluded from calculations. Hence measures of incidence and prevalence in this report may be lower than those reported in the official TB statistics.
Cattle industry
Small herds of up to 50 cattle continued to predominate in the county, as indicated in Appendix 1. Beef animals accounted for 71% of the total cattle population of Warwickshire in 2021, as shown in Appendix 2. There were 14 Approved Finishing Units (AFUs) in total, with one new AFU licensed by APHA in 2021.
Cattle herds in Warwickshire routinely undergo 6-monthly TB testing by default. However, 31% of cattle herds were regarded as having a lower risk of contracting TB and thus eligible for less frequent (annual) testing under the earned recognition scheme in 2021.
There is a single livestock auction market in the county (Rugby Farmers’ Market). This market is also licenced to trade TB-restricted cattle. Other markets used are Thrapston and Thame in Northamptonshire and Oxfordshire respectively, both in the Edge Area and bordering Warwickshire.
Two cattle abattoirs operate in Warwickshire.
There are 30 pieces of common land registered in the county. However, none were linked to any TB incidents in 2021. Grazing common land can be a high-risk strategy as cattle from multiple herds can mix freely.
New TB incidents
The number of new TB incidents continued to decrease in 2021 compared to 2020 (56, down from 64, see Figure 1). This was the fourth consecutive year that there has been an overall decrease in the number of new incidents in Warwickshire.
This reduction in new TB incidents was only observed in the original Edge Area part of the county (23 new TB incidents), with a 26% decrease in this area compared to 2020 (31 new TB incidents). In the original High Risk Area (HRA) portion the number of new TB incidents remained the same in 2020 and 2021 (33).
A lower number and proportion of the new TB incidents were classified as OTF-W across the whole county compared to 2020. There were 29 OTF-W incidents in 2021 (52% of total incidents), a reduction from 47 (73% of total incidents) in 2020.
Figure 1: Annual number of new TB incidents in Warwickshire, from 2012 to 2021, showing incidents for the whole county and the original Edge Area.

For 2021 there were 29 OTF-W incidents and 27 OTF-S incidents for the whole county. In the original Edge area of the county there were 10 OTF-W and 13 OTF-S incidents.
TB in other species
In 2021 there was one incident of TB in a non-bovine species. One alpaca herd sustained a laboratory confirmed TB incident with two reactors removed. The most likely pathway for infection of this herd was direct or indirect contact with badgers, as they were living in the same field as the TB reactor alpaca’s.
Incidence of TB
Warwickshire had the second highest (13.1) TB incidence per 100 herd-years at risk out of the 11 Edge Area counties. However, it has remained in decline for the second consecutive year, as shown in Figure 2.
Figure 2: Annual incidence rate (per 100 herd-years at risk) for all new incidents (OTF-W and OTF- S) in Warwickshire, from 2012 to 2021, showing incidents for the whole county and the original Edge Area.

For 2021 the incidence rate was 11.5 incidents per 100 herd-years at risk for the whole county, and 7.6 incidents per 100 herd-years at risk for the original Edge Area of the county.
Prevalence of TB
Whole county herd prevalence decreased for the third consecutive year in 2021, to 5.4%, as indicated in Figure 3.
Figure 3: Annual end of year prevalence in Warwickshire, from 2012 to 2021, showing incidents for the whole county and the original Edge Area.

Line chart showing the year-end TB herd prevalence in Warwickshire between 2012 and 2021. For 2021 this was 5.40% for the whole county and 2.59% for the original Edge Area of the county.
Incident testing has an impact on the length of farm restrictions. In 2021, the minimum testing requirement for all herds with TB incidents in the Edge Area was 2 consecutive Short-Interval Tests (SITs) with negative results at the severe interpretation of the tuberculin skin test. The median duration of OTF-W incidents was 238 days, and the median duration of OTF-S incidents was 168 days. This is a reduction from the 2020 figures of 262 and 192 respectively, indicating that herds are clearing infection quicker.
Two persistent incidents remained open at the end of 2021 (herds under movement restrictions for more than 550 days).
Traditionally, in 6-monthly surveillance testing areas farmers prefer to test animals at housing (autumn) and turnout (spring). Thus, in previous years, there was a notable peak in the number of TB incidents disclosed in October to November and March to April related to the frequency of testing. Figure 4 shows an unexpected peak in July 2021.
The number of tests carried out was consistent with other summer months (approximately 4,000 per month). Analysis of the test type data has not readily clarified the reason for this. Data from further years is needed to assess if this is a new pattern.
Figure 4: Number of new TB incidents (OTF-W and OTF-S) in Warwickshire in 2021, by month of disclosure.
| Month | OTF-W | OTF-S | Total |
|---|---|---|---|
| January | 4 | 1 | 5 |
| February | 4 | 4 | 8 |
| March | 5 | 3 | 8 |
| April | 2 | 4 | 6 |
| May | 1 | 3 | 4 |
| June | 1 | 1 | 2 |
| July | 2 | 4 | 6 |
| August | 2 | 0 | 2 |
| September | 1 | 2 | 3 |
| October | 4 | 0 | 4 |
| November | 1 | 1 | 2 |
| December | 2 | 4 | 6 |
Geographical distribution of TB incidents
Warwickshire’s incidence rate (13.1 incidents per 100 herd-years at risk) remains above the incidence for the Edge Area overall (8.9), despite the decrease observed in 2021 (see Figure 2). Whilst the bordering counties of Oxfordshire (Edge), Worcestershire, Gloucestershire and Staffordshire (HRA) also had a decreasing incidence in 2021 from 2020, they still represented a significant risk.
High-density cattle populations are generally associated with greater numbers of incidents, especially when combined with proximity to endemic areas. New TB incidents in 2021 were disclosed mainly in the southern part of the county, particularly on the borders with Oxfordshire, Gloucestershire and Northamptonshire. There was also a cluster in the west of Warwickshire, as shown in Figure 5.
Figure 5: Location of cattle holdings in Warwickshire with new TB incidents (OTF-W and OTF-S) in 2021 and cattle holdings with pre-2021 OTF-W incidents still ongoing at the beginning of 2021, overlaid on a cattle density map. Note that ‘OTF-W Introduced 2021’ refers to OTF-W incidents in which cattle movements were the most likely source of infection.
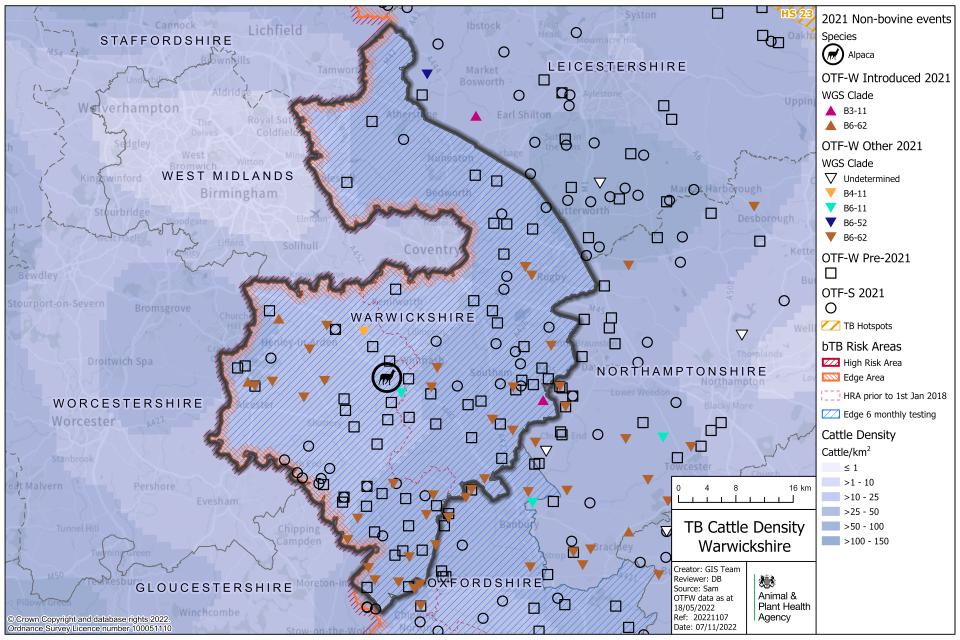
The highest concentration of incidents was on the borders with Oxfordshire and Gloucestershire.
Additional information provided by Whole Genome Sequencing (WGS) of M. bovis isolates from OTF-W incident herds shows that disease has become endemic in the south of Warwickshire. Both evidence gathered during epidemiological investigations by APHA veterinarians using disease report forms (DRFs) (Figure 6) and WGS data suggest that wildlife plays a key role in endemicity in this area (Figure 7). Badgers and deer have a suitable habitat in the southeast of the county that includes the Cotswolds wherethere is a high concentration of wild deer.
APHA moved to WGS of M. bovis isolates in 2021. Stable clusters of WGS clades tend to be found in areas where there is a persistent reservoir of infection. Previous annual reports refer to spoligotypes or genotypes; there has been no change in the strain of TB found in Warwickshire in recent years. Consistent with findings since 2017, and shown in Figure 5, the most commonly detected WGS clade of M. bovis was B6-62, associated with 90% of the OTF-W incidents (26 out of 29).
Figure 6: Map of the source of infection pathway recorded with the highest level of certainty, for all TB incidents (OTF-W and OTF-S) in Warwickshire that started in 2021. Local cattle refers to both residual infection and contiguous cattle risk pathways. Purchased refers to all cattle movement risk pathways. Wildlife refers to both badger and other wildlife risk pathways. Where none of the sources of infection were identified with greater than 50% certainty, the highest ranking source is displayed with an OTF-W undetermined ‘maximum DRF category’ symbol.
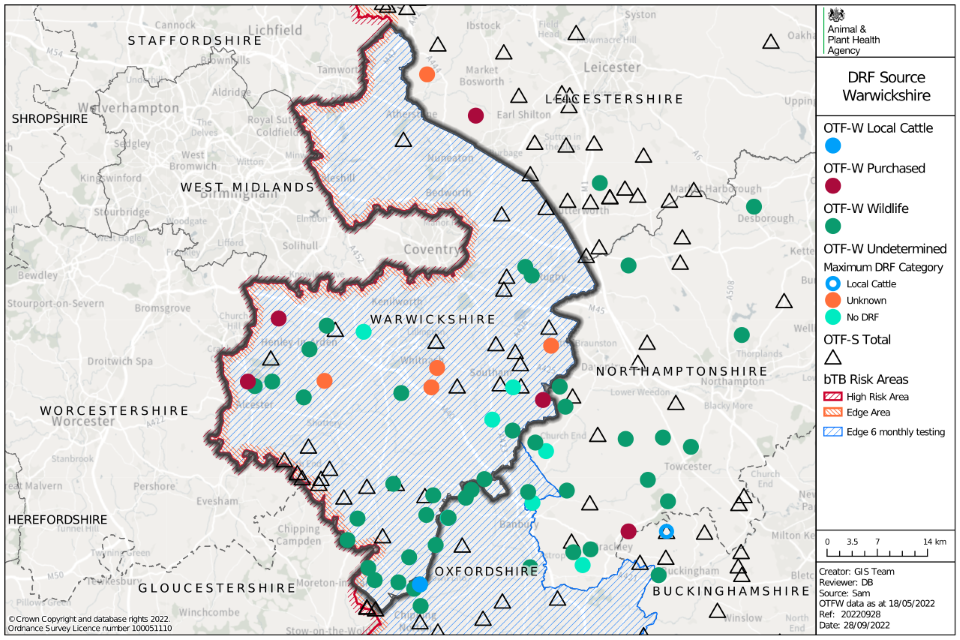
Map of Warwickshire showing data points of OTF-W as circles, and OTF-S as triangles. Colour is used to denote whether the source is from local cattle, purchased, wildlife or is undetermined.
Figure 7: WGS clades of M. bovis detected in Warwickshire between 2018 and 2021, where combined residual and wildlife sources were attributed with a 75% certainty or above according to the DRF calculation, as an indication of local M. bovis reservoir in local wildlife populations (OTF-W incidents only).
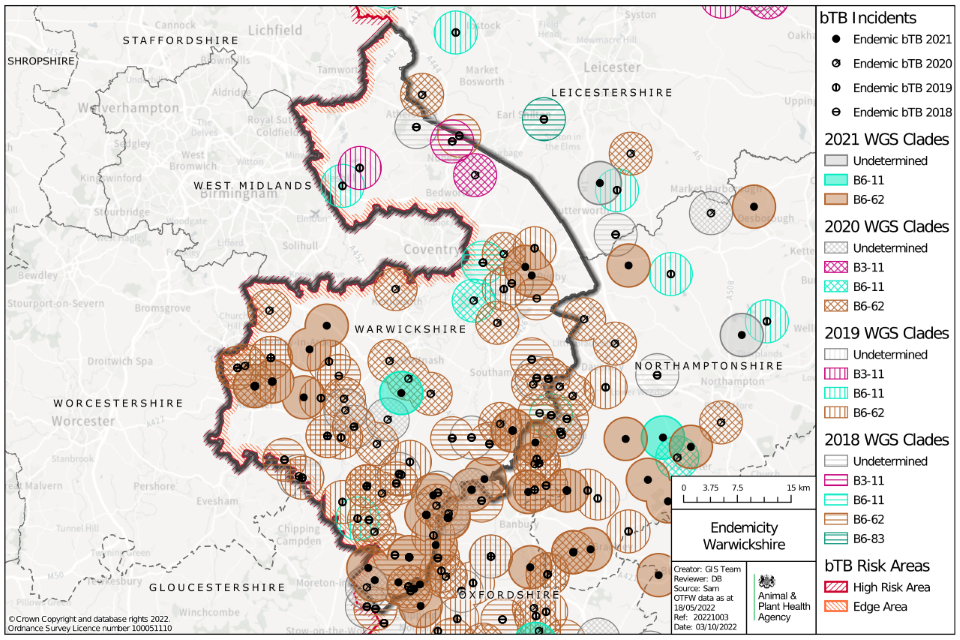
Map of Warwickshire showing locations of possible wildlife reservoirs of TB as points, between 2018 and 2021. Circles surrounding the points are coloured by TB WGS clade and year.
Main risk pathways and key drivers for TB infection
The main risk pathways and key drivers for TB infection within Warwickshire are considered here. Evidence collected during APHA veterinary investigations into the source of infection within herds is used to inform this understanding.
In 2021, 52 out of 56 (93%) of new TB incidents in Warwickshire received a preliminary or final APHA veterinary investigation to identify the source of infection.
It can be challenging to retrospectively establish the route of infection for a TB incident herd. Ideally this investigation includes a thorough on-farm investigation and scrutiny of routinely collected data; such as cattle movement records, and the results of WGS where available. Up to 3 hazards and risk pathways are selected for each incident investigated. Each of these potential sources are given a score that reflects the likelihood of that pathway being the true one, based on the available evidence.
Details of the protocol used for these investigations, and the subsequent methodology used to calculate the weighted contribution of the different suspected sources of M. bovis infection can be found in the explanatory supplement to the annual reports 2021.
The key drivers of the TB epidemic in Warwickshire during 2021 were as follows:
- exposure to probable infected badgers
- exposure to other probable infected wildlife
- purchase of undetected infected cattle
Figure 8 presents the aggregated results of the APHA investigations into the source of infection. Further details are presented in Appendix 3, Table 5.
Half of the weighted source pathways for 2021 incidents were attributed to badgers, as indicated in Figure 8. Thus, addressing the spread of infection to and from badgers is crucial. During 2021 this was achieved by continuing to provide biosecurity advice and use of badger TB control methods (both culling and vaccination). In 2021, 1,121 badgers were removed during licensed badger culling operations and 20 were vaccinated in the county.
Epidemiological data and anecdotal reports show that populations of wild deer continue to increase in the county and adjacent areas. Muntjac, roe and fallow deer are the predominant species. The risk presented by deer-cattle interactions is reflected in 12% of the weighted source pathways for cattle TB incidents in 2021 being attributed to wildlife other than badgers (see Figure 8).
Introduction of cattle with undetected infection is a risk for any cattle herd. In Warwickshire, private post-movement testing was not carried out routinely in any of the herds with OTF- W incidents in 2021. Beef finishing herds rely on buying cattle from markets, yet to date there appears to be little appetite for knowledge-based trading.
Figure 8: Summary of the weighted sources of infection for OTF-W and OTF-S TB incidents that started in 2021 in Warwickshire, that had a completed DRF (n= 52).

Sources attributed were badgers (50%), cattle movement (11%), residual infection (6%), fomite source (2%), other wildlife source (12%), and other or unknown source (20%), n=52.
Forward look
Despite a fourth consecutive annual decrease in the number of TB incidents, 2021 still saw a high number of incidents. The six-monthly routine surveillance testing of most cattle herds in Warwickshire supports the early detection of TB and reduces the potential for lateral spread of infection. Official TB Free status (OTF) for Warwickshire will not be achieved by 2025. However, progress is being made and the outlook is positive.
There are several measures that would help address the most common risk pathways for TB infection in Warwickshire. These include:
- incentivising the uptake of effective biosecurity measures
- managing the TB risks posed by cattle movements to reduce the risk of spread of TB within and between farms
- continuation and further adoption of disease control measures to prevent the spread of TB from wildlife, including biosecurity, badger vaccination and local control of the wild deer population
Appendix 1: Cattle industry demographics
Table 1: Number of cattle premises by size band in Warwickshire at 1 January 2021 (RADAR data)
| Size of herds | Number of herds in Warwickshire |
|---|---|
| Undetermined | 5 |
| 1-50 | 239 |
| 51-100 | 97 |
| 101-200 | 83 |
| 201-350 | 48 |
| 351-500 | 12 |
| 501+ | 16 |
| Total number of herds | 500 |
| Mean herd size | 106 |
| Median herd size | 52 |
Table 2: Number (and percentage of total) of animals by breed purpose in Warwickshire at 1 January 2021
| Breed purpose | Number (and percentage of total) cattle in Warwickshire |
|---|---|
| Beef | 38,049 (71%) |
| Dairy | 12,698 (23%) |
| Dual purpose | 2,262 (4%) |
| Unknown | 0 |
| Total | 53,009 |
Appendix 2: Summary of headline cattle TB statistics
Table 3: Herd-level summary statistics for TB in cattle in Warwickshire between 2019 and 2021
| Herd-level statistics | 2019 | 2020 | 2021 |
|---|---|---|---|
| (a) Total number of cattle herds live on Sam at the end of the reporting period | 628 | 626 | 587 |
| (b) Total number of whole herd skin tests carried out at any time in the period | 967 | 849 | 878 |
| (c) Total number of OTF cattle herds having TB whole herd tests during the period for any reason | 504 | 474 | 473 |
| (d) Total number of OTF cattle herds at the end of the report period (herds not under any type of Notice Prohibiting the Movement of Bovine Animals (TB02) restrictions) | 549 | 545 | 520 |
| (e) Total number of cattle herds that were not under restrictions due to an ongoing TB incident at the end of the report period | 565 | 568 | 550 |
| (f.1) Total number of new OTF-S TB incidents detected in cattle herds during the report period (including all Finishing Units) | 26 | 17 | 27 |
| (f.2) Total number of new OTF-W TB incidents detected in cattle herds during the report period (including all Finishing Units) | 43 | 47 | 29 |
| (g.1) Of the new OTF-W herd incidents, how many can be considered the result of movement, purchase or contact from or with an existing incident based on current evidence? | 8 | 10 | 6 |
| (g.2) Of the new OTF-W herd incidents, how many were triggered by skin test Reactors or 2xIRs at routine herd tests? | 22 | 25 | 22 |
| (g.3) Of the new OTF-W herd incidents, how many were triggered by skin test Reactors or 2xIRs at other TB test types (such as forward and back-tracings, contiguous or check tests)? | 14 | 14 | 7 |
| (g.4) Of the new OTF-W herd incidents, how many were first detected through routine slaughterhouse TB surveillance? | 6 | 6 | 6 |
| (h.1) Number of new OTF-W incidents revealed by enhanced TB surveillance (radial testing) conducted around those OTF-W herds | 0 | 0 | 0 |
| (h.2) Number of new OTF-S incidents revealed by enhanced TB surveillance (radial testing) conducted around those OTF-W herds | 0 | 0 | 0 |
| (i) Number of OTF-W herds still open at the end of the period (including any ongoing OTF-W incidents that began in a previous reporting period, but not including non-grazing Approved Finishing Units) | 39 | 38 | 20 |
| (j) New confirmed (positive M. bovis culture) incidents in non-bovine species detected during the report period (indicate host species involved) | 0 | 0 | 1(alpaca) |
| (k.1) Number of grazing approved finishing units active at end of the period | 0 | 0 | 0 |
| (k.2) Number of non-grazing approved finishing units active at end of the period | 14 | 13 | 13 |
| (k.3) Number of grazing exempt finishing units active at end of the period | 0 | 0 | 0 |
| (k.4) Number of non-grazing exempt finishing units active at end of the period | 0 | 0 | 0 |
Table 4: Animal-level summary statistics for TB in cattle in Warwickshire between 2019 and 2021
| Animal-level statistics (cattle) | 2019 | 2020 | 2021 |
|---|---|---|---|
| (a) Total number of cattle tested in the period (animal tests) | 123,524 | 105,921 | 101,974 |
| (b.1) Reactors detected by tuberculin skin tests during the year | 335 | 297 | 223 |
| (b.2) Reactors detected by additional IFN-γ blood tests (skin-test negative or IR animals) during the year | 403 | 229 | 163 |
| (c) Reactors detected during year per incidents disclosed during year | 10.7 | 8.2 | 6.9 |
| (d) Reactors per 1,000 animal tests | 6.0 | 5.0 | 3.8 |
| (e.1) Additional animals slaughtered during the year for TB control reasons (dangerous contacts, including any first time IRs) | 9 | 4 | 9 |
| (e.2) Additional animals slaughtered during the year for TB control reasons (private slaughters) | 15 | 4 | 2 |
| (f) SLH cases (tuberculous carcases) reported by Food Standards Agency (FSA) during routine meat inspection | 15 | 13 | 12 |
| (g) SLH cases confirmed by culture of M. bovis | 8 | 11 | 9 |
Appendix 3: Suspected sources of M. bovis infection for all the new OTF-W and OTF-S incidents identified in the report period
Each TB incident could have up to 3 potential risk pathways identified. Each risk pathway is given a score that reflects the likelihood of that pathway bringing TB into the herd. The score is recorded as either definite (score 8), most likely (score 6), likely (score 4) or possible (score 1). The source(s) for each incident are weighted by the certainty ascribed. Any combination of definite, most likely, likely, or possible can contribute towards the overall picture for possible routes of introduction into a herd. If the overall score for a herd is less than 6, then the score is made up to 6 using the ‘Other/Unknown Source’ option.
Buffering up to 6 in this way helps to reflect the uncertainty in assessments where only ‘likely’ or ‘possible’ sources are identified.
Table 5 combines the data from multiple herds and provides the proportion of pathways in which each source was identified, weighted by the certainty that each source caused the introduction of TB. The output does not show the proportion of herds where each pathway was identified (this is skewed by the certainty calculation). WGS of M. bovis isolates can be a powerful tool in identifying a likely source of infection, however WGS clades are not determined for OTF-S herds. As a result of varying levels of uncertainty, only broad generalisations should be made from these data. A more detailed description of this methodology is provided in the explanatory supplement for the annual reports 2021.
Table 5: Suspected sources of M. bovis infection for all new OTF-W and OTF-S incidents identified in Warwickshire, in 2021
| Source of infection | Possible (1) | Likely (4) | Most likely (6) | Definite (8) | Weighted contribution |
|---|---|---|---|---|---|
| Badgers | 15 | 12 | 31 | 0 | 49.7% |
| Cattle movements | 5 | 3 | 6 | 0 | 10.6% |
| Contiguous | 0 | 0 | 0 | 0 | 0.0% |
| Residual cattle infection | 3 | 2 | 5 | 0 | 6.1% |
| Domestic animals | 0 | 0 | 0 | 0 | 0.0% |
| Non-specific reactor | 0 | 0 | 0 | 0 | 0.0% |
| Fomites | 3 | 0 | 1 | 0 | 1.9% |
| Other wildlife | 12 | 13 | 0 | 0 | 12.0% |
| Other or unknown source | 2 | 2 | 3 | 0 | 19.7% |
Please note that each TB incident could have up to 3 potential pathways so totals may not equate to the number of actual incidents that have occurred.