South East of England (low risk area) year end report 2021
Updated 16 February 2023

© Crown copyright 2023
This publication is licensed under the terms of the Open Government Licence v3.0 except where otherwise stated. To view this licence, visit nationalarchives.gov.uk/doc/open-government-licence/version/3 or write to the Information Policy Team, The National Archives, Kew, London TW9 4DU, or email: psi@nationalarchives.gov.uk.
Where we have identified any third party copyright information you will need to obtain permission from the copyright holders concerned.
This publication is available at https://www.gov.uk/government/publications/bovine-tb-epidemiology-reports-2021/south-east-of-england-low-risk-area-year-end-report-2021
Introduction
The Low Risk Area (LRA) was established in 2013. In 2014 this area was incorporated into the UK government’s strategy to achieve Officially Tuberculosis-Free (OTF) status for England by 2038. A key action was to recognise the different levels of bovine tuberculosis (TB) in different parts of the country and to vary the approach to control accordingly. Overall, the LRA has a very low and stable incidence of infected herds. The current strategy seeks to rapidly control infection when it arises through:
- high sensitivity testing of affected herds
- temporarily enhanced local surveillance (radial and hotspot testing)
- mandatory pre- and post-movement testing of cattle entering the LRA from higher risk areas of the UK
The aim is to preserve the favourable disease status of this area so that its counties can be declared OTF as soon as possible.
This report describes the frequency and geographical distribution of TB in 2021 in cattle herds in Bedfordshire, Cambridgeshire, Essex, Greater London, Hertfordshire, Isle of Wight, Kent, Norfolk, Suffolk, Surrey, and West Sussex, the counties that make up the South East region of the LRA.
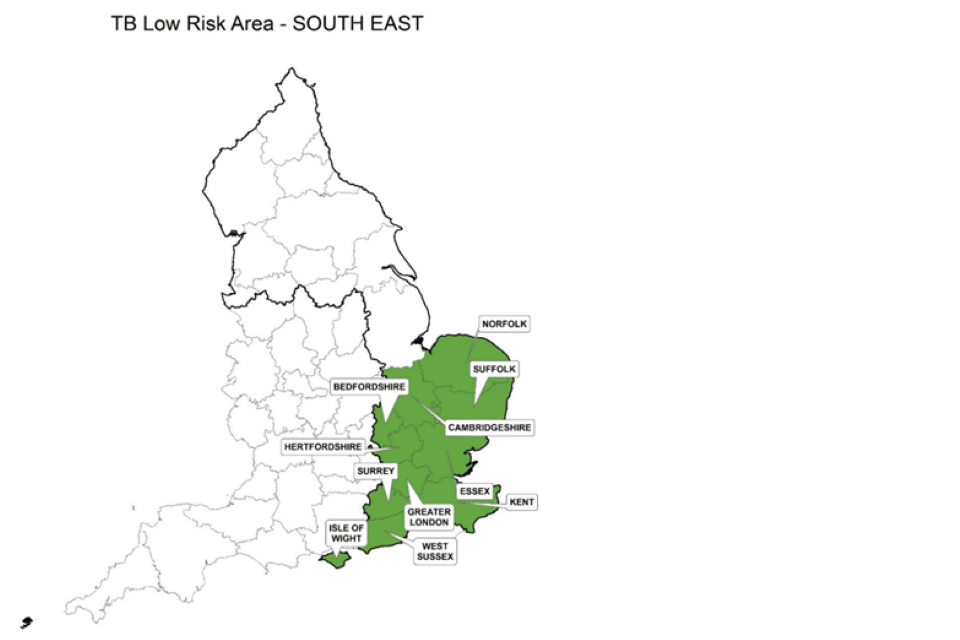
County map of England showing the Low Risk Area and highlighting the South East of England including the counties of Bedfordshire, Cambridgeshire, Essex, Isle of Wight, Hertfordshire, Kent, Greater London, Norfolk, Suffolk, Surrey and West Sussex.
TB in cattle and other mammals is primarily caused by the bacterium Mycobacterium bovis (M. bovis) and the disease is subsequently referred to in this report as TB. Although other sources may refer to TB ‘breakdowns’, this report will use the term ‘incidents’ throughout.
This report is intended for individuals involved in the control of TB, both locally and nationally. This includes, but is not limited to farmers, veterinarians, policy makers and the scientific community.
Details of the data handling methodology used in this report, a glossary of terms, and the TB control measures adopted in the LRA, can be found in the Explanatory supplement for the annual reports 2021.
Types of TB incident
Unless otherwise specified, this report includes all new TB incidents detected during the reporting period. This includes ‘Officially Tuberculosis-Free Status Withdrawn’ (OTF-W) incidents and ‘Officially Tuberculosis-Free Status Suspended’ (OTF-S) incidents.
OTF-W incidents are those involving one or more test reactors with typical lesions of TB identified at post-mortem meat inspection, or one or more animals with M. bovis-positive culture results from tissue samples collected from carcases during the post-mortem inspection, or both.
OTF-S incidents are triggered by reactors to the Single Intradermal Comparative Cervical Tuberculin (SICCT) test, but without subsequent detection of TB lesions or positive culture results in any of those animals.
Cattle industry
The cattle industry in the South East of England is predominantly beef-based. See Appendix 1. Over 60% of the cattle in this region are in Norfolk, Kent, Suffolk, and West Sussex. There is a large proportion of small cattle herds (up to 50 animals per herd) in all counties within the region.
There are 3 markets located in Norfolk, Essex and Kent. A Collection Centre operates in Essex. There are no dedicated sales or collections approved by the Animal and Plant Health Agency (APHA) for onward consignment of TB-restricted cattle direct to a slaughterhouse (SLH). Orange markets (TB restricted cattle sales) for the sale of negative testing cattle from TB-restricted herds are not permitted in the LRA.
There are 5 active licensed finishing units (LFUs) in this region, and all are subject to annual re-approval visits by APHA.
New TB incidents
There were 26 new TB incidents in the region during 2021, a 13% decrease from the 31 incidents reported in 2020 (Figure 1a to d). Ten of those were OTF-W incidents (6 more than in 2020), and 16 OTF-S (11 fewer than in 2020) (Figure 1a to d).
The 6 OTF-W incidents were disclosed in Bedfordshire (3), Hertfordshire (3) and one each in Cambridgeshire, Essex, Suffolk, and West Sussex.
Of the 16 OTF-S incidents, there were 4 disclosed in West Sussex, 3 in both Kent and Suffolk, 2 in Cambridgeshire, and one each in Bedfordshire, Essex, Hertfordshire, and Norfolk.
No new TB incidents (OTF-W or OTF-S) were disclosed in Surrey in 2021 (unchanged from 2020) and, for the first time in the last 4 years, in the Isle of Wight (down from one in 2020) and Greater London (down from one in 2020).
There were no non-bovine or unusual cattle TB incidents in this region during 2021.
Figure 1a: Annual number of new TB incidents in Bedfordshire, Cambridgeshire, and Essex, from 2016 to 2021.

For 2021 incidents in Bedfordshire were 3 OTF-W 1 OTF-S, incidents in Cambridgeshire were 1 OTF-W 2 OTF-S, incidents in Essex were 1 OTF-W 1 OTF-S.
Figure 1b: Annual number of new TB incidents in Greater London, Hertfordshire, and the Isle of Wight, from 2016 to 2021.

For 2021 there were no incidents is Greater London or the Isle of Wight. Incidents in Hertfordshire were 3 OTF-W 1 OTF-S.
Figure 1c: Annual number of new TB incidents in Kent, Norfolk, and Suffolk, from 2016 to 2021.
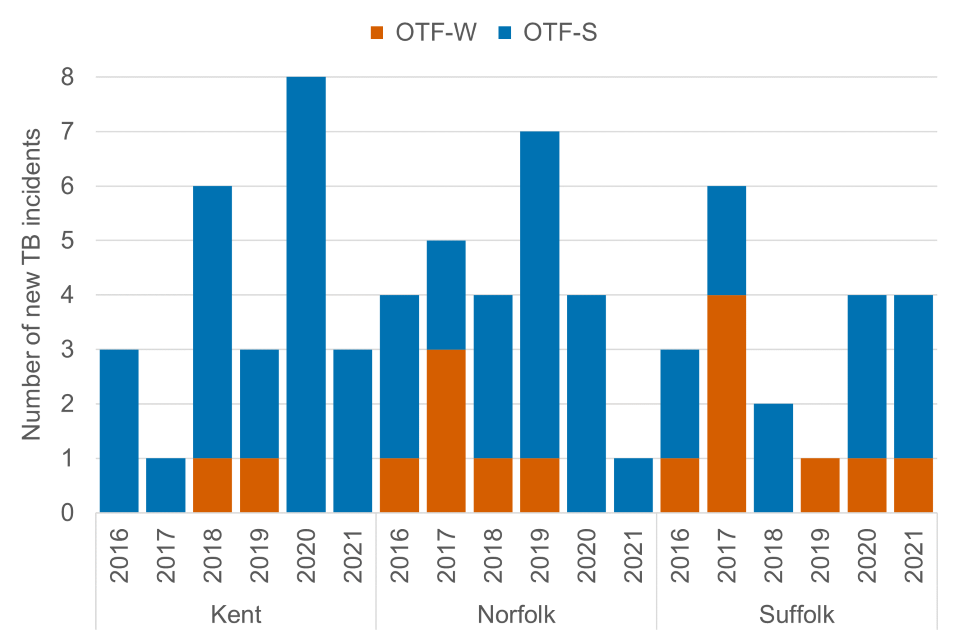
For 2021 incidents in Kent were 3 OTF-S, incidents in Norfolk were 1 OTF-S, incidents in Suffolk were 1 OTF-W 3 OTF-S.
Figure 1d: Annual number of new TB incidents in Surrey and West Sussex, from 2016 to 2021.

For 2021 incidents in West Sussex were 1 OTF-W 4 OTF-S. There were no incidents in Surrey in 2021.
Of the 26 new incidents (OTF-W or OTF-S), only one was disclosed at a 6-month (post-incident) check test, and one was disclosed at a 12-month check test (Figure 2). This suggests that TB infection was cleared effectively from most herds in the region by statutory short interval skin testing and (in OTF-W herds) the supplementary IFN-γ blood test.
Figure 2: Number of new TB incidents (OTF-W and OTF-S) in the LRA counties of the South East of England in 2021, disclosed by different surveillance methods in each county.
| County | 12 Month test (12M) | 6-month test (6M) | Radial test (RAD) | Routine herd test (RHT) | Slaughterhouse test (SLH) | Whole herd test (WHT) | Post-movement test (POSTMT) | Total |
|---|---|---|---|---|---|---|---|---|
| Bedfordshire | 0 | 0 | 2 | 0 | 1 | 0 | 1 | 4 |
| Cambridgeshire | 0 | 0 | 0 | 2 | 1 | 0 | 0 | 3 |
| Essex | 0 | 0 | 0 | 2 | 0 | 0 | 0 | 2 |
| Hertfordshire | 0 | 1 | 2 | 1 | 0 | 0 | 0 | 4 |
| Kent | 1 | 0 | 0 | 2 | 0 | 0 | 0 | 3 |
| Norfolk | 0 | 0 | 0 | 1 | 0 | 0 | 0 | 1 |
| Suffolk | 0 | 0 | 0 | 4 | 0 | 0 | 0 | 4 |
| West Sussex | 0 | 0 | 1 | 1 | 1 | 1 | 1 | 5 |
Geographical distribution of TB incidents
As in previous years, new TB incidents were spread across the South East of England. Incidents were disclosed in areas with a higher cattle density (Figure 3).
Figure 3: Location of cattle holdings in the South East of England with new TB incidents (OTF-W and OTF-S) in 2021, and cattle holdings with pre-2021 OTF-W incidents still ongoing at the beginning of 2021, overlaid on a cattle density map. Note that ‘OTF-W Introduced 2021’ refers to OTF-W incidents in which cattle movements were the most likely source of infection.
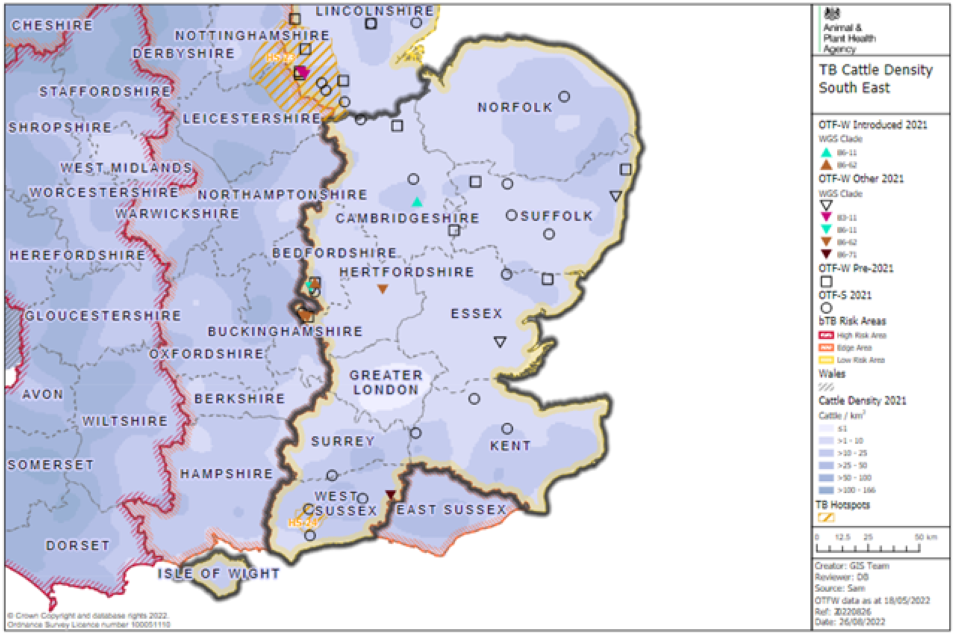
TB incidents are scattered throughout the South East. Spatial clustering is only evident in two areas in the west of Bedfordshire and the west of Hertfordshire, along the border with Buckinghamshire. Both clusters involve clade B6-62.
Whole Genome Sequencing (WGS) replaced genotyping at APHA in 2021.
There was a cluster of incidents in the Leighton Buzzard area of west Bedfordshire: 3 OTF-W and 2 OTF-S. Of the 3 OTF-W incidents, 2 were associated with purchase of cattle, one assessed as definite and one with uncertainty (Figure 4). The third was identified as whole genome sequencing (WGS) clade B6-11, which has a very large homerange covering much of the west of the HRA. WGS analysis (expected in the near future), should determine how the isolate from this incident is related to a 2021 cluster of 3 B6-11 incidents in the neighbouring area of Buckinghamshire. If closely related this could suggest some local spread in the area.
In Hertfordshire, two OTF-W incidents (WGS clade B6-62) and the OTF-S incident detected in 2021 were located close to the 2020 OTF-S incident (Figure 3). The source of infection for the OTF-W incidents was uncertain, with fomites and cattle movements from the LRA both possible (Figure 4).
Figure 4: Map of the source of infection pathway recorded with the highest level of certainty, for OTF-W TB incidents, and the location of OTF-S incidents in the South East of England which started in 2021. Local cattle refers to residual infection and contiguous cattle risk pathways.
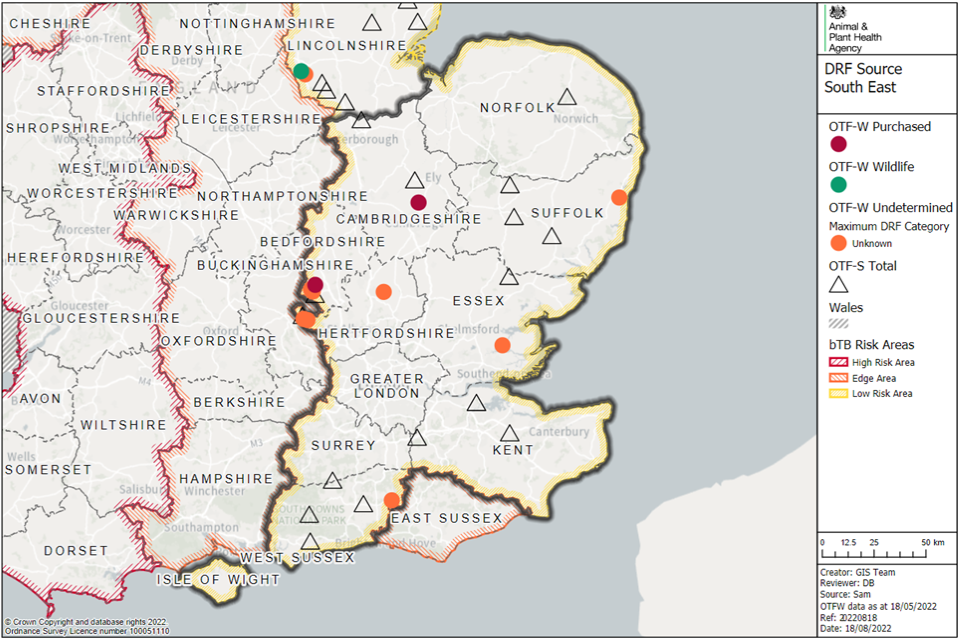
Of the 10 OTF-W incidents in the South East region, 2 were most likely introduced to the herd by purchased cattle and the remaining 8 had an unknown source of infection.
Purchased refers to cattle movement risk pathways. Wildlife refers to both badger and other wildlife risk pathways.
Potential or confirmed TB hotspot areas
Two potential TB hotspot areas in the southern region closed in 2021. One in Norfolk (HS25) and one in West Sussex (HS24) (Figure 5). Enhanced wildlife surveillance in these 2 areas did not reveal evidence of M. bovis infection in badgers or wild deer.
Figure 5: Potential hotspot areas and radial surveillance zones around OTF-W incidents that were active, completed or not instigated in the South East of England during 2021, by year of initiation.
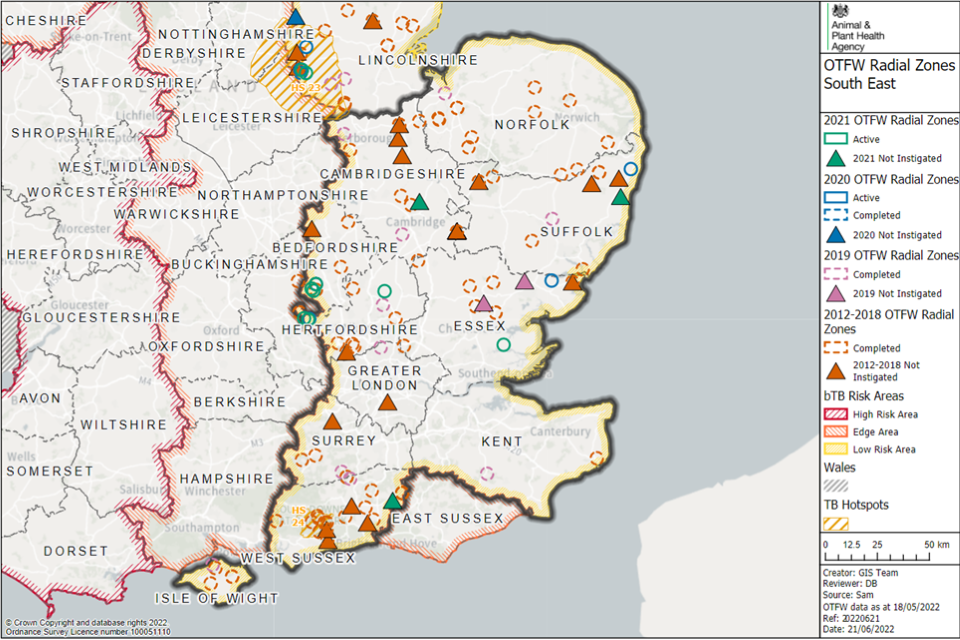
There is one potential hotspot HS24 depicted in the area, in West Sussex. Radial zones are distributed throughout the South East without evidence of spatial clustering.
Apart from the area around Leighton Buzzard in Bedfordshire, for which WGS analysis is awaited to determine appropriate action, there were no new areas of concern or potential hotspot applications under consideration during this reporting period.
Main risk pathways and key drivers for TB infection
The main risk pathways and key drivers for TB infection within the South East in 2021 are considered here. Evidence collected during APHA veterinary investigations into the source of infection within herds was used to inform this understanding. In 2021, 20 out of 26 (77%) of new TB incidents in the South East received a preliminary or final APHA veterinary investigation to identify the source of infection.
It can be challenging to retrospectively establish the route of infection for a TB incident herd. Ideally this investigation includes a thorough on-farm investigation and scrutiny of routinely collected data; such as cattle movement records, and the results of WGS where available. Up to 3 hazards and risk pathways were selected for each incident investigated. Each of these potential sources were given a score that reflects the likelihood of that pathway being the true one, based on the available evidence.
Details of the protocol used for these investigations, and the subsequent methodology used to calculate the weighted contribution of the different suspected sources of M. bovis infection can be found in the Explanatory supplement to the annual reports 2021.
The key drivers of the TB epidemic in the South East during 2021 were identified as:
- purchase of undetected infected cattle
The main risk pathway for TB into the reporting area is cattle movements, although in many incidents the certainty around this assessment is low.
In 2 of the 10 new OTF-W TB incidents, the movements of cattle with undisclosed infection was identified as the definite source of infection. A further 4 OTF-W TB incidents listed movements as a possible source and t3 OTF-W incidents had an undetermined risk pathway.
Risk pathways for OTF-S incidents are more difficult to attribute when there is no whole-genome sequencing information available from an M. bovis isolate, or a clear link to the purchase of infected cattle.
Uncertainty accounted for 60% of the weighted source pathways for the 10 OTF-S incidents that had an investigation. This category is added to those incidents in which there was high uncertainty around the selected pathways (see explanatory supplement for methodology). Twenty-five percent of the weighted source pathways were ascribed to cattle movements, while there was a small percentage (7%) of OTF-S incidents linked to non-specific reactions to the tuberculin skin test.
Forward look
Current surveillance and incident management measures are keeping the incidence of TB under control. Overall, disease incidence remains low. The recommendation would be continuing to utilise all control measures and to encourage herd biosecurity awareness through communications with farmers’ veterinary providers and farming associations. Based on the current trends, the counties in this region are likely to maintain their target of less than 0.1% of OTF-W incidence by 2025.
The area around Leighton Buzzard in Bedfordshire will need to be closely monitored for further incidents of B6-11.
Appendix 1: Cattle industry demographics
Table 1a: Number of cattle premises by size band in Bedfordshire, Cambridgeshire, Essex and Greater London at 1 January 2021 (RADAR data)
| Size of herds | Number of herds in Bedfordshire | Number of herds in Cambridgeshire | Number of herds in Essex | Number of herds in Greater London |
|---|---|---|---|---|
| Undetermined | 1 | 3 | 7 | 3 |
| 1-50 | 83 | 176 | 210 | 44 |
| 51-100 | 36 | 38 | 51 | 2 |
| 101-200 | 13 | 43 | 26 | 4 |
| 201-350 | 5 | 13 | 22 | 1 |
| 351-500 | 2 | 3 | 5 | 0 |
| 501+ | 3 | 10 | 10 | 0 |
| Total number of herds | 143 | 286 | 331 | 54 |
| Mean herd size | 70 | 92 | 80 | 30 |
| Median herd size | 39 | 29 | 24 | 10 |
Table 1b: Number of cattle premises by size band in Hertfordshire, Isle of Wight, Kent and Norfolk at 1 January 2021 (RADAR data).
| Size of herds | Number of herds in Hertfordshire | Number of herds in Isle of Wight | Number of herds in Kent | Number of herds in Norfolk |
|---|---|---|---|---|
| Undetermined | 6 | 3 | 9 | 6 |
| 1-50 | 129 | 59 | 341 | 461 |
| 51-100 | 30 | 21 | 89 | 142 |
| 101-200 | 19 | 23 | 61 | 89 |
| 201-350 | 8 | 6 | 31 | 51 |
| 351-500 | 2 | 5 | 24 | 16 |
| 501+ | 1 | 0 | 15 | 22 |
| Total number of herds | 195 | 117 | 570 | 787 |
| Mean herd size | 53 | 80 | 89 | 89 |
| Median herd size | 24 | 47 | 26 | 33 |
Table 1c: Number of cattle premises by size band in Suffolk, Surrey, West Sussex at 1 January 2021 (RADAR data)
| Size of herds | Number of herds in Suffolk | Number of herds in Surrey | Number of herds in West Sussex |
|---|---|---|---|
| Undetermined | 4 | 6 | 9 |
| 1-50 | 261 | 176 | 197 |
| 51-100 | 65 | 30 | 56 |
| 101-200 | 64 | 30 | 65 |
| 201-350 | 18 | 19 | 26 |
| 351-500 | 11 | 12 | 11 |
| 501+ | 9 | 11 | 16 |
| Total number of herds | 432 | 284 | 380 |
| Mean herd size | 77 | 98 | 103 |
| Median herd size | 26 | 23 | 40 |
Table 2a: Number and percentage of total animals by breed purpose in Bedfordshire, Cambridgeshire, Essex, and Greater London at 1 January 2021
| Breed purpose | Number (and percentage of total) cattle in Bedford | Number (and percentage of total) cattle in Cambridgeshire | Number (and percentage of total) cattle in Essex | Number (and percentage of total) cattle in Greater London |
|---|---|---|---|---|
| Beef | 7,433 (74%) | 20,531 (77%) | 20,952 (78%) | 1,108 (67%) |
| Dairy | 2,258 (22%) | 5,009 (19%) | 4,312 (16%) | 331 (20%) |
| Dual purpose | 329 (3%) | 806 (3%) | 1,280 (4%) | 194 (11%) |
| Unknown | 0 | 1 (<1%) | 1 (<1%) | 0 |
| Total | 10,020 | 26,347 | 26,545 | 1,633 |
Table 2b: Number and percentage of total animals by breed purpose in Hertfordshire, Isle of Wight, Kent, and Norfolk at 1 January 2021
| Breed purpose | Number (and percentage of total) cattle in Hertfordshire | Number (and percentage of total) cattle in Isle of Wight | Number (and percentage of total) cattle in Kent | Number of cattle in Norfolk |
|---|---|---|---|---|
| Beef | 8,043 (78%) | 7,113 (76%) | 32,827 (64%) | 54,593 (78%) |
| Dairy | 1,902 (18%) | 2,070 (22%) | 17,198 (33%) | 12,009 (17%) |
| Dual purpose | 323 (3%) | 128 (1%) | 890 (1%) | 3,099 (4%) |
| Unknown | 0 | 0 | 2 (<1%) | 1 (<1%) |
| Total | 10,268 | 9,311 | 50,917 | 69,702 |
Table 2c: Number (and percentage of total) animals by breed purpose in Suffolk, Surrey and West Sussex at 1 January 2021
| Breed purpose | Number (and percentage of total) cattle in Suffolk | Number (and percentage of total) cattle in Surrey | Number (and percentage of total) cattle in West Sussex |
|---|---|---|---|
| Beef | 23,682 (71%) | 18,564 (66%) | 22,022 (56%) |
| Dairy | 6,272 (18%) | 7,849 (28%) | 15,744 (40%) |
| Dual purpose | 3,289 (9%) | 1,478 (5%) | 1,496 (3%) |
| Unknown | 2 (<1%) | 0 | 6 |
| Total | 33,245 | 27,891 | 39,268 |
Appendix 2: Summary of headline cattle TB statistics
Table 3: Herd-level summary statistics for TB in cattle in 2021 in Bedfordshire, Cambridgeshire, Essex, and Greater London.
| Herd-level statistics | Bedfordshire | Cambridgeshire | Essex | Greater London |
|---|---|---|---|---|
| (a) Total number of cattle herds live on Sam at the end of the reporting period | 178 | 382 | 429 | 76 |
| (b) Total number of cattle herds subject to annual TB testing (or more frequent) at the end of the reporting period (any reason) | 34 | 12 | 24 | 13 |
| (c) Total number of whole herd skin tests carried out at any time in the period | 65 | 74 | 78 | 14 |
| (d) Total number of OTF cattle herds having TB whole herd tests during the period for any reason | 49 | 69 | 69 | 14 |
| (e) Total number of OTF cattle herds at the end of the report period (herds not under any type of Notice Prohibiting the Movement of Bovine Animals (TB02) restrictions) | 169 | 371 | 420 | 74 |
| (f) Total number of cattle herds that were not under restrictions due to an ongoing TB incident at the end of the report period | 174 | 380 | 428 | 76 |
| (g.1) Total number of new OTF-S TB incidents detected in cattle herds during the report period | 1 | 2 | 1 | 0 |
| (g.2) Total number of new OTF-W TB incidents detected in cattle herds during the report period | 3 | 1 | 1 | 0 |
| (h.1) Of the new OTF-W herd incidents, how many occurred in a holding affected by another OTF-W incident in the previous three years? | 1 | 0 | 0 | 0 |
| (h.2) Of the new OTF-W herd incidents, how many could be considered secondary to a primary incident based on current evidence? | 0 | 0 | 0 | 0 |
| (h.3) Of the new OTF-W herd incidents, how many were triggered by skin test reactors or 2x inconclusive reactors (IRs) at routine herd tests? | 0 | 1 | 0 | 0 |
| (h.4) Of the new OTF-W herd incidents, how many were triggered by skin test reactors or 2xIRs at other TB test types (such as forward and back-tracings, contiguous, check tests)? | 1 | 0 | 0 | 0 |
| (h.5) Of the new OTF-W herd incidents, how many were first detected through routine slaughterhouse TB surveillance? | 1 | 1 | 0 | 0 |
| (i.1) Number of new OTF-S incidents revealed by enhanced TB surveillance (radial testing) conducted around those OTF-W herds | 0 | 0 | 0 | 0 |
| (i.2) Number of new OTF-W incidents revealed by enhanced TB surveillance (radial testing) conducted around those OTF-W herds | 2 | 0 | 0 | 0 |
| (j) Number of OTF-W herds still open at the end of the period (including any ongoing OTF-W incidents that began in a previous reporting period) | 3 | 2 | 1 | 0 |
| (k) Number of OTF-W herds still open at the end of the period that are within a finishing unit | 0 | 1 | 0 | 0 |
| (l) New confirmed (positive M. bovis culture) incidents in non-bovine species detected during the report period (indicate host species involved) | 0 | 0 | 0 | 0 |
Table 4: Herd-level summary statistics for TB in cattle in 2021 in Hertfordshire, Isle of Wight, Kent, and Norfolk.
| Herd-level statistics | Hertfordshire | Isle of Wight | Kent | Norfolk |
|---|---|---|---|---|
| (a) Total number of cattle herds live on Sam at the end of the reporting period | 244 | 132 | 678 | 983 |
| (b) Total number of cattle herds subject to annual TB testing (or more frequent) at the end of the reporting period (any reason) | 25 | 5 | 44 | 30 |
| (c) Total number of whole herd skin tests carried out at any time in the period | 71 | 25 | 153 | 201 |
| (d) Total number of OTF cattle herds having TB whole herd tests during the period for any reason | 58 | 23 | 144 | 198 |
| (e) Total number of OTF cattle herds at the end of the report period (herds not under any type of Notice Prohibiting the Movement of Bovine Animals (TB02) restrictions) | 240 | 132 | 666 | 971 |
| (f) Total number of cattle herds that were not under restrictions due to an ongoing TB incident at the end of the report period | 241 | 132 | 677 | 983 |
| (g.1) Total number of new OTF-S TB incidents detected in cattle herds during the report period | 1 | 0 | 3 | 1 |
| (g.2) Total number of new OTF-W TB incidents detected in cattle herds during the report period | 3 | 0 | 0 | 0 |
| (h.1) Of the new OTF-W herd incidents, how many occurred in a holding affected by another OTF-W incident in the previous three years? | 1 | 0 | 0 | 0 |
| (h.2) Of the new OTF-W herd incidents, how many could be considered secondary to a primary incident based on current evidence? | 0 | 0 | 0 | 0 |
| (h.3) Of the new OTF-W herd incidents, how many were triggered by skin test reactors or 2xIRs at routine herd tests? | 0 | 0 | 0 | 0 |
| (h.4) Of the new OTF-W herd incidents, how many were triggered by skin test reactors or 2xIRs at other TB test types (such as forward and back-tracings, contiguous, check tests)? | 0 | 0 | 0 | 0 |
| (h.5) Of the new OTF-W herd incidents, how many were first detected through routine slaughterhouse TB surveillance? | 0 | 0 | 0 | 0 |
| (i.1) Number of new OTF-S incidents revealed by enhanced TB surveillance (radial testing) conducted around those OTF-W herds | 1 | 0 | 0 | 0 |
| (i.2) Number of new OTF-W incidents revealed by enhanced TB surveillance (radial testing) conducted around those OTF-W herds | 1 | 0 | 0 | 0 |
| (j) Number of OTF-W herds still open at the end of the period (including any ongoing OTF-W incidents that began in a previous reporting period) | 3 | 0 | 0 | 0 |
| (k) Number of OTF-W herds still open at the end of the period that are within a finishing unit | 0 | 0 | 0 | 0 |
| (l) New confirmed (positive M. bovis culture) incidents in non-bovine species detected during the report period (indicate host species involved) | 0 | 0 | 0 | 0 |
Table 5: Herd-level summary statistics for TB in cattle in 2021 in Suffolk, Surrey, and West Sussex.
| Herd-level statistics | Suffolk | Surrey | West Sussex |
|---|---|---|---|
| (a) Total number of cattle herds live on Sam at the end of the reporting period | 549 | 354 | 462 |
| (b) Total number of cattle herds subject to annual TB testing (or more frequent) at the end of the reporting period (any reason) | 29 | 22 | 28 |
| (c) Total number of whole herd skin tests carried out at any time in the period | 142 | 73 | 124 |
| (d) Total number of OTF cattle herds having TB whole herd tests during the period for any reason | 114 | 73 | 117 |
| (e) Total number of OTF cattle herds at the end of the report period (herds not under any type of Notice Prohibiting the Movement of Bovine Animals (TB02) restrictions) | 537 | 344 | 447 |
| (f) Total number of cattle herds that were not under restrictions due to an ongoing TB incident at the end of the report period | 549 | 354 | 460 |
| (g.1) Total number of new OTF-S TB incidents detected in cattle herds during the report period | 3 | 0 | 4 |
| (g.2) Total number of new OTF-W TB incidents detected in cattle herds during the report period | 1 | 0 | 1 |
| (h.1) Of the new OTF-W herd incidents, how many occurred in a holding affected by another OTF-W incident in the previous three years? | 0 | 0 | 0 |
| (h.2) Of the new OTF-W herd incidents, how many could be considered secondary to a primary incident based on current evidence? | 0 | 0 | 0 |
| (h.3) Of the new OTF-W herd incidents, how many were triggered by skin test reactors or 2xIRs at routine herd tests? | 1 | 0 | 0 |
| (h.4) Of the new OTF-W herd incidents, how many were triggered by skin test reactors or 2xIRs at other TB test types (such as forward and back-tracings, contiguous, check tests)? | 0 | 0 | 0 |
| (h.5) Of the new OTF-W herd incidents, how many were first detected through routine slaughterhouse TB surveillance? | 0 | 0 | 0 |
| (i.1) Number of new OTF-S incidents revealed by enhanced TB surveillance (radial testing) conducted around those OTF-W herds | 0 | 0 | 1 |
| (i.2) Number of new OTF-W incidents revealed by enhanced TB surveillance (radial testing) conducted around those OTF-W herds | 0 | 0 | 0 |
| (j) Number of OTF-W herds still open at the end of the period (including any ongoing OTF-W incidents that began in a previous reporting period) | 0 | 0 | 1 |
| (k) Number of OTF-W herds still open at the end of the period that are within a finishing unit | 0 | 0 | 1 |
| (l) New confirmed (positive M. bovis culture) incidents in non-bovine species detected during the report period (indicate host species involved) | 0 | 0 | 0 |
Table 6: Animal-level summary statistics for TB in cattle in 2021 in Bedfordshire, Cambridgeshire, Essex, and Greater London
| Animal-level statistics (cattle) | Bedfordshire | Cambridgeshire | Essex | Greater London |
|---|---|---|---|---|
| (a) Total number of cattle tested in the period (animal tests) | 9,225 | 5,233 | 5,752 | 702 |
| (b.1) Reactors detected by tuberculin skin tests during the year | 7 | 16 | 12 | 0 |
| (b.2) Reactors detected by additional IFN-γ blood tests (skin-test negative or IR animals) during the year | 33 | 0 | 11 | 0 |
| (c) Reactors detected during year per incidents disclosed during year | 10.00 | 5.33 | 11.50 | 0.00 |
| (d) Reactors per 1,000 animal tests | 4.34 | 3.06 | 4.00 | 0.00 |
| (e.1) Additional animals slaughtered during the year for TB control reasons (dangerous contacts, including any first time IRs) | 0 | 2 | 5 | 0 |
| (e.2) Additional animals slaughtered during the year for TB control reasons (private slaughters) | 0 | 1 | 0 | 0 |
| (f) SLH cases (tuberculous carcases) reported by the Food Standards Agency (FSA) during routine meat inspection | 1 | 3 | 1 | 0 |
| (g) SLH cases confirmed by culture of M. bovis | 1 | 2 | 0 | 0 |
Note (c) Reactors detected during year per incidents disclosed during year, reactors may be from incidents disclosed in earlier years, as any found through testing during the report year count here.
Note (g) SLH cases confirmed by culture of M. bovis, not all cases reported are submitted for culture analysis. All cases reported are from any period prior to or during restrictions.
Table 7: Animal-level summary statistics for TB in cattle in 2021 in Hertfordshire, Isle of Wight, Kent, and Norfolk
| Animal-level statistics (cattle) | Hertfordshire | Isle of Wight | Kent | Norfolk |
|---|---|---|---|---|
| (a) Total number of cattle tested in the period (animal tests) | 6,401 | 2,744 | 16,911 | 16,541 |
| (b.1) Reactors detected by tuberculin skin tests during the year | 24 | 0 | 5 | 2 |
| (b.2) Reactors detected by additional IFN-γ blood tests (skin-test negative or IR animals) during the year | 9 | 0 | 0 | 0 |
| (c) Reactors detected during year per incidents disclosed during year | 8.25 | 0.00 | 1.67 | 2.00 |
| (d) Reactors per 1,000 animal tests | 5.16 | 0.00 | 0.30 | 0.12 |
| (e.1) Additional animals slaughtered during the year for TB control reasons (dangerous contacts, including any first time IRs) | 6 | 0 | 0 | 0 |
| (e.2) Additional animals slaughtered during the year for TB control reasons (private slaughters) | 0 | 0 | 1 | 0 |
| (f) SLH cases (tuberculous carcases) reported by the Food Standards Agency (FSA) during routine meat inspection | 1 | 0 | 1 | 1 |
| (g) SLH cases confirmed by culture of M. bovis | 0 | 0 | 0 | 0 |
Note (c) Reactors detected during year per incidents disclosed during year, reactors may be from incidents disclosed in earlier years, as any found through testing during the report year count here.
Note (g) SLH cases confirmed by culture of M. bovis, not all cases reported are submitted for culture analysis. All cases reported are from any period prior to or during restrictions.
Table 8: Animal-level summary statistics for TB in cattle in 2021 in Suffolk, Surrey, and West Sussex.
| Animal-level statistics (cattle) | Suffolk | Surrey | West Sussex |
|---|---|---|---|
| (a) Total number of cattle tested in the period (animal tests) | 15,166 | 4,985 | 18,902 |
| (b.1) Reactors detected by tuberculin skin tests during the year | 4 | 0 | 7 |
| (b.2) Reactors detected by additional IFN-γ blood tests (skin-test negative or IR animals) during the year | 13 | 0 | 0 |
| (c) Reactors detected during year per incidents disclosed during year | 4.25 | 0.00 | 1.40 |
| (d) Reactors per 1,000 animal tests | 1.12 | 0.00 | 0.37 |
| (e.1) Additional animals slaughtered during the year for TB control reasons (dangerous contacts, including any first time IRs) | 0 | 0 | 0 |
| (e.2) Additional animals slaughtered during the year for TB control reasons (private slaughters) | 0 | 0 | 0 |
| (f) SLH cases (tuberculous carcases) reported by the Food Standards Agency (FSA) during routine meat inspection | 2 | 0 | 4 |
| (g) SLH cases confirmed by culture of M. bovis | 0 | 0 | 0 |
Note (c) Reactors detected during year per incidents disclosed during year, reactors may be from incidents disclosed in earlier years, as any found through testing during the report year count here.
Note (g) SLH cases confirmed by culture of M. bovis, not all cases reported are submitted for culture analysis. All cases reported are from any period prior to or during restrictions.
Appendix 3: Suspected sources of M. bovis infection for all of the new OTF-W and OTF-S incidents identified in the report period
Each TB incident could have up to 3 potential risk pathways identified. Each risk pathway is given a score that reflects the likelihood of that pathway bringing TB into the herd. The score is recorded as either definite (score 8), most likely (score 6), likely (score 4) or possible (score 1). The sources for each incident are weighted by the certainty ascribed. Any combination of definite, most likely, likely, or possible can contribute towards the overall picture for possible routes of introduction into a herd. If the overall score for a herd is less than 6, then the score is made up to 6 using the ‘Other/Unknown Source’ option. Buffering up to 6 in this way helps to reflect the uncertainty in assessments where only ‘likely’ or ‘possible’ sources are identified.
Table 9 combines the data from multiple herds and provides the proportion of pathways in which each source was identified, weighted by the certainty that each source caused the introduction of TB. The output does not show the proportion of herds where each pathway was identified (this is skewed by the certainty calculation). WGS of M. bovis isolates can be a powerful tool in identifying a likely source of infection, however WGS clades have not beendetermined for OTF-S herds. As a result of varying levels of uncertainty, only broad generalisations should be made from these data. A more detailed description of this methodology is provided in the Explanatory supplement for the annual reports 2021.
Table 9: Suspected sources of M. bovis infection for all new OTF-W and OTF-S incidents identified in 2021
| Source of infection | Possible (1) | Likely (4) | Most likely (6) | Definite (8) | Weighted contribution |
|---|---|---|---|---|---|
| Badgers | 7 | 0 | 0 | 0 | 6% |
| Cattle Movements | 17 | 1 | 0 | 2 | 28% |
| Contiguous | 1 | 0 | 0 | 0 | 1% |
| Residual Cattle Infection | 1 | 0 | 0 | 0 | 1% |
| Domestic Animals | 0 | 0 | 0 | 0 | 0% |
| Non-specific Reactor | 0 | 1 | 0 | 0 | 3% |
| Fomites | 6 | 0 | 0 | 0 | 5% |
| Other Wildlife | 1 | 0 | 0 | 0 | 1% |
| Other or Unknown Source | 1 | 0 | 0 | 0 | 56% |
Please note each TB incident could have up to 3 potential pathways so totals may not equate to the number of actual incidents that have occurred.
Appendix 4: Assessment of the origin of (and potential for spread of infection from) all the new OTF-W incidents identified in the report period
A risk matrix was used to identify isolated incidents that were likely to have been introduced to the LRA by cattle movements, while not causing any onward local spread. The following 2 questions were considered for each incident, and a score attributed. TB incidents with a score of 1A, 1B or 2A may be removed from the county TB incidence calculations during an application for OTF status (but remain in the incidence calculations in this report).
What is the probability of M. bovis infection being introduced to the LRA via infected cattle movements?
- Definite - for example, traced reactors found in the LRA OTF-W incident herd in question as a result of spread tracings from another TB incident herd, genotype or WGS linked.
- Likely - for example, a Reactor or IR originated from a previous incident herd (and the WGS or genotype does not suggest otherwise), other cattle were moved into the herd from previous incident herd (but were subsequently slaughtered without testing), or the trading practice of herd provides likely evidence (purchasing large numbers of cattle from the High Risk Area (HRA), or Edge Area, High and Intermediate TB areas of Wales, or from the island of Ireland).
- Possible - not a closed herd, but cattle are purchased from the LRA, Scotland or EU Member States.
- Not likely - indigenous infection is known in the locality, closed herd, genotype or WGS has been identified in local wildlife.
What is the probability of this being an isolated, sporadic (‘one-off’) incident, without secondary local spread from the index case?
A. Likely - no secondary incidents have been detected. There are no further incidents as a result of spread tracings anywhere and no genotype or WGS linked OTF-W incidents within 3km radial zone around the LRA OTF-W incident herd in question (or the 3km radial surveillance zone was not triggered).
B. Possible - no secondary incidents have been detected, but the dataset is incomplete. For example, incidents have occurred in the 3km radial zone, but only OTF-S ones, or if OTF-W, they were of an unknown or different genotype or WGS clade.
C. Not likely - secondary spread from the index case, or exposure to a common wildlife source has occurred. For example, OTF-W incidents have occurred in the 3km zone linked by genotype or WGS, or there is known wildlife infection in the area with this genotype or close WGS.
Of the 10 new OTF-W TB incidents in the South East in 2021, 6 were assessed to be eligible for removal from the county TB incidence calculations during an application for OTF status. These were 2 1A incidents, 3 1B incidents and 1 2A incident. The remaining 4 new OTF-W TB incidents were all assessed to be 2B, and therefore not eligible for removal from the county TB incidence calculations during an application for OTF status.