Oxfordshire (edge area) year end report 2021
Updated 16 February 2023

© Crown copyright 2023
This publication is licensed under the terms of the Open Government Licence v3.0 except where otherwise stated. To view this licence, visit nationalarchives.gov.uk/doc/open-government-licence/version/3 or write to the Information Policy Team, The National Archives, Kew, London TW9 4DU, or email: psi@nationalarchives.gov.uk.
Where we have identified any third party copyright information you will need to obtain permission from the copyright holders concerned.
This publication is available at https://www.gov.uk/government/publications/bovine-tb-epidemiology-reports-2021/oxfordshire-edge-area-year-end-report-2021
Introduction
The Edge Area was originally established in 2013. In 2014, the bovine tuberculosis (TB) surveillance strategy for this area was incorporated into the UK Government’s Strategy to achieve Officially Bovine Tuberculosis-Free (OTF) status for England by 2038. A key action was to recognise the different levels of TB in different parts of the country and to vary the approach to control accordingly. The aim is to obtain OTF status for the Edge Area as soon as possible.
This report describes the frequency and geographical distribution of TB in 2021 in cattle herds in Oxfordshire, which forms part of the Edge Area. It examines what factors are likely to be driving TB in this area, and the risks the disease in this county may pose to neighbouring areas.
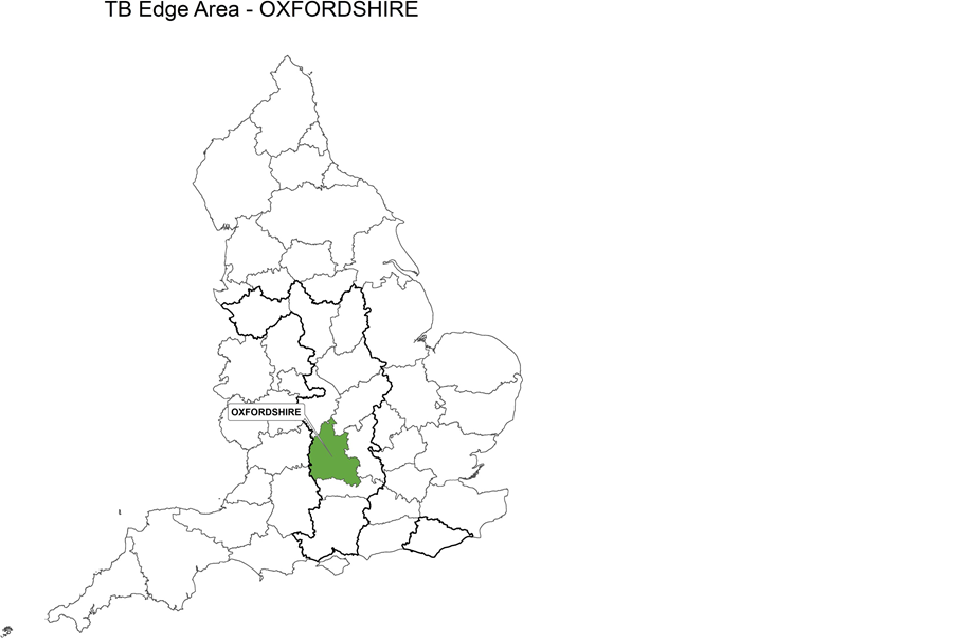
County map of England showing the Edge Area and highlighting the county of Oxfordshire.
TB in cattle and other mammals is primarily caused by the bacterium Mycobacterium bovis (M. bovis), and the disease is subsequently referred to in this report as TB. Although other sources may refer to TB ‘breakdowns’, this report will use the term ‘incidents’ throughout.
This report is intended for individuals involved in the control of TB, both locally and nationally. This includes, but is not limited to farmers, veterinarians, policy makers and the scientific community.
Details of the data handling methodology used in this report, a glossary of terms, and the TB control measures adopted in the Edge Area, can be found in the explanatory supplement for the annual reports 2021.
Types of TB incident
Unless otherwise specified, this report includes all new TB incidents detected during the reporting period. This includes ‘Officially Tuberculosis-Free Status Withdrawn’ (OTF-W) incidents and ‘Officially Tuberculosis-Free Status Suspended’ (OTF-S) incidents.
OTF-W incidents are those involving one or more test reactors with typical lesions of TB identified at post-mortem meat inspection, or one or more animals with M. bovis- positive culture results from tissue samples collected from carcasses during the post-mortem inspection, or both.
OTF-S incidents are triggered by reactors to the Single Intradermal Comparative Cervical Tuberculin (SICCT) test, but without subsequent detection of TB lesions or positive culture results in any of those animals.
TB incidents in Approved Finishing Units (AFUs) without grazing are not included in the prevalence and incidence calculations in this report due to the limited epidemiological impact of these incidents.
Furthermore, herds restricted because of an overdue test rather than a TB incident are also excluded from calculations. Hence measures of incidence and prevalence in this report may be lower than those reported in the official TB statistics.
Cattle industry
Cattle farms in Oxfordshire are predominantly medium sized suckler herds, as indicated in Appendix 1. Large herds tend to be dairies in West Oxfordshire and finishing units in the rest of the county. No new AFUs were approved in 2021, keeping the total number in Oxfordshire at 9, as listed in Appendix 2.
Purchases of cattle are mainly from the High Risk Area (HRA) and neighbouring Edge Area counties. Smaller farms tend to buy locally within the county. Thame market was the only livestock market operating in Oxfordshire in 2021. Dedicated sales for TB-restricted cattle in the south-west are the main outlet for calves from TB incident herds.
Cattle herds routinely undergo 6-monthly TB surveillance testing in Oxfordshire. However, 25% of cattle herds were eligible for less frequent (annual) testing under the earned recognition scheme in 2021.
New TB incidents
In 2021 there were 57 new TB incidents detected, which is a 21% reduction over 2020 (72 new TB incidents). This was due to a reduction in the number of new OTF-W TB incidents (47 in 2020 to 32 in 2021). OTF-W incidents have decreased every year since 2017, whilst the annual number of OTF-S incidents has remained stable over this period and unchanged between 2020 and 2021 (25 in both years, as shown in Figure 1). More than half of the TB incidents in Oxfordshire occurred in herds with a history of TB in the previous 3 years.
Figure 1: Annual number of new TB incidents in Oxfordshire, from 2012 to 2021, showing incidents for the whole county and the original Edge Area.

For 2021 there were 32 OTF-W incidents and 25 OTF-S incidents for the whole county. In the original Edge area of the county there were 23 OTF-W and 12 OTF-S incidents.
TB in other species
M. bovis infection was confirmed in 3 alpaca holdings in 2021. Two were linked to movement of animals from alpaca breeding herds in the Edge Area, and a third was attributed to local infected wildlife.
A new TB incident in a breeding herd of alpacas in the neighbouring county of Buckinghamshire was identified as the source for one of the former as the result of a backwards tracing investigation. The M. bovis isolate was found to be closely related genetically to a new cluster of cattle incidents in that area north of Buckinghamshire.
In addition, a fourth TB incident in a large breeding alpaca farm operating in the south of the county that was initially detected in 2019 continued into 2021.
Incidence of TB
Oxfordshire remains the county with the highest incidence of TB per 100 herd-years at risk (16.0) in the Edge Area. This is higher than the overall incidence rates for both the Edge Area (8.9) and HRA (14.4). In fact, only 4 HRA counties had a higher incidence rate than Oxfordshire in 2021. However, the incidence rate decreased in 2021 for the second year running in Oxfordshire (Figure 2).
Figure 2 also shows incidence calculated as the number of new TB incidents per 100 unrestricted herds tested. This additional measure was introduced to account for the effects of changing testing frequency between 2018 (when six-monthly testing was introduced) and 2019 (when earned recognition allowed for some herds to return to annual testing). The county incidence per 100 unrestricted herds tested plateaued from 2016 to 2019 and then decreased in the two following years.
The decrease in incidence is potentially explained by several factors such as:
- reduction of residual infection in cattle herds affected by TB incidents leading to fewer recurrent incidents (due to supplementary interferon gamma (IFN-γ) blood testing)
- earlier detection of incidents (due to increased frequency of surveillance herd testing since 2018)
In 2021 many herds reverted to annual routine surveillance testing and whole-herd IFN-γ blood testing decreased due to the diversion of APHA staff to controlling the H5N1 highly pathogenic avian influenza (HPAI) outbreak.
Other factors such as the reduction of TB incidence in nearby HRA counties, has also helped to reduce infection in general by decreasing the numbers of purchased cattle with undisclosed infection.
Licensed intensive badger culling operations started in Oxfordshire in 2019 on the west side of the county, and this additional intervention has probably started to have a positive impact on cattle incidence in those areas.
Figure 2: Annual incidence rate per 100 herd-years at risk and per 100 unrestricted herds for all new incidents (OTF-W and OTF-S) in Oxfordshire, from 2012 to 2021, showing incidents for the whole county and the original Edge Area.

2021 the incidence rate was 16 incidents per 100 herd-years at risk and 13.3 per 100 unrestricted herds for the whole county, and 12.6 incidents per 100 herd-years at risk and 10.7 per 100 unrestricted herds for the original Edge Area of the county.
Prevalence of TB
The end-of-year herd prevalence for both the whole of Oxfordshire and the original Edge Area portion of the county also decreased in 2021 (9.6%) compared to 2020 (12.1%, see Figure 3).
The herd prevalence in Oxfordshire had plateaued in the last four years at just over 10% of herds under movement restrictions at the end of each year. A reason for the reduction in 2021 was the reduction in the number of new TB incidents.
Figure 3: Annual end of year prevalence in Oxfordshire, from 2012 to 2021, showing incidents for the whole county and the original Edge Area.

Line chart showing the year-end TB herd prevalence in Oxfordshire between 2012 and 2021. For 2021 this was 9.56% for the whole county and 7.90% for the original Edge Area of the county.
Geographical distribution of TB incidents
Over the past decade, the distribution of incidents in Oxfordshire has continued to advance eastwards covering the whole county (see Figure 4), as described extensively in the 2020 report. Updates for the six previously identified clusters are provided below, as well as new clusters under investigation.
Clusters of genetically related and geographically closely located incidents have been identified using Whole Genome Sequencing (WGS). By a process of elimination of other transmission pathways, infected wildlife has been concluded to be the most likely source of infection for many of these incidents and explains the local spread and cluster formation (refer to Figure 5). In most incidents, a wildlife source refers to transmission from local badgers, but other wildlife, such as deer, may have also been involved. Initial seeding of infection into new areas has probably been caused by a combination of the movement of infected cattle and gradual spread of infection in wildlife populations. However, the possibility of long distance movements of infected wildlife by people or naturally, particularly in the case of fallow deer, cannot be excluded.
Figure 4: Location of cattle holdings in Oxfordshire with new TB incidents (OTF-W and OTF-S) in 2021 and cattle holdings with pre-2021 OTF-W incidents still ongoing at the beginning of 2021, overlaid on a cattle density map. Note that ‘OTF-W Introduced 2021’ refers to OTF-W incidents in which cattle movements were the most likely source of infection.

The distribution of incidents in Oxfordshire has continued to advance eastwards covering the whole county.
Figure 5: Map of the source of infection pathway recorded with the highest level of likelihood, for all TB incidents (OTF-W and OTF-S) in Oxfordshire that started in 2021. Local cattle refers to both residual infection and contiguous cattle risk pathways. Purchased refers to all cattle movement risk pathways. Wildlife refers to both badger and other wildlife risk pathways. Where none of the sources of infection were identified with greater than 50% certainty, the highest ranking source is displayed with an OTF-W undetermined ‘maximum DRF (disease report form) category’ symbol.
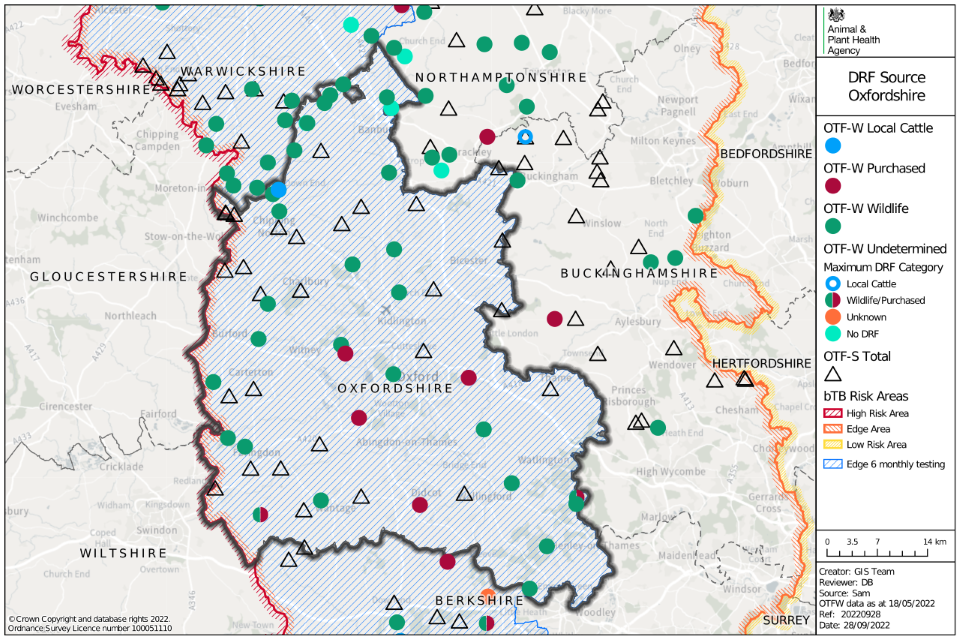
Map of Oxfordshire showing data points of OTF-W as circles, and OTF-S as triangles. Colour is used to denote whether the source is from local cattle, purchased, wildlife or is undetermined.
Deddington-Charlbury-Witney cluster
This cluster was formerly known as the Somerton-Deddington cluster, but has drifted spatially over time. It is located in the north of the county, as indicated in Figure 4.
Historically, the most common M. bovis genotype in this area has been the local genotype to Oxfordshire, 10:a. This appeared to have mutated in recent years in this locality to a different spoligotype, 130. Both 10:a and 130 are in the same WGS clade, B6-62 (see Figure 6). There were no new developments in 2021.
WGS analysis of these M. bovis isolates found 13 incidents genetically related varying between 0 and 2 single nucleotide polymorphisms (SNPs) apart in the same geographical area.
If other M. bovis isolates with a few more SNP differences are also considered, this Somerton-Deddington cluster of incidents appears to be part of a larger cluster extending from the western county border with Gloucestershire to the eastern border with Buckinghamshire.
Henley-on-Thames to Watlington cluster
This cluster is located in the south-east of the county (Figure 4). The 10:a genotype (part of Clade B6-62, see Figure 6) has been the most commonly found genotype in this area, including several confirmed infected wild deer and an incident in a large alpaca breeding farm.
For the period 2015 to 2020, WGS analysis identified a cluster of 18 incidents attributed to almost identical M. bovis isolates within a 400 km2 area adjacent to Henley. The cluster started with 4 cattle incidents in 2015-2016 in the geographical centre, with identical isolates of M. bovis. Spread occurred concentrically outwards in the following years.
Wild fallow deer could have played a role in spreading disease in the centre of the cluster where they were abundant. M. bovis isolates from several incidents of TB in cats distributed nationwide were closely related genetically to this cluster.
Within the same area close to the south-east border with Berkshire, there has been a potential cluster of 11:a incidents (Sonning-Common). The genotype 11:a is part of WGS clade B6-85. From 2017, incidents with this genotype (home range in the south-west of England) started to appear and were mostly attributed to purchases of cattle, but in 2021, incidents including one in a known closed herd of alpacas, suggests that local spread may also have occurred (Figure 6). WGS investigations are required to confirm this as a new local spread cluster overlapping the Henley cluster.
Chinnor-Thame cluster
This cluster is located in the most eastern part of the county, bordering Buckinghamshire (Figure 4).
In 2017, in this area, a new M. bovis genotype NT:7-5-5-4*-3-3.1 (considered a mutation of genotype 10:a, and all part of WGS clade B6-62), was first identified in three incidents close to each other. This genotype was later found to be closely related to genotype 17:g found in 4 more incidents in the area all within 6 kilometres of each other, and some have had recurrent incidents with the same genotype. WGS analysis indicated very close genetic relatedness between isolates, and with the absence of other epidemiological links, wildlife was concluded to be the most likely common source.
Radial testing was triggered by these OTF-W incidents in the Chinnor-Thame cluster to investigate lateral spread into the neighbouring county of Buckinghamshire, but so far no evidence of this has been found.
There was only one new OTF-S incident in this area in 2021, which was recurrent.
Banbury-Northants cluster
A cluster of genotype 10:j (part of WGS clade B6-62, see Figure 6) was located in the most northern corner of the county, bordering Warwickshire, and Northamptonshire, not shown in Figure 4.
In 2020, WGS analysis of a 10:j incident in Oxfordshire identified a cluster of 5 closely related incidents. All were within a 3 kilometre radius – 3 kilometres from Warwickshire and 1 kilometre from Northamptonshire. Investigations into the origin of these infections suggested a wildlife source. Another 10:j incident was disclosed in this cluster in 2021.
This 10:j genotype was also found in an alpaca TB incident in the south-west of Oxfordshire which had recently purchased alpacas from a breeder in the north of Buckinghamshire. 10:j was also isolated from incidents in 2 cattle farms neighbouring this Buckinghamshire alpaca breeder. WGS analysis of the alpaca isolate identified in the south-west of Oxfordshire found it was closely related to the 10:j cluster of cattle incidents in the north.
Shipston-on-Stour-Chastleton-Fifield
This cluster is located in the north-west original HRA portion of the county, bordering Gloucestershire, and Warwickshire, not shown in Figure 4.
One 2020 M. bovis isolate of 10:g (clade B6-62, see Figure 6) in Oxfordshire was closely related genetically to 6 incidents from 2017 to 2021. The 6 related incidents were all genotype 10:a and located within a 6 kilometre radius: 3 in Oxfordshire, 3 in Warwickshire and 1 in Gloucestershire. Another 10:g incident was disclosed in Oxfordshire within this cluster area in 2021.
After ruling out purchased cattle and contiguous contact with neighbouring cattle herds, the most likely source of infection was attributed to wildlife, probably moving from the neighbouring HRA into Oxfordshire.
This points towards a wildlife source affecting bovines and non-bovines in a much larger area covering parts of Oxfordshire, Warwickshire, Northamptonshire, and Buckinghamshire.
North Faringdon cluster
This cluster is located in the south-west original HRA portion of the county, bordering Gloucestershire, and Wiltshire, not shown in Figure 4.
Six genetically related incidents dating from 2017 to 2020 were clustered in this area within a 4 kilometre radius, including one incident in Gloucestershire. Five were genotype 74:a, which was mostly found in neighbouring counties to the Oxfordshire border, and one was genotype 17:a (both part of clade B6-11, see Figure 6). After ruling out purchased cattle and contiguous contact with neighbouring herds, the most likely source of infection for some of these incidents was attributed to wildlife. Two more 74:a (B6-11) incidents were disclosed in this cluster in 2021.
Other smaller clusters
The Wantage cluster (17:e – part of clade B6-11, see Figure 6) was identified in 2020 due to a recurrent incident (previously infected 2018) in the same area as a very closely genetically related 2019 incident, with only one SNP difference. Another incident with this genotype was disclosed in 2021 within 6 kilometres of the other two.
The Oxford cluster (10:7-3-5-4*-3-3.1 – part of clade B6-62) was identified in 2020 to the north-west of the city. Another incident with the same genotype had been identified in 2014 in the same area, and on the opposite side of a wooded area containing a large and well- studied badger population. Common exposure to infected wildlife populations was the only identifiable source of infection for the 2020 incident. One of these incidents has been persistent since 2020 and the other was recurrent in 2021.
A possible Nettlebed cluster (10:d – part of clade B6-62) was identified on the border with Buckinghamshire. An incident was disclosed in 2021 with this unique (likely a 10:a mutation) genotype that was shared by another incident in 2020. The 2020 incident was less than one kilometre away with no cattle movements between them. WGS investigation is required for better understanding of how these two incidents are related to each other and to historic incidents in the area.
In-depth WGS analysis was not possible in 2021 due to the technology being under development and staff resources taken away from this work towards the H5N1 HPAI outbreak response.
In areas where TB has been endemic for a long time, it is likely that several sources can be attributed to each incident. Several overlapping clusters are appearing over time.
Systematic WGS analysis might be able to identify more clusters of incidents in future, helping ascertain sources of infection and the best strategies of eradication.
Figure 6: Selected WGS clades of M. bovis detected in Oxfordshire between 2018 and 2021, where wildlife sources were attributed with a 75% certainty or above according to the DRF calculation, as an indication of local M. bovis reservoir in local wildlife populations (OTF-W incidents only).
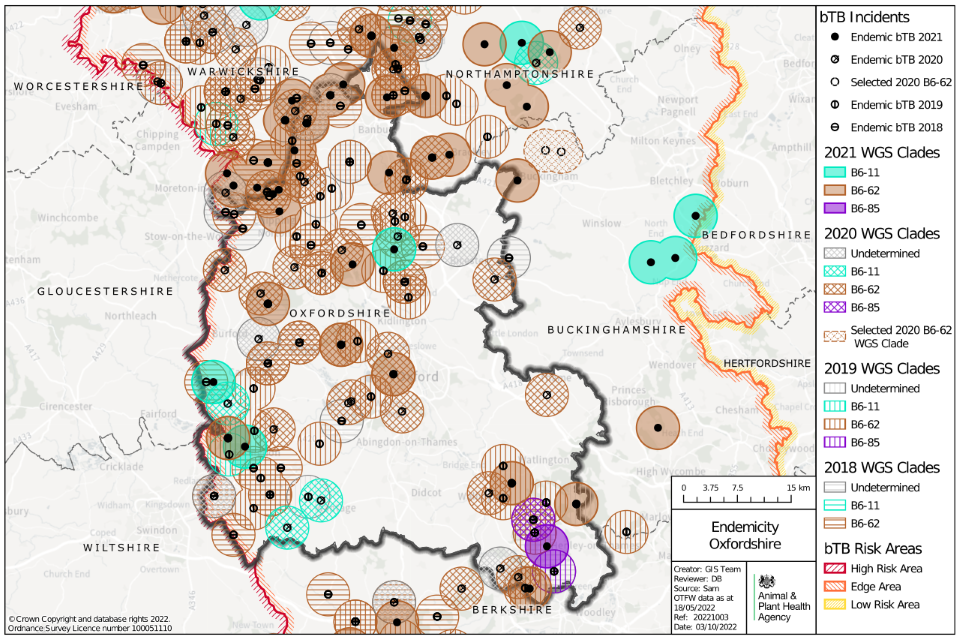
Map of Oxfordshire showing locations of possible wildlife reservoirs of TB as points, between 2018 and 2021. Circles surrounding the points are coloured by TB WGS clade and year.
Main risk pathways and key drivers for TB infection
The main risk pathways and key drivers for TB infection within Oxfordshire are considered here. Evidence collected during APHA veterinary investigations into the source of infection within herds is used to inform this understanding. In 2021, 56 out of 57 (98%) of new TB incidents in Oxfordshire received a preliminary or final APHA veterinary investigation to identify the source of infection.
It can be challenging to retrospectively establish the route of infection for a TB incident herd. Ideally this investigation includes a thorough on-farm investigation and scrutiny of routinely collected data; such as cattle movement records, and the results of WGS where available. Up to 3 hazards and risk pathways are selected for each incident investigated. Each of these potential sources are given a score that reflects the likelihood of that pathway being the true one, based on the available evidence.
Details of the protocol used for these investigations, and the subsequent methodology used to calculate the weighted contribution of the different suspected sources of M. bovis infection can be found in the explanatory supplement to the annual reports 2021.
The key drivers of the TB epidemic in Oxfordshire during 2021 were as follows:
- exposure to probable infected local wildlife
- purchase of undetected infected cattle
- residual infection from previous incidents
Figure 7 presents the aggregated results of the APHA investigations into the source of infection. Further details are presented in Appendix 3, Table 5.
Infected wildlife was the most likely source of infection identified for TB incidents in cattle in 2021. The weighted source of infection was 56% for badgers and 2% for other wildlife. The role of other wildlife species such as wild deer is difficult to ascertain. There is very little available surveillance information, and there is high uncertainty as to their role in transmitting TB to cattle.
Movements of undetected infected cattle remains a source of infection in Oxfordshire (weighted source of infection 20%). The proportion of source ascribed to this risk pathway is likely exaggerated when WGS information is missing, especially in OTF-S breakdowns. However, its relative weight has been decreasing in recent years (20% in 2021, 21% in 2020, 22% in 2019, 30% in 2018). This is likely due to the reduced level of TB in HRA counties (the main source of cattle), changes in cattle buying practices towards lower risk herds, and conversion and approval of some beef fatteners to non-grazing AFUs (without surveillance testing).
Residual infection is an important factor (17%) and reflects the tendency of incidents in Oxfordshire to be more chronic and recurrent (see Figure 7). There has been a small decrease in the proportion of source ascribed to recurrence in the last year (17% in 2021 and 20% in 2020). This is likely due to the systematic deployment of supplementary interferon-gamma testing since 2018, which has increased the overall sensitivity of testing in herds sustaining OTF-W TB incidents and reduced the level of infection left undetected when such herds regain OTF status.
Distinguishing source attribution between badgers and residual infection in recurrent incidents is difficult and likely to be a combination of both. Similarly, purchased and local wildlife infection are not mutually exclusive and sometimes indistinguishable when both sources shared the same local clade or are both contributing to infection within a herd.
Other sources of infection are more difficult to ascertain. Incidents attributed to contiguous cattle-to-cattle spread from neighbouring premises were usually considered as a low likelihood because of adequate separation and absence of nose-to-nose contact between the cattle of neighbouring farms. Potential fomite sources, such as contaminated shared machinery and manure or slurry spread near livestock farms, are also challenging transmission pathways to assess.
Other or unknown sources of infection had a weighted contribution of 5% (see Figure 7). This category is added to herds where there was high uncertainty around the selected pathways. See the explanatory supplement for details of the methodology used.
Figure 7: Summary of the weighted source of infection pathways attributed for OTF-W and OTF-S TB incidents that started in 2021 in Oxfordshire, that had a completed DRF (n=56).

Sources attributed were badgers (56%), cattle movement (20%), residual infection (17%), non-specfic reactor (1%), other wildlife source (2%), and other or unknown source (5%), n=56.
Forward look
The number of herd incidents of TB per year in Oxfordshire remained high over the last 5 years with a decreasing trend starting only relatively recently. The epidemiological picture has become more complex in recent years with multiple clusters, some of which have only recently become apparent. This does not favour the long term objective of reducing OTF- W incidence to less than 1% in Oxfordshire by 2025.
Early detection of infection through more frequent surveillance testing of cattle herds, alongside the use of mandatory IFN-γ blood testing on all OTF-W incidents, has helped to reduce the spread of TB within herds.
APHA, in collaboration with the University of Nottingham, is conducting a project to detect the presence and location of TB infection in badgers in Buckinghamshire, Oxfordshire, Berkshire, Hampshire and East Sussex - collectively known as the ‘Southern Edge Area’. Volunteers have been recruited in each county to help with the safe and timely retrieval of badger carcasses. They are delivered to the University of Nottingham, where they undergo post-mortem examination and testing for the presence of TB infection by culture. Those that test positive are sent for further whole genome sequencing and clade identification (genetic strain). The project aims to collect 100 fresh, ‘found-dead’ badger carcasses per county, most likely those killed in road traffic accidents (RTA). Once 100 satisfactory carcasses have been examined per county, collection will then cease in that county. Once county targets are achieved, all stakeholders will be informed. The results of this work will help develop a picture of the disease situation in the Southern Edge Area.
As shown in this report, APHA have identified a number of ‘clusters’ of TB infection in Oxfordshire. To tackle these areas of genetically-linked infection, Defra have launched a new ‘Oxfordshire Cluster Project’, starting in two areas (Deddington-Witney-Charlbury and Thame-Chinnor), formally from 1 October 2022. The project aims to give local farmers, veterinary practices, and other stakeholders the responsibility for design and delivery of locally tailored supplementary TB control measures in their area. It will be supported, facilitated, and funded by Defra and will draw on previous, similar projects’ successes.
Defra will assess the project after a year. If it proves effective and the interest and involvement of stakeholders is retained in the area, it is likely to continue for up to 5 years. Ultimately, Defra would like to assess if this approach is replicable in different areas of the country with other genetically-linked clusters.
Increased knowledge and implementation of on-farm biosecurity, better informed purchasing of cattle, continued cattle surveillance, and continued wildlife intervention in the form of culling and/or vaccination is paramount to stop the spread of TB within Oxfordshire and across into neighbouring counties and the Low Risk Area (LRA) over the next few years.
Appendix 1: Cattle industry demographics
Table 1: Number of cattle premises by size band in Oxfordshire at 1 January 2021 (RADAR data)
| Size of herds | Number of herds in Oxfordshire |
|---|---|
| Undetermined | 10 |
| 1-50 | 182 |
| 51-100 | 89 |
| 101-200 | 86 |
| 201-350 | 43 |
| 351-500 | 19 |
| 501+ | 22 |
| Total number of herds | 451 |
| Mean herd size | 132 |
| Median herd size | 66 |
Table 2: Number (and percentage of total) of animals by breed purpose in Oxfordshire at 1 January 2021
| Breed purpose | Number (and percentage of total) cattle in Oxfordshire |
|---|---|
| Beef | 42,808 (71%) |
| Dairy | 13,607 (22%) |
| Dual purpose | 3,083 (5%) |
| Unknown | 2 |
| Total | 59,500 |
Appendix 2: Summary of headline cattle TB statistics
Table 3: Herd-level summary statistics for TB in cattle in Oxfordshire between 2019 and 2021
| Herd-level statistics | 2019 | 2020 | 2021 |
|---|---|---|---|
| (a) Total number of cattle herds live on Sam at the end of the reporting period | 561 | 564 | 531 |
| (b) Total number of whole herd skin tests carried out at any time in the period | 892 | 831 | 822 |
| (c) Total number of OTF cattle herds having TB whole herd tests during the period for any reason | 418 | 406 | 407 |
| (d) Total number of OTF cattle herds at the end of the report period (herds not under any type of Notice Prohibiting the Movement of Bovine Animals (TB02) restrictions) | 477 | 467 | 454 |
| (e) Total number of cattle herds that were not under restrictions due to an ongoing TB incident at the end of the report period | 491 | 491 | 475 |
| (f.1) Total number of new OTF-W TB incidents detected in cattle herds during the report period (including all Finishing Units) | 50 | 47 | 32 |
| (f.2) Total number of new OTF-S TB incidents detected in cattle herds during the report period (including all Finishing Units) | 27 | 25 | 25 |
| (g.1) Of the new OTF-W herd incidents, how many can be considered the result of movement, purchase or contact from or with an existing incident based on current evidence? | 6 | 4 | 4 |
| (g.2) Of the new OTF-W herd incidents, how many were triggered by skin test Reactors or 2x Inconclusive Reactors (IRs) at routine herd tests? | 27 | 24 | 25 |
| (g.3) Of the new OTF-W herd incidents, how many were triggered by skin test Reactors or 2xIRs at other TB test types (such as forward and back-tracings, contiguous or check tests)? | 17 | 17 | 7 |
| (g.4) Of the new OTF-W herd incidents, how many were first detected through routine slaughterhouse (SLH) TB surveillance? | 5 | 3 | 2 |
| (h.1) Number of new OTF-W incidents revealed by enhanced TB surveillance (radial testing) conducted around those OTF-W herds | 0 | 0 | 0 |
| (h.2) Number of new OTF-S incidents revealed by enhanced TB surveillance (radial testing) conducted around those OTF-W herds | 0 | 0 | 0 |
| (i) Number of OTF-W herds still open at the end of the period (including any ongoing OTF-W incidents that began in a previous reporting period, but not including non-grazing Approved Finishing Units) | 53 | 52 | 35 |
| (j) New confirmed (positive M. bovis culture) incidents in non-bovine species detected during the report period (indicate host species involved) | 2 | 3 | 3 (alpaca) |
| (k.1) Number of grazing approved finishing units active at end of the period | 0 | 1 | 1 |
| (k.2) Number of non-grazing approved finishing units active at end of the period | 8 | 9 | 9 |
| (k.3) Number of grazing exempt finishing units active at end of the period | 0 | 0 | 0 |
| (k.4) Number of non-grazing exempt finishing units active at end of the period | 0 | 0 | 0 |
Table 4: Animal-level summary statistics for TB in cattle in Oxfordshire between 2019 and 2021
| Animal-level statistics (cattle) | 2019 | 2020 | 2021 |
|---|---|---|---|
| (a) Total number of cattle tested in the period (animal tests) | 149,950 | 140,052 | 130,751 |
| (b.1) Reactors detected by tuberculin skin tests during the year | 556 | 402 | 320 |
| (b.2) Reactors detected by additional IFN-γ blood tests (skin-test negative or IR animals) during the year | 603 | 390 | 351 |
| (c) Reactors detected during year per incidents disclosed during year | 15.1 | 11.0 | 11.8 |
| (d) Reactors per 1,000 animal tests | 7.7 | 5.7 | 5.1 |
| (e.1) Additional animals slaughtered during the year for TB control reasons (dangerous contacts, including any first time IRs) | 15 | 21 | 34 |
| (e.2) Additional animals slaughtered during the year for TB control reasons (private slaughters) | 7 | 2 | 1 |
| (f) SLH cases (tuberculous carcases) reported by Food Standards Agency (FSA) during routine meat inspection | 18 | 7 | 11 |
| (g) SLH cases confirmed by culture of M. bovis | 9 | 4 | 8 |
Note (c) Reactors detected during year per incidents disclosed during year, reactors may be from incidents disclosed in earlier years, as any found through testing during the report year count here.
Note (g) SLH cases confirmed by culture of M. bovis, not all cases reported are submitted for culture analysis. All cases reported are from any period prior to or during restrictions.
Appendix 3: Suspected sources of M. bovis infection for all the new OTF-W and OTF-S incidents identified in the report period
Each TB incident could have up to 3 potential risk pathways identified. Each risk pathway is given a score that reflects the likelihood of that pathway bringing TB into the herd. The score is recorded as either definite (score 8), most likely (score 6), likely (score 4) or possible (score 1). The sources for each incident are weighted by the certainty ascribed. Any combination of definite, most likely, likely, or possible can contribute towards the overall picture for possible routes of introduction into a herd. If the overall score for a herd is less than 6, then the score is made up to 6 using the ‘Other/Unknown Source’ option. Buffering up to 6 in this way helps to reflect the uncertainty in assessments where only ‘likely’ or ‘possible’ sources are identified.
Table 5 combines the data from multiple herds and provides the proportion of pathways in which each source was identified, weighted by the certainty that each source caused the introduction of TB. The output does not show the proportion of herds where each pathway was identified (this is skewed by the certainty calculation). WGS of M. bovis isolates can be a powerful tool in identifying a likely source of infection, however WGS clades are not determined for OTF-S herds. As a result of varying levels of uncertainty, only broad generalisations should be made from these data. A more detailed description of this methodology is provided in the explanatory supplement for the annual reports 2021.
Table 5: Suspected sources of M. bovis infection for all new OTF-W and OTF-S incidents identified in Oxfordshire, in 2021
| Source of infection | Possible (1) | Likely (4) | Most likely (6) | Definite (8) | Weighted contribution |
|---|---|---|---|---|---|
| Badgers | 9 | 20 | 25 | 1 | 56.0% |
| Cattle movements | 22 | 10 | 5 | 0 | 19.7% |
| Contiguous | 0 | 0 | 0 | 0 | 0.0% |
| Residual cattle infection | 20 | 9 | 4 | 0 | 16.8% |
| Domestic animals | 0 | 0 | 0 | 0 | 0.0% |
| Non-specific reactor | 0 | 1 | 0 | 0 | 0.7% |
| Fomites | 0 | 0 | 0 | 0 | 0.0% |
| Other wildlife | 6 | 0 | 0 | 0 | 1.6% |
| Other or unknown source | 2 | 0 | 0 | 0 | 5.2% |
Please note that each TB incident could have up to 3 potential pathways so totals may not equate to the number of actual incidents that have occurred.