Nottinghamshire (edge area) year end report 2021
Updated 16 February 2023

© Crown copyright 2023
This publication is licensed under the terms of the Open Government Licence v3.0 except where otherwise stated. To view this licence, visit nationalarchives.gov.uk/doc/open-government-licence/version/3 or write to the Information Policy Team, The National Archives, Kew, London TW9 4DU, or email: psi@nationalarchives.gov.uk.
Where we have identified any third party copyright information you will need to obtain permission from the copyright holders concerned.
This publication is available at https://www.gov.uk/government/publications/bovine-tb-epidemiology-reports-2021/nottinghamshire-edge-area-year-end-report-2021
Introduction
The Edge Area was originally established in 2013. In 2014, the bovine tuberculosis (TB) surveillance strategy for this area was incorporated into the UK Government’s Strategy to achieve Officially Bovine Tuberculosis-Free (OTF) status for England by 2038. A key action was to recognise the different levels of TB in different parts of the country and to vary the approach to control accordingly. The aim is to obtain OTF status for the Edge Area as soon as possible.
This report describes the frequency and geographical distribution of TB in 2021 in cattle herds in Nottinghamshire, which forms part of the Edge Area. It examines what factors are likely to be driving TB in this area, and the risks the disease in this county may pose to neighbouring areas.
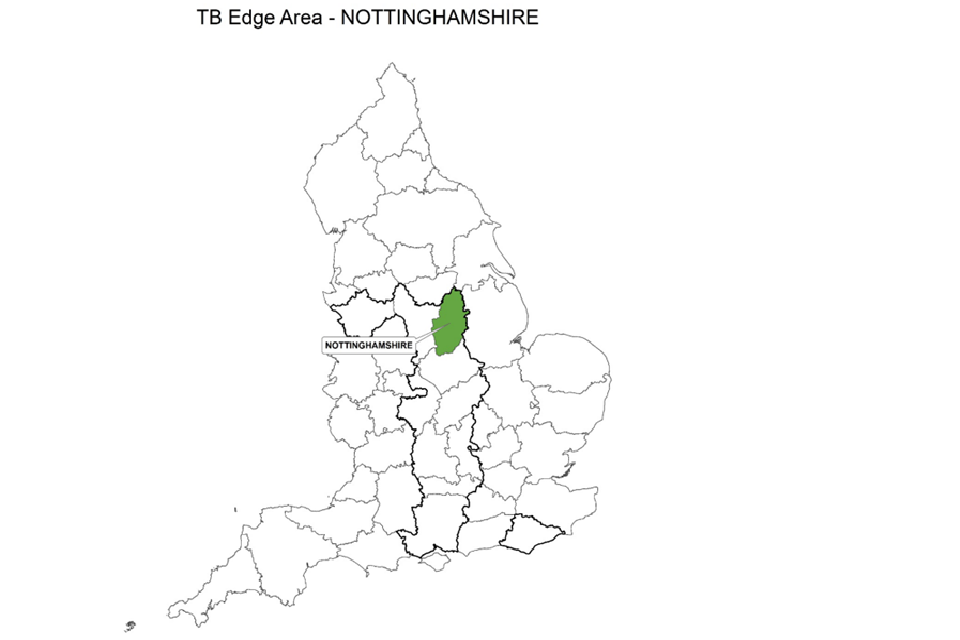
County map of England showing the Edge Area and highlighting the county of Nottinghamshire.
TB in cattle and other mammals is primarily caused by the bacterium Mycobacterium bovis (M. bovis), and the disease is subsequently referred to in this report as TB. Although other sources may refer to TB ‘breakdowns’, this report will use the term ‘incidents’ throughout.
This report is intended for individuals involved in the control of TB, both locally and nationally. This includes, but is not limited to farmers, veterinarians, policy makers and the scientific community.
Details of the data handling methodology used in this report, a glossary of terms, and the TB control measures adopted in the Edge Area, can be found in the explanatory supplement for the annual reports 2021.
Types of TB incident
Unless otherwise specified, this report includes all new TB incidents detected during the reporting period. This includes ‘Officially Tuberculosis-Free Status Withdrawn’ (OTF-W) incidents and ‘Officially Tuberculosis-Free Status Suspended’ (OTF-S) incidents.
OTF-W incidents are those involving one or more test reactors with typical lesions of TB identified at post-mortem meat inspection, or one or more animals with M. bovis- positive culture results from tissue samples collected at slaughter, or both.
OTF-S incidents are triggered by reactors to the Single Intradermal Comparative Cervical Tuberculin (SICCT) test, but without subsequent detection of TB lesions or positive culture results from tissue samples collected from carcases during the PM inspection, or both.
TB incidents in non-grazing Approved Finishing Units (AFUs) are not included in the prevalence and incidence calculations in this report due to the limited epidemiological impact of these cases.
Furthermore, herds restricted because of an overdue test rather than a TB incident are also excluded from calculations. Hence measures of incidence and prevalence in this report may be lower than those reported in the official TB statistics.
Cattle industry
Appendix 1 provides cattle industry demographics in the Nottinghamshire, beef herds account for 67% of the cattle enterprise. This is partly due to the significant arable industry providing high-energy by-products for the finishing of beef cattle. The majority of herds, 53%, continue to be small with up to 50 cattle. Following the closure of Newark Livestock Market in 2019, there are no livestock markets in Nottinghamshire. The closest is Melton Market in Leicestershire. In 2021, there were 10 Approved Finishing Units (AFUs) and one Exempt Finishing Unit (EFU) in Nottinghamshire, all non-grazing. No new AFUs were approved in 2021.
New TB incidents
The number of new TB incidents increased in 2021 compared to 2020, from 13 to 21 (Figure 1). This was mainly due to a doubling of new OTF-W incidents, from 5 in 2020 to 11 in 2021, which is a concern. The number of OTF-S TB incidents remained similar to 2020.
None of the cattle incidents reported in 2021 were considered unusual, and there were no incidents of TB reported in non-bovine species.
Figure 1: Annual number of new TB incidents in Nottinghamshire, from 2012 to 2021.
| Year | OTF-W | OTF-S | Total |
|---|---|---|---|
| 2012 | 3 | 3 | 6 |
| 2013 | 11 | 10 | 21 |
| 2014 | 5 | 9 | 14 |
| 2015 | 5 | 13 | 18 |
| 2016 | 8 | 15 | 23 |
| 2017 | 5 | 8 | 13 |
| 2018 | 9 | 8 | 17 |
| 2019 | 5 | 9 | 14 |
| 2020 | 5 | 8 | 13 |
| 2021 | 11 | 10 | 21 |
Incidence of TB
Figure 2 provides annual incidence rate in Nottinghamshire for all new incidents. Of the 11 Edge Area counties, Nottinghamshire had the second lowest incidence of TB per 100 herd-years at risk (5.3). This was lower than the Edge Area overall (8.9), although Nottinghamshire recorded the highest incidence of the past decade in 2021. Further years of data are needed to assess if this is transient or sustained increase.
Figure 2: Annual incidence rate (per 100 herd-years at risk) for all new incidents (OTF-W and OTF- S) in Nottinghamshire, from 2012 to 2021.
| Year | TB incidence per 100 herd years at risk |
|---|---|
| 2012 | 1.6 |
| 2013 | 3.3 |
| 2014 | 2.3 |
| 2015 | 4.0 |
| 2016 | 5.2 |
| 2017 | 3.1 |
| 2018 | 3.9 |
| 2019 | 3.4 |
| 2020 | 3.2 |
| 2021 | 5.3 |
Prevalence of TB
Figure 3 shows whole-county herd prevalence in 2021 increased almost threefold since 2020, from 1.0% to 2.8%. This was driven by increases in the south of the county, within the confirmed TB Hotspot 23 (HS23) area, or near its border.
Figure 3: Annual end of year prevalence in Nottinghamshire, from 2012 to 2021.
| Year | Proportion of herds under restriction (%) |
|---|---|
| 2012 | 0.37 |
| 2013 | 1.82 |
| 2014 | 1.09 |
| 2015 | 1.71 |
| 2016 | 1.72 |
| 2017 | 1.33 |
| 2018 | 1.78 |
| 2019 | 0.99 |
| 2020 | 0.99 |
| 2021 | 2.79 |
As prevalence is a point calculation, it is dependent on the number of herds with active TB incidents at the end of the year. The increase in prevalence in 2021 may be due to several factors.
The median duration of OTF-W incidents that closed in 2021 increased to 221.5 days compared to 186.5 days in 2020. This longer duration of incidents could be due to a combination of delays in TB testing such as COVID-19 impacts and diversion of resource during the highly pathogenic avian influenza (AI) outbreak.
Furthermore, the timing of new incidents in year can impact the prevalence value. Figure 4 shows 9 of the 21 new OTF-S and OTF-W incidents were disclosed towards the end of 2021, these would not have had time to resolve before the end of the calendar year. This was in contrast to other years when the majority of incidents in Nottinghamshire were disclosed in the spring.
Figure 4: Number of new TB incidents (OTF-W and OTF-S) in Nottinghamshire in 2021, by month of disclosure.
| Month | OTF-W | OTF-S | Total |
|---|---|---|---|
| January | 0 | 2 | 2 |
| February | 0 | 0 | 0 |
| March | 0 | 0 | 0 |
| April | 3 | 3 | 6 |
| May | 0 | 1 | 1 |
| June | 0 | 0 | 0 |
| July | 1 | 0 | 1 |
| August | 2 | 0 | 2 |
| September | 1 | 0 | 1 |
| October | 0 | 1 | 1 |
| November | 1 | 2 | 3 |
| December | 3 | 1 | 4 |
Geographical distribution of TB incidents
Figure 5 shows TB incidents in 2021 were concentrated in the south and centre of the county, which mirrors the higher density of cattle holdings in these areas. This was similar to the distribution of incidents in 2020.
Figure 5: Location of cattle holdings in Nottinghamshire with new TB incidents (OTF-W and OTF-S) in 2021 and cattle holdings with pre-2021 OTF-W incidents still ongoing at the beginning of 2021, overlaid on a cattle density map. Note that ‘OTF-W Introduced 2021’ refers to OTF-W incidents in which cattle movements were the most likely source of infection.
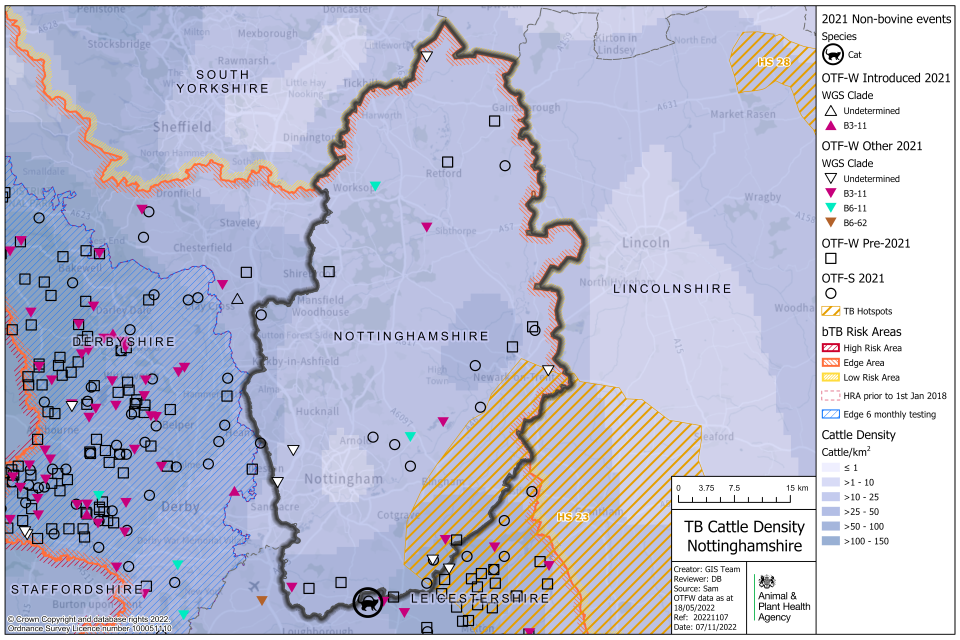
TB incidents in 2021 were concentrated in the south and centre of Nottinghamshire, where there is a higher density of cattle holdings.
Half of the incidents in the south of the county were clustered within HS23, along the Leicestershire border. TB HS23 is associated with Whole Genome Sequence (WGS) clade B3-11 (previously identified as genotype 25:a). HS23 was confirmed in a contiguous area of south west Lincolnshire and north east Leicestershire in 2018.
Cattle and susceptible non-bovine farmed species (deer, goats, camelids) are subjected to enhanced TB surveillance and control measures. Wildlife carcasses (deer, badger) recovered in the area have been monitored for TB by laboratory analysis since 2018.
Following the identification of M. bovis infection in a found dead badger, the original hotspot boundary was reviewed in June 2020. It was extended further into Leicestershire and Lincolnshire and included part of south east Nottinghamshire.
No badger culling occurs in Nottinghamshire. However, a survey of found-dead badgers and wild deer continues in the HS23 portion of this county. During 2021, a single badger carcass was reported to APHA in Nottinghamshire, but it was unsuitable for post-mortem examination.
The absence of TB surveillance data leads to uncertainty around the disease status of wildlife in Nottinghamshire, which impacts the degree of certainty about the source of infection for TB incidents in cattle. Over half of the 11 OTF-W incidents detected in 2021 had an undetermined source of infection (Figure 6). In order to improve these data it is imperative that stakeholders continue to report found-dead badgers and wild deer within HS23 to APHA.
Figure 6: Map of the source of infection pathway recorded with the highest level of certainty, for all TB incidents (OTF-W and OTF-S) in Nottinghamshire that started in 2021. Local cattle refer to both residual infection and contiguous cattle risk pathways. Purchased refers to all cattle movement risk pathways. Wildlife refers to both badger and other wildlife risk pathways. Where none of the sources of infection were identified with greater than 50% certainty, the highest ranking source is displayed with an OTF-W undetermined ‘maximum DRF category’ symbol.
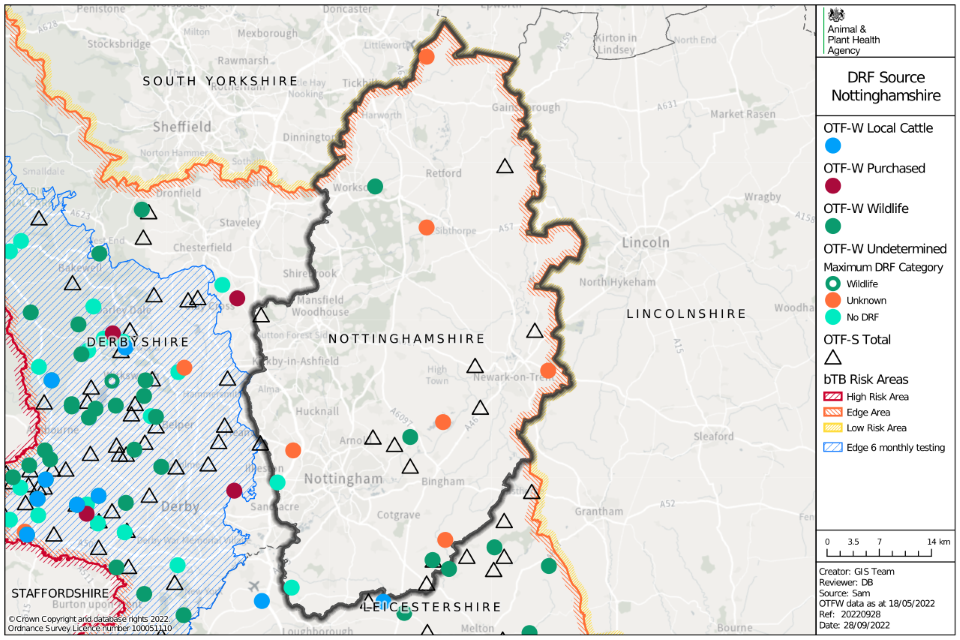
Map of Nottinghamshire showing data points of OTF-W as circles, and OTF-S as triangles. Colour is used to denote whether the source is from local cattle, purchased, wildlife or is undetermined.
A further cluster of cattle TB incidents have been identified during 2021, along a corridor from Newark to Nottingham, just to the north of the HS23 border (Figures 5 and 6). This cluster consists of 3 OTF-W and 6 OTF-S incidents. The sources of infection for the OTF- W incidents were not identified as cattle movements, raising concerns that local spread could be a cause (Figure 6).
Sporadic cases have been identified in this area in previous years. In 2019, there were 2 OTF-W incidents and one in 2020 (Figure 5); all of which were attributed to a purchased source. These earlier incidents were identified as WGS clades B3-11 (genotype 25) and B6-11 (genotype 17). These clades were also identified in the area in 2021.
There are 2 hypotheses for the origin of this Nottingham to Newark cluster:
TB could have spread from HS23 via wildlife. There is however a significant physical distance between the TB incidents on the southern Nottinghamshire border within HS23 and this area. It is unlikely that wildlife could have spead TB without causing any cattle TB incidents in herds situated between the infected herds.
The second hypothesis is that TB was translocated by movements of undetected infected cattle in earlier years, with subsequent local spread. This is supported by the conclusion of the veterinary source attribution assessments, but further in-depth investigation by APHA is required to confirm.
Overall, in Nottinghamshire, wildlife-linked incidents appear to be increasing. The incidents with a high certainty of wildlife involvement in 2021 were both linked to clade B6-11 of M. bovis (Figure 7). In 2020 and 2019, no incidents were attributed to wildlife with a high certainty. Analysis in November 2021 of WGS clades of M. bovis isolated in cattle across GB (data not shown) identified endemicity of clade B3-11 in two areas of Nottinghamshire: the southern edge of the county, along the border with northeast Leicestershire (HS23), and the western edge of the county along the border with Derbyshire.
It therefore may be that the B6-11 incidents are not truly wildlife-linked. These 2 cases do not confirm endemic infection in wildlife or cattle populations in this area. Further investigation is needed.
Figure 7: WGS clades of M. bovis detected in Nottinghamshire between 2018 and 2021, where wildlife sources were attributed with a 75% certainty or above according to the DRF calculation, as an indication of local M. bovis reservoir in local wildlife populations (OTF-W incidents only).
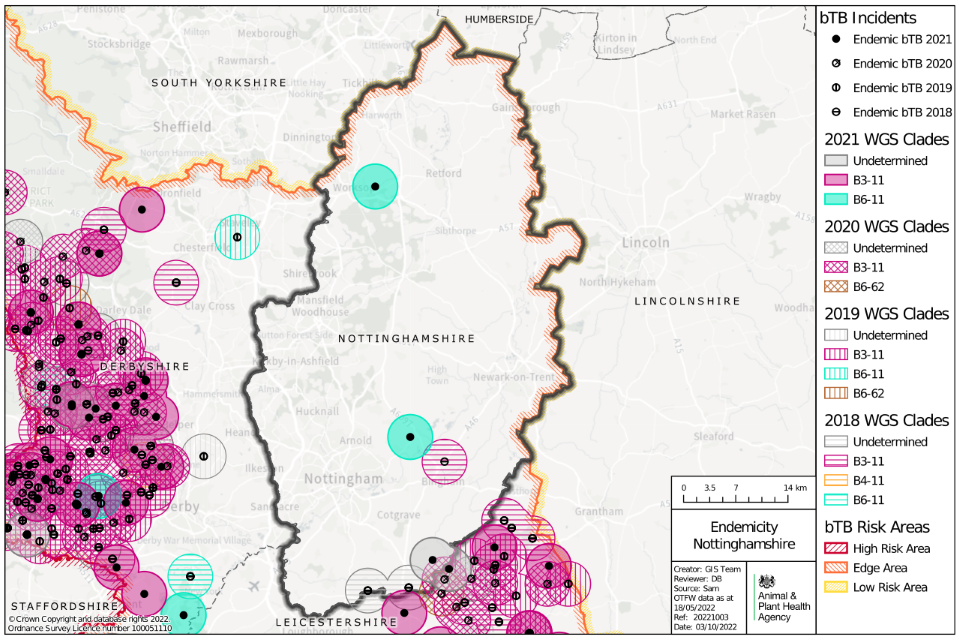
Map of Nottinghamshire showing locations of possible wildlife reservoirs of TB as points, between 2018 and 2021. Circles surrounding the points are coloured by TB WGS clade and year.
Incidents by herd type
In previous years, TB incidents have been associated with beef rather than dairy farms in Nottinghamshire. However, in 2021, over half (11 of the 21) of new TB incidents occurred on dairy farms (Figure 8). Traditionally, dairy farms purchase fewer cattle, and are at lower risk of bringing in TB. Therefore, it is concerning that dairy incidents are increasing. This may be due to geography; most dairy farms are in the south of the county, which is where the TB burden is highest. Further work is needed to analyse this distribution.
Figure 8: Number of new TB incidents (OTF-W and OTF-S) in Nottinghamshire in 2021, by cattle herd size and type.

Herd size: 1-50: 2 OTF-S; 51-100: 1 OTF-W, 2 OTF-S; 101-200: 4 OTF-W; 201-350: 3 OTF-W, 4 OTF-S; 351-500: 1 OTF-W; 501+: 2 OTF-W, 2 OTF-S. Herd type: beef suckler: 4 OTF-W, 2 OTF-S; beef fattener: 1 OTF-W, 3 OTF-S; dairy: 6 OTF-W, 5 OTF-S.
Incidents by surveillance type
Routine TB surveillance of cattle herds in Nottinghamshire takes place by annual whole- herd testing (WHT), which disclosed the highest number of new incidents in 2021 (9 of 21 incidents. The WHT also disclosed the highest proportion of OTF-W incidents (36%), similar to previous years.
Figure 9: Number of TB incidents (OTF-W and OTF-S) in Nottinghamshire, from 2012 to 2021, according to the surveillance methods that detected them.
| Year | New herd test (NH) | Hotspot test (HS) | Whole herd test (WHT) | Tracing test (TR) | Slaughterhouse case (SLH) | Routine herd test (RHT) | Radial test (RAD) | Pre-movement test (PRMT) | Other test (OTHER) | 6 month test (6M) | 12 month test (12M) | Total |
|---|---|---|---|---|---|---|---|---|---|---|---|---|
| 2012 | 0 | 0 | 0 | 0 | 2 | 3 | 0 | 1 | 0 | 0 | 0 | 6 |
| 2013 | 0 | 0 | 9 | 2 | 4 | 0 | 0 | 5 | 0 | 1 | 0 | 21 |
| 2014 | 1 | 0 | 8 | 1 | 1 | 0 | 0 | 3 | 0 | 0 | 0 | 14 |
| 2015 | 0 | 0 | 10 | 0 | 3 | 0 | 0 | 2 | 1 | 2 | 0 | 18 |
| 2016 | 0 | 0 | 16 | 0 | 6 | 0 | 0 | 1 | 0 | 0 | 0 | 23 |
| 2017 | 0 | 0 | 9 | 1 | 0 | 0 | 0 | 0 | 0 | 1 | 2 | 13 |
| 2018 | 0 | 0 | 8 | 1 | 2 | 0 | 3 | 2 | 0 | 2 | 0 | 18 |
| 2019 | 0 | 0 | 10 | 0 | 3 | 0 | 1 | 0 | 0 | 0 | 0 | 14 |
| 2020 | 0 | 0 | 9 | 0 | 3 | 0 | 1 | 0 | 0 | 0 | 0 | 13 |
| 2021 | 0 | 1 | 9 | 1 | 1 | 0 | 6 | 1 | 0 | 1 | 1 | 21 |
Radial testing (RAD) is a targeted TB surveillance skin test carried out on cattle holdings situated within a 3km radius of new OTF-W TB incidents in the annual testing portion of the Edge Area, which includes Nottinghamshire. RAD testing disclosed the second highest number of new incidents in 2021: 6 of 21 incidents, and accounted for the second highest proportion of OTF-W incidents disclosed (27%). These data demonstrate RAD testing is preventing the lateral spread of disease in Nottinghamshire.
It is worth noting that only one incident was triggered by slaughterhouse (SLH) surveillance in 2021, an improvement upon the previous average of 3 each year. This may be due to improved on-farm testing, detecting disease earlier and before slaughter. It remains to be seen if this pattern continues.
Main risk pathways and key drivers for TB infection
The main risk pathways and key drivers for TB infection within Nottinghamshire are considered here. Evidence collected during APHA veterinary investigations into the source of infection within herds is used to inform this understanding. In 2021, 16 out of 21 (76%) of new TB incidents in Nottinghamshire received a preliminary or final APHA veterinary investigation to identify the source of infection.
It can be challenging to retrospectively establish the route of infection for a TB incident herd. Ideally this investigation includes a thorough on-farm investigation and scrutiny of routinely collected data; such as cattle movement records, and the results of WGS where available. Up to 3 hazards and risk pathways are selected for each incident investigated.
Each of these potential sources are given a score that reflects the likelihood of that pathway being the true one, based on the available evidence.
Details of the protocol used for these investigations, and the subsequent methodology used to calculate the weighted contribution of the different suspected sources of M. bovis infection can be found in the explanatory supplement to the annual reports 2021.
The key drivers of the TB epidemic in Nottinghamshire during 2021 were as follows:
- exposure to probable infected badgers
- exposure to other probable infected wildlife
Figure 10 presents the aggregated results of the APHA investigations into the source of infection. Further details are presented in Appendix 3, Table 5.
Figure 10: Summary of the weighted source of infection pathways attributed for OTF-W and OTF-S TB incidents that started in 2021 in Nottinghamshire, that had a completed DRF (n=16).

Sources attributed were badgers (33%), cattle movement (2%), residual infection (2%), fomites (1%), other wildlife source (7%), and other or unknown source (56%), n=16.
The number of incidents contributing to Figure 10 is low, and so the source is sensitive to change. In 2020, the aggregated weighted contribution to the sources of infection for incident herds in Nottinghamshire was 10% badgers, 20% cattle movements. There was a switch to 33% badgers in 2021, but only 3 incidents had a most likely badger source, see Appendix 3, Table 5.
Other wildlife was identified as the second most important driver, most likely deer (7%).
Other or unknown sources of infection had a weighted contribution of 56%. This is the highest of any Edge Area county and this relatively high level of uncertainty in Nottinghamshire was also seen in previous years. This category is added to herds where there was high uncertainty around the selected pathways. See the explanatory supplement for details of the methodology used.
Forward look
With an increasing number of incidents there is concern about the future of TB control in Nottinghamshire. It may be a cyclical event, but it may also deteriorate further with the possibility of endemic infection in the south of the county. It seems unlikely for Nottinghamshire to become eligible for OTF status by 2025 as set out in the Strategy for achieving OTF status for England, published in 2014.
There are several measures that would help address the most common risk pathways for TB infection in Nottinghamshire. These include:
- further work by APHA and stakeholders to determine the most likely risk pathways for incidents with an uncertain pathway at present - this may include looking further at local wildlife sources and encouraging farmers in the HS23 portion to continue reporting badger and deer carcases
- managing the TB risks posed by cattle movements to reduce the risk of spread of TB within and between farms - this is most appropriate in the central area, which has had imported disease in previous years
- continuation and further adoption of measures to prevent the spread of TB from wildlife
Appendix 1: Cattle industry demographics
Table 1: Number of cattle premises by size band in Nottinghamshire at 1 January 2021 (RADAR data)
| Size of herds | Number of herds in Nottinghamshire |
|---|---|
| Undetermined | 10 |
| 1-50 | 220 |
| 51-100 | 65 |
| 101-200 | 62 |
| 201-350 | 33 |
| 351-500 | 14 |
| 501+ | 14 |
| Total number of herds | 418 |
| Mean herd size | 104 |
| Median herd size | 42 |
Table 2: Number (and percentage of total) of animals by breed purpose in Nottinghamshire at 1 January 2021
| Breed purpose | Number (and percentage of total) cattle in Nottinghamshire |
|---|---|
| Beef | 29,205 (67%) |
| Dairy | 12,990 (29%) |
| Dual purpose | 1,255 (2%) |
| Unknown | 0 |
| Total | 43,450 |
Appendix 2: Summary of headline cattle TB statistics
Table 3: Herd-level summary statistics for TB in cattle in Nottinghamshire between 2019 and 2021
| Herd-level statistics | 2019 | 2020 | 2021 |
|---|---|---|---|
| (a) Total number of cattle herds live on Sam at the end of the reporting period | 515 | 515 | 476 |
| (b) Total number of whole herd skin tests carried out at any time in the period | 514 | 478 | 464 |
| (c) Total number of OTF cattle herds having TB whole herd tests during the period for any reason | 413 | 394 | 396 |
| (d) Total number of OTF cattle herds at the end of the report period (herds not under any type of Notice Prohibiting the Movement of Bovine Animals (TB02) restrictions) | 496 | 481 | 436 |
| (e) Total number of cattle herds that were not under restrictions due to an ongoing TB incident at the end of the report period | 507 | 506 | 459 |
| (f.1) Total number of new OTF-S TB incidents detected in cattle herds during the report period (including all Finishing Units) | 9 | 8 | 10 |
| (f.2) Total number of new OTF-W TB incidents detected in cattle herds during the report period (including all Finishing Units) | 5 | 5 | 11 |
| (g.1) Of the new OTF-W herd incidents, how many can be considered the result of movement, purchase or contact from or with an existing incident based on current evidence? | 3 | 2 | 0 |
| (g.2) Of the new OTF-W herd incidents, how many were triggered by skin test Reactors or 2x inconclusive reactors (IRs) at routine herd tests? | 2 | 1 | 4 |
| (g.3) Of the new OTF-W herd incidents, how many were triggered by skin test Reactors or 2xIRs at other TB test types (such as forward and back-tracings, contiguous or check tests)? | 0 | 0 | 6 |
| (g.4) Of the new OTF-W herd incidents, how many were first detected through routine slaughterhouse TB surveillance? | 3 | 3 | 1 |
| (h.1) Number of new OTF-W incidents revealed by enhanced TB surveillance (radial testing) conducted around those OTF-W herds | 3 | 0 | 1 |
| (h.2) Number of new OTF-S incidents revealed by enhanced TB surveillance (radial testing) conducted around those OTF-W herds | 3 | 1 | 0 |
| (i) Number of OTF-W herds still open at the end of the period (including any ongoing OTF-W incidents that began in a previous reporting period, but not including non-grazing Approved Finishing Units) | 3 | 1 | 8 |
| (j) New confirmed (positive M. bovis culture) incidents in non-bovine species detected during the report period (indicate host species involved) | 0 | 0 | 0 |
| (k.1) Number of grazing approved finishing units active at end of the period | 0 | 0 | 0 |
| (k.2) Number of non-grazing approved finishing units active at end of the period | 9 | 10 | 10 |
| (k.3) Number of grazing exempt finishing units active at end of the period | 0 | 0 | 0 |
| (k.4) Number of non-grazing exempt finishing units active at end of the period | 1 | 1 | 1 |
Table 4: Animal-level summary statistics for TB in cattle in Nottinghamshire between 2019 and 2021
| Animal-level statistics (cattle) | 2019 | 2020 | 2021 |
|---|---|---|---|
| (a) Total number of cattle tested in the period (animal tests) | 58,057 | 53,735 | 58,456 |
| (b.1) Reactors detected by tuberculin skin tests during the year | 41 | 23 | 62 |
| (b.2) Reactors detected by additional IFN-γ blood tests (skin-test negative or IR animals) during the year | 36 | 9 | 44 |
| (c) Reactors detected during year per incidents disclosed during year | 5.5 | 2.5 | 5.0 |
| (d) Reactors per 1,000 animal tests | 1.3 | 0.6 | 1.8 |
| (e.1) Additional animals slaughtered during the year for TB control reasons (dangerous contacts, including any first time IRs) | 3 | 4 | 1 |
| (e.2) Additional animals slaughtered during the year for TB control reasons (private slaughters) | 6 | 1 | 5 |
| (f) SLH cases (tuberculous carcases) reported by Food Standards Agency (FSA) during routine meat inspection | 12 | 6 | 3 |
| (g) SLH cases confirmed by culture of M. bovis | 4 | 4 | 1 |
Note (c) Reactors detected during year per incidents disclosed during year, reactors may be from incidents disclosed in earlier years, as any found through testing during the report year count here.
Note (g) SLH cases confirmed by culture of M. bovis, not all cases reported are submitted for culture analysis. All cases reported are from any period prior to or during restrictions.
Appendix 3: Suspected sources of M. bovis infection for all the new OTF-W and OTF-S incidents identified in the report period
Each TB incident could have up to 3 potential risk pathways identified. Each risk pathway is given a score that reflects the likelihood of that pathway bringing TB into theherd. The score is recorded as either definite (score 8), most likely (score 6), likely (score 4) or possible (score 1). The sources for each incident are weighted by the certainty ascribed. Any combination of definite, most likely, likely, or possible can contribute towards the overall picture for possible routes of introduction into a herd. If the overall score for a herd is less than 6, then the score is made up to 6 using the ‘Other/Unknown Source’ option.
Buffering up to 6 in this way helps to reflect the uncertainty in assessments where only ‘likely’ or ‘possible’ sources are identified.
Table 5 combines the data from multiple herds and provides the proportion of pathways in which each source was identified, weighted by the certainty that each source caused the introduction of TB. The output does not show the proportion of herds where each pathway was identified (this is skewed by the certainty calculation). WGS of M. bovis isolates can be a powerful tool in identifying a likely source of infection, however WGS clades are not determined for OTF-S herds. As a result of varying levels of uncertainty, only broad generalisations should be made from these data. A more detailed description of this methodology is provided in the Explanatory supplement for the annual reports 2021.
Table 5: Suspected sources of M. bovis infection for all new OTF-W and OTF-S incidents identified in Nottinghamshire, in 2021
| Source of infection | Possible (1) | Likely (4) | Most likely (6) | Definite (8) | Weighted contribution |
|---|---|---|---|---|---|
| Badgers | 8 | 4 | 3 | 0 | 32.7% |
| Cattle movements | 2 | 0 | 0 | 0 | 1.6% |
| Contiguous | 0 | 0 | 0 | 0 | 0.0% |
| Residual Cattle Infection | 2 | 0 | 0 | 0 | 1.7% |
| Domestic animals | 0 | 0 | 0 | 0 | 0.0% |
| Non-specific reactor | 0 | 0 | 0 | 0 | 0.0% |
| Fomites | 1 | 0 | 0 | 0 | 1.0% |
| Other wildlife | 2 | 2 | 0 | 0 | 6.7% |
| Other or unknown source | 3 | 0 | 0 | 0 | 56.3% |
Please note that each TB incident could have up to 3 potential pathways so totals may not equate to the number of actual incidents that have occurred.