Northamptonshire (edge area) year end report 2021
Updated 16 February 2023

© Crown copyright 2023
This publication is licensed under the terms of the Open Government Licence v3.0 except where otherwise stated. To view this licence, visit nationalarchives.gov.uk/doc/open-government-licence/version/3 or write to the Information Policy Team, The National Archives, Kew, London TW9 4DU, or email: psi@nationalarchives.gov.uk.
Where we have identified any third party copyright information you will need to obtain permission from the copyright holders concerned.
This publication is available at https://www.gov.uk/government/publications/bovine-tb-epidemiology-reports-2021/northamptonshire-edge-area-year-end-report-2021
Introduction
The Edge Area was originally established in 2013. In 2014, the bovine tuberculosis (TB) surveillance strategy for this area was incorporated into the UK Government’s Strategy to achieve Officially Bovine Tuberculosis-Free (OTF) status for England by 2038. A key action was to recognise the different levels of TB in different parts of the country and to vary the approach to control accordingly. The aim is to obtain OTF status for the Edge Area as soon as possible.
This report describes the frequency and geographical distribution of TB in 2021 in cattle herds in Northamptonshire, which forms part of the Edge Area. It examines what factors are likely to be driving TB in this area, and the risks the disease in this county may pose to neighbouring areas.
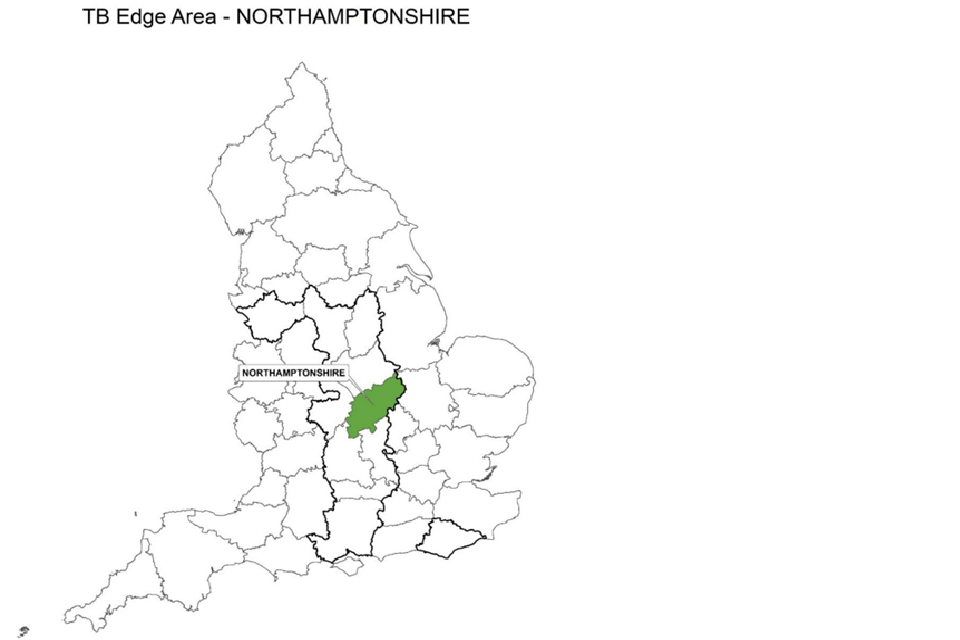
County map of England showing the Edge Area and highlighting the county of Northamptonshire.
TB in cattle and other mammals is primarily caused by the bacterium Mycobacterium bovis (M. bovis), and the disease is subsequently referred to in this report as TB. Although other sources may refer to TB ‘breakdowns’, this report will use the term ‘incidents’ throughout.
This report is intended for individuals involved in the control of TB, both locally and nationally. This includes, but is not limited to farmers, veterinarians, policy makers and the scientific community.
Details of the data handling methodology used in this report, a glossary of terms, and the TB control measures adopted in the Edge Area, can be found in the explanatory supplement for the annual reports 2021.
Types of TB incident
Unless otherwise specified, this report includes all new TB incidents detected during the reporting period. This includes ‘Officially Tuberculosis-Free Status Withdrawn’ (OTF-W) incidents and ‘Officially Tuberculosis-Free Status Suspended’ (OTF-S) incidents.
OTF-W incidents are those involving one or more test reactors with typical lesions of TB identified at post-mortem meat inspection, or one or more animals with M. bovis- positive culture results from tissue samples collected from carcases during the post-mortem inspection, or both.
OTF-S incidents are triggered by reactors to the Single Intradermal Comparative Cervical Tuberculin (SICCT) test, but without subsequent detection of TB lesions or positive culture results in any of those animals.
TB incidents in Approved Finishing Units (AFUs) without grazing are not included in the prevalence and incidence calculations in this report due to the limited epidemiological impact of these incidents.
Furthermore, herds restricted because of an overdue test rather than a TB incident are also excluded from calculations. Hence measures of incidence and prevalence in this report may be lower than those reported in the official TB statistics.
Cattle industry
Northamptonshire has a low herd and cattle density, with most cattle situated in the western half of the county. The total number of cattle remained steady in 2021, with only a 2% increase since 2020, to 49,151. This is a stabilisation of the decline seen over previous years. Small holdings (fewer than 50 cattle) accounted for 48% of the herds. Beef animals accounted for 86% of the total cattle population in the county, as shown in Appendix 1.
There is a single livestock auction market, Thrapston, but also substantial cattle trade into the county from Rugby market in Warwickshire and Thame market in Oxfordshire (both Edge Area counties adjoining Northamptonshire). There were 14 registered Approved Finishing Units (AFUs) in Northamptonshire in 2021, an increase of one from 2020, as indicated in Appendix 2). There remains one Exempt Finishing Unit (EFU), for the fattening of cattle from 6-monthly and annually tested herds that had not been pre-movement tested for TB.
New TB incidents
The number of new TB incidents decreased in 2021 compared to 2020, from 37 to 35 (19 of which were OTF-W and 16 OTF-S), as displayed in Figure 1. This was the first year since 2015 that there has been an overall decrease in the number of new incidents in Northamptonshire.
Figure 1: Annual number of new TB incidents in Northamptonshire, from 2012 to 2021.
| Year | OTF-W | OTF-S | Total |
|---|---|---|---|
| 2012 | 9 | 7 | 16 |
| 2013 | 4 | 7 | 11 |
| 2014 | 7 | 10 | 17 |
| 2015 | 8 | 8 | 16 |
| 2016 | 7 | 11 | 18 |
| 2017 | 13 | 12 | 25 |
| 2018 | 15 | 15 | 30 |
| 2019 | 16 | 18 | 34 |
| 2020 | 22 | 15 | 37 |
| 2021 | 19 | 16 | 35 |
In 2021, most incidents were detected by radial (RAD) and annual whole-herd surveillance testing (WHT), as shown in Figure 2. Since the introduction of radial testing in 2018, there has been an increase of early disease detection. This minimises lateral spread of TB and is proving to be an effective tool for disease control. Radial testing detected almost 38% of incidents in 2021, which was similar to 2020.
Figure 2: Number of new TB incidents (OTF-W and OTF-S) in Northamptonshire in 2021, according to the surveillance methods that detected them.
| Surveillance method | OTF-W | OTF-S | Total |
|---|---|---|---|
| 12 month test (12M) | 1 | 0 | 1 |
| 6 month test (6M) | 1 | 1 | 2 |
| Other test (OTHER) | 0 | 1 | 1 |
| Pre-movement test (PRMT) | 2 | 0 | 2 |
| Radial test (RAD) | 7 | 6 | 13 |
| Slaughterhouse case (SLH) | 2 | 0 | 2 |
| Tracing test (TR) | 0 | 1 | 1 |
| Whole herd test (WHT) | 6 | 7 | 13 |
Unusual TB incidents
A 2-month-old calf in an OTF-W suckler herd was disclosed as a skin test reactor in the annual whole-herd test (WHT). The post-mortem inspection presented an unusual finding for such a young calf, with very large and pronounced visible lesions of TB in the mediastinal lymph nodes. The dam, a 10-year-old cow, was negative on the initial decoupled interferon gamma (IFN-γ) blood test and later became a skin test reactor, but had no visible lesions of TB at post-mortem inspection.
TB in other species
There is no statutory routine ante-mortem TB surveillance of non-bovine species. Post- mortem examination is performed on suspected clinical incidents reported to APHA and livestock killed for human consumption. Post-mortem tissue samples from 3 non- bovine animals with suspected lesions of TB were analysed in 2021, but all of them gave negative results on bacteriological culture.
No badger vaccination or culling was undertaken in Northamptonshire in 2021.
Incidence of TB
Northamptonshire had the sixth highest incidence rate (8.0) of TB per 100 herd-years at risk out of the 11 Edge Area counties. This rate remained below the Edge Area overall (8.9) and represented a decrease relative to 2020 (8.8 in 2020), as displayed in Figure 3. This was the first year since 2015 that the herd incidence rate fell after a steady increase from 3.1 in 2015 to 8.8 in 2020. Further data in the coming years will be required to make an overall assessment on whether incidence is truly declining.
Figure 3: Annual incidence rate (per 100 herd-years at risk) for all new incidents (OTF-W and OTF- S) in Northamptonshire, from 2012 to 2021.
| Year | TB incidence per 100 herd years at risk |
|---|---|
| 2012 | 3.7 |
| 2013 | 1.5 |
| 2014 | 2.3 |
| 2015 | 3.1 |
| 2016 | 3.5 |
| 2017 | 5.1 |
| 2018 | 5.6 |
| 2019 | 6.8 |
| 2020 | 8.8 |
| 2021 | 8.0 |
Prevalence of TB
The county herd prevalence decreased in 2021 (2.4%) from 2020 (4.1%), as shown in Figure 4. Prevalence is the proportion of herds under movement restrictions due to an ongoing TB incident at a fixed point in time (31 December). Thus, the reduction in prevalence could be attributed to more TB tests in 2021 being completed within the testing window, thereby reducing the duration of incidents. This is in contrast to 2020 when, due to coronavirus (COVID-19), some TB incidents were artificially extended because of overdue herd testing.
Figure 4: Annual end of year prevalence in Northamptonshire, from 2012 to 2021.
| Year | Proportion of hers under restriction (%) |
|---|---|
| 2012 | 0.75 |
| 2013 | 0.74 |
| 2014 | 1.24 |
| 2015 | 1.44 |
| 2016 | 1.14 |
| 2017 | 2.01 |
| 2018 | 4.00 |
| 2019 | 3.44 |
| 2020 | 4.10 |
| 2021 | 2.35 |
In 2021, there was an increase in the number of closed incidents which lasted between 241-550 days, as displayed in Figure 5. In 2020 only 5 closed incidents lasted between 241-550 days, in comparison with 2021 when 20 TB incidents had the same duration. Of those 20 incidents 70% were OTF-W.
The reduction of prevalence in 2021 could also be associated with there being fewer OTF-W incidents (22 in 2020 and 19 in 2021). OTF-W incidents generally last longer than OTF-S due to more testing, including supplementary IFN-γ blood testing. OTF-W TB incidents had a median duration of 230 days, compared with 173 days for OTF-S incidents, as indicated in Figure 5.
In 2021, 48% of all new TB incidents were disclosed in the first quarter of the year (17 out of 35). This could have also contributed to the reduction in the county herd prevalence; if an incident is detected at the beginning of the year, it is less likely to remain under restrictions at the end of the year compared to those detected later in the year.
Figure 5: Duration of all TB incidents (OTF-W and OTF-S) that ended in 2021, and the number of persistent TB incidents (herds under movement restrictions for more than 550 days) that were unresolved at the end of 2021 in Northamptonshire. Note that Approved Finishing Units (AFUs) have been excluded.
| Duration of incidents (in days) | OTF-W | OTF-S | Total |
|---|---|---|---|
| 0 to 100 | 0 | 1 | 1 |
| 101 to 150 | 2 | 3 | 5 |
| 151 to 240 | 9 | 11 | 20 |
| 241 to 550 | 14 | 4 | 18 |
| 551+ | 0 | 1 | 1 |
| 551+ still open | 0 | 0 | 0 |
Geographical distribution of TB incidents
The distribution of cattle in Northamptonshire in 2021 was much the same as in 2020. Higher herd and cattle densities are concentrated alongside the Warwickshire, Leicestershire, Oxfordshire, and Buckinghamshire borders. Most incidents continued to be detected in the parts of Northamptonshire with a denser cattle population, which are also close to counties with higher TB incidence (see Figure 6).
Warwickshire and Oxfordshire both saw decreases in their TB herd incidence in 2021 from 2020, yet they still represent a significant risk to Northamptonshire (see Figure 7).
Figure 6: Location of cattle holdings in Northamptonshire with new TB incidents (OTF-W and OTF- S) in 2021 and cattle holdings with pre-2021 OTF-W incidents still ongoing at the beginning of 2021, overlaid on a cattle density map. Note that ‘OTF-W Introduced 2021’ refers to OTF-W incidents in which cattle movements were the most likely source of infection.
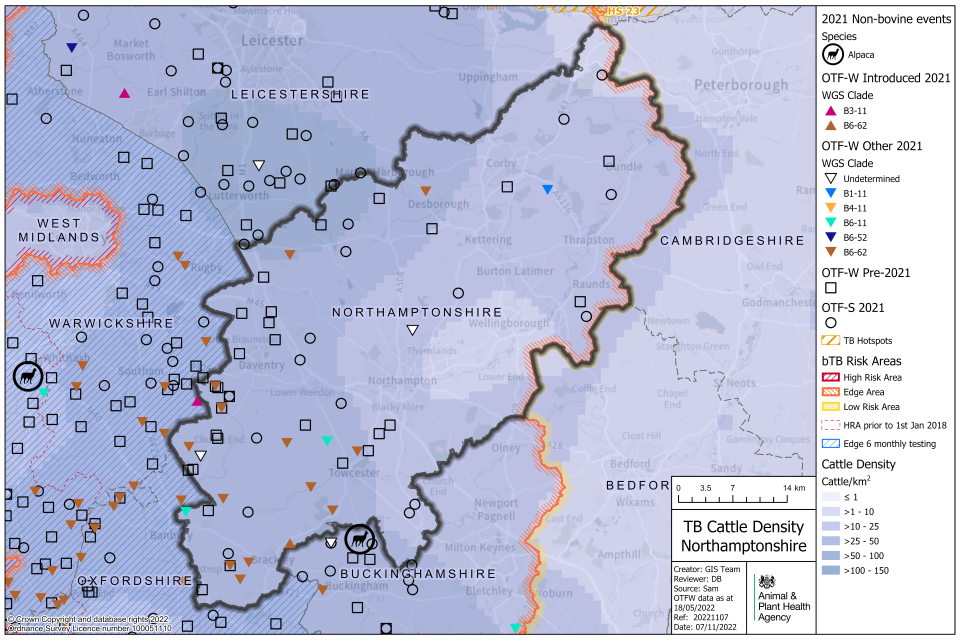
Most TB incidents in Northamptonshire in 2021 occurred in areas with higher cattle density.
Figure 7: Map of the source of infection pathway recorded with the highest level of certainty, for all TB incidents (OTF-W and OTF-S) in Northamptonshire that started in 2021. Local cattle refers to both residual infection and contiguous cattle risk pathways. Purchased refers to all cattle movement risk pathways. Wildlife refers to both badger and other wildlife risk pathways. Where none of the sources of infection were identified with greater than 50% certainty, the highest-ranking source is displayed with an OTF-W undetermined ‘maximum DRF category’ symbol.

Map of Northamptonshire showing data points of OTF-W as circles, and OTF-S as triangles. Colour is used to denote whether the source is from local cattle, purchased, wildlife or is undetermined.
Additional information is provided by Whole Genome Sequencing (WGS) of M. bovis isolates from OTF-W herds. From this data, it is apparent that TB has become endemic in the west of the county. The presence of WGS clade B6-62 (which includes genotype 10:a, reported in previous years) is expanding across the Warwickshire and Oxfordshire borders into Northamptonshire, as shown in Figure 8.
The county border with Leicestershire to the north continues to show a concerning increase in incidents; specifically the area south-west of Market Harborough and bounded by the A14, A508 and Leicestershire border. This increase is not mirrored on the Leicestershire side of the border (only one OTF-S incident in 2021).
In previous years, concern was raised about an increase in incidents along the route of high speed rail (HS2) construction. However, in 2021 there was a reduction in this area, as displayed in Figure 6. It is hoped that this was a transient increase in local incidents and there is no longer a concern. Furthermore, there have been no OTF-W incidents in the Thrapston-Oundle corridor that were of concern in 2019.
Figure 8: WGS clades of M. bovis detected in Northamptonshire between 2018 and 2021, where wildlife sources were attributed with a 75% certainty or above according to the DRF calculation, as an indication of local M. bovis reservoir in local wildlife populations (OTF-W incidents only).
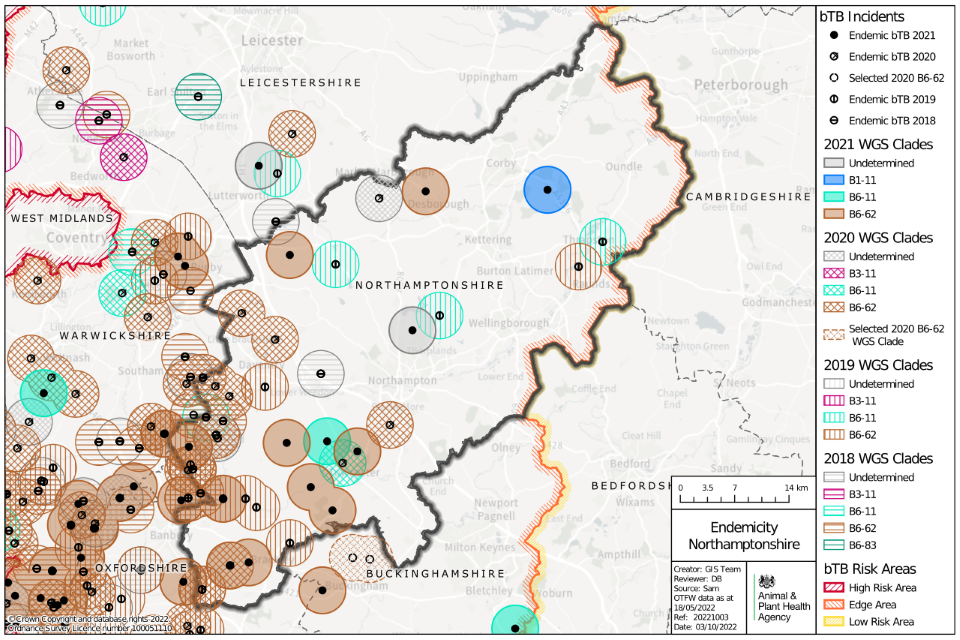
Map of Northamptonshire showing locations of possible wildlife reservoirs of TB as points, between 2018 and 2021. Circles surrounding the points are coloured by TB WGS clade and year.
Main risk pathways and key drivers for TB infection
The main risk pathways and key drivers for TB infection within Northamptonshire are considered here. Evidence collected during APHA veterinary investigations into the source of infection within herds is used to inform this understanding.
In 2021, 29 out of 35 (83%) of new TB incidents in Northamptonshire received a preliminary or final APHA veterinary investigation to identify the source of infection.
It can be challenging to retrospectively establish the route of infection for a TB incident herd. Ideally this investigation includes a thorough on-farm investigation and scrutiny of routinely collected data; such as cattle movement records, and the results of WGS where available. Up to 3 hazards and risk pathways are selected for each incident investigated. Each of these potential sources are given a score that reflects the likelihood of that pathway being the true one, based on the available evidence.
Details of the protocol used for these investigations, and the subsequent methodology used to calculate the weighted contribution of the different suspected sources of M. bovis infection can be found in the explanatory supplement to the annual reports 2021.
The key drivers of the TB epidemic in Northamptonshire during 2021 were as follows:
- exposure to probable infected wildlife
- purchase of undetected infected cattle
- residual infection from previous incidents
Figure 9 presents the aggregated results of the APHA investigations into the source of infection. Further details are presented in Appendix 3, Table 5.
Wildlife provided a weighted contribution of approximately 71% to the likely sources of infection for the 29 TB incident herds in Northamptonshire that received an APHA veterinary investigation in 2021, as shown in Figure 9 and Appendix 3 Table 5.
Badgers were deemed to be the main wildlife source of infection, and accounted for 69% of the weighted risk pathway attribution. Wild deer were thought to play a minor role in transmitting infection, contributing 2% to the weighted risk pathways. There is limited data available from TB surveillance in wildlife. This must be considered when assessing risk pathways for infection in TB incidents where wildlife is regarded as a source of infection.
Cattle movement was the second most important driver of the TB epidemic in Northamptonshire in 2021, contributing to 13% of weighted risk pathways. Buying cattle from high-risk areas continues to be a problem.
Residual infection in herds causing recurrence of TB was the third most common weighted risk pathway overall (7%). This may be due to undetected M. bovis-infected animals remaining in cattle herds.
Other or unknown sources of infection had a weighted contribution of 6%. This category is added to herds where there was high uncertainty around the selected pathways. See the explanatory supplement for details of the methodology used.
Figure 9: Summary of the weighted source of infection pathways attributed for OTF-W and OTF-S TB incidents that started in 2021 in Northamptonshire, that had a completed DRF (n= 29).

Sources attributed were badgers (69%), cattle movement (13%), contiguous infection (3%), residual infection (7%), other wildlife source (2%), and other or unknown source (6%), n=29.
Forward look
It is difficult to provide an opinion on the future course of the TB epidemic in Northamptonshire over the next two years, due to the cyclical nature. Furthermore, TB control is multifactorial and TB eradication policy is constantly adapting.
TB appears to be established in certain areas of Northamptonshire and it is concerning that wildlife reservoirs are suspected in the west of the county. Affecting this is the proximity of Warwickshire and Oxfordshire and infection moving across the border.
Therefore, a cross-county strategy is required to reduce the TB burden.
Despite the reduction in the TB incidence rate in Northamptonshire this year, it seems unlikely that the county will be eligible for OTF status by 2025.
There are several measures that would help address the most common risk pathways for TB infection in Northamptonshire. These include:
- incentivising the uptake of effective biosecurity measures
- managing the TB risks posed by cattle movements to farms
- continuation and further adoption of measures to prevent the spread of TB from wildlife, including biosecurity, badger culling and vaccination
Appendix 1: Cattle industry demographics
Table 1: Number of cattle premises by size band in Northamptonshire at 1 January 2021 (RADAR data)
| Size of herds | Number of herds in Northamptonshire |
|---|---|
| Undetermined | 11 |
| 1-50 | 224 |
| 51-100 | 97 |
| 101-200 | 73 |
| 201-350 | 40 |
| 351-500 | 16 |
| 501+ | 14 |
| Total number of herds | 475 |
| Mean herd size | 103 |
| Median herd size | 51 |
Table 2: Number (and percentage of total) of animals by breed purpose in Northamptonshire at 1 January 2021
| Breed purpose | Number (and percentage of total) cattle in Northamptonshire |
|---|---|
| Beef | 42,123 (85%) |
| Dairy | 5,867 (11%) |
| Dual purpose | 1,160 (2%) |
| Unknown | 1 |
| Total | 49,151 |
Appendix 2: Summary of headline cattle TB statistics
Table 3: Herd-level summary statistics for TB in cattle in Northamptonshire between 2019 and 2021
| Herd-level statistics | 2019 | 2020 | 2021 |
|---|---|---|---|
| (a) Total number of cattle herds live on Sam at the end of the reporting period | 595 | 598 | 566 |
| (b) Total number of whole herd skin tests carried out at any time in the period | 721 | 613 | 678 |
| (c) Total number of OTF cattle herds having TB whole herd tests during the period for any reason | 477 | 460 | 458 |
| (d) Total number of OTF cattle herds at the end of the report period (herds not under any type of Notice Prohibiting the Movement of Bovine Animals (TB02) restrictions) | 552 | 540 | 532 |
| (e) Total number of cattle herds that were not under restrictions due to an ongoing TB incident at the end of the report period | 571 | 570 | 549 |
| (f.1) Total number of new OTF-S TB incidents detected in cattle herds during the report period (including all Finishing Units) | 18 | 15 | 16 |
| (f.2) Total number of new OTF-W TB incidents detected in cattle herds during the report period (including all Finishing Units) | 16 | 22 | 19 |
| (g.1) Of the new OTF-W herd incidents, how many can be considered the result of movement, purchase or contact from or with an existing incident based on current evidence? | 3 | 8 | 2 |
| (g.2) Of the new OTF-W herd incidents, how many were triggered by skin test Reactors or 2xIRs at routine herd tests? | 4 | 5 | 8 |
| (g.3) Of the new OTF-W herd incidents, how many were triggered by skin test Reactors or 2xIRs at other TB test types (such as forward and back-tracings, contiguous or check tests)? | 7 | 14 | 11 |
| (g.4) Of the new OTF-W herd incidents, how many were first detected through routine slaughterhouse TB surveillance? | 5 | 1 | 2 |
| (h.1) Number of new OTF-W incidents revealed by enhanced TB surveillance (radial testing) conducted around those OTF-W herds | 6 | 5 | 8 |
| (h.2) Number of new OTF-S incidents revealed by enhanced TB surveillance (radial testing) conducted around those OTF-W herds | 7 | 9 | 5 |
| (i) Number of OTF-W herds still open at the end of the period (including any ongoing OTF-W incidents that began in a previous reporting period, but not including non-grazing Approved Finishing Units) | 9 | 15 | 8 |
| (j) New confirmed (positive M. bovis culture) incidents in non-bovine species detected during the report period (indicate host species involved) | 0 | 0 | 0 |
| (k.1) Number of grazing approved finishing units active at end of the period | 0 | 0 | 0 |
| (k.2) Number of non-grazing approved finishing units active at end of the period | 13 | 13 | 12 |
| (k.3) Number of grazing exempt finishing units active at end of the period | 0 | 0 | 0 |
| (k.4) Number of non-grazing exempt finishing units active at end of the period | 1 | 1 | 1 |
| Animal-level statistics (cattle) | 2019 | 2020 | 2021 |
|---|---|---|---|
| (a) Total number of cattle tested in the period (animal tests) | 89,226 | 72,267 | 78,573 |
| (b.1) Reactors detected by tuberculin skin tests during the year | 77 | 85 | 109 |
| (b.2) Reactors detected by additional IFN-γ blood tests (skin-test negative or IR animals) during the year | 171 | 74 | 111 |
| (c) Reactors detected during year per incidents disclosed during year | 7.3 | 4.3 | 6.3 |
| (d) Reactors per 1,000 animal tests | 2.8 | 2.2 | 2.8 |
| (e.1) Additional animals slaughtered during the year for TB control reasons (dangerous contacts, including any first time IRs) | 3 | 5 | 3 |
| (e.2) Additional animals slaughtered during the year for TB control reasons (private slaughters) | 10 | 3 | 7 |
| (f) SLH cases (tuberculous carcases) reported by Food Standards Agency (FSA) during routine meat inspection | 10 | 6 | 13 |
| (g) SLH cases confirmed by culture of M. bovis | 6 | 1 | 6 |
Note (c) Reactors detected during year per incidents disclosed during year, reactors may be from incidents disclosed in earlier years, as any found through testing during the report year count here.
Note (g) SLH cases confirmed by culture of M. bovis, not all cases reported are submitted for culture analysis. All cases reported are from any period prior to or during restrictions.
Appendix 3: Suspected sources of M. bovis infection for all the new OTF-W and OTF-S incidents identified in the report period
Each TB incident could have up to 3 potential risk pathways identified. Each risk pathway is given a score that reflects the likelihood of that pathway bringing TB into the herd. The score is recorded as either definite (score 8), most likely (score 6), likely (score 4) or possible (score 1). The source(s) for each incident are weighted by the certainty ascribed. Any combination of definite, most likely, likely, or possible can contribute towards the overall picture for possible routes of introduction into a herd. If the overall score for a herd is less than 6, then the score is made up to 6 using the ‘Other/Unknown Source’ option.
Buffering up to 6 in this way helps to reflect the uncertainty in assessments where only ‘likely’ or ‘possible’ sources are identified.
Table 5 combines the data from multiple herds and provides the proportion of pathways in which each source was identified, weighted by the certainty that each source caused the introduction of TB. The output does not show the proportion of herds where each pathway was identified (this is skewed by the certainty calculation). WGS of M. bovis isolates can be a powerful tool in identifying a likely source of infection, however WGS clades are not determined for OTF-S herds. As a result of varying levels of uncertainty, only broad generalisations should be made from these data. A more detailed description of this methodology is provided in the explanatory supplement for the annual reports 2021.
Table 5: Suspected sources of M. bovis infection for all new OTF-W and OTF-S incidents identified in Northamptonshire, in 2021
| Source of infection | Possible (1) | Likely (4) | Most likely (6) | Definite (8) | Weighted contribution |
|---|---|---|---|---|---|
| Badgers | 15 | 9 | 17 | 3 | 68.9% |
| Cattle movements | 4 | 1 | 2 | 1 | 13.0% |
| Contiguous | 2 | 1 | 0 | 0 | 3.3% |
| Residual cattle infection | 4 | 3 | 0 | 0 | 6.7% |
| Domestic animals | 0 | 0 | 0 | 0 | 0.0% |
| Non-specific reactor | 0 | 0 | 0 | 0 | 0.0% |
| Fomites | 0 | 0 | 0 | 0 | 0.0% |
| Other wildlife | 5 | 0 | 0 | 0 | 2.4% |
| Other or unknown source | 1 | 0 | 0 | 0 | 5.8% |
Please note that each TB incident could have up to 3 potential pathways so totals may not equate to the number of actual incidents that have occurred.