North East of England (low risk area) year end report 2021
Updated 16 February 2023

© Crown copyright 2023
This publication is licensed under the terms of the Open Government Licence v3.0 except where otherwise stated. To view this licence, visit nationalarchives.gov.uk/doc/open-government-licence/version/3 or write to the Information Policy Team, The National Archives, Kew, London TW9 4DU, or email: psi@nationalarchives.gov.uk.
Where we have identified any third party copyright information you will need to obtain permission from the copyright holders concerned.
This publication is available at https://www.gov.uk/government/publications/bovine-tb-epidemiology-reports-2021/north-east-of-england-low-risk-area-year-end-report-2021
Introduction
The Low Risk Area (LRA) was established in 2013. In 2014 this area was incorporated into the UK government’s strategy to achieve Officially Tuberculosis-Free (OTF) status for England by 2038. A key action was to recognise the different levels of bovine tuberculosis (TB) in different parts of the country and to vary the approach to control accordingly. Overall, the LRA has a very low and stable incidence of infected herds. The current strategy seeks to rapidly control infection when it arises through:
- high sensitivity testing of affected herds
- temporarily enhanced local surveillance (radial and hotspot testing)
- mandatory pre- and post-movement testing of cattle entering the LRA from higher risk areas of the UK
The aim is to preserve the favourable disease status of this area so that its counties can be declared OTF as soon as possible.
This report describes the frequency and geographical distribution of TB in 2021 in cattle herds in Cleveland, Durham, Northumberland, and Tyne & Wear, the counties that make up the North East region of the LRA.
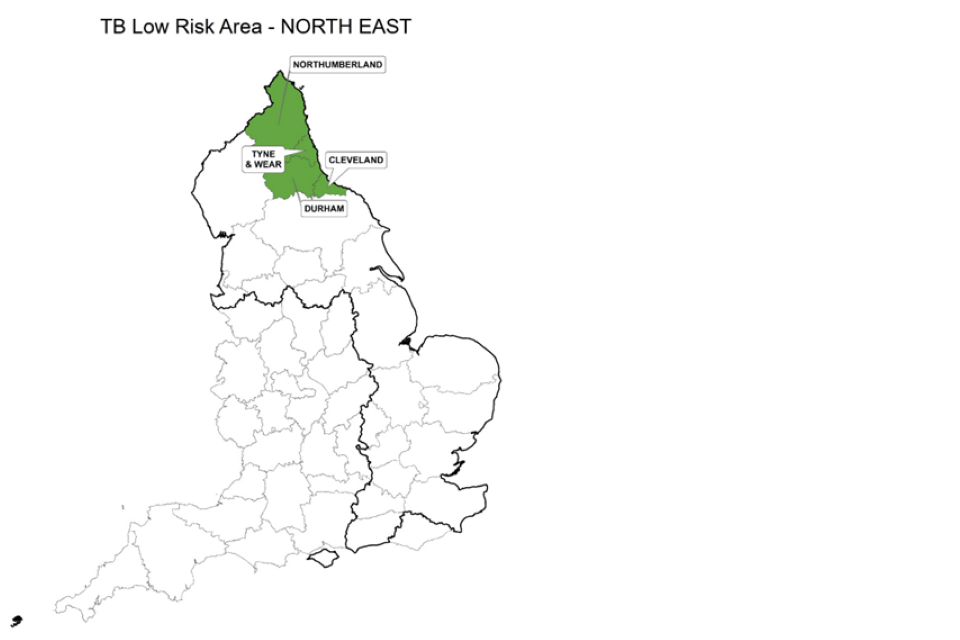
County map of England showing the Low Risk Area and highlighting the north-east of England including the counties of Northumberland, Durham, Cleveland, and Tyne & Wear
TB in cattle and other mammals is primarily caused by the bacterium Mycobacterium bovis (M. bovis) and the disease is subsequently referred to in this report as TB. Although other sources may refer to TB ‘breakdowns’, this report will use the term ‘incidents’ throughout.
This report is intended for individuals involved in the control of TB, both locally and nationally. This includes, but is not limited to farmers, veterinarians, policy makers and the scientific community.
Details of the data handling methodology used in this report, a glossary of terms, and the TB control measures adopted in the LRA, can be found in the Explanatory supplement for the annual reports 2021.
Types of TB incident
Unless otherwise specified, this report includes all new TB incidents detected during the reporting period. This includes ‘Officially Tuberculosis-Free Status Withdrawn’ (OTF-W) incidents and ‘Officially Tuberculosis-Free Status Suspended’ (OTF-S) incidents.
OTF-W incidents are those involving one or more test reactors with typical lesions of TB identified at post-mortem meat inspection, or one or more animals with M. bovis-positive culture results from tissue samples collected from carcases during the post-mortem inspection, or both.
OTF-S incidents are triggered by reactors to the Single Intradermal Comparative Cervical Tuberculin (SICCT) test, but without subsequent detection of TB lesions or positive culture results in any of those animals.
Cattle industry
The cattle industry in the North East of England is predominantly beef-based. Cattle herd sizes vary between counties, as shown in Appendix 1, with over 90% of the region’s cattle located in Northumberland and County Durham. Breeding suckler herds account for most of the cattle population. However, there are also many finishing herds which rely on the continuous supply of store cattle sourced locally and from farms outside the region (such as those in the High Risk Area (HRA) in the west of England, Wales, and Northern Ireland).
There are 7 livestock markets in the region. The biggest one is Darlington Market in County Durham, which holds both ‘green’ (regular) and ‘red’ (TB dedicated slaughter gathering) status cattle sales. It is the main slaughter market for fattening herds and holds slaughter gatherings accepting cattle from TB-restricted holdings which are destined for slaughterhouses. The main market in Northumberland is Hexham Market, which holds ‘green’ sales only, including sales for slaughter cattle from Officially TB Free (OTF) herds. There are also 2 sheep collection centres in the region, one in Northumberland and one in County Durham.
There are 7 Licensed Finishing Units (LFUs), all of which are in County Durham. These units are licensed by the Animal and Plant Health Agency (APHA) and require their cattle to be housed all the time. Conditions of approval include demonstration of strict biosecurity protocols and wildlife proofing of the unit. Cattle in LFUs must be sourced from unrestricted herds and subject to pre-movement testing when required, but are exempt from post-movement or tracing testing.
The traditional farming practice in the North East of England is for cattle to graze from April to late October and then to be housed over the winter months. Common land parcels can present a risk to the spread of TB as there are often cattle from several different holdings able to freely mix and graze in these areas. There is no requirement for animals moving from most herds in the LRA to common land parcels to be pre-movement tested. This, combined with the default routine skin testing interval of 48 months across the region, means the current TB status of animals moving to common grazing areas is often not known. This can result in a large amount of tracing activity and extra testing if reactors are confirmed after grazing on common land.
New TB incidents
The number of new TB incidents detected in the North East of England decreased between 2020 and 2021, from 10 to 4. There was one new OTF-W incident (compared to 3 in 2020) and 3 new OTF-S incidents (compared to 7 in 2020), as displayed in Figure 1. The geographic distribution of these incidents across the region was as follows:
- Northumberland reported 3 new TB incidents in 2021, down from 7 reported in 2020. There was one OTF-W incident, which was unchanged from 2020 and 2 OTF-S incidents, down from 6 in 2020
- Durham reported one OTF-S incident in 2021 and this was unchanged from the previous year
- Cleveland reported no TB incidents in 2021, which was down from 2 OTF-W incidents in 2020
- Tyne & Wear has reported no TB incidents since the 1990s
There were no unusual TB incidents in cattle or reports of TB in other farmed or captive non-bovine species in the North East region in 2021.
Figure 1: Annual number of new TB incidents in the North East of England, from 2016 to 2021. Note Tyne & Wear is not shown here as there are no data to display (no incidents since the 1990s).

For 2021 incidents in Durham were 1 OTF-S, incidents in Northumberland were 1 OTF-W and 2 OTF-S. There were no incidents in Cleveland in 2021. Tyne & Wear is not shown as there is no data to display.
Geographical distribution of TB incidents
As in previous years, new TB incidents were spread across the North East of England. Incidents were disclosed in areas with a higher cattle density (Figure 2).
Whole Genome Sequencing (WGS) replaced genotyping at APHA in 2021.
Figure 2: Location of cattle holdings in the North East of England with new TB incidents (OTF-W and OTF-S) in 2021, and cattle holdings with pre-2021 OTF-W incidents still ongoing at the beginning of 2021, overlaid on a cattle density map. Note that ‘OTF-W Introduced 2021’ refers to OTF-W incidents in which cattle movements were the most likely source of infection.
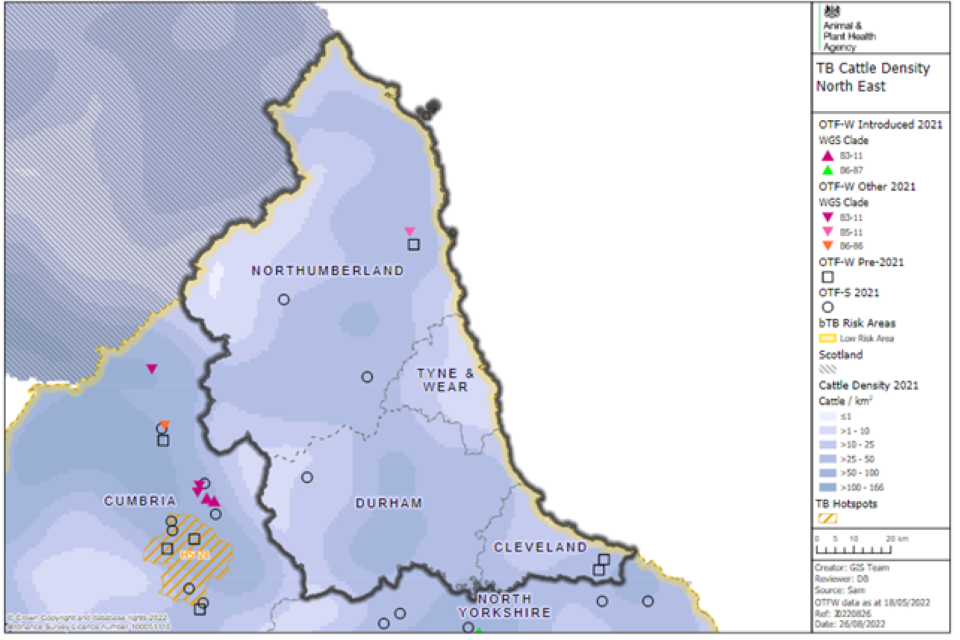
Incidents are scattered across the north-east region without evidence of spatial clustering.
In Northumberland, the single OTF-W incident detected in 2021 (clade B5-11) was located close to the 2020 OTF-W incident (clade B6-51). B5-11 has only been isolated in three counties: North Yorkshire, South Yorkshire, and Cheshire. The 2021 incident affected a 400-cattle fattening herd. An animal sent to slaughter was found to have lesions which gave rise to suspicion of TB. Subsequent laboratory tests showed that it was culture positive for M. bovis. A compulsory interferon gamma (IFN-γ) test disclosed 10 positive animals, none of which had visible lesions at slaughter. Following 2 statutory short interval tests (SIT) with negative results, the herd regained its OTF status in April 2022.
The source of infection for this incident was unclear (Figure 3). The index animal identified as a TB slaughterhouse case was born in Lancashire and had subsequently moved to a holding in Cumbria before moving to the farm in Northumberland. Neither the Lancashire nor the Cumbria holding had any history of TB incidents, although cattle were regularly bought in from the LRA. As the confirmed clade of the M. bovis isolate was out of its homerange and the herd has a high turnover of purchased cattle for fattening, the source of infection was not likely to have been acquired locally.
The 2 OTF-S incidents were disclosed in the west and south of the county, respectively.
In Cleveland, there were 2 OTF-W incidents in close proximity that were disclosed pre-2021. Both regained their OTF status after obtaining negative results in 2 consecutive short interval skin tests.
In Durham, the only OTF-S incident was in the west of the county.
Figure 3: Map of the source of infection pathway recorded with the highest level of certainty, for OTF-W TB incidents, and the location of OTF-S incidents in the North East of England which started in 2021. Local cattle refer to residual infection and contiguous cattle risk pathways. Purchased refers to cattle movement risk pathways. Wildlife refers to both badger and other risk pathways.
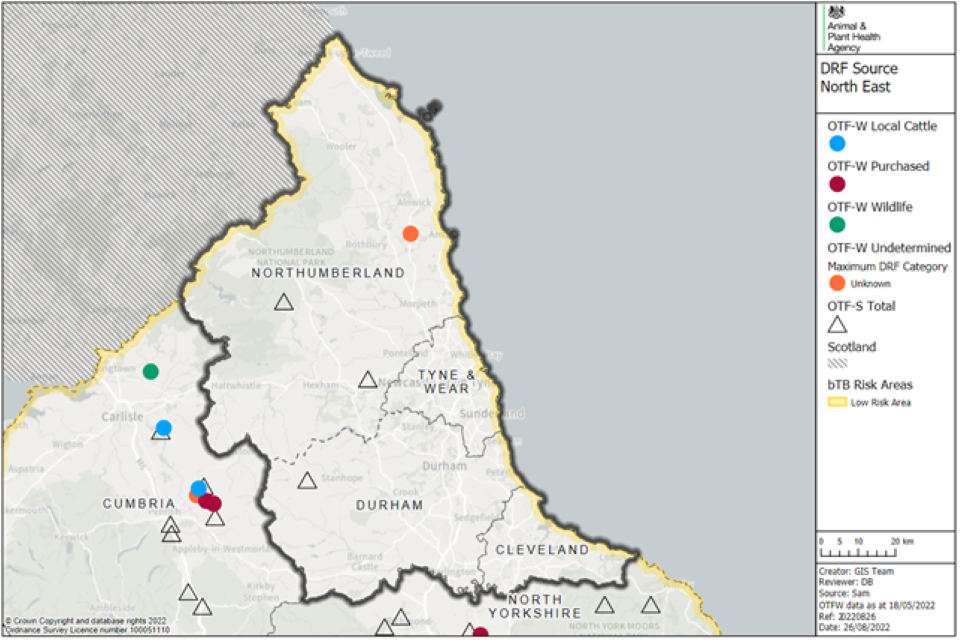
The only OTF-W incident in the area had an unknown source of infection.
Potential or confirmed TB hotspot areas
There were no potential or confirmed TB hotspot areas in any of the counties in the North East of England in 2021. Only a single new radial zone was intigated in 2021, in Northumberland; but 2 radial zones from 2020 were still active as shown in Figure 4. Two OTF-W TB incidents that gave rise to radial zones in 2020 and 2021 were in close proximity, but it was concluded that these incidents were independent and not related to one another following both APHA veterinary investigations and WGS analyses.
Figure 4: Potential hotspot areas and radial surveillance zones around OTF-W incidents that were active, completed or not instigated in the North East of England during 2021, by year of initiation.
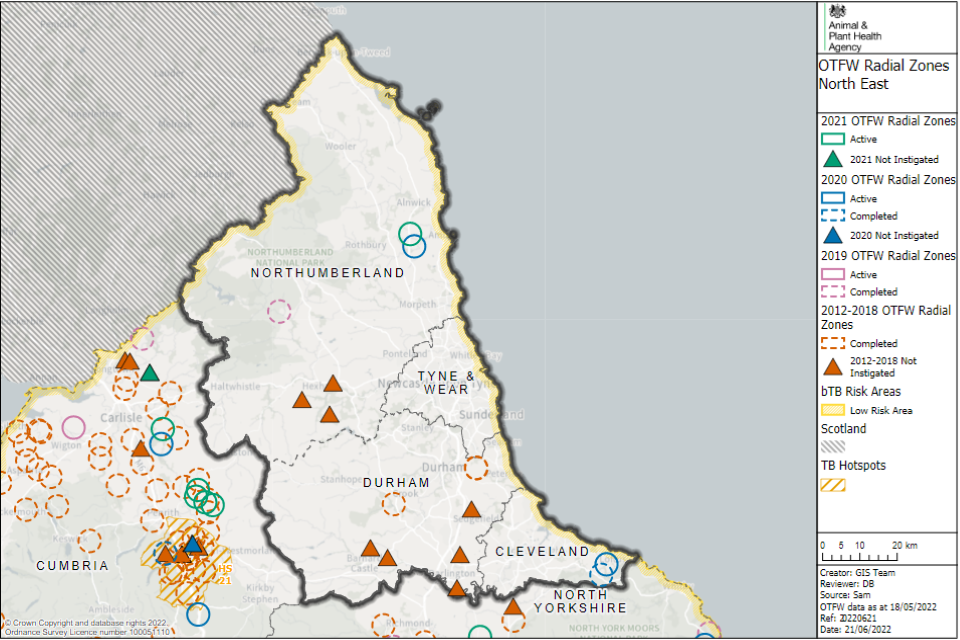
A radial zone in north-east Northumberland in 2021 overlapped with another instigated in 2020.
Main risk pathways and key drivers for TB infection
The main risk pathways and key drivers for TB infection within the North East in 2021 are considered here. Evidence collected during APHA veterinary investigations into the source of infection within herds was used to inform this understanding. In 2021, all 4 (100%) of new TB incidents in the North East received a preliminary or final APHA veterinary investigation to identify the source of infection.
It can be challenging to retrospectively establish the route of infection for a TB incident herd. Ideally this investigation includes a thorough on-farm investigation and scrutiny of routinely collected data; such as cattle movement records, and the results of WGS where available. Up to 3 hazards and risk pathways were selected for each incident investigated. Each of these potential sources were given a score that reflects the likelihood of that pathway being the true one, based on the available evidence.
Details of the protocol used for these investigations, and the subsequent methodology used to calculate the weighted contribution of the different suspected sources of M. bovis infection can be found in the Explanatory supplement to the annual reports 2021.
The key driver of the TB epidemic in the North East during 2021 was identified as:
- purchase of undetected infected cattle
It should be noted that due to the small number of incidents, it is difficult to draw any firm conclusions for the aggregated data from veterinary investigations.
There was a high degree of uncertainty around the source of TB infections in 2021 as shown by the percentage of weighted source attribution ascribed to ‘other or unknown source’ (52%). This category is added to those incidents in which there was a high uncertainty around the selected pathways (see explanatory supplement for methodology). The percentage that was attributable to non-specific reactors (20%) was the next highest.
All the incidents in 2021 occurred in herds with no previous history of TB. This highlights that the LRA remains under threat of sporadic disease incursions. It also highlights the need to raise awareness within the industry of the TB risk associated with the purchase of cattle and the importance of careful sourcing of cattle replacements.
Most of the incidents in the North East are OTF-S and these always carry a higher level of uncertainty around the sources of infection as, by definition, the WGS clade of M. bovis could not be determined. Higher uncertainty also exists where very small number of reactors are identified. Most of the incidents presented no more reactors at subsequent testing and this provides some assurance that there is minimal lateral spread of infection within herds.
There is currently no evidence of a wildlife reservoir of infection in the area, but this risk cannot be completely discounted and is carefully considered for each TB incident.
Forward look
The overall number of incidents decreased in 2021, compared to 2020. The North East of England remains one of the LRA regions with the lowest number of incidents. A low number of reactors are typically disclosed in each incident, and incidents have a relatively short duration. As a result, the impact of TB for farmers and the taxpayer was relatively low in the North East in 2021 in comparison with other areas of the country.
Timely detection of infected animals and subsequent removal is one of the key steps in infectious disease control. This is likely to have played a significant role in the protection of the remaining susceptible cattle population and keeping the region relatively free of TB. It is therefore vital to maintain the passive and active TB surveillance within the LRA.
The consensus is that more local farmer meetings could help to increase awareness of TB. This should encourage careful sourcing of cattle and reduce the risk of introducing TB into the region by the movement of infected cattle from higher TB risk areas of the United Kingdom. To further reduce TB incidence and maintain LRA status, enhanced TB surveillance measures need to be continued, together with the implementation of responsible cattle purchasing policies.
Given the history and the effectiveness of controls, it is very likely that the North East of England will continue to experience a very low number of TB incidents over the next 2 years. Given the objective of achieving TB OTF status by 2025 in each county, a focus is needed on the farming community’s attitude towards TB control and sourcing cattle to this area.
Appendix 1: Cattle industry demographics
Table 1: Number of cattle premises by size band in the North East of England at 1 January 2021, by county (RADAR data).
| Size of herds | Number of herds in Cleveland | Number of herds in Durham | Number of herds in Northumberland | Number of herds in Tyne & Wear |
|---|---|---|---|---|
| Undetermined | 1 | 16 | 17 | 0 |
| 1-50 | 60 | 410 | 307 | 30 |
| 51-100 | 22 | 155 | 174 | 9 |
| 101-200 | 27 | 154 | 215 | 15 |
| 201-350 | 9 | 70 | 126 | 6 |
| 351-500 | 5 | 19 | 42 | 1 |
| 501+ | 5 | 25 | 33 | 0 |
| Total number of herds | 129 | 849 | 914 | 61 |
| Mean herd size | 111 | 98 | 143 | 83 |
| Median herd size | 62 | 50 | 86 | 53 |
Table 2: Number and percentage of animals by breed purpose in the North East of England at 1 January 2021, by county.
| Breed purpose | Number (and percentage of total) cattle in Cleveland | Number (and percentage of total) cattle in Durham | Number (and percentage of total) cattle in Northumberland | Number (and percentage of total) cattle in Tyne & Wear |
|---|---|---|---|---|
| Beef | 10,992 (77%) | 70,978 (85%) | 118,498 (90%) | 4,463 (88%) |
| Dairy | 3,225 (22%) | 10,589 (13%) | 10,767 (8%) | 339 (7%) |
| Dual purpose | 123 (1%) | 1,630 (2%) | 1,484 (1%) | 270 (5%) |
| Unknown | 0 | 2 (less than 0.1%) | 4 (less than 0.1%) | 0 |
| Total | 14,340 | 83,199 | 130,753 | 5,072 |
Appendix 2: Summary of headline cattle TB statistics
Table 3: Herd-level summary statistics for TB in cattle in the North East of England in 2021, by county.
| Herd-level statistics | Cleveland | Durham | Northumberland | Tyne & Wear |
|---|---|---|---|---|
| (a) Total number of cattle herds live on Sam at the end of the reporting period | 150 | 965 | 1,086 | 81 |
| (b) Total number of cattle herds subject to annual TB testing (or more frequent) at the end of the reporting period (any reason) | 27 | 10 | 43 | 3 |
| (c) Total number of whole herd skin tests carried out at any time in the period | 47 | 163 | 251 | 12 |
| (d) Total number of OTF cattle herds having TB whole herd tests during the period for any reason | 39 | 162 | 244 | 12 |
| (e) Total number of OTF cattle herds at the end of the report period (herds not under any type of Notice Prohibiting the Movement of Bovine Animals (TB02) restrictions) | 149 | 948 | 1,076 | 78 |
| (f) Total number of cattle herds that were not under restrictions due to an ongoing TB incident at the end of the report period | 150 | 965 | 1,084 | 81 |
| (g.1) Total number of new OTF-S TB incidents detected in cattle herds during the report period | 0 | 1 | 2 | 0 |
| (g.2) Total number of new OTF-W TB incidents detected in cattle herds during the report period | 0 | 0 | 1 | 0 |
| (h.1) Of the new OTF-W herd incidents, how many occurred in a holding affected by another OTF-W incident in the previous three years? | 0 | 0 | 0 | 0 |
| (h.2) Of the new OTF-W herd incidents, how many could be considered secondary to a primary incident based on current evidence? | 0 | 0 | 0 | 0 |
| (h.3) Of the new OTF-W herd incidents, how many were triggered by skin test reactors or 2x inconclusive reactors (IRs) at routine herd tests? | 0 | 0 | 0 | 0 |
| (h.4) Of the new OTF-W herd incidents, how many were triggered by skin test reactors or 2xIRs at other TB test types (such as forward and back-tracings, contiguous, check tests)? | 0 | 0 | 0 | 0 |
| (h.5) Of the new OTF-W herd incidents, how many were first detected through routine slaughterhouse TB surveillance? | 0 | 0 | 1 | 0 |
| (i.1) Number of new OTF-S incidents revealed by enhanced TB surveillance (radial testing) conducted around those OTF-W herds | 0 | 0 | 1 | 0 |
| (i.2) Number of new OTF-W incidents revealed by enhanced TB surveillance (radial testing) conducted around those OTF-W herds | 0 | 0 | 0 | 0 |
| (j) Number of OTF-W herds still open at the end of the period (including any ongoing OTF-W incidents that began in a previous reporting period) | 0 | 0 | 1 | 0 |
| (k) Number of OTF-W herds still open at the end of the period that are within a finishing unit | 0 | 0 | 0 | 0 |
| (l) New confirmed (positive M. bovis culture) incidents in non-bovine species detected during the report period (indicate host species involved) | 0 | 0 | 0 | 0 |
Table 4: Animal-level summary statistics for TB in cattle in 2021.
| Animal-level statistics (cattle) | Cleveland | Durham | Northumberland | Tyne & Wear |
|---|---|---|---|---|
| (a) Total number of cattle tested in the period (animal tests) | 6,194 | 10,960 | 29,808 | 667 |
| (b.1) Reactors detected by tuberculin skin tests during the year | 0 | 2 | 2 | 0 |
| (b.2) Reactors detected by additional IFN-γ blood tests (skin-test negative or IR animals) during the year | 5 | 0 | 0 | 0 |
| (c) Reactors detected during year per incidents disclosed during year | 0 | 2.00 | 0.67 | 0 |
| (d) Reactors per 1,000 animal tests | 0.81 | 0.18 | 0.07 | 0 |
| (e.1) Additional animals slaughtered during the year for TB control reasons (dangerous contacts, including any first time IRs) | 0 | 1 | 0 | 0 |
| (e.2) Additional animals slaughtered during the year for TB control reasons (private slaughters) | 0 | 0 | 0 | 0 |
| (f) SLH cases (tuberculous carcases) reported by the Food Standards Agency (FSA) during routine meat inspection | 0 | 3 | 3 | 0 |
| (g) SLH cases confirmed by culture of M. bovis | 0 | 0 | 1 | 0 |
Note (c) Reactors detected during year per incidents disclosed during year, reactors may be from incidents disclosed in earlier years, as any found through testing during the report year count here.
Note (g) SLH cases confirmed by culture of M. bovis, not all cases reported are submitted for culture analysis. All cases reported are from any period prior to or during restrictions.
Appendix 3: Suspected sources of M. bovis infection for all of the new OTF-W and OTF-S incidents identified in the report period
Each TB incident could have up to 3 potential risk pathways identified. Each risk pathway is given a score that reflects the likelihood of that pathway bringing TB into the herd. The score is recorded as either definite (score 8), most likely (score 6), likely (score 4) or possible (score 1). The source(s) for each incident are weighted by the certainty ascribed. Any combination of definite, most likely, likely, or possible can contribute towards the overall picture for possible routes of introduction into a herd. If the overall score for a herd is less than 6, then the score is made up to 6 using the ‘Other/Unknown Source’ option. Buffering up to 6 in this way helps to reflect the uncertainty in assessments where only ‘likely’ or ‘possible’ sources are identified.
Table 5 combines the data from multiple herds and provides the proportion of pathways in which each source was identified, weighted by the certainty that each source caused the introduction of TB. The output does not show the proportion of herds where each pathway was identified (this is skewed by the certainty calculation). WGS of M. bovis isolates can be a powerful tool in identifying a likely source of infection, however WGS clades have not been determined for OTF-S herds. As a result of varying levels of uncertainty, only broad generalisations should be made from these data. A more detailed description of this methodology is provided in the Explanatory supplement for the annual reports 2021.
Table 5: Suspected sources of M. bovis infection for all new OTF-W and OTF-S incidents identified in 2021.
| Source of infection | Possible (1) | Likely (4) | Most likely (6) | Definite (8) | Weighted contribution |
|---|---|---|---|---|---|
| Badgers | 0 | 0 | 0 | 0 | 0.0% |
| Cattle movements | 3 | 0 | 0 | 0 | 11.9% |
| Contiguous | 0 | 0 | 0 | 0 | 0.0% |
| Residual cattle infection | 0 | 0 | 0 | 0 | 0.0% |
| Domestic animals | 0 | 0 | 0 | 0 | 0.0% |
| Non-specific reactor | 2 | 0 | 0 | 0 | 8.3% |
| Fomites | 0 | 0 | 0 | 0 | 0.0% |
| Other wildlife | 0 | 0 | 0 | 0 | 0.0% |
| Other or unknown source | 1 | 2 | 1 | 0 | 79.8% |
Please note each TB incident could have up to 3 potential pathways so totals may not equate to the number of actual incidents that have occurred.
Appendix 4: Assessment of the origin of (and potential for spread of infection from) all the new OTF-W incidents identified in the report period
A risk matrix was used to identify isolated incidents that were likely to have been introduced to the LRA by cattle movements, while not causing any onward local spread. The following 2 questions were considered for each incident, and a score attributed. TB incidents with a score of 1A, 1B or 2A may be removed from the county TB incidence calculations during an application for OTF status (but remain in the incidence calculations in this report).
What is the probability of M. bovis infection being introduced to the LRA via infected cattle movements?
- Definite - for example, traced reactors found in the LRA OTF-W incident herd in question as a result of spread tracings from another TB incident herd, genotype or WGS linked.
- Likely - for example, a Reactor or IR originated from a previous incident herd (and the WGS or genotype does not suggest otherwise), other cattle were moved into the herd from previous incident herd (but were subsequently slaughtered without testing), or the trading practice of herd provides likely evidence (purchasing large numbers of cattle from the High Risk Area (HRA), or Edge Area, High and Intermediate TB areas of Wales, or from the island of Ireland).
- Possible - not a closed herd, but cattle are purchased from the LRA, Scotland or EU Member States.
- Not likely - indigenous infection is known in the locality, closed herd, genotype or WGS has been identified in local wildlife.
What is the probability of this being an isolated, sporadic (‘one-off’) incident, without secondary local spread from the index case?
A. Likely - no secondary incidents have been detected. There are no further incidents as a result of spread tracings anywhere and no genotype or WGS linked OTF-W incidents within 3km radial zone around the LRA OTF-W incident herd in question (or the 3km radial surveillance zone was not triggered).
B. Possible - no secondary incidents have been detected, but the dataset is incomplete. For example, incidents have occurred in the 3km radial zone, but only OTF-S ones, or if OTF-W, they were of an unknown or different genotype or WGS clade.
C. Not likely - secondary spread from the index case, or exposure to a common wildlife source has occurred. For example, OTF-W incidents have occurred in the 3km zone linked by genotype or WGS, or there is known wildlife infection in the area with this genotype or close WGS.
The new OTF-W TB incident in Northumberland in 2021 was assessed to be 3B, and as such would not be eligible for removal from the county TB incidence calculations during an application of OTF status.