Leicestershire (edge area) year end report 2021
Updated 16 February 2023

© Crown copyright 2023
This publication is licensed under the terms of the Open Government Licence v3.0 except where otherwise stated. To view this licence, visit nationalarchives.gov.uk/doc/open-government-licence/version/3 or write to the Information Policy Team, The National Archives, Kew, London TW9 4DU, or email: psi@nationalarchives.gov.uk.
Where we have identified any third party copyright information you will need to obtain permission from the copyright holders concerned.
This publication is available at https://www.gov.uk/government/publications/bovine-tb-epidemiology-reports-2021/leicestershire-edge-area-year-end-report-2021
Introduction
The Edge Area was originally established in 2013. In 2014, the bovine tuberculosis (TB) surveillance strategy for this area was incorporated into the UK Government’s Strategy to achieve Officially Bovine Tuberculosis-Free (OTF) status for England by 2038. A key action was to recognise the different levels of TB in different parts of the country and to vary the approach to control accordingly. The aim is to obtain OTF status for the Edge Area as soon as possible.
This report describes the frequency and geographical distribution of TB in 2021 in cattle herds in Leicestershire, which forms part of the Edge Area. It examines what factors are likely to be driving TB in this area, and the risks the disease in this county may pose to neighbouring areas.
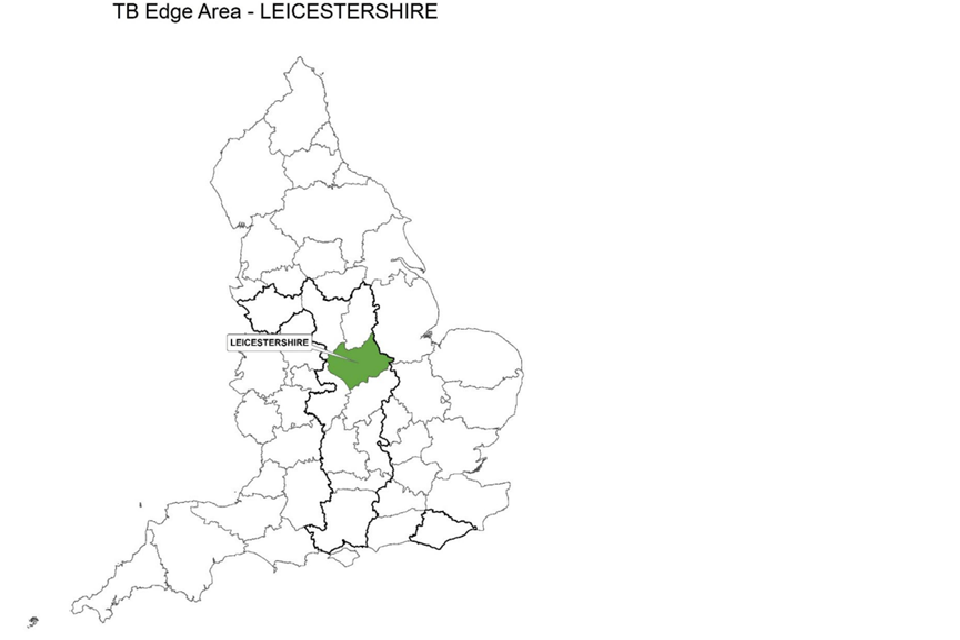
County map of England showing the Edge Area and highlighting the county of Leicestershire.
TB in cattle and other mammals is primarily caused by the bacterium Mycobacterium bovis (M. bovis), and the disease is subsequently referred to in this report as TB. Although other sources may refer to TB ‘breakdowns’, this report will use the term ‘incidents’ throughout.
This report is intended for individuals involved in the control of TB, both locally and nationally. This includes, but is not limited to farmers, veterinarians, policy makers and the scientific community.
Details of the data handling methodology used in this report, a glossary of terms, and the TB control measures adopted in the Edge Area, can be found in the explanatory supplement for the annual reports 2021.
Types of TB incident
Unless otherwise specified, this report includes all new TB incidents detected during the reporting period. This includes ‘Officially Tuberculosis-Free Status Withdrawn’ (OTF-W) incidents and ‘Officially Tuberculosis-Free Status Suspended’ (OTF-S) incidents.
OTF-W incidents are those involving one or more test reactors with typical lesions of TB identified at post-mortem meat inspection, or one or more animals with M. bovis- positive culture results from tissue samples collected from carcases during the post-mortem inspection, or both.
OTF-S incidents are triggered by reactors to the Single Intradermal Comparative Cervical Tuberculin (SICCT) test, but without subsequent detection of TB lesions or positive culture results in any of those animals.
TB incidents in Approved Finishing Units (AFUs) without grazing are not included in the prevalence and incidence calculations in this report due to the limited epidemiological impact of these incidents.
Furthermore, herds restricted because of an overdue test rather than a TB incident are also excluded from calculations. Hence measures of incidence and prevalence in this report may be lower than those reported in the official TB statistics.
Cattle industry
Beef herds are the predominant cattle enterprise in Leicestershire (62% of animals), however there is a significant number of large dairy herds, most of which are in the northeast of the county. As in previous years, the majority of herds (507 or 62%) had fewer than 100 cattle, with a median size of 60 cattle. This is indicated in Appendix 1. There is one livestock auction market for cattle in Leicestershire: Melton Mowbray Market. This market was approved by APHA in 2018 to hold dedicated sales for TB-restricted cattle.
There were 14 Approved Finishing Units (AFUs) in Leicestershire in 2021, as listed in Appendix 2. No new AFUs were approved in 2021. There were no Exempt Finishing Units (EFUs).
New TB incidents
The number of new TB incidents decreased in 2021 compared to 2020, from 64 to 54, as shown in Figure 1. This was mainly due to a decrease in new OTF-W incidents (33 in 2020 to 14 in 2021). New OTF-S incidents increased in 2021, from 31 to 40.
Figure 1: Annual number of new TB incidents in Leicestershire, from 2012 to 2021.
| Year | OTF-W | OTF-S | Total |
|---|---|---|---|
| 2012 | 17 | 25 | 42 |
| 2013 | 16 | 18 | 34 |
| 2014 | 15 | 22 | 37 |
| 2015 | 22 | 20 | 42 |
| 2016 | 17 | 37 | 54 |
| 2017 | 21 | 25 | 46 |
| 2018 | 22 | 37 | 59 |
| 2019 | 22 | 28 | 50 |
| 2020 | 33 | 31 | 64 |
| 2021 | 14 | 40 | 54 |
Compared to 2020, there was a reduction in incidents in all herd types (see Figure 2). Refer to the Leicestershire year-end report 2020 for comparative figures.
- Beef suckler: 39% (21) of all TB incidents, of which 19% were OTF-W
- Beef fattener: 20% (11) of all TB incidents, of which 18% were OTF-W
- Dairy sector: 39% (21) of all TB incidents, of which 38% were OTF-W
As in previous years, the occurrence of TB incidents was more frequent in medium-sized herds (101-200 cattle), which represented 28% (15/54) of all TB incidents in 2021. This herd size only accounted for 20% of cattle holdings in Leicestershire in the same period; a disproportionate number, which may reflect the fact that the risk of TB incidents increases with herd size.
Figure 2: Number of new TB incidents (OTF-W and OTF-S) in Leicestershire in 2021, by cattle herd size and type.

Herd size: 1-50:3 OTF-W, 7 -S; 51-100:1 OTF-W, 11 -S; 101-200: 4 OTF-W, 11 -S; 201-350:3 OTF-W, 4 -S; 351-500:3 -S; 501+:3 OTF-W, 4 -S. Herd type: beef suckler:4 OTF-W, 17 -S; beef fattener:2 OTF -W, 9 -S; dairy:8 OTF-W, 13 -S; mixed/other 1 OTF-S.
Radial skin testing is a form of targeted enhanced TB surveillance of cattle herds situated within a 3km radius of OTF-W TB incidents arising in the annual surveillance testing portion of the Edge Area (which includes Leicestershire) and in the Low Risk Area of England. This type of additional TB herd testing was rolled out in 2018 in Leicestershire.
In 2021 there were 2 seasonal peaks of TB incidents disclosed (see Figure 3), which is a similar distribution to the previous reporting year. Figure 4 shows the number of surveillance tests undertaken in OTF herds in Leicestershire in 2021, by month. The early spring peak in new TB incidents was most likely due to radial testing (RAD), which disclosed OTF-S incidents. The second peak was in the autumn, due to a second round of radial testing as well as the housing of cattle. In previous years there was a more distinct peak in the winter housing period, however the introduction of radial testing has contributed to a more even distribution of incidents disclosed throughout 2021.
Figure 3: Number of new TB incidents (OTF-W and OTF-S) in Leicestershire in 2021, by month of disclosure.
| Year | OTF-W | OTF-S | Total |
|---|---|---|---|
| January | 2 | 5 | 7 |
| February | 1 | 6 | 7 |
| March | 3 | 6 | 9 |
| April | 2 | 5 | 7 |
| May | 1 | 1 | 2 |
| June | 1 | 2 | 3 |
| July | 0 | 3 | 3 |
| August | 0 | 3 | 3 |
| September | 0 | 1 | 1 |
| October | 2 | 3 5 | |
| November | 2 | 4 | 6 |
| December | 0 | 1 | 1 |
Figure 4: Number of tests undertaken in OTF herds in Leicestershire in 2021, by month.
| Month | Number of tests |
|---|---|
| January | 12787 |
| February | 10321 |
| March | 14717 |
| April | 10815 |
| May | 6629 |
| June | 6305 |
| July | 7053 |
| August | 5730 |
| September | 7364 |
| October | 11853 |
| November | 15113 |
| December | 8826 |
In a similar pattern to 2020, most new TB incidents in 2021 were disclosed during radial testing (35%), while 33% were disclosed by routine (annual) herd tests, as displayed in Figure 5. These findings highlight the value of enhanced surveillance testing around OTF- W incidents in detecting lateral spread of infection.
Two incidents were disclosed by slaughterhouse surveillance through routine post-mortem meat inspection of non-reactor cattle, as provided in Figure 5. This is a reduction from 6 in 2020. This could be an indication of improved and more frequent TB skin testing, leading to earlier detection of infected herds and thus reduced spread.
Six-month testing (6M), carried out 6 months after a herd regains OTF status following resolution of an incident, disclosed 9% of all new TB incidents in 2021. This is very similar to 2020, suggesting the risk factors leading to the recurrence of TB were similar.
Figure 5: Number of new TB incidents (OTF-W and OTF-S) in Leicestershire in 2021, according to the surveillance methods that detected them.
| Surveillance method | OTF-W | OTF-S | Total |
|---|---|---|---|
| 12 month test (12M) | 0 | 1 | 1 |
| 6 month test (6M) | 1 | 4 | 5 |
| Check test (CT) | 0 | 1 | 1 |
| Pre-movement test (PRMT) | 2 | 1 | 3 |
| Radial test (RAD) | 5 | 14 | 19 |
| Slaughterhouse (SLH) | 2 | 0 | 2 |
| Tracing test (TR) | 1 | 2 | 3 |
| Whole herd test (WHT) | 2 | 16 | 18 |
| Hotspot test (HS) | 1 | 1 | 2 |
TB in other species
The only bacteriologically confirmed incident of M. bovis infection in a non-bovine domestic species in 2021 was in a male, neutered domestic cat with chronically enlarged lymph nodes. The infection was identified as WGS clade B6-62 (which includes previous designation genotype 10:a) of M. bovis, which is most prevalent in east Gloucestershire, Oxfordshire, Warwickshire, and Berkshire.
Incidence of TB
In 2021, Leicestershire had the seventh highest incidence of TB per 100 herd-years at risk out of the 11 Edge Area counties (7.3). This was slightly lower than the Edge Area overall (8.9). TB incidence per 100 herd-years at risk decreased marginally in 2021 (7.3) compared to 2020 (7.7) in 2020, as displayed in Figure 6. The incidence has been generally increasing since 2015. Further years of data are required to see if the marginal decline observed in 2021 is sustained.
Figure 6: Annual incidence rate (per 100 herd-years at risk) for all new incidents (OTF-W and OTF- S) in Leicestershire, from 2012 to 2021.
| Year | TB incidence per 100 herd years at risk |
|---|---|
| 2012 | 4.4 |
| 2013 | 3.1 |
| 2014 | 3.1 |
| 2015 | 4.5 |
| 2016 | 5.8 |
| 2017 | 5.1 |
| 2018 | 6.3 |
| 2019 | 6.0 |
| 2020 | 7.7 |
| 2021 | 7.3 |
Prevalence of TB
Whole county herd prevalence decreased in 2021 (2.7%) compared to 2020 (4.0%), as displayed in Figure 7. As prevalence depends on the number of active incidents at one point in time, any factors that delay the resolution of an incident, or increase the probability of detecting new incidents towards the end of the year, will increase the prevalence. The decrease in Leicestershire occurred despite the impact of COVID-19 and the highly pathogenic avian influenza (HPAI) outbreak, which caused some delays in skin and interferon gamma (IFN-γ) testing.
Figure 7: Annual end of year prevalence in Leicestershire, from 2012 to 2021.
| Year | Proportion of herds under restriction (%) |
|---|---|
| 2012 | 1.56 |
| 2013 | 1.71 |
| 2014 | 1.60 |
| 2015 | 1.57 |
| 2016 | 1.94 |
| 2017 | 2.44 |
| 2018 | 3.48 |
| 2019 | 2.53 |
| 2020 | 4.01 |
| 2021 | 2.69 |
Geographical distribution of TB incidents
The geographical distribution of new TB incidents in 2021 generally mirrored the uneven density of cattle holdings across Leicestershire, with higher densities in the north and south of the county and a low density of herds across the centre. This is similar to the distribution in previous years, as shown in Figure 8.
The majority of OTF-S incidents continued to be disclosed in south-west Leicestershire (see Figures 8 and 9). The reasons for this were not clear; it may be due to infection pressure from the neighbouring counties of Warwickshire and Northamptonshire, which have a higher incidence in those areas. The Whole Genome Sequencing (WGS) clades of
M. bovis isolated from the new TB incident herds detected in 2021 were mainly B3-11 (genotype 25:a) (75%), with B6-11, B6-52 and B6-62 disclosed in one TB incident each.
Figure 8: Location of cattle holdings in Leicestershire with new TB incidents (OTF-W and OTF-S) in 2021 and cattle holdings with pre-2021 OTF-W incidents still ongoing at the beginning of 2021, overlaid on a cattle density map. Note that ‘OTF-W Introduced 2021’ refers to OTF-W incidents in which cattle movements were the most likely source of infection.

The geographic distribution of new TB incidents generally mirrored the uneven density of cattle holdings, higher densities in the north and south, and a low density of herds centrally. Most OTF-S incidents were disclosed in south-west Leicestershire.
Figure 9: Map of the source of infection pathway recorded with the highest level of certainty, for all TB incidents (OTF-W and OTF-S) in Leicestershire that started in 2021. Local cattle refers to both residual infection and contiguous cattle risk pathways. Purchased refers to all cattle movement risk pathways. Wildlife refers to both badger and other wildlife risk pathways. Where none of the sources of infection were identified with greater than 50% certainty, the highest ranking source is displayed with an OTF-W undetermined ‘maximum DRF (disease report form) category’ symbol.
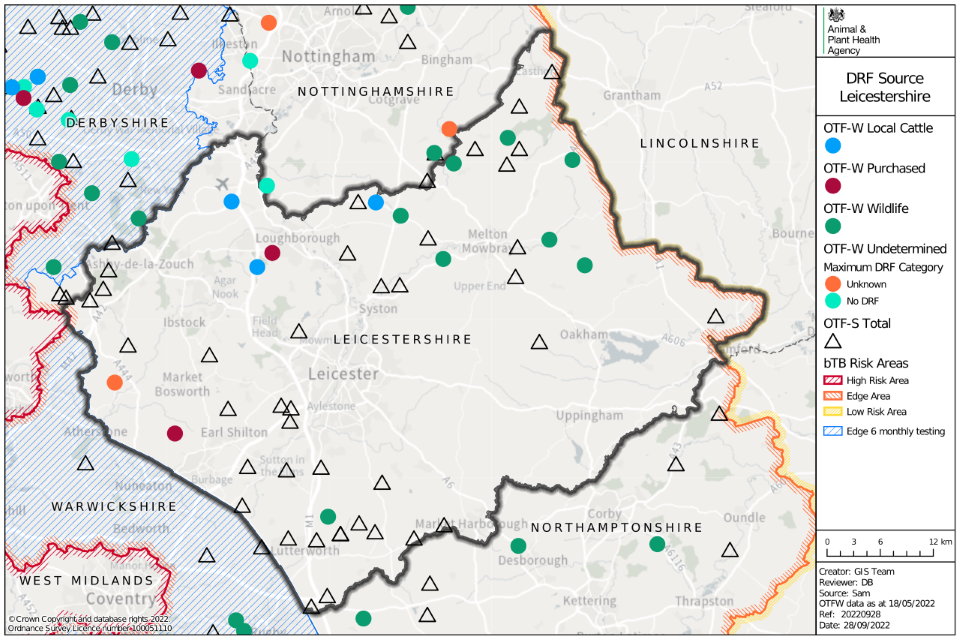
Map of Leicestershire showing data points of OTF-W as circles, and OTF-S as triangles. Colour is used to denote whether the source is from local cattle, purchased, wildlife or is undetermined.
Confirmed Hotspot Area HS23
Most OTF-W incidents were found in north-east Leicestershire near Melton Mowbray. This area is covered by Hotspot 23 (HS23), a confirmed TB hotspot which straddles south-west Lincolnshire, north-east Leicestershire, and south-east Nottinghamshire. All incidents in this area with WGS results were caused by clade B3-11 (genotype 25:a) of M. bovis (see Figure 8) and were most likely associated with wildlife infection (see Figure 9). From this evidence it is apparent that TB has become endemic in the northeast of the county (HS23) where the presence of WGS clade B3-11 is expanding across the Leicestershire border into Nottinghamshire and Lincolnshire as shown in Figure 10.
Hotspot 23 was identified in a contiguous area of south-west Lincolnshire and north-east Leicestershire in 2018. Cattle and susceptible non-bovine farmed species (deer, goats, and camelids) have been subjected to enhanced TB surveillance and control measures since then. Wildlife has been monitored for TB by laboratory analysis of any deer and badger found dead in the area and reported to APHA.
In 2021, 4 badgers were reported to APHA as found dead in HS23. Two were deemed unsuitable for collection, whilst the other two showed no visible lesions of TB at post- mortem examination. This is a marked reduction in the reports of found-dead badgers and wild deer from previous years. This may be due in part to collections being suspended during the AI season starting in October alongside licenced badger culling operations being carried out in the area since 2020. The public are encouraged to continue to report badger and wild deer carcases found in this area.
The original hotspot boundary was reviewed in June 2020 and its area was extended further into Leicestershire and Lincolnshire and included part of south-east Nottinghamshire. The extended hotspot area became effective from September 2020, when culling of badgers in Leicestershire was also licensed by Natural England. A total of 371 badgers were removed during 2021 in the Leicestershire portion of the Hotspot. See the summary of 2021 badger control operations for more details. In 2021, nine badgers were vaccinated in Leicestershire in an area of 0.9km2. See the summary of 2021 badger vaccination for more details.
Figure 10: WGS clades of M. bovis detected in Leicestershire between 2018 and 2021, where wildlife sources were attributed with a 75% certainty or above according to the DRF calculation, as an indication of local M. bovis reservoir in local wildlife populations (OTF-W incidents only).
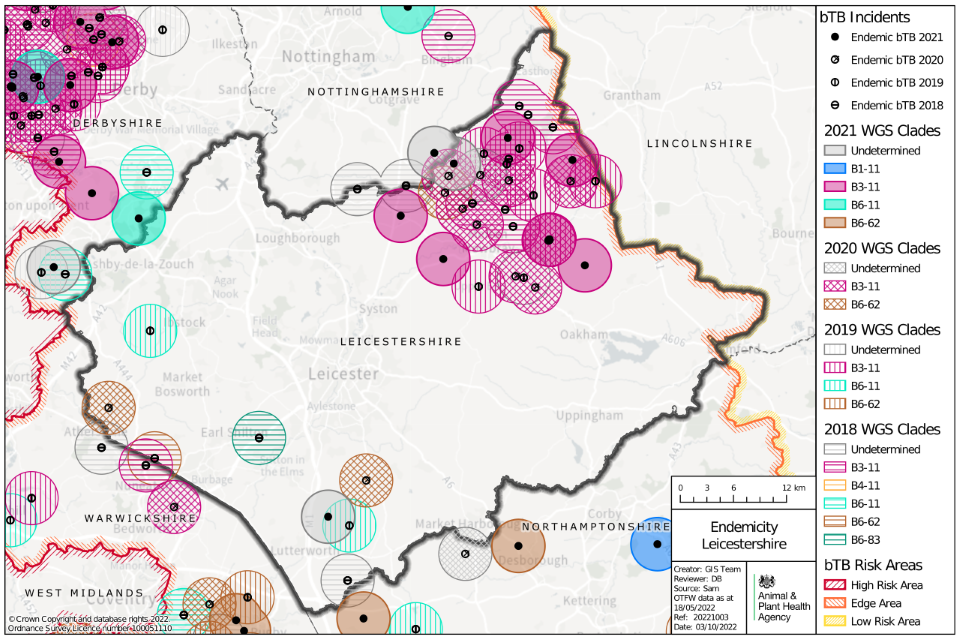
Map of Leicestershire showing locations of possible wildlife reservoirs of TB as points, between 2018 and 2021. Circles surrounding the points are coloured by TB WGS clade and year.
Main risk pathways and key drivers for TB infection
The main risk pathways and key drivers for TB infection within Leicestershire are considered here. Evidence collected during APHA veterinary investigations into the source of infection within herds is used to inform this understanding. In 2021, 51 out of 54 (94%) of new TB incidents in Leicestershire received a preliminary or final APHA veterinary investigation to identify the source of infection.
It can be challenging to retrospectively establish the route of infection for a TB incident herd. Ideally this investigation includes a thorough on-farm investigation and scrutiny of routinely collected data; such as cattle movement records, and the results of WGS where available. Up to 3 hazards and risk pathways are selected for each incident investigated. Each of these potential sources are given a score that reflects the likelihood of that pathway being the true one, based on the available evidence.
Details of the protocol used for these investigations, and the subsequent methodology used to calculate the weighted contribution of the different suspected sources of M. bovis infection can be found in the explanatory supplement to the annual reports 2021.
The key drivers of TB infection in Leicestershire during 2021 were identified as:
- exposure to probable infected badgers
- purchase of undetected infected cattle
- residual infection from previous incidents
Figure 11 presents the aggregated results of the APHA investigations into the source of infection. Further details are presented in Appendix 3, Table 5.
Badgers provided a weighted contribution of 47% to the risk pathways for all new TB incidents declared in the county in 2021, as shown in Figure 11. The frequency of detection of WGS clade B3-11 within incidents attributed to wildlife (see Figure 10) is an indication of endemic TB infection within the local wildlife population in HS23.
Movement of undetected infected cattle was the second main risk pathway, with a weighted contribution of 22%.
Residual cattle infection in herds causing recurrence of TB was the third most common risk pathway, accounting for 9% of the weighted contribution of all risk pathways.
There was a high degree of uncertainty around the source of incidents in 2021. Other or unknown sources had a weighted contribution of 16%. This category is added to herds where there was high uncertainty around the selected pathways. See the explanatory supplement for details of the methodology used.
Figure 11: Summary of the weighted source of infection pathways attributed for OTF-W and OTF-S TB incidents that started in 2021 in Leicestershire, that had a completed DRF (n=51)

Sources attributed were badgers (47%), cattle movement (22%), contiguous infection (2%), residual infection (9%), non-specific reactor (<1%), fomite source (1%), other wildlife source (4%), and other or unknown source (16%), n=51.
Forward look
The measures needed to address the most common risk pathways for TB infection in Leicestershire are:
- prevention of interactions between cattle and badgers on farm to minimise spread of TB from wildlife to cattle, and cattle to wildlife
- incentivising the uptake of effective on-farm biosecurity measures by farmers, reducing the purchase of high-risk animals, and limiting nose to nose contacts with neighbouring herds
- improving diagnostics, surveillance, and epidemiology to detect and remove TB more effectively from cattle herds
Although the herd incidence and prevalence of TB declined in 2021, it is unlikely that Leicestershire will achieve OTF status by 2025.
Appendix 1: Cattle industry demographics
Table 1: Number of cattle premises by size band in Leicestershire at 1 January 2021 (RADAR data)
| Size of herds | Number of herds in Leicestershire |
|---|---|
| Undetermined | 13 |
| 1-50 | 357 |
| 51-100 | 150 |
| 101-200 | 151 |
| 201-350 | 73 |
| 351-500 | 34 |
| 501+ | 49 |
| Total number of herds | 827 |
| Mean herd size | 131 |
| Median herd size | 60 |
Table 2: Number (and percentage of total) of animals by breed purpose in Leicestershire at 1 January 2021
| Breed purpose | Number (and percentage of total) cattle in Leicestershire |
|---|---|
| Beef | 68,278 (62%) |
| Dairy | 36,664 (33%) |
| Dual purpose | 3,596 (3%) |
| Unknown | 1 |
| Total | 108,539 |
Appendix 2: Summary of headline cattle TB statistics
Table 3: Herd-level summary statistics for TB in cattle in Leicestershire between 2019 and 2021
| Herd-level statistics | 2019 | 2020 | 2021 |
|---|---|---|---|
| (a) Total number of cattle herds live on Sam at the end of the reporting period | 1,043 | 1,012 | 941 |
| (b) Total number of whole herd skin tests carried out at any time in the period | 1,208 | 1,156 | 1,082 |
| (c) Total number of OTF cattle herds having TB whole herd tests during the period for any reason | 847 | 833 | 787 |
| (d) Total number of OTF cattle herds at the end of the report period (herds not under any type of Notice Prohibiting the Movement of Bovine Animals (TB02) restrictions) | 974 | 917 | 861 |
| (e) Total number of cattle herds that were not under restrictions due to an ongoing TB incident at the end of the report period | 1,014 | 969 | 913 |
| (f.1) Total number of new OTF-S TB incidents detected in cattle herds during the report period (including all Finishing Units) | 28 | 31 | 40 |
| (f.2) Total number of new OTF-W TB incidents detected in cattle herds during the report period (including all Finishing Units) | 22 | 33 | 14 |
| (g.1) Of the new OTF-W herd incidents, how many can be considered the result of movement, purchase or contact from or with an existing incident based on current evidence? | 7 | 8 | 4 |
| (g.2) Of the new OTF-W herd incidents, how many were triggered by skin test Reactors or 2xIRs at routine herd tests? | 9 | 9 | 6 |
| (g.3) Of the new OTF-W herd incidents, how many were triggered by skin test Reactors or 2xIRs at other TB test types (such as forward and back-tracings, contiguous or check tests)? | 10 | 18 | 6 |
| (g.4) Of the new OTF-W herd incidents, how many were first detected through routine slaughterhouse TB surveillance? | 3 | 5 | 2 |
| (h.1) Number of new OTF-W incidents revealed by enhanced TB surveillance (radial testing) conducted around those OTF-W herds | 0 | 0 | 0 |
| (h.2) Number of new OTF-S incidents revealed by enhanced TB surveillance (radial testing) conducted around those OTF-W herds | 0 | 0 | 0 |
| (i) Number of OTF-W herds still open at the end of the period (including any ongoing OTF-W incidents that began in a previous reporting period, but not including non-grazing Approved Finishing Units) | 15 | 25 | 9 |
| (j) New confirmed (positive M. bovis culture) incidents in non-bovine species detected during the report period (indicate host species involved) | 0 | 0 | 1 (cat) |
| (k.1) Number of grazing approved finishing units active at end of the period | 0 | 1 | 1 |
| (k.2) Number of non-grazing approved finishing units active at end of the period | 14 | 14 | 13 |
| (k.3) Number of grazing exempt finishing units active at end of the period | 0 | 0 | 0 |
| (k.4) Number of non-grazing exempt finishing units active at end of the period | 0 | 0 | 0 |
Table 4: Animal-level summary statistics for TB in cattle in Leicestershire between 2019 and 2021
| Animal-level statistics | 2019 | 2020 | 2021 |
|---|---|---|---|
| (a) Total number of cattle tested in the period (animal tests) | 189,217 | 168,740 | 164,450 |
| (b.1) Reactors detected by tuberculin skin tests during the year | 205 | 242 | 263 |
| (b.2) Reactors detected by additional IFN-γ blood tests (skin-test negative or IR animals) during the year | 307 | 179 | 219 |
| (c) Reactors detected during year per incidents disclosed during year | 10.2 | 6.6 | 8.9 |
| (d) Reactors per 1,000 animal tests | 2.7 | 2.5 | 2.9 |
| (e.1) Additional animals slaughtered during the year for TB control reasons (dangerous contacts, including any first time IRs) | 10 | 21 | 10 |
| (e.2) Additional animals slaughtered during the year for TB control reasons (private slaughters) | 22 | 20 | 24 |
| (f) SLH cases (tuberculous carcases) reported by Food Standards Agency (FSA) during routine meat inspection | 20 | 14 | 10 |
| (g) SLH cases confirmed by culture of M. bovis | 8 | 6 | 3 |
Note (c) Reactors detected during year per incidents disclosed during year, reactors may be from incidents disclosed in earlier years, as any found through testing during the report year count here.
Note (g) SLH cases confirmed by culture of M. bovis, not all cases reported are submitted for culture analysis. All cases reported are from any period prior to or during restrictions.
Appendix 3: Suspected sources of M. bovis infection for all the new OTF-W and OTF-S incidents identified in the report period
Each TB incident could have up to 3 potential risk pathways identified. Each risk pathway is given a score that reflects the likelihood of that pathway bringing TB into the herd. The score is recorded as either definite (score 8), most likely (score 6), likely (score 4) or possible (score 1). The source(s) for each incident are weighted by the certainty ascribed. Any combination of definite, most likely, likely, or possible can contribute towards the overall picture for possible routes of introduction into a herd. If the overall score for a herd is less than 6, then the score is made up to 6 using the ‘Other/Unknown Source’ option. Buffering up to 6 in this way helps to reflect the uncertainty in assessments where only ‘likely’ or ‘possible’ sources are identified.
Table 5 combines the data from multiple herds and provides the proportion of pathways in which each source was identified, weighted by the certainty that each source caused the introduction of TB. The output does not show the proportion of herds where each pathway was identified (this is skewed by the certainty calculation). WGS of M. bovis isolates can be a powerful tool in identifying a likely source of infection, however WGS clades are not determined for OTF-S herds. As a result of varying levels of uncertainty, only broad generalisations should be made from these data. A more detailed description of this methodology is provided in the explanatory supplement for the annual reports 2021.
Table 5: Suspected sources of M. bovis infection for all new OTF-W and OTF-S incidents identified in Leicestershire, in 2021
| Source of infection | Possible (1) | Likely (4) | Most likely (6) | Definite (8) | Weighted contribution |
|---|---|---|---|---|---|
| Badgers | 14 | 13 | 22 | 1 | 46.7% |
| Cattle movements | 13 | 2 | 10 | 1 | 21.7% |
| Contiguous | 2 | 1 | 0 | 0 | 1.9% |
| Residual cattle infection | 3 | 4 | 2 | 0 | 9.0% |
| Domestic animals | 0 | 0 | 0 | 0 | 0.0% |
| Non-specific reactor | 1 | 0 | 0 | 0 | 0.3% |
| Fomites | 2 | 0 | 0 | 0 | 0.5% |
| Other wildlife | 3 | 4 | 0 | 0 | 4.0% |
| Other or unknown source | 5 | 0 | 2 | 0 | 16.0% |
Please note that each TB incident could have up to 3 potential pathways so totals may not equate to the number of actual incidents that have occurred.