Hampshire (edge area) year end report 2021
Updated 16 February 2023

© Crown copyright 2023
This publication is licensed under the terms of the Open Government Licence v3.0 except where otherwise stated. To view this licence, visit nationalarchives.gov.uk/doc/open-government-licence/version/3 or write to the Information Policy Team, The National Archives, Kew, London TW9 4DU, or email: psi@nationalarchives.gov.uk.
Where we have identified any third party copyright information you will need to obtain permission from the copyright holders concerned.
This publication is available at https://www.gov.uk/government/publications/bovine-tb-epidemiology-reports-2021/hampshire-edge-area-year-end-report-2021
Introduction
The Edge Area was originally established in 2013. In 2014, the bovine tuberculosis (TB) surveillance strategy for this area was incorporated into the UK Government’s Strategy to achieve Officially Bovine Tuberculosis-Free (OTF) status for England by 2038. A key action was to recognise the different levels of TB in different parts of the country and to vary the approach to control accordingly. The aim is to obtain OTF status for the Edge Area as soon as possible.
From January 2018, cattle herds in the north-west of Hampshire have routinely undergone TB surveillance every six months, while cattle herds in the rest of the county are tested annually.
This report describes the frequency and geographical distribution of TB in 2021 in cattle herds in Hampshire, which forms part of the Edge Area. It examines what factors are likely to be driving TB in this area, and the risks the disease in this county may pose to neighbouring areas.
County map of England showing the Edge Area and highlighting the county of Hampshire.
TB in cattle and other mammals is primarily caused by the bacterium Mycobacterium bovis (M. bovis), and the disease is subsequently referred to in this report as TB. Although other sources may refer to TB ‘breakdowns’, this report will use the term ‘incidents’ throughout.
This report is intended for individuals involved in the control of TB, both locally and nationally. This includes, but is not limited to farmers, veterinarians, policy makers and the scientific community.
Details of the data handling methodology used in this report, a glossary of terms, and the TB control measures adopted in the Edge Area, can be found in the explanatory supplement for the annual reports 2021.
Types of TB incident
Unless otherwise specified, this report includes all new TB incidents detected during the reporting period. This includes ‘Officially Tuberculosis-Free Status Withdrawn’ (OTF-W) incidents and ‘Officially Tuberculosis-Free Status Suspended’ (OTF-S) incidents.
OTF-W incidents are those involving one or more test reactors with typical lesions of TB identified at post-mortem meat inspection, or one or more animals with M. bovis- positive culture results from tissue samples, or both.
OTF-S incidents are triggered by reactors to the Single Intradermal Comparative Cervical Tuberculin (SICCT) test, but without subsequent detection of TB lesions or positive culture results from tissue samples collected from carcases during the post-mortem inspection, or both.
TB incidents in non-grazing Approved Finishing Units (AFUs) are not included in the prevalence and incidence calculations in this report due to the limited epidemiological impact of these incidents.
Furthermore, herds restricted because of an overdue test rather than a TB incident are also excluded from calculations. Hence measures of incidence and prevalence in this report may be lower than those reported in the official TB statistics.
Cattle industry
Appendix 1 provides cattle industry demographics, and shows Hampshire is predominantly a beef county. The majority of herds are small; 62% of herds have fewer than 50 cattle.
There are no livestock markets in Hampshire. The markets predominantly used are in the High Risk Area (HRA), and there is a flow of cattle, especially for fattening, from the HRA into Hampshire. There is one medium-sized abattoir in Hampshire. There are grazing rights across the common area of the New Forest. There were no AFUs in Hampshire in 2021.
New TB incidents
Figure 1 shows the total number of new TB incidents in Hampshire in 2021 (21) was markedly lower than in 2020 (37). This continued the downward trend in new incidents detected in this county since 2018. There was a reduction in both new OTF-W incidents (from 15 to 8) and new OTF-S incidents (from 22 to 13).
Figure 1: Annual number of new TB incidents in Hampshire, from 2012 to 2021
| Year | OTF-W | OTW-S | Total |
|---|---|---|---|
| 2012 | 7 | 9 | 16 |
| 2013 | 10 | 23 | 33 |
| 2014 | 16 | 21 | 37 |
| 2015 | 13 | 12 | 25 |
| 2016 | 17 | 28 | 45 |
| 2017 | 11 | 25 | 36 |
| 2018 | 13 | 29 | 42 |
| 2019 | 18 | 21 | 39 |
| 2020 | 15 | 22 | 37 |
| 2021 | 8 | 13 | 21 |
There were fewer incidents in the six-monthly surveillance testing area of Hampshire in 2021 (4) compared to 2020 (9). In Hampshire, 5% of cattle herds within the six-monthly testing area were eligible for annual testing under the earned recognition scheme in April 2021, and were eligible for annual surveillance testing.
The timing of detection of new TB incidents changed in Hampshire in 2021 compared to previous years. Strong correlations have previously been observed between number of TB tests undertaken and disclosure of incidents, as shown in Figure 2 and Figure 3, respectively. However, this correlation was poorer in 2021. The disclosure of incidents was more evenly distributed throughout the year, except for no new incidents disclosed in April or August.
Figure 2: Number of tests undertaken in OTF herds in Hampshire in 2021, by month.
| Month | Number of tests |
|---|---|
| January | 6306 |
| February | 6398 |
| March | 11699 |
| April | 6240 |
| May | 3645 |
| June | 4573 |
| July | 2711 |
| August | 3648 |
| September | 4865 |
| October | 10259 |
| November | 7353 |
| December | 4157 |
Figure 3: Number of new TB incidents (OTF-W and OTF-S) in Hampshire in 2021, by month of disclosure.
| Month | OTF-W | OTW-S | Total |
|---|---|---|---|
| January | 2 | 0 | 2 |
| February | 0 | 4 | 4 |
| March | 2 | 1 | 3 |
| April | 0 | 0 | 0 |
| May | 1 | 1 | 2 |
| June | 0 | 2 | 2 |
| July | 1 | 1 | 2 |
| August | 0 | 0 | 0 |
| September | 0 | 1 | 1 |
| October | 2 | 0 | 2 |
| November | 0 | 1 | 1 |
| December | 0 | 2 | 2 |
Figure 4 shows approximately half of new incidents were disclosed at routine whole herd tests (WHT), similar to previous years. Pre-movement tests detected 3 new incidents, demonstrating the important role it plays in supplementing routine surveillance tests and preventing spread to other cattle herds. Both incidents where residual infection was thought to be the most likely risk pathway were detected at a six-month post-incident check test.
Figure 4: Number of TB incidents (OTF-W and OTF-S) in Hampshire in 2021, according to the surveillance methods that detected them.
| Surveillance method | OTF-W | OTF-S | Total |
|---|---|---|---|
| 6 month test (6M) | 2 | 3 | 5 |
| Pre-movement test (PRMT) | 2 | 1 | 3 |
| Radial test (RAD) | 0 | 3 | 3 |
| Slaughterhouse case (SLH) | 1 | 0 | 1 |
| Whole herd test (WHT) | 3 | 6 | 9 |
TB in other species
Suspicion of M. bovis was reported in a domestic cat in South Hampshire in late December 2020. Following further tests, genotype 10:a of M.bovis was isolated in 2021 (Whole Genome Sequencing (WGS) clade B6-62). WGS phylogenetic analysis indicated that this incident was closely related to a series of GB-wide incidents of TB in cats related to the feeding of raw petfood.
Incidence of TB
In 2021, the annual incidence rate (3.3 incidents per 100 herd-years at risk) was the lowest reported in Hampshire since 2015, as shown in Figure 5. Hampshire had the lowest incidence rate of TB out of the 11 Edge Area counties in 2021. The annual incidence rate was lower in Hampshire than in the Low Risk Area (LRA) counties of Bedfordshire (4.0) and Lincolnshire (4.4).
Figure 5: Annual incidence rate (per 100 herd-years at risk) for all new incidents (OTF-W and OTF- S) in Hampshire, from 2012 to 2021.
| Year | TB incidence per 100 herd years at risk |
|---|---|
| 2012 | 2.0 |
| 2013 | 2.8 |
| 2014 | 3.6 |
| 2015 | 3.2 |
| 2016 | 5.7 |
| 2017 | 4.8 |
| 2018 | 5.3 |
| 2019 | 5.6 |
| 2020 | 5.2 |
| 2021 | 3.3 |
Prevalence of TB
Figure 6 shows the herd prevalence of TB in Hampshire at the end of 2021 (1.5%) was half of that recorded at the end of 2020 (3.1%). Hampshire had seen a year-on-year increase in prevalence since 2012, with only a small dip in 2019. The reduction in prevalence in 2021 has taken Hampshire back to 2013 levels and was due to a substantial fall in the number of new incidents throughout 2021, alongside more than half these incidents being disclosed in the first half of 2021.
Figure 6: Annual end of year prevalence in Hampshire, from 2012 to 2021.
| Year | Proportion of herds under restriction (%) |
|---|---|
| 2012 | 0.76 |
| 2013 | 1.37 |
| 2014 | 1.79 |
| 2015 | 1.87 |
| 2016 | 2.03 |
| 2017 | 2.09 |
| 2018 | 2.50 |
| 2019 | 2.43 |
| 2020 | 3.05 |
| 2021 | 1.45 |
In 2021, the majority of incidents resolved within 550 days, which is longer than the duration of incidents seen in 2020 (78% resolved by 240 days). The increase in duration mainly occurred in OTF-W incidents. Incidents that resolved in 2020 had a median duration of 196 days, increasing to 333 days in 2021. However, encouragingly, no incidents were still ongoing after 550 days. As would be expected, OTF-W incidents take longer to resolve than OFT-S incidents and this is demonstrated in Figure 7.
Figure 7: Duration of all TB incidents (OTF-W and OTF-S) that ended in 2021, and the number of persistent TB incidents (under movement restrictions for more than 550 days) that were unresolved at the end of 2021 in Hampshire. Note that AFUs have been excluded.
| Duration of incidents (in days) | OTF-W | OTF-S | Total |
|---|---|---|---|
| 0 to 100 | 0 | 0 | 0 |
| 101 to 150 | 0 | 3 | 3 |
| 151 to 240 | 3 | 13 | 16 |
| 241 to 550 | 8 | 6 | 14 |
| 551+ | 3 | 0 | 3 |
| 551+ still open | 0 | 0 | 0 |
Figure 8 shows animals removed during TB incidents in Hampshire in 2021 were evenly split between interferon-gamma (IFN-γ) test positives and skin test reactors. This is similar to the pattern in 2020, details are available in Appendix 2. The high proportion of reactors identified by IFN-γ testing indicates the importance of this sampling strategy in identifying infected cattle.
Figure 8: Number of skin test reactors and IFN-γ test positive cattle removed by APHA for TB control reasons in Hampshire, from 2012 to 2021.
| Year | Skin test reactors | Interferon gamma reactors | Total |
|---|---|---|---|
| 2012 | 48 | 8 | 56 |
| 2013 | 58 | 16 | 74 |
| 2014 | 92 | 118 | 210 |
| 2015 | 95 | 202 | 297 |
| 2016 | 165 | 140 | 305 |
| 2017 | 99 | 43 | 142 |
| 2018 | 177 | 151 | 328 |
| 2019 | 128 | 68 | 196 |
| 2020 | 146 | 130 | 276 |
| 2021 | 99 | 101 | 200 |
Geographical distribution of TB incidents
Figure 9 shows most new and ongoing TB incidents were in the western part of Hampshire and within the six-monthly surveillance testing area in the north-west of the county. This is similar to the distribution seen in 2020 and follows the geographical distribution of cattle in Hampshire, higher population density of cattle in the north and west.
OTF-W incidents were restricted to the central to northern part of the county, whilst OTF-S incidents (11 out of 13) were concentrated in the south. This distinct distribution of incidents was first observed in 2021. All incidents south of Romsey were OTF-S; however, incidents in the south of the county have been a mixture of OTF-S and OTF-W in past years. Nine out of 21 incidents occurred along the border with Wiltshire and Dorset (HRA counties) in 2021.
Figure 9: Location of cattle holdings in Hampshire with new TB incidents (OTF-W and OTF-S) in 2021 and cattle holdings with pre-2021 OTF-W incidents still ongoing at the beginning of 2021, overlaid on a cattle density map. Note that ‘OTF-W Introduced 2021’ refers to OTF-W incidents in which cattle movements were the most likely source of infection.
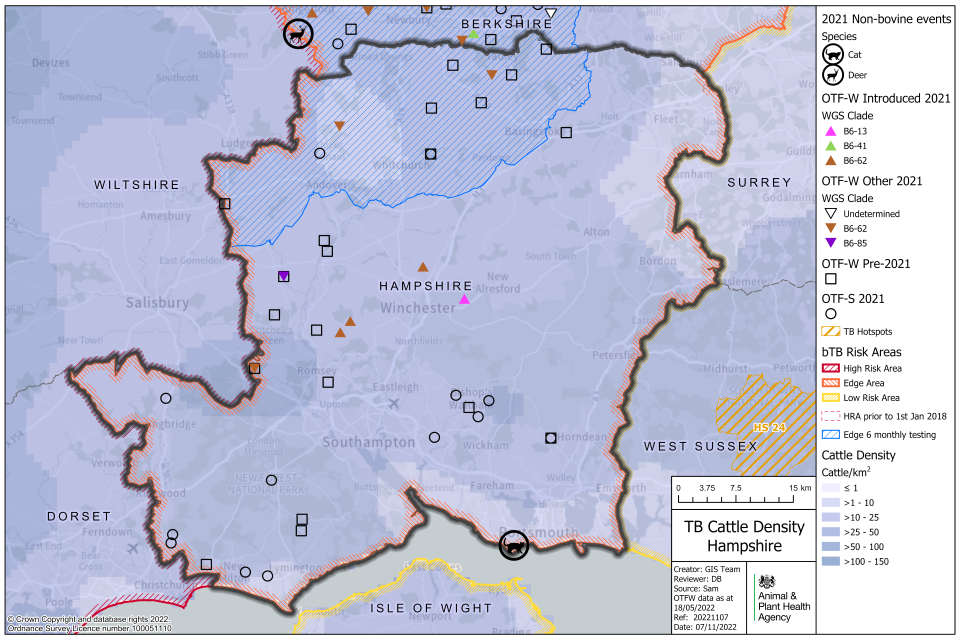
OTF-W incidents mostly appeared in the central to northern part of the county, whilst OTF-S incidents were concentrated in the south.
Figure 10 and 11 shows presumed wildlife linked incidents in 2021 occurred only within the 6-monthly surveillance testing area in the north-west of Hampshire. Other OTF-W incidents in the centre of the county are all likely to have originated from purchased cattle, shown in Figure 10. New incidents within the 6-monthly testing area have been sporadic and their distribution has shown no progression towards or beyond the edge of this area since 2020.
Figure 10: Map of the source of infection pathway recorded with the highest level of certainty, for all TB incidents (OTF-W and OTF-S) in Hampshire that started in 2021. Local cattle refers to both residual infection and contiguous cattle risk pathways. Purchased refers to all cattle movement risk pathways. Wildlife refers to both badger and other wildlife risk pathways. Where none of the sources of infection were identified with greater than 50% certainty, the highest ranking source is displayed with an OTF-W undetermined ‘maximum DRF (disease report form) category’ symbol.
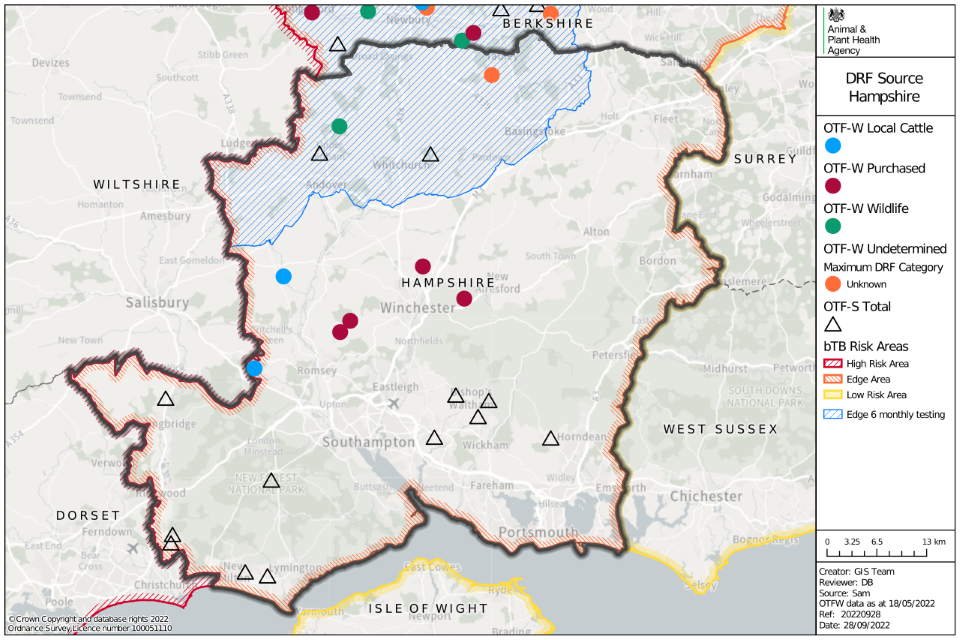
Map of Hampshire showing data points of OTF-W as circles, and OTF-S as triangles. Colour is used to denote whether the source is from local cattle, purchased, wildlife or is undetermined.
Figure 11: WGS clades of M. bovis detected in Hampshire between 2018 and 2021, where wildlife sources were attributed with a 75% certainty or above according to the DRF calculation, as an indication of local M. bovis reservoir in local wildlife populations (OTF-W incidents only).
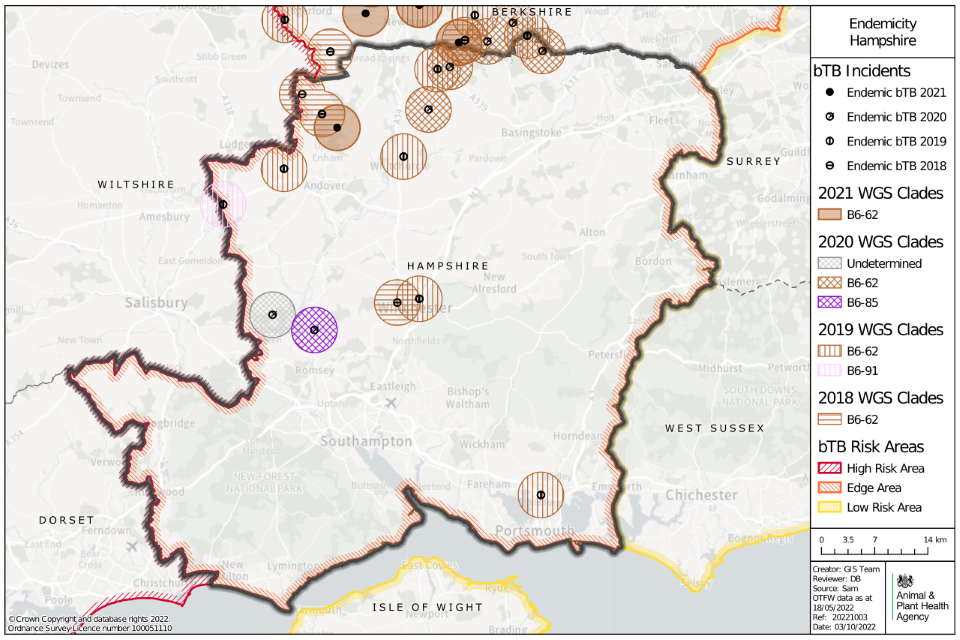
Map of Hampshire showing locations of possible wildlife reservoirs of TB as points, between 2018 and 2021. Circles surrounding the points are coloured by TB WGS clade and year.
Figure 9 shows 6 out of 8 OTF-W incidents were identified as WGS clade B6-62. In 2020, B6-85 (spoligotype 11) was identified 4 times in central Hampshire with no potential for cattle to cattle spread. In 2021, clade B6-85 was identified only once. Figure 10 shows the likely source for this incident was residual infection.
Main risk pathways and key drivers for TB infection
The main risk pathways and key drivers for TB infection within Hampshire are considered here. Evidence collected during APHA veterinary investigations into the source of infection within herds is used to inform this understanding. In 2021, 18 out of 21 (86%) of new TB incidents in Hampshire received a preliminary or final APHA veterinary investigation to identify the source of infection.
It can be challenging to retrospectively establish the route of infection for a TB incident herd. Ideally, this investigation includes a thorough on-farm investigation and scrutiny of routinely collected data, such as cattle movement records, and the results of WGS where available. Up to 3 hazards and risk pathways are selected for each incident investigated.
Each of these potential sources are given a score that reflects the likelihood of that pathway being the true one, based on the available evidence.
Details of the protocol used for these investigations, and the subsequent methodology used to calculate the weighted contribution of the different suspected sources of M. bovis infection can be found in the explanatory supplement to the annual reports 2021.
The key drivers of the TB epidemic in Hampshire during 2021 were as follows:
- purchase of undetected infected cattle
- residual infection from previous incidents
- exposure to probable infected badgers
Figure 12 presents the aggregated results of the APHA investigations into the source of infection. Further details are presented in Appendix 3, Table 5.
Figure 12: Summary of the weighted source of infection pathways attributed for OTF-W and OTF-S TB incidents that started in 2021 in Hampshire, that had a completed DRF (n=18).

Sources attributed were badgers (11%), cattle movement (47%), contiguous infection (5%), residual infection (19%), other wildlife source (4%), and other or unknown source (13%), n=18.
Movements of undetected infected cattle remained the biggest driver for new incidents. They provided a weighted contribution of approximately 47% of all weighted risk pathways. The closest livestock market to Hampshire is Salisbury in the HRA, therefore many cattle purchased from this market will have originated from herds in the HRA. All purchased cattle contributing to OTF-W incidents originated from the HRA or Edge Area, despite the mitigating requirement to pre-movement test.
The second most common source attribution was residual infection, contributing to 19% of weighted risk pathways.
Badgers only accounted for 11% of weighted risk pathways and this is to be expected as most new TB incidents occurred in the annual surveillance testing area of Hampshire where M. bovis was previously not thought to be present in potential wildlife reservoirs.
Other or unknown sources of infection had a weighted contribution of 13%. This category is added to herds where there was high uncertainty around the selected pathways. See the explanatory supplement for details of the methodology used.
Forward look
Given the downward trend of both incidence and prevalence in 2021, there is optimism that Hampshire is heading towards OTF status. However, while incidence has been reducing year on year, prevalence has not mirrored this trend.
APHA, in collaboration with the University of Nottingham, is conducting a project to detect the presence and location of TB infection in badgers in Buckinghamshire, Oxfordshire, Berkshire, Hampshire and East Sussex - collectively known as the ‘Southern Edge Area’. Volunteers have been recruited in each county to help with the safe and timely retrieval of badger carcases. They are delivered to the University of Nottingham, where they undergo post-mortem examination and testing for the presence of TB infection by culture. Those that test positive are sent for further WGS and clade identification (genetic strain). The project aims to collect 100 fresh, ‘found-dead’ badger carcases per county, most likely those killed in road traffic accidents (RTA). Once 100 satisfactory carcases have been examined per county, collection will then cease in that county. Once county targets are achieved, all stakeholders will be informed. The results of this work will help develop a picture of the disease situation in the Southern Edge Area.
Measures that would help address the most common risk pathways for TB infection in Hampshire have been highlighted in previous reports, however they remain important in 2021 if both incidence and prevalence are to continue a downwards trend. These include:
- incentivising the uptake of effective biosecurity measures
- managing the TB risks posed by cattle movements to reduce the risk of spread of TB within and between farms
- continuation and further adoption of control measures to prevent the spread of TB from wildlife, including on-farm biosecurity and badger interventions
- additional measures taken during TB incidents to prevent residual cattle infection in herds after the end of incidents
Appendix 1: Cattle industry demographics
Table 1: Number of cattle premises by size band in Hampshire at 1 January 2021 (RADAR data)
| Size of herds | Number of herds in Hampshire |
|---|---|
| Undetermined | 8 |
| 1-50 | 429 |
| 51-100 | 103 |
| 101-200 | 84 |
| 201-350 | 40 |
| 351-500 | 18 |
| 501+ | 22 |
| Total number of herds | 704 |
| Mean herd size | 85 |
| Median herd size | 30 |
Table 2: Number (and percentage of total) animals by breed purpose in Hampshire at 1 January 2021
| Breed purpose | Number (and percentage of total) cattle in Hampshire |
|---|---|
| Beef | 35,804 (59%) |
| Dairy | 20,682 (34%) |
| Dual purpose | 3,264 (5%) |
| Unknown | 0 |
| Total | 59,750 |
Appendix 2: Summary of headline cattle TB statistics
Table 3: Herd-level summary statistics for TB in cattle in Hampshire between 2019 and 2021
| Herd-level statistics | 2019 | 2020 | 2021 |
|---|---|---|---|
| (a) Total number of cattle herds live on Sam at the end of the reporting period | 906 | 886 | 825 |
| (b) Total number of whole herd skin tests carried out at any time in the period | 960 | 956 | 888 |
| (c) Total number of OTF cattle herds having TB whole herd tests during the period for any reason | 710 | 692 | 680 |
| (d) Total number of OTF cattle herds at the end of the report period (herds not under any type of Notice Prohibiting the Movement of Bovine Animals (TB02) restrictions) | 857 | 834 | 802 |
| (e) Total number of cattle herds that were not under restrictions due to an ongoing TB incident at the end of the report period | 884 | 859 | 813 |
| (f.1) Total number of new OTF-S TB incidents detected in cattle herds during the report period (including all Finishing Units) | 21 | 22 | 13 |
| (f.2) Total number of new OTF-W TB incidents detected in cattle herds during the report period (including all Finishing Units) | 18 | 15 | 8 |
| (g.1) Of the new OTF-W herd incidents, how many can be considered the result of movement, purchase or contact from or with an existing incident based on current evidence? | 4 | 1 | 1 |
| (g.2) Of the new OTF-W herd incidents, how many were triggered by skin test Reactors or 2x inconclusive reactors (IRs) at routine herd tests? | 9 | 8 | 5 |
| (g.3) Of the new OTF-W herd incidents, how many were triggered by skin test Reactors or 2xIRs at other TB test types (such as forward and back-tracings, contiguous or check tests)? | 7 | 6 | 2 |
| (g.4) Of the new OTF-W herd incidents, how many were first detected through routine slaughterhouse (SLH) TB surveillance? | 1 | 0 | 1 |
| (h.1) Number of new OTF-W incidents revealed by enhanced TB surveillance (radial testing) conducted around those OTF-W herds | 3 | 4 | 2 |
| (h.2) Number of new OTF-S incidents revealed by enhanced TB surveillance (radial testing) conducted around those OTF-W herds | 0 | 6 | 2 |
| (i) Number of OTF-W herds still open at the end of the period (including any ongoing OTF-W incidents that began in a previous reporting period, but not including non-grazing Approved Finishing Units) | 11 | 13 | 7 |
| (j) New confirmed (positive M. bovis culture) incidents in non-bovine species detected during the report period (indicate host species involved) | 1 (fallow deer) | 0 | 1 (cat) |
| (k.1) Number of grazing approved finishing units active at end of the period | 0 | 0 | 0 |
| (k.2) Number of non-grazing approved finishing units active at end of the period | 0 | 0 | 0 |
| (k.3) Number of grazing exempt finishing units active at end of the period | 0 | 0 | 0 |
| (k.4) Number of non-grazing exempt finishing units active at end of the period | 2 | 1 | 1 |
Table 4: Animal-level summary statistics for TB in cattle in Hampshire between 2019 and 2021
| Animal-level statistics | 2019 | 2020 | 2021 |
|---|---|---|---|
| (a) Total number of cattle tested in the period (animal tests) | 110,981 | 111,161 | 99,773 |
| (b.1) Reactors detected by tuberculin skin tests during the year | 128 | 146 | 99 |
| (b.2) Reactors detected by additional IFN-γ blood tests (skin-test negative or IR animals) during the year | 68 | 130 | 101 |
| (c) Reactors detected during year per incidents disclosed during year | 5.0 | 7.5 | 9.5 |
| (d) Reactors per 1,000 animal tests | 1.8 | 2.5 | 2.0 |
| (e.1) Additional animals slaughtered during the year for TB control reasons (dangerous contacts, including any first time IRs) | 18 | 7 | 0 |
| (e.2) Additional animals slaughtered during the year for TB control reasons (private slaughters) | 15 | 6 | 8 |
| (f) SLH cases (tuberculous carcases) reported by Food Standards Agency (FSA) during routine meat inspection | 7 | 3 | 1 |
| (g) SLH cases confirmed by culture of M. bovis | 3 | 0 | 1 |
Note (c) Reactors detected during year per incidents disclosed during year, reactors may be from incidents disclosed in earlier years, as any found through testing during the report year count here.
Note (g) SLH cases confirmed by culture of M. bovis, not all cases reported are submitted for culture analysis. All cases reported are from any period prior to or during restrictions.
Appendix 3: Suspected sources of M. bovis infection for all the new OTF-W and OTF-S incidents identified in the report period
Each TB incident could have up to 3 potential risk pathways identified. Each risk pathway is given a score that reflects the likelihood of that pathway bringing TB into the herd. The score is recorded as either definite (score 8), most likely (score 6), likely (score 4) or possible (score 1). The sources for each incident are weighted by the certainty ascribed. Any combination of definite, most likely, likely, or possible can contribute towards the overall picture for possible routes of introduction into a herd. If the overall score for a herd is less than 6, then the score is made up to 6 using the ‘Other/Unknown Source’ option.
Buffering up to 6 in this way helps to reflect the uncertainty in assessments where only ‘likely’ or ‘possible’ sources are identified.
Table 5 combines the data from multiple herds and provides the proportion of pathways in which each source was identified, weighted by the certainty that each source caused the introduction of TB. The output does not show the proportion of herds where each pathway was identified (this is skewed by the certainty calculation). WGS of M. bovis isolates can be a powerful tool in identifying a likely source of infection, however WGS clades are not determined for OTF-S herds. As a result of varying levels of uncertainty, only broad generalisations should be made from these data. A more detailed description of this methodology is provided in the Explanatory supplement for the annual reports 2021.
Table 5: Suspected sources of M. bovis infection for all new OTF-W and OTF-S incidents identified in Hampshire, in 2021
| Source of infection | Possible (1) | Likely (4) | Most likely (6) | Definite (8) | Weighted contribution |
|---|---|---|---|---|---|
| Badgers | 7 | 2 | 0 | 0 | 10.9% |
| Cattle movements | 8 | 3 | 7 | 0 | 47.4% |
| Contiguous | 1 | 0 | 1 | 0 | 5.1% |
| Residual cattle infection | 1 | 1 | 3 | 0 | 19.3% |
| Domestic animals | 0 | 0 | 0 | 0 | 0.0% |
| Non-specific reactor | 0 | 0 | 0 | 0 | 0.0% |
| Fomites | 0 | 0 | 0 | 0 | 0.0% |
| Other wildlife | 1 | 1 | 0 | 0 | 4.4% |
| Other or unknown source | 0 | 0 | 0 | 0 | 13.0% |
Please note that each TB incident could have up to 3 potential pathways so totals may not equate to the number of actual incidents that have occurred.