East Sussex (edge area) year end report 2021
Updated 16 February 2023

© Crown copyright 2023
This publication is licensed under the terms of the Open Government Licence v3.0 except where otherwise stated. To view this licence, visit nationalarchives.gov.uk/doc/open-government-licence/version/3 or write to the Information Policy Team, The National Archives, Kew, London TW9 4DU, or email: psi@nationalarchives.gov.uk.
Where we have identified any third party copyright information you will need to obtain permission from the copyright holders concerned.
This publication is available at https://www.gov.uk/government/publications/bovine-tb-epidemiology-reports-2021/east-sussex-edge-area-year-end-report-2021
Introduction
The Edge Area was originally established in 2013. In 2014, the bovine tuberculosis (TB) surveillance strategy for this area was incorporated into the UK Government’s Strategy to achieve Officially Bovine Tuberculosis-Free (OTF) status for England by 2038. A key action was to recognise the different levels of TB in different parts of the country and to vary the approach to control accordingly. The aim is to obtain OTF status for the Edge Area as soon as possible.
This report describes the frequency and geographical distribution of TB in 2021 in cattle herds in East Sussex, which forms part of the Edge Area. It examines what factors are likely to be driving TB in this area, and the risks the disease in this county may pose to neighbouring areas.
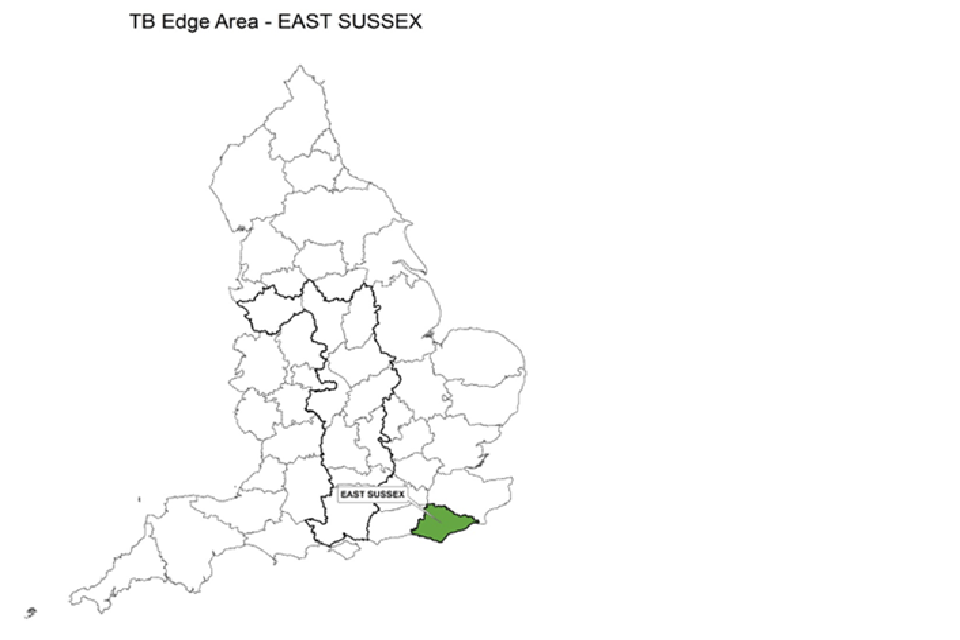
County map of England showing the Edge Area and highlighting the county of East Sussex.
TB in cattle and other mammals is primarily caused by the bacterium Mycobacterium bovis (M. bovis), and the disease is subsequently referred to in this report as TB. Although other sources may refer to TB ‘breakdowns’, this report will use the term ‘incidents’ throughout.
This report is intended for individuals involved in the control of TB, both locally and nationally. This includes, but is not limited to farmers, veterinarians, policy makers and the scientific community.
Details of the data handling methodology used in this report, a glossary of terms, and the TB control measures adopted in the Edge Area, can be found in the explanatory supplement for the annual reports 2021.
Types of TB incident
Unless otherwise specified, this report includes all new TB incidents detected during the reporting period. This includes ‘Officially Tuberculosis-Free Status Withdrawn’ (OTF-W) incidents and ‘Officially Tuberculosis-Free Status Suspended’ (OTF-S) incidents.
OTF-W incidents are those involving one or more test reactors with typical lesions of TB identified at post-mortem meat inspection, or one or more animals with M. bovis- positive culture results from tissue samples, or both.
OTF-S incidents are triggered by reactors to the Single Intradermal Comparative Cervical Tuberculin (SICCT) test, but without subsequent detection of TB lesions or positive culture results from tissue samples collected from carcases during the PM inspection, or both.
TB incidents in non-grazing Approved Finishing Units (AFUs) are not included in the prevalence and incidence calculations in this report due to the limited epidemiological impact of these incidents.
Furthermore, herds restricted because of an overdue test rather than a TB incident are also excluded from calculations. Hence measures of incidence and prevalence in this report may be lower than those reported in the official TB statistics.
Cattle industry
Appendix 1 provides cattle industry demographics in East Sussex which has a relatively low density of cattle farms. In 2021, 67% of cattle in the county were beef animals (with beef suckler herds being the predominant farm type in this category), 28% were dairy, and 3% were dual purpose. The mean number of cattle per holding remained at 85, the same as in 2020. There were only 11 herds with over 500 cattle in 2021, mostly dairy herds.
Table 1 shows the number of herds in the region has remained relatively stable, with a slight decrease from 511 in 2020 to 504 in 2021.
There are 2 low-volume livestock markets providing an outlet for cattle from East Sussex: Hailsham market in East Sussex and Ashford market in the neighbouring Low Risk Area (LRA) county of Kent. Larger dairy and beef finishing herds source their cattle for restocking from further afield. This poses a risk of introducing TB infection into East Sussex from the High Risk Area (HRA) and from parts of Wales, where both cattle density and the prevalence of TB are much higher. There was one AFU without grazing in operation in East Sussex in 2021.
New TB incidents
Figure 1 shows there were 27 new TB incidents in East Sussex in 2021; 4 (15%) were OTF-W and 23 (85%) were OTF-S. Overall, this is a 34% reduction on the number of TB incidents detected in 2020 (41 incidents). However, the 2021 figure is still 17% higher than 2019 (23 incidents). OTF-W incident numbers reduced more than OTF-S incidents in 2021 (67% and 21%, respectively).
Figure 1: Annual number of new TB incidents in East Sussex, from 2012 to 2021, showing incidents for the whole county and the original Edge Area.

For 2021 there were 4 OTF-W incidents and 23 OTF-S incidents for the whole county. In the original Edge area of the county there were 1 OTF-W and 19 OTF-S incidents.
When considering herds with over 500 cattle, 4 out of the 11 herds (36%) had a new TB incident. These 4 larger herds were all dairy. This is consistent with a larger herd size being a risk factor for TB.
Inconclusive reactor (IR) cattle that failed to resolve upon re-test triggered 13 of the 23 (57%) new OTF-S incidents. Routine whole herd testing (WHT) was the disclosing test for 9 of these 13 OTF-S incidents. Six-month testing (6M) following the closure of a previous TB incident and a six-month radial test (RAD6) disclosed 1 and 3 incidents, respectively.
This unusual predominance of incidents occurring as a result of an IR retest was also observed in 2020, when two-thirds (66%) of the 29 OTF-S incidents were triggered by IR animals that had remained IRs or became standard reactors at their skin retest 60 days later. Of these 13 IR derived incidents in 2021, 9 (69%) cleared within 2 SITs without any further reactors. One OTF-W incident in East Sussex occurred as a result of a single twice-IR animal. The affected herd went on to have 79 interferon-gamma (IFN-γ) test- positive animals and suffered the largest TB incident in the county in 2021 (further details below).
Two OTF-W incidents in East Sussex in 2021 began as a result of visible lesions being identified at post-mortem in passive slaughterhouse (SLH) surveillance. Both incidents were M. bovis culture positive.
There were no incidents of TB reported in non-bovine species during 2021.
Unusual TB incidents
Chronic TB incidents are those that have lasted for more than one year. There were 5 ongoing chronic incidents in 2021; 3 of which were OTF-S and 2 OTF-W. Three were beef suckler herds, one was a beef fattening herd, and one was a dairy herd. None of these became persistently infected herds (under movement restrictions for more than 550 days), and all except one chronic OTF-S incident had resolved by the end of the year.
The incident that disclosed the most reactors involved an OTF-W dairy herd located in the original HRA part of East Sussex. This incident began after an IR disclosed at a 6M test was still an IR at re-test 60 days later and, therefore, was classified as a reactor. The holding in question had an OTF-W incident in 2019, with visible lesions but no positive culture.
In addition to the disclosing skin test IR (and then reactor), 79 cattle were also removed as IFN-y test positive. Two more animals also became reactors after severe re-interpretation of the disclosing 6M test results.
Two of the animals removed during the incident had visible lesions of TB, including 1 of the 2 severe-reinterpretation reactors presenting with diffuse udder lesions. Other than the 2 severe-reinterpretation reactors, there were no further skin test reactors at either standard or severe interpretation during this incident. M. bovis was unable to be cultured from the visible lesions of TB.
This incident was resolved after one round of IFN-y testing and 3 rounds of short interval skin herd testing (SIT), lasting 8 and a half months in total. No definitive source of this incident could be identified, given the inability to isolate and sequence the causative bacterium. Given the high risk of indirect contact with badgers on the farm, as well as the herd’s close proximity to the endemic TB area of East Sussex, infected badgers were considered the most-likely risk pathway. The high number of IFN-γ test-positive animals and absence of skin test reactors at SITs suggests that these animals were identified and removed at an early stage of infection.
There was one incident where no SIT was carried out, as the 2 cattle remaining in the affected herd were taken as reactors after becoming 2x IR at the retest.
Incidence of TB
Figure 2 shows in 2021, East Sussex had the ninth highest incidence per 100 herd-years at risk out of the 11 Edge Area counties (6.2). This was below the overall incidence rate for the Edge Area (8.9). TB incidence per 100 herd-years at risk increased between 2012 and 2020, from 2.0 to 8.1. However, it dropped to 6.2 in 2021. TB incidence in 2021 fits with the gradual rising trend that has been observed in East Sussex since 2012.
Figure 2: Annual incidence rate (per 100 herd-years at risk) for all new incidents (OTF-W and OTF- S) in East Sussex, from 2012 to 2021, showing incidents for the whole county and the original Edge Area.

For 2021 the incidence rate was 6.2 incidents per 100 herd-years at risk for the whole county, and 5.7 incidents per 100 herd-years at risk for the original Edge Area of the county.
Prevalence of TB
East Sussex has a relatively low prevalence of TB, with 2.1% of herds under movement restrictions caused by a TB incident at the end of 2021, compared to 4.5% in the Edge Area as a whole. Although end-of-year prevalence decreased in 2021, from 2.6% in 2020, it has approximately doubled over the last decade, from around 1% in 2012, as shown in Figure 3. The 34% reduction in new TB incidents in 2021 compared to 2020 contributed to the overall reduction in prevalence observed.
Figure 3: Annual end of year prevalence in East Sussex, from 2012 to 2021, showing incidents for the whole county and the original Edge Area.

Line chart showing the year-end TB herd prevalence in East Sussex between 2012 and 2021. For 2021 this was 2.05% for the whole county and 2.22% for the original Edge Area of the county.
End-of-year prevalence for the original Edge Area of East Sussex increased from 1.4% in 2020 to 2.2% in 2021, despite fewer new TB incidents detected in this area in 2021 (20 incidents) compared to 2020 (22 incidents). This is the highest end-of-year prevalence recorded in this area since 2012, with the last highest end-of-year prevalence being 1.8% in 2015. The decreased ratio of incidents in the original HRA section compared to the original Edge Area, as well as the timing of disclosure of incidents will contribute to this.
It is challenging to compare prevalence between years with small numbers of incidents, as the timing of incident disclosure will have an impact on whether incidents are resolved by the end of the year (when herd prevalence is calculated). For example, 6 out of the 7 incidents in the original HRA part of the county were disclosed between January to April 2021, and therefore most had resolved before the end of the year. In comparison, only 50% (10 incidents) in the original Edge area of the county were disclosed in the same time period. All new OTF-S incidents remaining unresolved at the end of the year were located in the original Edge area.
Seven of the 23 OTF-S incidents and 7 of the 9 OTF-W incidents which resolved in 2021 were pre-2021 incidents. The incidents that took the longest to resolve were mostly those involving larger herds. Persistent incidents are classified as those herds which remain under TB restrictions for over 18 months (550 days). Figure 4 shows there was only one persistent incident which resolved in 2021. This was an OTF-S incident in a suckler herd with over 500 cattle located in the original Edge Area. No persistent incidents remained unresolved (open) at the end of 2021.
Figure 4: Duration of all TB incidents (OTF-W and OTF-S) that ended in 2021, and the number of persistent TB incidents (under movement restrictions for more than 550 days) that were unresolved at the end of 2021. Note that AFUs have been excluded.
| Duration of incidents (in days) | OTF-W | OTF-S | Total |
|---|---|---|---|
| 0 to 100 | 0 | 0 | 0 |
| 101 to 150 | 0 | 1 | 1 |
| 151 to 240 | 2 | 15 | 17 |
| 241 to 550 | 6 | 6 | 12 |
| 551+ | 0 | 1 | 1 |
| 551+ still open | 0 | 0 | 0 |
Geographical distribution of TB incidents
Figure 5 shows the distribution of new OTF-S and OTF-W TB incidents in 2021 throughout East Sussex. The number of TB incidents in the original HRA part of the county decreased from 20 in 2020, to 7 in 2021 (65% reduction), but these remained in largely the same area. This is the lowest number of new TB incidents recorded in the original HRA section of the county since 2013.
Figure 5: Location of cattle holdings in East Sussex with new TB incidents (OTF-W and OTF-S) in 2021 and cattle holdings with pre-2021 OTF-W incidents still ongoing at the beginning of 2021, overlaid on a cattle density map. Note that ‘OTF-W Introduced 2021’ refers to OTF-W incidents in which cattle movements were the most likely source of infection.
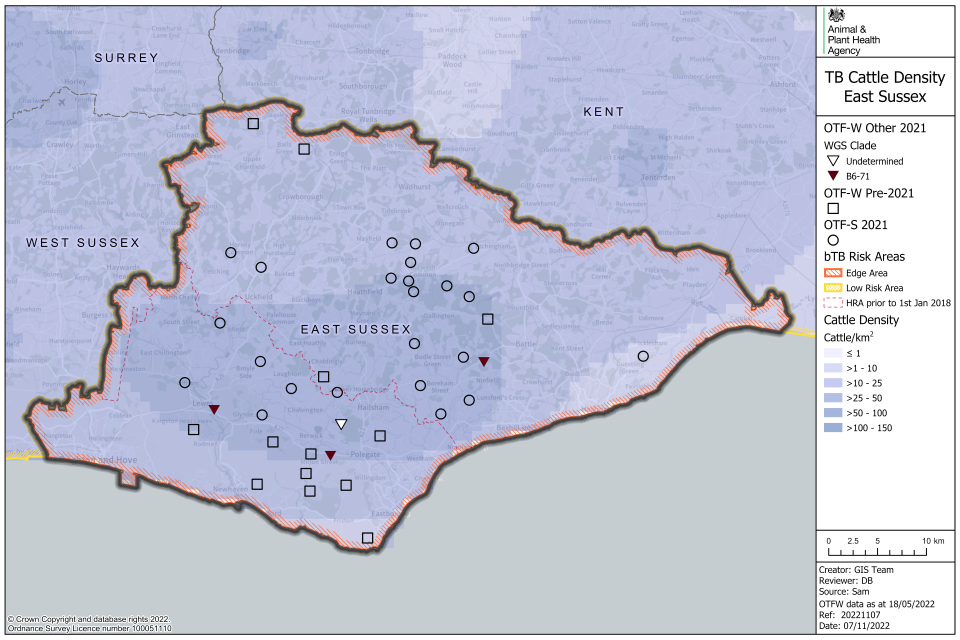
Most TB incidents in East Sussex in 2021 occurred in areas with higher cattle density.
Historically, the original Edge Area of East Sussex has not been considered endemically infected with TB. Even so, TB incidents in the original Edge Area saw a sharp increase between 2019 to 2020 and remained high in 2021, with a slight reduction (20 incidents in 2021 compared to 22 in 2020). The increase in incidents in the original Edge Area could be suggestive of a wildlife reservoir in this area. The ongoing Southern Edge badger TB survey, (described in further detail below), aims to provide further insight into TB in badgers in those counties in the southern half of the Edge Area, including East Sussex.
New TB incidents (21 out of 26, 81%) occurred in the highest cattle density areas of East Sussex.
The observed increase in new TB incidents in the original Edge Area was due to high numbers of OTF-S incidents (19 incidents in both 2020 and 2021). In 2021, there were 9 OTF-S incidents within less than 10km, 4 within the same parish. As these incidents were all OTF-S, there is no M. bovis genetic data available, meaning there is less evidence to determine the source of infection. There was no definitive source of infection pathway identified for any breakdown within this cluster of infection, or a commonly identified likely source.
Figure 6 shows the source of 7 OTF-S incidents in 2021 was determined as ‘Unknown’ as there was no infection risk pathway identified with greater than 50% certainty, and 2 had local cattle identified as the risk pathway with the highest level of certainty. Seven of these nine incidents were a result of IR re-tests identified at disclosing test, and 5 of these subsequently cleared after the minimum 2 SITs with no further skin test reactors or IRs. As these were disclosed due to IR re-tests, it is therefore possible that the increase in this area will not be sustained in future years, as observed with the sharp increase in 2020 incidents due to unresolved IRs, which was not maintained. Other OTF-S incidents were dispersed throughout the county with no obvious spatial clustering. Two OTF-S incidents (both located within the original Edge Area) did not have a disease report form (DRF) visit undertaken due to the highly pathogenic avian influenza (HPAI) outbreak, and therefore no risk pathways were identified for these incidents.
Figure 6: Map of the source of infection pathway recorded with the highest level of certainty, for all TB incidents (OTF-W and OTF-S) in East Sussex that started in 2021. Local cattle refers to both residual infection and contiguous cattle risk pathways. Purchased refers to all cattle movement risk pathways. Wildlife refers to both badger and other wildlife risk pathways. Where none of the sources of infection were identified with greater than 50% certainty, the highest ranking source is displayed with an OTF-W undetermined ‘maximum DRF category’ symbol.
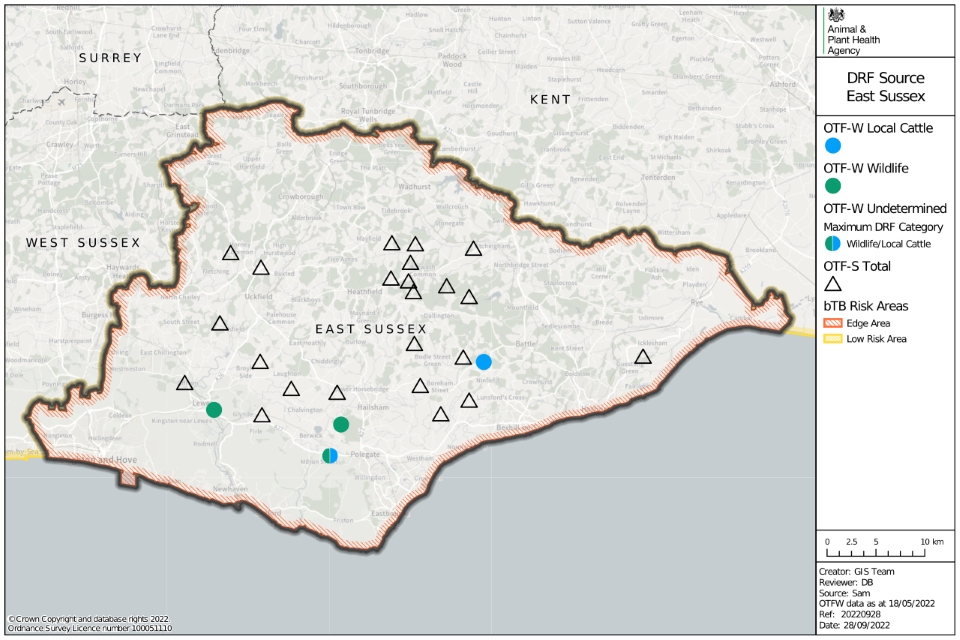
Map of East Sussex showing data points of OTF-W as circles, and OTF-S as triangles. Colour is used to denote whether the source is from local cattle, purchased, wildlife or is undetermined.
There were 4 new OTF-W incidents in East Sussex in 2021. Three of these were in the original HRA portion in the south of the county, and one was in the original Edge Area. Three of these incidents were culture positive, with Whole Genome Sequencing (WGS) clade B6-71 (genotype 13:a) cultured (2 in the original HRA and one in the original Edge area). This was to be expected for those in the original HRA, as they are located in the one range of this clade and an area with known endemic 13:a M. bovis infection in the wildlife.
The B6-71 isolate in the original Edge Area was considered to be likely linked to either residual infection in the herd or movements from East Sussex Edge Area, based on the epidemiological information from the DRF.
Figure 7 shows OTF-W incidents in 2021 in which exposure to wildlife reservoirs of infection was considered a source with 75% or greater certainty decreased compared to 2020. Those identified in 2021 were located within the original HRA portion of the county. This suggests that the area of endemic M. bovis infection in wildlife has not significantly expanded, although the 2 wildlife-linked TB incidents in 2021 were located north of the A27 road, slightly further north than those in 2020. This road was previously considered a barrier to the spread of wildlife infection.
Figure 7: WGS clades of M. bovis detected in East Sussex between 2018 and 2021, where wildlife sources were attributed with a 75% certainty or above according to the DRF calculation, as an indication of local M. bovis reservoir in local wildlife populations (OTF-W incidents only).
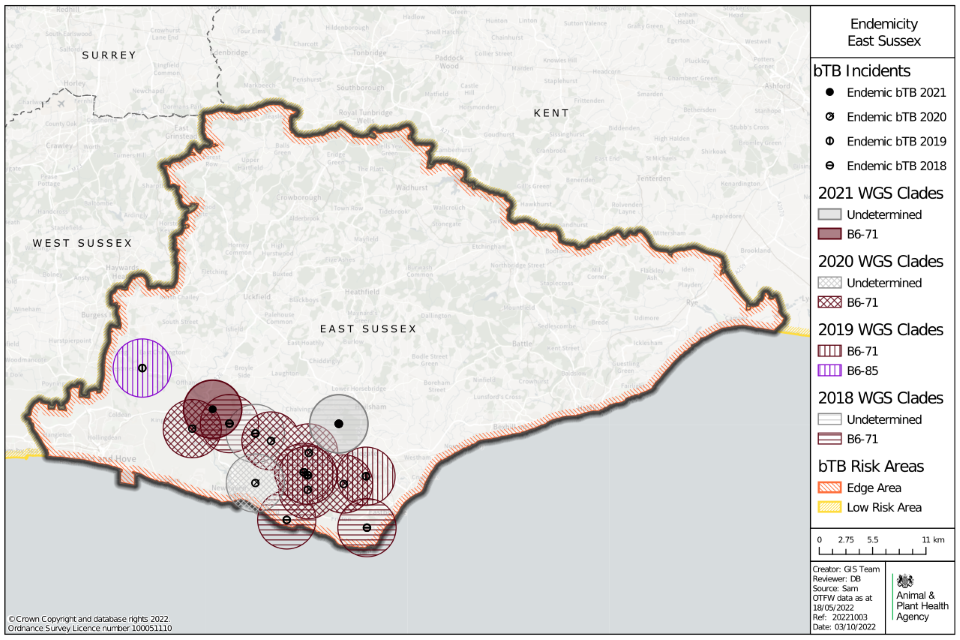
Map of East Sussex showing locations of possible wildlife reservoirs of TB as points, between 2018 and 2021. Circles surrounding the points are coloured by TB WGS clade and year.
Skin test reactors and interferon gamma test positive animals removed
Appendix 2 provides a summary of headline cattle TB statistics in East Sussex. The 34% reduction in TB incidents in 2021 compared to 2020 translated to a corresponding decrease in the number of skin test reactors (51% decrease from 128 in 2020 to 65 in 2021). Despite the number of OTF-W incidents decreasing by 67% (from 12 in 2020 to 4 in 2021), the number of IFN-y test positive animals only fell by 11% and exceeded the number of skin test reactors in 2021, as shown in Figure 8. However, of these 83 IFN-y test positives in 2021, 79 were from a single OTF-W incident summarised above.
Figure 8: Number of skin test reactors and IFN-γ test positive cattle removed by APHA for TB control reasons in East Sussex, from 2012 to 2021.
| Year | Skin test reactors | Interferon gamma reactors | Total |
|---|---|---|---|
| 2012 | 33 | 6 | 39 |
| 2013 | 45 | 23 | 68 |
| 2014 | 62 | 29 | 91 |
| 2015 | 47 | 78 | 125 |
| 2016 | 85 | 18 | 103 |
| 2017 | 78 | 9 | 87 |
| 2018 | 146 | 150 | 296 |
| 2019 | 78 | 134 | 212 |
| 2020 | 128 | 94 | 222 |
| 2021 | 65 | 83 | 148 |
Thirteen (81%) of the 16 OTF-S incidents that began, and subsequently resolved, in 2021 only disclosed 1 to 3 reactors. Of these 13 incidents, 10 disclosed only 1 reactor. Nine of these 10 incidents with 1 reactor began as a retest of an IR in an OTF herd. These incidents with smaller numbers of reactors resolved quickly with minimal amount of testing. The reduced number of skin reactors disclosed in incidents is encouraging, suggesting that infections are being detected earlier, before significant cattle to cattle transmission has occurred within the affected herds.
Main risk pathways and key drivers for TB infection
The main risk pathways and key drivers for TB infection within East Sussex are considered here. Evidence collected during APHA veterinary investigations into the source of infection within herds is used to inform this understanding. In 2021, 25 out of 27 (93%) of new TB incidents in East Sussex received a preliminary or final APHA veterinary investigation to identify the source of infection.
It can be challenging to retrospectively establish the route of infection for a TB incident herd. Ideally this investigation includes a thorough on-farm investigation and scrutiny of routinely collected data; such as cattle movement records, and the results of WGS where available. Up to 3 hazards and risk pathways are selected for each incident investigated. Each of these potential sources are given a score that reflects the likelihood of that pathway being the true one, based on the available evidence.
Details of the protocol used for these investigations, and the subsequent methodology used to calculate the weighted contribution of the different suspected sources of M. bovis infection can be found in the explanatory supplement to the annual reports 2021.
The key drivers of the TB epidemic in East Sussex during 2021 were as follows:
- exposure to probable infected badgers
- purchase of undetected infected cattle
- residual infection from previous incidents
Figure 9 presents the aggregated results of the APHA investigations into the source of infection. Further details are presented in Appendix 3, Table 5.
Figure 9: Summary of the weighted source of infection pathways attributed for OTF-W and OTF-S TB incidents that started in 2021 in East Sussex, that had a completed DRF (n=25).

Sources attributed were badgers (32%), cattle movement (20%), contiguous infection (3%), residual infection (18%), fomite source (1%), other wildlife source (1%), and other or unknown source (24%), n=25.
In 2021, badgers provided a weighted contribution of approximately 32% of all risk pathways for TB incident herds. Badgers, particularly within the endemic area of East Sussex, can act as reservoirs of infection for cattle through direct or indirect contact.
Movements of cattle with undetected infection (particularly from herds in the Edge or HRA) were the second most important driver of the TB epidemic in East Sussex in 2021, with a weighted contribution of 20% of risk pathways overall.
Residual cattle infection in herds causing recurrence of TB was the third most important identified driver in 2021 (18%). Seven of the 27 new incidents (26%) in 2021 had previous TB history. These recurrent TB incidents can occur from either undisclosed infection in cattle, that were not identified by testing and removal during a previous herd incident, or re-infection from environmental contamination.
Residual infection in the herd was cited as the most common risk pathway for the recurrent OTF-S incidents, and either infected badgers or residual infection for the recurrent OTF-W incidents. Figure 10 shows 2 of the 7 recurrent incidents in 2021 (one OTF-S and one OTF-W) had a recent OTF-W incident in the last 3 years.
Figure 10: Number of herds with a TB incident (OTF-W and OTF-S) in East Sussex in 2021, with a history of any TB incident in the previous 3 years, and holdings without a history of TB in the previous 3 years.

Column chart showing the number of incidents in East Sussex in 2020 in herds that have either had an incident in the previous three years (2 OTF-W, 5 OTF-S) or have no recent history of TB (2 OTF-W, 18 OTF-S).
Other or unknown sources of infection had a weighted contribution of 24%. This category is added to herds where there was high uncertainty around the selected pathways. See the explanatory supplement for details of the methodology used.
Infected wildlife and purchased cattle movements were also the top 2 drivers in 2020, accounting for 28% and 30% of the weighted source of infection pathways, respectively.
Forward look
Following an increase in TB incidents in 2020, there was a decline in the county-level incidence rate in 2021, although this remained higher than pre-2020 levels. Herd incidence rate in the original Edge Area was at its highest following the increase between 2019 to 2020, with a sustained high number of OTF-S incidents (19) disclosed in this area in 2021. In the last 3-year period, 63% of those herds had no TB history. The concentration of TB incident herds in the north-east of the county will need further evaluation over the coming years to see if this trend continues. The number of OTF-S incidents remained relatively high for East Sussex and was distributed throughout the county in 2021.
Understanding the epidemiological picture of TB is complicated in East Sussex by the lack of WGS information associated with OTF-S incidents, making it difficult to ascertain the source of infection, especially for incidents occurring outside of the endemic area with no apparent link to cattle purchases or movements.
Despite the decline in incidents in 2021, there has been a slight increase in prevalence, and the overall trend for the last decade has been an increase in these parameters.
Therefore, it appears unlikely that the goal of achieving OTF status by 2025 will be achieved in this county on the current trajectory.
There are 2 projects within the county focusing on TB in wildlife and its control which began in 2021. APHA, in collaboration with the University of Nottingham, is conducting a project to detect the presence and location of TB infection in badgers in Buckinghamshire, Oxfordshire, Berkshire, Hampshire and East Sussex - collectively known as the ‘Southern Edge Area’. Volunteers have been recruited in each county to help with the safe and timely retrieval of badger carcases. They are delivered to the University of Nottingham, where they undergo post-mortem examination and testing for the presence of TB infection by culture. Those that test positive are sent for further whole genome sequencing and clade identification (genetic strain). The project aims to collect 100 fresh, ‘found-dead’ badger carcases per county, most likely those killed in road traffic accidents (RTA). Once 100 satisfactory carcases have been examined per county, collection will then cease in that county. Once county targets are achieved, all stakeholders will be informed. The results of this work will help develop a picture of the disease situation in the Southern Edge Area.
The Vaccinating East Sussex Badgers (VESBA) project began in 2021 and has funding for 5 years. This is a large-scale badger vaccination project undertaken from within the farming community across approximately 250km2 in the endemic TB area in the original HRA section of East Sussex. The findings of this over the next 5 years will help guide future control methods for deploying other vaccination schemes in the future and farmers should be encouraged to participate.
There are several measures, to help address the most common risk pathways for TB infection in East Sussex. These include:
- increased uptake of badger vaccination
- improving on-farm biosecurity measures to reduce transmission - this can be achieved by simple measures such as raising of water troughs, wildlife proofing feed stores and reducing nose-to-nose contact
- taking advantage of the free advice available to cattle farmers in the Edge Area from the TB Advisory Service (TBAS) to help evaluate and improve on-farm biosecurity measures
- stronger messaging to farmers to encourage informed purchase practices of cattle, encouraging farmers to avoid purchase of cattle from herds with a history of TB - available tools such as the interactive mapping tool ibTB can be used by farmers to inform purchasing decisions
- continued deployment of mandatory IFN-y testing in OTF-W incidents to reduce risk of recurrence
Appendix 1: Cattle industry demographics
Table 1: Number of cattle premises by size band in East Sussex at 1 January 2021 (RADAR data)
| Size of herds | Number of herds in East Sussex |
|---|---|
| Undetermined | 4 |
| 1-50 | 297 |
| 51-100 | 90 |
| 101-200 | 64 |
| 201-350 | 27 |
| 351-500 | 11 |
| 501+ | 11 |
| Total number of herds | 504 |
| Mean herd size | 85 |
| Median herd size | 40 |
Table 2: Number (and percentage of total) animals by breed purpose in East Sussex at 1 January 2021
| Breed purpose | Number (and percentage of total) cattle in East Sussex |
|---|---|
| Beef | 28,498 (67%) |
| Dairy | 12,093 (28%) |
| Dual purpose | 1,386 (3%) |
| Unknown | 4 |
| Total | 41,981 |
Appendix 2: Summary of headline cattle TB statistics
Table 3: Herd-level summary statistics for TB in cattle in East Sussex between 2019 and 2021
| Herd-level statistics | 2019 | 2020 | 2021 |
|---|---|---|---|
| (a) Total number of cattle herds live on Sam at the end of the reporting period | 626 | 632 | 586 |
| (b) Total number of whole herd skin tests carried out at any time in the period | 615 | 674 | 592 |
| (c) Total number of OTF cattle herds having TB whole herd tests during the period for any reason | 524 | 493 | 476 |
| (d) Total number of OTF cattle herds at the end of the report period (herds not under any type of Notice Prohibiting the Movement of Bovine Animals (TB02) restrictions) | 597 | 599 | 563 |
| (e) Total number of cattle herds that were not under restrictions due to an ongoing TB incident at the end of the report period | 610 | 615 | 573 |
| (f.1) Total number of new OTF-S TB incidents detected in cattle herds during the report period (including all Finishing Units) | 19 | 29 | 23 |
| (f.2) Total number of new OTF-W TB incidents detected in cattle herds during the report period (including all Finishing Units) | 4 | 12 | 4 |
| (g.1) Of the new OTF-W herd incidents, how many can be considered the result of movement, purchase or contact from or with an existing incident based on current evidence? | 0 | 3 | 1 |
| (g.2) Of the new OTF-W herd incidents, how many were triggered by skin test Reactors or 2xIRs at routine herd tests? | 1 | 2 | 0 |
| (g.3) Of the new OTF-W herd incidents, how many were triggered by skin test Reactors or 2xIRs at other TB test types (such as forward and back-tracings, contiguous or check tests)? | 1 | 8 | 2 |
| (g.4) Of the new OTF-W herd incidents, how many were first detected through routine slaughterhouse TB surveillance? | 0 | 2 | 2 |
| (h.1) Number of new OTF-W incidents revealed by enhanced TB surveillance (radial testing) conducted around those OTF-W herds | 5 | 1 | 3 |
| (h.2) Number of new OTF-S incidents revealed by enhanced TB surveillance (radial testing) conducted around those OTF-W herds | 1 | 6 | 2 |
| (i) Number of OTF-W herds still open at the end of the period (including any ongoing OTF-W incidents that began in a previous reporting period, but not including non-grazing Approved Finishing Units | 4 | 7 | 3 |
| (j) New confirmed (positive M. bovis culture) incidents in non-bovine species detected during the report period (indicate host species involved) | 0 | 1 (meerkat) | 0 |
| (k.1) Number of grazing approved finishing units active at end of the period | 0 | 0 | 0 |
| (k.2) Number of non-grazing approved finishing units active at end of the period | 1 | 1 | 1 |
| (k.3) Number of grazing exempt finishing units active at end of the period | 0 | 0 | 0 |
| (k.4) Number of non-grazing exempt finishing units active at end of the period | 2 | 2 | 2 |
Table 4: Animal-level summary statistics for TB in cattle in East Sussex between 2019 and 2021
| Animal-level statistics | 2019 | 2020 | 2021 |
|---|---|---|---|
| (a) Total number of cattle tested in the period (animal tests) | 75,704 | 79,543 | 65,875 |
| (b.1) Reactors detected by tuberculin skin tests during the year | 78 | 128 | 65 |
| (b.2) Reactors detected by additional IFN-γ blood tests (skin-test negative or IR animals) during the year | 134 | 94 | 83 |
| (c) Reactors detected during year per incidents disclosed during year | 9.2 | 5.4 | 5.5 |
| (d) Reactors per 1,000 animal tests | 2.8 | 2.8 | 2.2 |
| (e.1) Additional animals slaughtered during the year for TB control reasons (dangerous contacts, including any first time IRs) | 10 | 15 | 15 |
| (e.2) Additional animals slaughtered during the year for TB control reasons (private slaughters) | 12 | 8 | 7 |
| (f) SLH cases (tuberculous carcases) reported by Food Standards Agency (FSA) during routine meat inspection | 4 | 9 | 3 |
| (g) SLH cases confirmed by culture of M. bovis | 0 | 2 | 3 |
Note (c) Reactors detected during year per incidents disclosed during year, reactors may be from incidents disclosed in earlier years, as any found through testing during the report year count here.
Note (g) SLH cases confirmed by culture of M. bovis, not all incidents reported are submitted for culture analysis. All incidents reported are from any period prior to or during restrictions.
Appendix 3: Suspected sources of M. bovis infection for all the new OTF-W and OTF-S incidents identified in the report period
Each TB incident could have up to 3 potential risk pathways identified. Each risk pathway is given a score that reflects the likelihood of that pathway bringing TB into the herd. The score is recorded as either definite (score 8), most likely (score 6), likely (score 4) or possible (score 1). The sources for each incident are weighted by the certainty ascribed. Any combination of definite, most likely, likely, or possible can contribute towards the overall picture for possible routes of introduction into a herd. If the overall score for a herd is less than 6, then the score is made up to 6 using the ‘Other/Unknown Source’ option.
Buffering up to 6 in this way helps to reflect the uncertainty in assessments where only ‘likely’ or ‘possible’ sources are identified.
Table 5 combines the data from multiple herds and provides the proportion of pathways in which each source was identified, weighted by the certainty that each source caused the introduction of TB. The output does not show the proportion of herds where each pathway was identified (this is skewed by the certainty calculation). WGS of M. bovis isolates can be a powerful tool in identifying a likely source of infection, however WGS clades are not determined for OTF-S herds. As a result of varying levels of uncertainty, only broad generalisations should be made from these data. A more detailed description of this methodology is provided in the Explanatory supplement for the annual reports 2021.
Table 5: Suspected sources of M. bovis infection for all new OTF-W and OTF-S incidents identified in East Sussex, in 2021
| Source of infection | Possible (1) | Likely (4) | Most likely (6) | Definite (8) | Weighted contribution |
|---|---|---|---|---|---|
| Badgers | 19 | 6 | 3 | 0 | 32.5% |
| Cattle movements | 13 | 4 | 2 | 0 | 19.8% |
| Contiguous | 5 | 0 | 0 | 0 | 3.2% |
| Residual cattle infection | 1 | 2 | 5 | 0 | 18.1% |
| Domestic animals | 0 | 0 | 0 | 0 | 0.0% |
| Non-specific reactor | 0 | 0 | 0 | 0 | 0.0% |
| Fomites | 1 | 0 | 0 | 0 | 0.7% |
| Other wildlife | 2 | 0 | 0 | 0 | 1.3% |
| Other or unknown source | 8 | 0 | 0 | 0 | 24.4% |
Please note that each TB incident could have up to 3 potential pathways so totals may not equate to the number of actual incidents that have occurred.