Derbyshire (edge area) year end report 2021
Updated 16 February 2023

© Crown copyright 2023
This publication is licensed under the terms of the Open Government Licence v3.0 except where otherwise stated. To view this licence, visit nationalarchives.gov.uk/doc/open-government-licence/version/3 or write to the Information Policy Team, The National Archives, Kew, London TW9 4DU, or email: psi@nationalarchives.gov.uk.
Where we have identified any third party copyright information you will need to obtain permission from the copyright holders concerned.
This publication is available at https://www.gov.uk/government/publications/bovine-tb-epidemiology-reports-2021/derbyshire-edge-area-year-end-report-2021
Introduction
The Edge Area was originally established in 2013. In 2014, the bovine tuberculosis (TB) surveillance strategy for this area was incorporated into the UK Government’s Strategy to achieve Officially Bovine Tuberculosis-Free (OTF) status for England by 2038. A key action was to recognise the different levels of TB in different parts of the country and to vary the approach to control accordingly. The aim is to obtain OTF status for the Edge Area as soon as possible.
From January 2018, cattle herds in the south-west of Derbyshire have routinely undergone TB surveillance every six months, while cattle herds in the north and east of the county are tested annually.
This report describes the frequency and geographical distribution of TB in 2021 in cattle herds in Derbyshire, which forms part of the Edge Area. It examines what factors are likely to be driving TB in this area, and the risks the disease in this county may pose to neighbouring areas.
County map of England showing the Edge Area and highlighting the county of Derbyshire.
TB in cattle and other mammals is primarily caused by the bacterium Mycobacterium bovis (M. bovis), and the disease is subsequently referred to in this report as TB. Although other sources may refer to TB ‘breakdowns’, this report will use the term ‘incidents’ throughout.
This report is intended for individuals involved in the control of TB, both locally and nationally. This includes, but is not limited to farmers, veterinarians, policy makers and the scientific community.
Details of the data handling methodology used in this report, a glossary of terms, and the TB control measures adopted in the Edge Area, can be found in the explanatory supplement for the annual reports 2021.
Types of TB incident
Unless otherwise specified, this report includes all new TB incidents detected during the reporting period. This includes ‘Officially Tuberculosis-Free Status Withdrawn’ (OTF-W) incidents and ‘Officially Tuberculosis-Free Status Suspended’ (OTF-S) incidents.
OTF-W incidents are those involving one or more test reactors with typical lesions of TB identified at post-mortem meat inspection, or one or more animals with M. bovis- positive culture results from tissue samples, or both.
OTF-S incidents are triggered by reactors to the Single Intradermal Comparative Cervical Tuberculin (SICCT) test, but without subsequent detection of TB lesions or positive culture results from tissue samples collected from carcases during the PM inspection, or both.
TB incidents in non-grazing Approved Finishing Units (AFUs) are not included in the prevalence and incidence calculations in this report due to the limited epidemiological impact of these cases.
Furthermore, herds restricted because of an overdue test rather than a TB incident are also excluded from calculations. Hence measures of incidence and prevalence in this report may be lower than those reported in the official TB statistics.
Cattle industry
Appendix 1, Table 1 provides cattle industry demographics in Derbyshire, where cattle herd size varies, the highest proportion being small herds of up to 50 cattle. The predominant cattle enterprise in Derbyshire are suckler and fattening beef herds, though there is a significant proportion of medium to large dairy herds mostly situated in the south and west of the county, as shown in Appendix 1, Table 2. In 2021, there was one newly licensed non-grazing Approved Finishing Unit (AFU), taking the total number of AFUs in Derbyshire to 14. There were 3 Exempt Finishing Units (EFUs) in the county in 2021, for the fattening of cattle from six-monthly and annually tested herds that had not been pre- movement tested for TB. This was a reduction from 6 in 2020. In 2021, there was one livestock market in Bakewell, Derbyshire.
New TB incidents
There were 115 new TB incidents in 2021 compared to 147 in 2020, as shown in Figure 1. This represents a decline to 2019 levels after a significant rise seen in 2020. A reduction in new OTF-W incidents occurred in 2021 (79 in 2020 to 63 in 2021). This continues the gradually reducing trend from a recent high of 84 OTF-W TB incidents in 2018.
Figure 1: Annual number of new TB incidents in Derbyshire, from 2012 to 2022, showing incidents for the whole county and the original Edge Area.

For 2021 there were 63 OTF-W incidents and 52 OTF-S incidents for the whole county. In the original Edge area of the county there were 11 OTF-W and 7 OTF-S incidents.
Figure 2 provides the annual incidence rate in Derbyshire for all new incidents. Derbyshire had the fifth highest incidence of TB per 100 herd-years at risk (8.6) out of the 11 Edge Area counties in 2021. This was slightly below the Edge Area overall (8.9). TB incidence per 100 herd-years at risk decreased in the whole county in 2021, from 10.7 in 2020 to 8.6 in 2021. This decline in TB incidence in 2021 followed a period of persistent increase since 2014 (7.0).
Figure 2: Annual incidence rate (per 100 herd-years at risk) for all new incidents (OTF-W and OTF- S) in Derbyshire, from 2012 to 2021, showing incidents for the whole county and the original Edge Area.

For 2021 the incidence rate was 8.6 incidents per 100 herd-years at risk for the whole county, and 5.1 incidents per 100 herd-years at risk for the original Edge Area of the county.
Derbyshire was originally divided between 2 TB risk areas: High Risk Area (HRA) in the west, mid and south, and Edge Area in the north and east. The whole of Derbyshire was re-classified as an Edge Area county in January 2018. Herds in the original HRA part of the county undergo routine surveillance TB testing every 6 months, whilst herds in the original Edge Area part of the county are routinely tested annually. Herds within the six- monthly surveillance testing area of Derbyshire that meet certain criteria and thus are identified as having a lower risk of TB incursion, can benefit from “earned recognition” whereby they are tested annually.
In 2021, 32% (544 of 1,674) of cattle herds in Derbyshire qualified for earned recognition. Keepers should continue to strive for earned recognition, not just to reduce the personal burden of surveillance TB testing, but also to reduce disease incidence county-wide.
There were no reports of TB incidents in Derbyshire occurring in non-bovine species during 2021.
Prevalence of TB
Figure 3 shows the annual end of year prevalence in Derbyshire. A fluctuating pattern has been observed in the herd prevalence over the past 10 years. In 2021, end-of-year prevalence for the whole county of Derbyshire declined to 4.3%, from 5.9% in 2020. This may be due to a combination of factors but is most likely due to the reduction in OTF-W incidents, which normally have a longer duration.
Figure 3: Annual end of year prevalence in Derbyshire, from 2012 to 2021, showing incidents for the whole county and the original Edge Area.

Line chart showing the year-end TB herd prevalence in Derbyshire between 2012 and 2021. For 2021 this was 4.30% for the whole county and 2.31% for the original Edge Area of the county.
Geographical distribution of TB incidents
As in 2020, TB incidents in Derbyshire in 2021 were concentrated in the original HRA in the south and west of the county, mirroring the higher density of cattle holdings in these areas, as shown in Figure 4.
Figure 4: Location of cattle holdings in Derbyshire with new TB incidents (OTF-W and OTF-S) in 2021 and cattle holdings with pre-2021 OTF-W incidents still ongoing at the beginning of 2021, overlaid on a cattle density map. Note that ‘OTF-W Introduced 2021’ refers to OTF-W incidents in which cattle movements were the most likely source of infection.
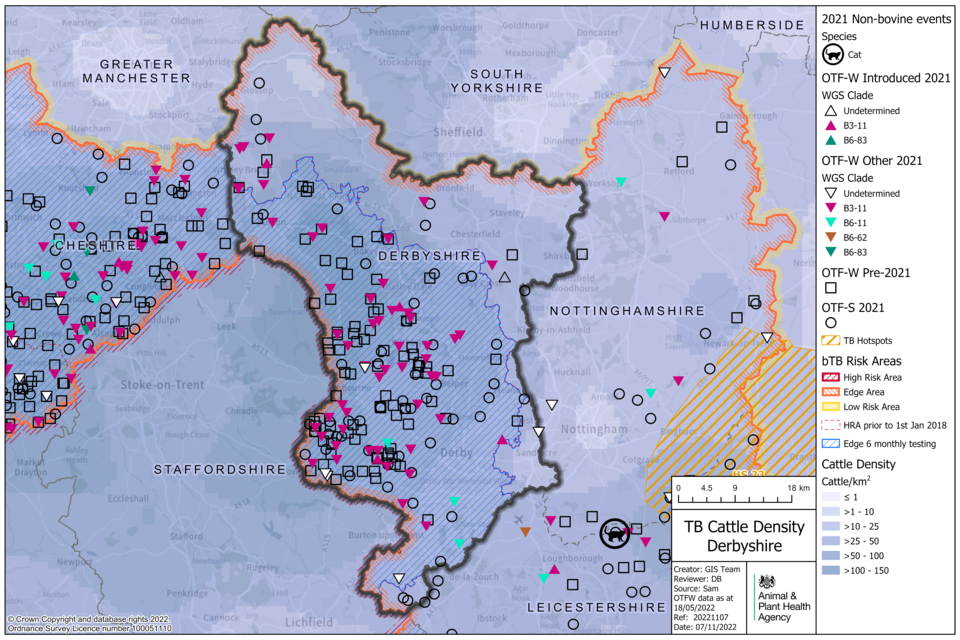
TB incidents in Derbyshire in 2021 were concentrated in areas with a higher density of cattle holdings, in the south and west of the county.
Of concern are multiple OTF-W incidents surrounding Bakewell in the north central area of Derbyshire (annual testing), close to South Yorkshire in the Low Risk Area (LRA). These OTF-W incidents have seen a large proportion of infected cattle removed, with a high number of animals with visible lesions of TB at post-mortem inspection.
In terms of weighted contribution to the risk pathways of infection for TB incident herds, Figure 5 shows infected badgers were a source of TB infection for 56% of the new TB incidents in Derbyshire in 2021, where a veterinary investigation and disease report form (DRF) could be completed.
Figure 5: Map of the source of infection pathway recorded with the highest level of certainty, for all TB incidents (OTF-W and OTF-S) in Derbyshire that started in 2021. Local cattle refers to both residual infection and contiguous cattle risk pathways. Purchased refers to all cattle movement risk pathways. Wildlife refers to both badger and other wildlife risk pathways. Where none of the sources were identified with greater than 50% certainty, the highest ranking source is displayed with an OTF-W undetermined ‘maximum DRF category’ symbol.
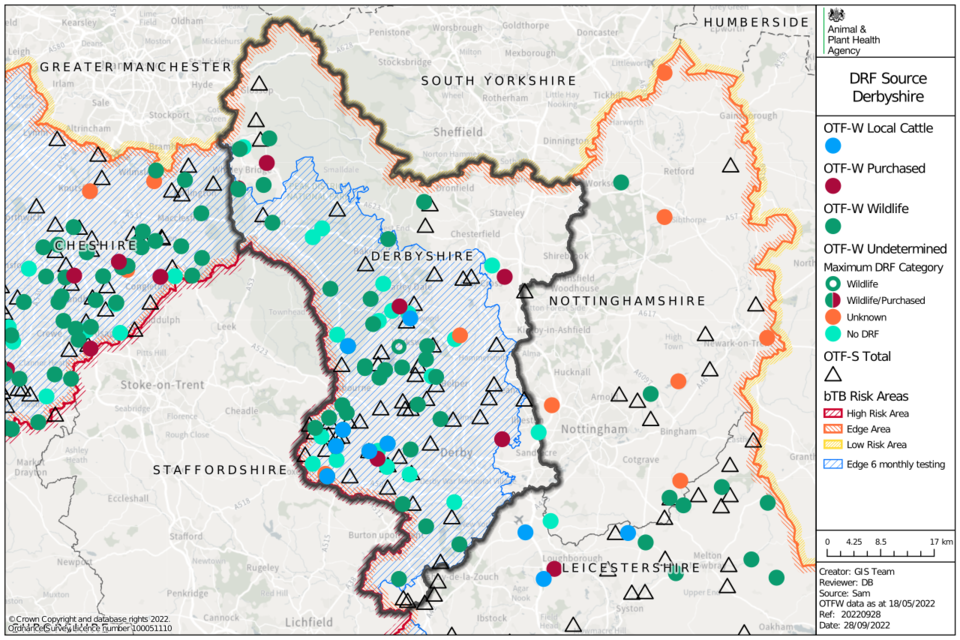
Map of Derbyshire showing data points of OTF-W as circles, and OTF-S as triangles. Colour is used to denote whether the source is from local cattle, purchased, wildlife or is undetermined.
Figure 6 shows Whole Genome Sequence (WGS) clade B3-11 was the predominant M. bovis isolate where a wildlife source was attributed with high certainty.
Figure 6: WGS clades of M. bovis detected in Derbyshire between 2018 and 2021, where wildlife sources were attributed with a 75% certainty or above according to the DRF calculation, as an indication of local M. bovis reservoir in local wildlife populations (OTF-W incidents only).
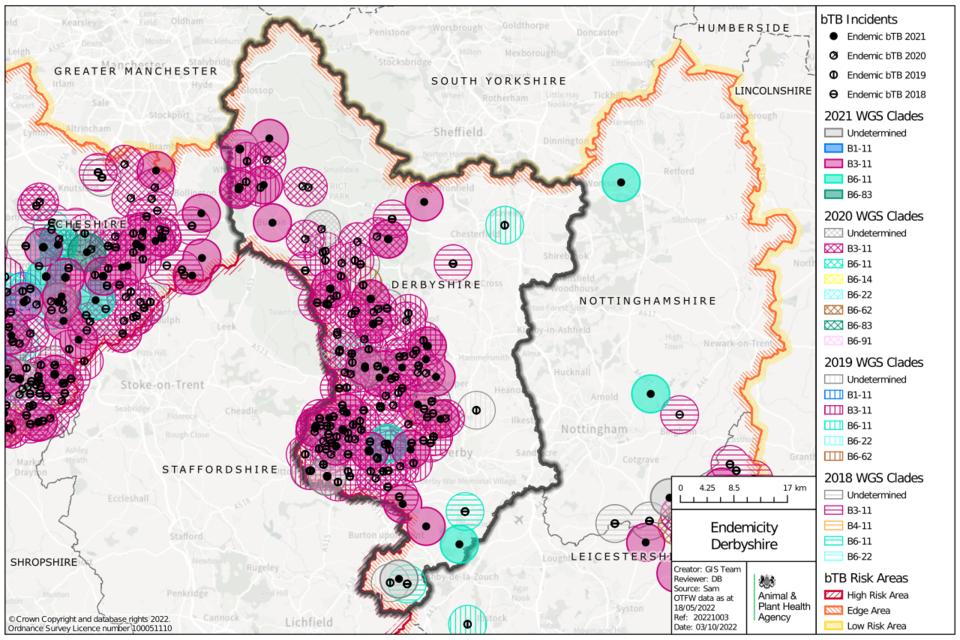
Map of Derbyshire showing locations of possible wildlife reservoirs of TB as points, between 2018 and 2021. Circles surrounding the points are coloured by TB WGS clade and year.
Previous annual reports refer to spoligotypes or genotypes; there has been no change in the predominant strain of M. bovis found in Derbyshire (WGS clade B3-11, genotype 25:a). Stable clusters of WGS clades tend to be found in areas where there is a persistent local reservoir of infection, as shown in Figure 7.
Figure 7: WGS clades of M. bovis identified in herds with OTF-W incidents in Derbyshire that began in 2021 (n=58).

Pie chart showing the proportion of M. bovis WGS clades isolated in Derbyshire in 2021. Isolated WGS clades were B3-11 (95%), and B6-11 (5%). n=58.
Badger disease control in the form of culling continued for a second year of operations in the county. Derbyshire had the largest licensed area for vaccination of badgers, and also vaccinated the greatest number of badgers (244) of all counties. This is an increase from 186 vaccinated in 2020.
Skin test reactors and interferon gamma test positive animals removed
Appendix 2 provides a summary of headline cattle TB statistics in Derbyshire. More interferon gamma (IFN-γ) blood test positive cattle were removed (614) in TB incidents than skin test reactors (515), also shown in Figure 8.
Figure 8: Number of skin test reactors and IFN-γ test positive cattle removed by APHA for TB control reasons in Derbyshire, from 2012 to 2021.
| Year | Skin test reactors | Interferon gamma reactors | Total |
|---|---|---|---|
| 2012 | 740 | 81 | 821 |
| 2013 | 488 | 65 | 553 |
| 2014 | 333 | 79 | 412 |
| 2015 | 367 | 64 | 431 |
| 2016 | 431 | 29 | 460 |
| 2017 | 625 | 47 | 672 |
| 2018 | 673 | 559 | 1232 |
| 2019 | 678 | 612 | 1290 |
| 2020 | 692 | 534 | 1226 |
| 2021 | 515 | 614 | 1129 |
Whilst the sensitivity of IFN-γ testing is greater than skin testing, disclosing more infected cattle per incident; many more skin tests than IFN-γ tests were performed, resulting in a similar number of cattle removed by test type.
The TB skin test, by its nature, has an increased risk of variation in both performance of the test and interpretation of the results. APHA continues to quality assure the delivery of TB skin testing by official veterinarians to maximise disclosure within infected herds.
Main risk pathways and key drivers for TB infection
The main risk pathways and key drivers for TB infection within Derbyshire are considered here. Evidence collected during APHA veterinary investigations into the source of infection within herds is used to inform this understanding. In 2021, 79 out of 115 (69%) of new TB incidents in Derbyshire received a preliminary or final APHA veterinary investigation to identify the source of infection.
It can be challenging to retrospectively establish the route of infection for a TB incident herd. Ideally this investigation includes a thorough on-farm investigation and scrutiny of routinely collected data; such as cattle movement records, and the results of WGS where available. Up to 3 hazards and risk pathways are selected for each incident investigated.
Each of these potential sources are given a score that reflects the likelihood of that pathway being the true one, based on the available evidence.
Details of the protocol used for these investigations, and the subsequent methodology used to calculate the weighted contribution of the different suspected sources of M. bovis infection can be found in the explanatory supplement to the annual reports 2021.
The key drivers of the TB epidemic in Derbyshire during 2021 were as follows:
- exposure to probable infected badgers
- purchase of undetected infected cattle
- residual infection from previous incidents
Figure 9 presents the aggregated results of the APHA investigations into the source of infection. Further details are presented in Appendix 3, Table 5. The main risk pathways and key drivers for TB infection identified in Derbyshire remain unchanged since 2020.
Figure 9: Summary of the weighted source of infection pathways attributed for OTF-W and OTF-S TB incidents that started in 2021 in Derbyshire, that had a completed DRF (n=79).

Sources attributed were badgers (56%), cattle movement (13%), contiguous infection (3%), residual infection (12%), non-specific reactor (1%), fomite source (<1%), other wildlife source (4%), and other or unknown source (11%), n=79.
Badgers provided a weighted contribution of approximately 56% of all risk pathways for TB incidents in 2021. The frequency of genotype 25:a (clade B3-11) within incidents attributed to wildlife is an indication of local infection, including wildlife.
Cattle movement is the second most important driver of the TB epidemic in Derbyshire, contributing to 13% of risk pathways. The use of livestock markets in the neighbouring HRA counties leads to a risk of disease dissemination to Derbyshire via the movement of cattle with undetected infection. There is a common misconception that an animal that has passed the skin test poses no TB risk. Purchasing decisions are thus made without taking heed of the imperfect sensitivity of the test.
Residual infection in herds causing recurrence of TB is the third most important driver, accounting for 12% of all risk pathways. Residual infection refers to the presence of animals in a herd which harbour infection which was not fully eradicated by testing and removal of reactors during a previous herd incident.
Other or unknown sources of infection had a weighted contribution of 11%. This category is added to herds where there was high uncertainty around the selected pathways. See the explanatory supplement for details of the methodology used.
Forward look
The 2014 Strategy for achieving Official Bovine Tuberculosis Free Status for England set out a target to reduce herd prevalence to below 1% overall in the Edge Area by 2025.
Based on current information, this is not conceivable for Derbyshire by 2025.
Derbyshire is achieving a reduction in TB incidents. However, the explosive nature of multiple OTF-W incidents in the north of the annual surveillance testing part of the county attributed to wildlife is of concern.
Practical measures that would help address the main risk pathways for TB infection in Derbyshire include:
- incentivising the uptake of effective biosecurity measures
- increasing awareness of the imperfect sensitivity of the TB skin test - approximately one in five TB-infected cattle are not identified by a single round of testing; a pre-movement TB skin test with negative results does not guarantee freedom from infection, therefore, statutory TB movement testing should be used in combination with other methods when screening cattle to purchase, such as assessing the frequency of TB herd incidents in the area of origin of the incoming cattle through ibTB
- encouraging informed cattle trading
- the reduction of disease pressure from wildlife sources
Appendix 1: Cattle industry demographics
Table 1: Number of cattle premises by size band in Derbyshire at 1 January 2021 (RADAR data)
| Size of herds | Number of herds in Derbyshire |
|---|---|
| Undetermined | 29 |
| 1-50 | 696 |
| 51-100 | 264 |
| 101-200 | 248 |
| 201-350 | 136 |
| 351-500 | 71 |
| 501+ | 44 |
| Total number of herds | 1,488 |
| Mean herd size | 110 |
| Median herd size | 54 |
Table 2: Number (and percentage of total) of animals by breed purpose in Derbyshire at 1 January 2021
| Breed purpose | Number (and percentage of total) cattle in Derbyshire |
|---|---|
| Beef | 90,929 (55%) |
| Dairy | 66,644 (40%) |
| Dual purpose | 6,643 (4%) |
| Unknown | 2 |
| Total | 164,218 |
Appendix 2: Summary of headline cattle TB statistics
Table 3: Herd-level summary statistics for TB in cattle in Derbyshire between 2019 and 2021
| Herd-level statistics | 2019 | 2020 | 2021 |
|---|---|---|---|
| (a) Total number of cattle herds live on Sam at the end of the reporting period | 1,740 | 1,737 | 1,642 |
| (b) Total number of whole herd skin tests carried out at any time in the period | 2,362 | 2,258 | 2,268 |
| (c) Total number of OTF cattle herds having TB whole herd tests during the period for any reason | 1,444 | 1,428 | 1,429 |
| (d) Total number of OTF cattle herds at the end of the report period (herds not under any type of Notice Prohibiting the Movement of Bovine Animals (TB02) restrictions) | 1,609 | 1,542 | 1,508 |
| (e) Total number of cattle herds that were not under restrictions due to an ongoing TB incident at the end of the report period | 1,655 | 1,632 | 1,569 |
| (f.1) Total number of new OTF-S TB incidents detected in cattle herds during the report period (including all Finishing Units) | 33 | 68 | 52 |
| (f.2) Total number of new OTF-W TB incidents detected in cattle herds during the report period (including all Finishing Units) | 81 | 79 | 63 |
| (g.1) Of the new OTF-W herd incidents, how many can be considered the result of movement, purchase or contact from or with an existing incident based on current evidence? | 11 | 18 | 11 |
| (g.2) Of the new OTF-W herd incidents, how many were triggered by skin test Reactors or 2x inconclusive reactors (IRs) at routine herd tests? | 39 | 57 | 31 |
| (g.3) Of the new OTF-W herd incidents, how many were triggered by skin test Reactors or 2xIRs at other TB test types (such as forward and back-tracings, contiguous or check tests)? | 32 | 15 | 23 |
| (g.4) Of the new OTF-W herd incidents, how many were first detected through routine slaughterhouse (SLH) TB surveillance? | 10 | 6 | 9 |
| (h.1) Number of new OTF-W incidents revealed by enhanced TB surveillance (radial testing) conducted around those OTF-W herds | 3 | 4 | 1 |
| (h.2) Number of new OTF-S incidents revealed by enhanced TB surveillance (radial testing) conducted around those OTF-W herds | 4 | 2 | 4 |
| (i) Number of OTF-W herds still open at the end of the period (including any ongoing OTF-W incidents that began in a previous reporting period, but not including non-grazing Approved Finishing Units) | 64 | 60 | 40 |
| (j) New confirmed (positive M. bovis culture) incidents in non-bovine species detected during the report period (indicate host species involved) | 0 | 0 | 0 |
| (k.1) Number of grazing approved finishing units active at end of the period | 0 | 0 | 0 |
| (k.2) Number of non-grazing approved finishing units active at end of the period | 12 | 13 | 13 |
| (k.3) Number of grazing exempt finishing units active at end of the period | 2 | 2 | 2 |
| (k.4) Number of non-grazing exempt finishing units active at end of the period | 4 | 4 | 4 |
Table 4: Animal-level summary statistics for TB in cattle in Derbyshire between 2019 and 2021
| Animal-level statistics | 2019 | 2020 | 2021 |
|---|---|---|---|
| (a) Total number of cattle tested in the period (animal tests) | 327,748 | 314,947 | 320,187 |
| (b.1) Reactors detected by tuberculin skin tests during the year | 678 | 692 | 515 |
| (b.2) Reactors detected by additional IFN-γ blood tests (skin-test negative or IR animals) during the year | 612 | 534 | 614 |
| (c) Reactors detected during year per incidents disclosed during year | 11.3 | 8.3 | 9.8 |
| (d) Reactors per 1,000 animal tests | 3.9 | 3.9 | 3.5 |
| (e.1) Additional animals slaughtered during the year for TB control reasons (dangerous contacts, including any first time IRs) | 12 | 9 | 26 |
| (e.2) Additional animals slaughtered during the year for TB control reasons (private slaughters) | 12 | 14 | 3 |
| (f) SLH cases (tuberculous carcases) reported by Food Standards Agency (FSA) during routine meat inspection | 25 | 14 | 25 |
| (g) SLH cases confirmed by culture of M. bovis | 11 | 6 | 12 |
Note (c) Reactors detected during year per incidents disclosed during year, reactors may be from incidents disclosed in earlier years, as any found through testing during the report year count here.
Note (g) SLH cases confirmed by culture of M. bovis, not all cases reported are submitted for culture analysis. All cases reported are from any period prior to or during restrictions.
Appendix 3: Suspected sources of M. bovis infection for all the new OTF-W and OTF-S incidents identified in the report period
Each TB incident could have up to 3 potential risk pathways identified. Each risk pathway is given a score that reflects the likelihood of that pathway bringing TB into the herd. The score is recorded as either definite (score 8), most likely (score 6), likely (score 4) or possible (score 1). The sources for each incident are weighted by the certainty ascribed. Any combination of definite, most likely, likely, or possible can contribute towards the overall picture for possible routes of introduction into a herd. If the overall score for a herd is less than 6, then the score is made up to 6 using the ‘Other/Unknown Source’ option.
Buffering up to 6 in this way helps to reflect the uncertainty in assessments where only ‘likely’ or ‘possible’ sources are identified.
Table 5 combines the data from multiple herds and provides the proportion of pathways in which each source was identified, weighted by the certainty that each source caused the introduction of TB. The output does not show the proportion of herds where each pathway was identified (this is skewed by the certainty calculation). WGS of M. bovis isolates can be a powerful tool in identifying a likely source of infection, however WGS clades are not determined for OTF-S herds. As a result of varying levels of uncertainty, only broad generalisations should be made from these data. A more detailed description of this methodology is provided in the Explanatory supplement for the annual reports 2021.
Table 5: Suspected sources of M. bovis infection for all new OTF-W and OTF-S incidents identified in Derbyshire, in 2021
| Source of infection | Possible (1) | Likely (4) | Most likely (6) | Definite (8) | Weighted contribution |
|---|---|---|---|---|---|
| Badgers | 32 | 38 | 33 | 1 | 56.2% |
| Cattle movements | 10 | 6 | 9 | 0 | 12.8% |
| Contiguous | 6 | 2 | 2 | 0 | 3.3% |
| Residual cattle infection | 12 | 7 | 9 | 0 | 12.1% |
| Domestic animals | 0 | 0 | 0 | 0 | 0.0% |
| Non-specific reactor | 3 | 0 | 0 | 0 | 0.5% |
| Fomites | 2 | 0 | 0 | 0 | 0.4% |
| Other wildlife | 10 | 2 | 1 | 0 | 3.6% |
| Other or unknown source | 3 | 0 | 0 | 0 | 11.1% |
Please note that each TB incident could have up to 3 potential pathways so totals may not equate to the number of actual incidents that have occurred.