Cheshire (edge area) year end report 2021
Updated 16 February 2023

© Crown copyright 2023
This publication is licensed under the terms of the Open Government Licence v3.0 except where otherwise stated. To view this licence, visit nationalarchives.gov.uk/doc/open-government-licence/version/3 or write to the Information Policy Team, The National Archives, Kew, London TW9 4DU, or email: psi@nationalarchives.gov.uk.
Where we have identified any third party copyright information you will need to obtain permission from the copyright holders concerned.
This publication is available at https://www.gov.uk/government/publications/bovine-tb-epidemiology-reports-2021/cheshire-edge-area-year-end-report-2021
Introduction
The Edge Area was originally established in 2013. In 2014, the bovine tuberculosis (TB) surveillance strategy for this area was incorporated into the UK Government’s Strategy to achieve Officially Bovine Tuberculosis-Free (OTF) status for England by 2038. A key action was to recognise the different levels of TB in different parts of the country and to vary the approach to control accordingly. The aim is to obtain OTF status for the Edge Area as soon as possible.
This report describes the frequency and geographical distribution of TB in 2021 in cattle herds in Cheshire, which forms part of the Edge Area. It examines what factors are likely to be driving TB in this area, and the risks the disease in this county may pose to neighbouring areas.
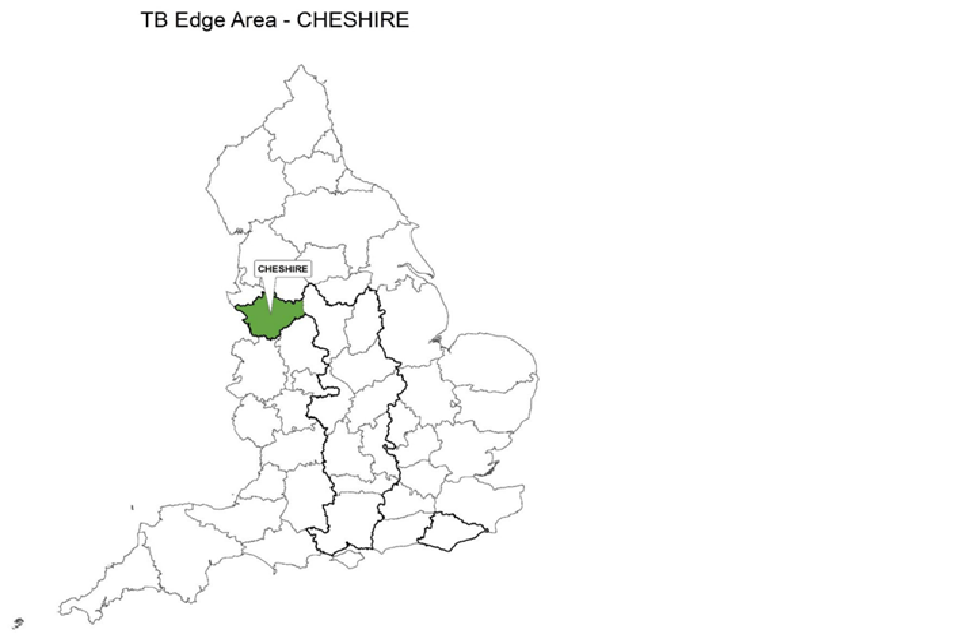
County map of England showing the Edge Area and highlighting the county of Cheshire.
TB in cattle and other mammals is primarily caused by the bacterium Mycobacterium bovis (M. bovis), and the disease is subsequently referred to in this report as TB. Although other sources may refer to TB ‘breakdowns’, this report will use the term ‘incidents’ throughout.
This report is intended for individuals involved in the control of TB, both locally and nationally. This includes, but is not limited to farmers, veterinarians, policy makers and the scientific community.
Details of the data handling methodology used in this report, a glossary of terms, and the TB control measures adopted in the Edge Area, can be found in the explanatory supplement for the annual reports 2021.
Types of TB incident
Unless otherwise specified, this report includes all new TB incidents detected during the reporting period. This includes ‘Officially Tuberculosis-Free Status Withdrawn’ (OTF-W) incidents and ‘Officially Tuberculosis-Free Status Suspended’ (OTF-S) incidents.
OTF-W incidents are those involving one or more test reactors with typical lesions of TB identified at post-mortem meat inspection, or one or more animals with M. bovis- positive culture results from tissue samples collected from carcases during the post-mortem inspection, or both.
OTF-S incidents are triggered by reactors to the Single Intradermal Comparative Cervical Tuberculin (SICCT) test, but without subsequent detection of TB lesions or positive culture results in any of those animals.
TB incidents in Approved Finishing Units (AFUs) without grazing are not included in the prevalence and incidence calculations in this report due to the limited epidemiological impact of these incidents.
Furthermore, herds restricted because of an overdue test rather than a TB incident are also excluded from calculations. Hence measures of incidence and prevalence in this report may be lower than those reported in the official TB statistics.
Cattle industry
Cheshire is predominantly a dairy county with some beef fattener and suckler herds of varying sizes, calf rearers, smallholders and pet cattle. Of all the cattle herds in the county, 52% contained up to 100 animals and 9% had over 500 animals, as shown in Appendix 1. The total number of cattle herds in Cheshire has reduced by 6% since 2019, as indicated in Appendix 2.
There are no livestock markets or common land in Cheshire. There were 33 AFUs without grazing in 2021, which was similar to 2020. There was only one remaining Exempt Finishing Unit (EFU) for the fattening of cattle from 6-monthly and annually tested herds that had not been pre-movement tested for TB.
Cattle herds in Cheshire undergo routine TB surveillance testing every 6 months by default. However 35% of cattle herds were eligible for less frequent (annual) testing under the earned recognition scheme in 2021.
New TB incidents
The number of new TB incidents decreased by 12% in 2021, from 160 in 2020 to 141 in 2021 (Figure 1). This was mainly due to a 16% drop in new OTF-W incidents (down from 86 in 2020, to 72 in 2021).
The majority of this decrease was seen in the original High Risk Area (HRA) portion (the southern third) of the county, where there was a 33% decrease in the number of OTF-W incidents alone, with a 6% increase in OTF-S incidents. This is likely to be a result of the control measures involved in the removal of infected cattle and a reduction in the badger population, leading to reduced environmental contamination with TB.
Whole Genome Sequencing (WGS) clade B6-83 of M. bovis (which includes genotype 22:a ) became more prevalent in some areas of the county in 2021.
Figure 1: Annual number of new TB incidents in Cheshire, from 2012 to 2021, showing incidents for the whole county and the original Edge Area.

There were 72 OTF-W incidents and 69 OTF-S incidents for the whole county. In the original Edge area of the county there were 52 OTF-W and 52 OTF-S incidents.
In 2021, 79% of the total number of new TB incidents occurred in dairy herds (71% OTF-W incidents and 87% OTF-S incidents). Beef fattener herds (excluding AFUs) and beef suckler herds each accounted for 11% of all new TB incidents, as indicated in Figure 2.
Herds with 201 or more cattle were responsible for 71% of all new incidents compared to herds of 200 or fewer cattle (29%) (see Figure 2). Herds of 201 or more cattle were 2.4 times more likely to sustain a TB incident than herds of 200 or fewer cattle and many of these larger herds will be dairy.
This is similar to the findings in 2020, and reflects the fact that larger dairy herds are more likely to have a TB incident as there are fewer large beef herds in Cheshire (see Appendix 1). Additionally, dairy cattle will remain on farm longer than beef fattening cattle. As a result they may be exposed to potentially contaminated pasture and badger latrines more often than intensively reared beef fattening herds. By contrast, intensively reared beef fattening herds tend to stay indoors and consume preserved forage and concentrates.
This finding is consistent with herd size and cattle production type being risk factors for TB in Cheshire. The majority of larger herds are dairy.
Figure 2: Number of new TB incidents (OTF-W and OTF-S) in Cheshire in 2021, by cattle herd size and type.

Herd size: 1-50: 5 OTF-W, 4 -S; 51-100: 13 OTF-W, 2 -S; 101-200: 8 OTF-W, 9 -S; 201-350: 17 OTF-W, 21 -S; 351-500: 10 OTF-W, 17 -S; 501+: 19 OTF-W, 16 -S. Herd type: beef suckler: 12 OTF-W, 3 -S; beef fattener: 9 -W, 6 OTF-S; dairy 51 OTF-W, 60 -S.
Unusual TB incidents
During 2021 there were a total of 8 incidents which were classed as chronic (under movement restrictions for longer than 12 months). Five of these incidents became persistent (whereby herds were under movement restrictions for more than 550 days), triggering enhanced management procedures.
Four of these were on dairy farms and one was in a beef herd. Risk pathways for these incidents listed ongoing exposure to TB at grazing from infected local wildlife (either badgers or wild deer) as the most likely reason for the persistence of infection in these herds. One of the persistent incidents also had issues with long delays between short interval tests and this is likely to have been a contributing factor.
TB in other species
Cats
There was an incident of M. bovis infection in a domestic cat approximately 3 to 5 years old that became unwell with multiple clinical signs in Autumn 2020. This incident was also included in the 2020 report. Histopathology of an eye lesion was highly suggestive of mycobacterial infection. Subsequent private interferon gamma (IFN-γ) blood test results were strongly indicative of a highly pathogenic mycobacterial infection. The cat was euthanised and following a post-mortem examination, lung lesions consistent with TB were found and M. bovis was isolated by bacteriological culture in 2021. The isolatye was confirmed to be WGS clade B3-11 of M. bovis (which includes genotype 25:a), the most prevalent clade in Cheshire.
Epidemiological investigations by the APHA case veterinarian identified direct or indirect contact with infected badgers as a likely source, and direct or indirect contact with infected cattle as a possible source, although there have been no recent identified TB incidents in cattle in that location.
Alpacas
A serious TB incident in an alpaca herd that was disclosed in 2020 ended in June 2021, and there were no further incidents of M. bovis infection confirmed in this or any other camelid herds in Cheshire in 2021.
Deer
No incidents of M. bovis infection in deer were reported in 2021. However, there have been increasing numbers of farmers reporting sightings of wild deer, mainly in the east of the county and some in very large numbers. One farmer reported seeing 161 red deer on one of his fields.
There is evidence that deer can be a reservoir of M. bovis in fairly localised settings and transmit it to other deer and cattle. However, there is uncertainty regarding the relative importance of transmission routes and the degree of M. bovis excretion. A small proportion (2%) of the weighted risk pathways for incidents in Cheshire in 2021 listed ‘other wildlife’ (wild deer) as a possible source.
If TB is suspected in a wild deer carcase it must be reported to APHA. However, it is likely that concern regarding the consequences of reporting the suspicion of disease results in under reporting and the true prevalence of TB in wild deer in Cheshire is unknown.
Incidence of TB
Cheshire had the fourth highest incidence of TB per 100-herd years at risk out of the 11 Edge Area counties (12.7). This was higher than the overall figure for the Edge Area (8.9), however this was the second consecutive year in which the incidence rate decreased in Cheshire, as shown in Figure 3.
Figure 3: Annual incidence rate (per 100 herd-years at risk) for all new incidents (OTF-W and OTF- S) in Cheshire, from 2012 to 2021, showing incidents for the whole county and the original Edge Area.

For 2021 the incidence rate was 12.7 incidents per 100 herd-years at risk for the whole county, and 11.1 incidents per 100 herd-years at risk for the original Edge Area of the county.
Prevalence of TB
Herd prevalence has been decreasing since 2017, in both the whole county and original Edge Area of Cheshire and this trend continued in 2021 (down to 5.1%, see Figure 4). This represents a decrease of 40% from a herd prevalence of 8.5% recorded in 2017. This may be influenced by reduced levels of wildlife and residual cattle infection.
A number of factors may have contributed to this, such as
- the badger TB control measures
- increased awareness of herd biosecurity
- increased knowledge of TB transmission routes (private vets, APHA advice, TB Hub, TB Advisory Service visits)
- more sensitive testing of herds affected by TB incidents
- compliance with TB control measures with prompt removal of infected cattle
There are likely to be multifactorial reasons for the decrease.
Figure 4: Annual end of year prevalence in Cheshire, from 2012 to 2021, showing incidents for the whole county and the original Edge Area.

Line chart showing the year-end TB herd prevalence in Cheshire between 2012 and 2021. For 2021 this was 5.06% for the whole county and 4.16% for the original Edge Area of the county.
There was a peak in number of new incidents detected in November, which would have resulted in more herds remaining under restrictions (and hence a higher herd prevalence) at the end of the year (see Figure 5). Disclosure of reactors appeared to be related to the seasonality of OTF cattle herd testing (Figure 6), but it is also possible that weather conditions may have increased potential cattle-badger interactions.
Autumn 2021 was mild and relatively dry, so many cattle were out grazing much later in the year than usual. In addition, a heatwave during the summer of 2021 may also have contributed by increasing cattle-badger interactions. Cattle would have had less grass available at pasture and consequently been more likely to graze areas potentially contaminated by badger excreta. Furthermore, interactions at water sources may have also increased.
Figure 5: Number of new TB incidents (OTF-W and OTF-S) in Cheshire in 2021, by month of disclosure.
| Month | OTF-W incidents | OTF-S incidents | Total |
|---|---|---|---|
| January | 9 | 8 | 17 |
| February | 11 | 5 | 16 |
| March | 7 | 8 | 15 |
| April | 7 | 8 | 15 |
| May | 2 | 3 | 5 |
| June | 10 | 6 | 16 |
| July | 8 | 8 | 16 |
| August | 2 | 0 | 2 |
| September | 2 | 3 | 5 |
| October | 3 | 5 | 8 |
| November | 9 | 8 | 17 |
| December | 2 | 7 | 9 |
Figure 6: Number of tests undertaken in OTF herds in Cheshire in 2021, by month.
| Month | Number of tests |
|---|---|
| January | 27733 |
| February | 26997 |
| March | 28578 |
| April | 22445 |
| May | 17298 |
| June | 20102 |
| July | 19019 |
| August | 16210 |
| September | 17458 |
| October | 24537 |
| November | 28085 |
| December | 19356 |
The mean duration of all incidents ending in 2021 was 248 days for OTF-W incidents, a 21% decrease compared to 2020, and 173 days for OTF-S incidents, a decrease of 0.6% compared to 2020. The median duration of OTF-W incidents was 200 days, which is a drop of 14% compared to 2020. Only 5 of the TB incidents that were still open at the end of 2021 were classed as persistent (lasting over 550 days) compared to 9 in 2020.
These results suggest that overall, the duration of TB incidents is continuing to decrease in Cheshire compared to previous years. Continued use of the IFN-γ blood test to supplement the skin test in herds with recurrent OTF-W incidents helps to maximise the detection of infected animals. Other factors may include timely, meticulous tuberculin skin testing and increased herd biosecurity compared to previous years.
Specifically, earlier identification of infected cattle through six-monthly surveillance testing is likely to decrease the rate of cattle-to-cattle transmission within herds. Badger TB control measures may result in reduction of potential environmental contamination with M. bovis, as well as greater awareness of areas of on farm biosecurity and risk of contact with TB-infected wildlife.
There were no perceived delays to TB testing as a result of COVID-19 or the highly pathogenic avian influenza (HPAI) outbreak as larger volumes of testing took place in the autumn and winter, as would be expected.
Geographical distribution of TB incidents
Figure 7 shows the location of cattle holdings in Cheshire with new TB incidents (OTF-W and OTF-S) in 2021 and cattle holdings with previous OTF-W incidents that were still ongoing at the beginning of 2021, overlaid on a cattle density map.
New incidents were concentrated in the south and east of the county, as in previous years, correlating with high cattle density. There has been a reduction in new incidents in the south-west of the county near the Shropshire and Welsh borders compared to 2020.
Towards the north and the north-west of the county both the cattle density and number of new OTF-W incidents were much lower and there has been a reduction in new incidents in central Cheshire compared to 2020.
Incidents remained evenly divided between OTF-W and OTF-S across the county as they were in 2020. OTF-W incidents ongoing from previous years seemed to be concentrated in the centre and along the southern border of Cheshire (Figure 7).
Figure 7: Location of cattle holdings in Cheshire with new TB incidents (OTF-W and OTF-S) in 2021 and cattle holdings with pre-2021 OTF-W incidents still ongoing at the beginning of 2021, overlaid on a cattle density map. Note that ‘OTF-W Introduced 2021’ refers to OTF-W incidents in which cattle movements were the most likely source of infection.
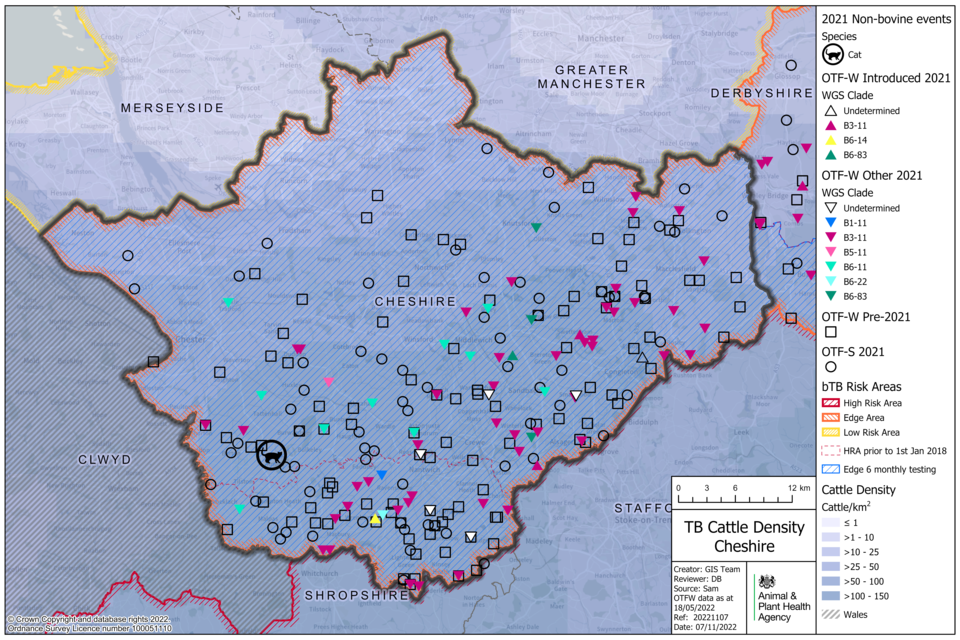
New incidents in 2021 were concentrated in the south and east of Cheshire, which correlated with the highest cattle density areas.
In Cheshire, 7 different WGS clades were isolated in 2021 (Figure 8). WGS clade B3-11 was the predominant strain of M. bovis. This clade includes all isolates of spoligotype 25 including genotype 25:a, which were detected in previous years.
Figure 8: WGS clades of M. bovis identified in herds with OTF-W incidents in Cheshire that began in 2021 (n=66).

Pie chart showing the proportion of M. bovis WGS clades isolated in Cheshire in 2021. Isolated WGS clades were B3-11 (73%), B5-11 (1%), B6-11 (15%), B6-14 (2%), B6-22 (2%), B6-83 (6%), B1-11 (1%). n=66.
Incidents in eastern Cheshire were restricted to WGS clade B3-11, whilst elsewhere in the county clades were more diverse (Figure 7).
The distribution of WGS clade B6-11, which includes the Cheshire isolates of genotype 17:a, was similar to 2020 extending from the south-west towards central Cheshire.
The cluster of WGS clade B6-22, which in this area contains solely isolates of this subset of genotype 9:d, located to the south of Nantwich in 2020 almost disappeared in 2021.
Prior to 2020, several herds were infected with both genotype 9:d and 25:a, either during the same or different incidents. As there were no cattle movements linking these herds (Figure 9) it was considered that both genotypes were endemic within the badger population in this area. However, as only one positive isolate per breakdown routinely undergoes genetic typing, this may not be the only possibility.
Low numbers of WGS clade B1-11 (which includes genotype 35) continue to be disclosed in the south-west of the county (Figure 7).
Figure 9: Map of the source of infection pathway recorded with the highest level of certainty, for all TB incidents (OTF-W and OTF-S) in Cheshire that started in 2021. Local cattle refer to residual infection and contiguous cattle risk pathways. Purchased refers to cattle movement risk pathways. Wildlife refers to both badger and other wildlife risk pathways. Where none of the sources of infection were identified with greater than 50% certainty, the highest ranking source is displayed with an OTF-W undetermined ‘maximum DRF (damage report form) category’ symbol.
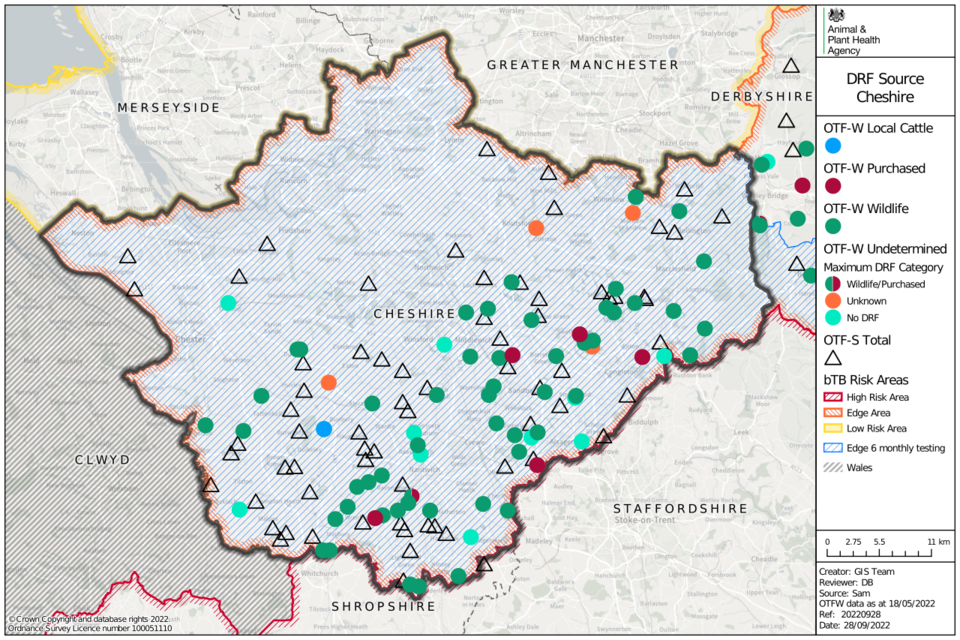
Map of Cheshire showing data points of OTF-W as circles, and OTF-S as triangles. Colour is used to denote whether the source is from local cattle, purchased, wildlife or is undetermined.
A potential new cluster of incidents with WGS clade B6-83 (which contains genotypes 9:c, 9:d and 22:a) has appeared along the M6 corridor centrally around Holmes Chapel, as shown in Figure 7 and Figure 10.
This clade has an extensive home range extending north through the border counties of England and Wales from the Severn Estuary to south-west Shropshire. In 2020, there was an incident of B6-83 to the north-west of Holmes Chapel. The risk pathways identified local badgers as the most likely source although other sources could not be ruled out.
In 2021, 4 further B6-83 incidents were disclosed in this localised area. Two within 2.5 miles of the 2020 incident. Risk pathways indicated infected badgers as most likely for one incident and cattle movements as most likely for the other. The other two B6-83 incidents were approximately 5 miles away, one to the north and one to the south. Risk pathways for these listed badgers as a likely source, but with some uncertainty due to the out of home range WGS. It is possible that this WGS clade is also now present within the local badger population.
Figure 10: WGS clades of M. bovis detected in Cheshire between 2018 and 2021, where wildlife sources were attributed with a 75% certainty or above according to the DRF calculation, as an indication of local M. bovis reservoir in local wildlife populations (OTF-W incidents only).
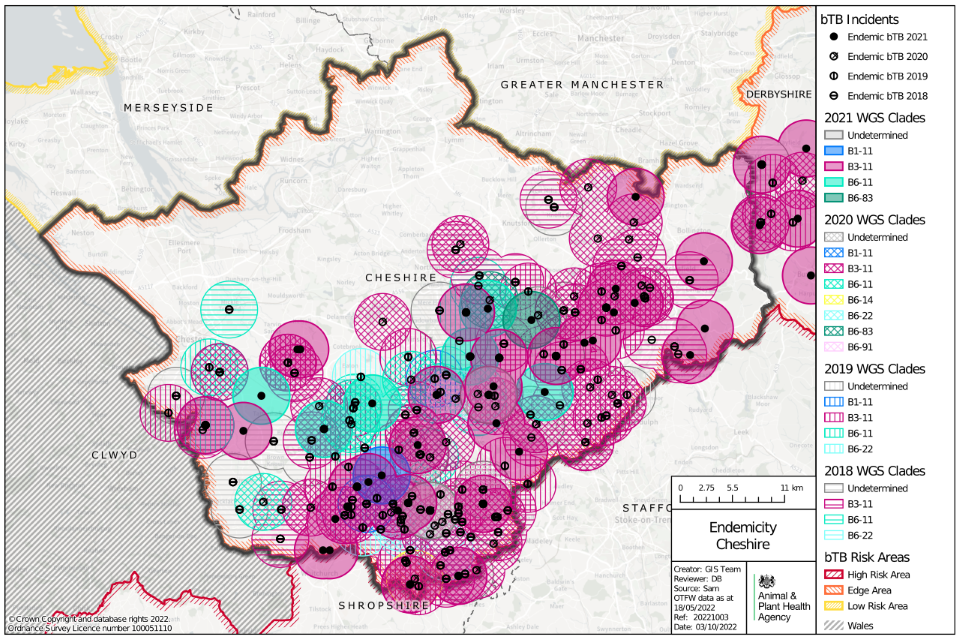
Map of Cheshire showing locations of possible wildlife reservoirs of TB as points, between 2018 and 2021. Circles surrounding the points are coloured by TB WGS clade and year.
Endemic infection in local badger populations remains a transmission risk to cattle herds. However, from Figure 10 there does appear to be a contraction of the endemic area since 2018. This is encouraging and is likely to be as a result of the badger TB control measures, enhanced cattle TB testing regimes and an increased awareness of biosecurity.
In 2021 part of the county had already undergone 4 years of culling and began Supplementary Badger Control, with a further part of the county entering its third year of badger control. The target number of badgers were removed from both areas, as described in the summary of 2021 badger control operations.
In 2021, 232 badgers were vaccinated in Cheshire over 45.7km 2 , which is an increase of 19% from 2020 when 195 badgers were vaccinated over a similar area. The total land area of Cheshire is 2081.7km2.
Main risk pathways and key drivers for TB infection
The main risk pathways and key drivers for TB infection within Cheshire are considered here using evidence collected during APHA veterinary investigations into the source of infection within herds. In 2021, 120 out of 141 (85%) of new TB incidents in Cheshire received a preliminary or final APHA veterinary investigation to identify the source of infection.
It can be challenging to retrospectively establish the route of infection for a TB incident herd. Ideally this investigation includes a thorough on-farm investigation and scrutiny of routinely collected data; such as cattle movement records, and the results of WGS where available. Up to 3 hazards and risk pathways were selected for each incident investigated. Each of these potential sources are given a score that reflects the likelihood of that pathway being the true one, based on the available evidence.
Details of the protocol used for these investigations, and the subsequent methodology used to calculate the weighted contribution of the different suspected sources of M. bovis infection can be found in the explanatory supplement to the annual reports 2021.
The key drivers of the TB epidemic in Cheshire in 2021 were identified as:
- exposure to probable infected badgers
- purchase of cattle with undetected infection
- residual infection from previous incidents
Figure 11 presents the aggregated results of the APHA investigations into the source of infection. Further details are presented in Appendix 3, Table 5.
As shown in Figure 11, badgers provided a weighted contribution of approximately 67% of all risk pathways in 2021. Badgers are still considered to be an important reservoir of infection in Cheshire. Progress in the reduction of new incidents needs to continue by reducing the risk of transmission from local badger populations through licensed badger culling and increasing the use of badger vaccination. Deer sightings are also becoming more common in parts of east Cheshire and may be sources of infection in a small number of incidents. However, no carcasses with suspected TB infection in wild deer have been submitted in Cheshire in 2021.
Movement of cattle with undetected infection was the second most important driver of the TB epidemic in Cheshire in 2021, contributing to 11% of risk pathways (see Figure 11). In 2021 a greater percentage of weighted source pathways were attributed to movements of infected cattle than for 2020 (8% in 2020) and this may be due to the effects of COVID-19 and travel restrictions between countries. Farmers may have sourced cattle either from within or near to Cheshire instead of importing animals from lower risk countries in 2021. Continued vigilance is required to reduce the number of cattle movements from the HRA and to encourage purchases from the Low Risk Area (LRA) where possible, using tools such as the ibTB online mapping tool, and encouraging farmers to ask about the source risk of TB.
Residual infection in herds causing recurrence of TB was the third most selected risk pathway overall (9%) (see Figure 11). Residual infection in cattle remained similar to 2020. This can be difficult to assess where the WGS clade or genotype is local, there is suspected infected wildlife, or where local cattle purchases have been made. The continued use of IFN-γ blood testing is useful for reducing the amount of residual infection in herds and its wider mandatory use, other than for recurrent, chronic, and persistent OTF-W incidents, would be recommended to avoid increasing the cattle reservoir of infection.
Other or unknown sources of infection had a weighted contribution of 9% in Cheshire in 2021 (see Figure 11). This category was added to herds where there was high uncertainty around the selected pathways. See the explanatory supplement for details of the methodology used.
Figure 11: Summary of the weighted source of infection pathways attributed for OTF-W and OTF-S TB incidents that started in 2021 in Cheshire, that had a completed DRF (n= 120).

Sources attributed were badgers (67%), cattle movement (11%), contiguous infection (2%), residual infection (9%), fomite source (1%), other wildlife source (2%), and other or unknown source (9%), n=120.
Forward look
The ratio of OTF-W to OTF-S incidents continued to reduce in 2021, from the high of 68% OTF-W in 2018 down to 51% during 2021. This likely indicates a lower burden of infection. Although the whole county incidence rate (12.7) and prevalence (5.1%) continued to decrease in 2021, OTF county status will not be achieved by 2025.
There was a 19% decrease in the number of skin test reactors and a 5% decrease in IFN- γ test positives compared to 2020. Since 2017, there has been a 45% reduction in the number of skin test reactors and 39% decrease in the number of IFN-γ test positives.
Regular liaison meetings between local TB eradication stakeholders should be encouraged to engage with all interested parties to ultimately reduce the burden of disease in Cheshire.
There are several measures that will help to address the most common risk pathways for TB infection in Cheshire. These include:
- badger TB control measures to reduce the risk of transmission to cattle
- expansion of badger vaccination
- six-monthly herd testing in higher risk herds to enable earlier detection of disease within herds
- IFN-γ blood testing in OTF-W herds
- to encourage use of TB Advisory Service (visits, badger sett surveys and advice)
- to increase awareness of biosecurity within and between farms through use of the TB Hub, APHA visits, TB Advisory Service
- wild animal surveillance
Appendix 1: Cattle industry demographics
Table 1: Number of cattle premises by size band in Cheshire at 1 January 2021 (RADAR data)
| Size of herds | Number of herds in Cheshire |
|---|---|
| Undetermined | 27 |
| 1-50 | 475 |
| 51-100 | 181 |
| 101-200 | 194 |
| 201-350 | 182 |
| 351-500 | 98 |
| 501+ | 110 |
| Total number of herds | 1,267 |
| Mean herd size | 185 |
| Median herd size | 82 |
Table 2: Number (and percentage of total) of animals by breed purpose in Cheshire at 1 January 2021
| Breed purpose | Number (and percentage of total) cattle in Cheshire |
|---|---|
| Beef | 59,696 (25%) |
| Dairy | 161,932 (69%) |
| Dual purpose | 12,378 (5%) |
| Unknown | 1 |
| Total | 234,007 |
Appendix 2: Summary of headline cattle TB statistics
Table 3: Herd-level summary statistics for TB in cattle in Cheshire between 2019 and 2021
| Herd-level statistics | 2019 | 2020 | 2021 |
|---|---|---|---|
| (a) Total number of cattle herds live on Sam at the end of the reporting period | 1,527 | 1,519 | 1,436 |
| (b) Total number of whole herd skin tests carried out at any time in the period | 2,324 | 2,158 | 2,177 |
| (c) Total number of OTF cattle herds having TB whole herd tests during the period for any reason | 1,242 | 1,178 | 1,204 |
| (d) Total number of OTF cattle herds at the end of the report period (herds not under any type of Notice Prohibiting the Movement of Bovine Animals (TB02) restrictions) | 1,344 | 1,331 | 1,285 |
| (e) Total number of cattle herds that were not under restrictions due to an ongoing TB incident at the end of the report period | 1,405 | 1,412 | 1,354 |
| (f.1) Total number of new OTF-S TB incidents detected in cattle herds during the report period (including all Finishing Units) | 55 | 74 | 69 |
| (f.2) Total number of new OTF-W TB incidents detected in cattle herds during the report period (including all Finishing Units) | 113 | 86 | 72 |
| (g.1) Of the new OTF-W herd incidents, how many can be considered the result of movement, purchase or contact from or with an existing incident based on current evidence? | 9 | 5 | 0 |
| (g.2) Of the new OTF-W herd incidents, how many were triggered by skin test Reactors or 2xIRs at routine herd tests? | 82 | 45 | 44 |
| (g.3) Of the new OTF-W herd incidents, how many were triggered by skin test Reactors or 2xIRs at other TB test types (such as forward and back-tracings, contiguous or check tests)? | 10 | 28 | 10 |
| (g.4) Of the new OTF-W herd incidents, how many were first detected through routine slaughterhouse TB surveillance? | 20 | 12 | 19 |
| (h.1) Number of new OTF-W incidents revealed by enhanced TB surveillance (radial testing) conducted around those OTF-W herds | 0 | 0 | 0 |
| (h.2) Number of new OTF-S incidents revealed by enhanced TB surveillance (radial testing) conducted around those OTF-W herds | 0 | 0 | 0 |
| (i) Number of OTF-W herds still open at the end of the period (including any ongoing OTF-W incidents that began in a previous reporting period, but not including non-grazing Approved Finishing Units) | 91 | 63 | 39 |
| (j) New confirmed (positive M. bovis culture) incidents in non-bovine species detected during the report period (indicate host species involved) | 0 | 2 | 1 |
| (k.1) Number of grazing approved finishing units active at end of the period | 0 | 0 | 0 |
| (k.2) Number of non-grazing approved finishing units active at end of the period | 28 | 32 | 34 |
| (k.3) Number of grazing exempt finishing units active at end of the period | 2 | 0 | 1 |
| (k.4) Number of non-grazing exempt finishing units active at end of the period | 2 | 2 | 0 |
Table 4: Animal-level summary statistics for TB in cattle in Cheshire between 2019 and 2021
| Animal-level statistics | 2019 | 2020 | 2021 |
|---|---|---|---|
| (a) Total number of cattle tested in the period (animal tests) | 568,209 | 520,140 | 499,937 |
| (b.1) Reactors detected by tuberculin skin tests during the year | 979 | 850 | 688 |
| (b.2) Reactors detected by additional IFN-γ blood tests (skin-test negative or IR animals) during the year | 1,080 | 526 | 499 |
| (c) Reactors detected during year per incidents disclosed during year | 12.3 | 8.6 | 8.4 |
| (d) Reactors per 1,000 animal tests | 3.6 | 2.6 | 2.4 |
| (e.1) Additional animals slaughtered during the year for TB control reasons (dangerous contacts, including any first time IRs) | 33 | 20 | 17 |
| (e.2) Additional animals slaughtered during the year for TB control reasons (private slaughters) | 10 | 11 | 4 |
| (f) SLH cases (tuberculous carcases) reported by Food Standards Agency (FSA) during routine meat inspection | 53 | 42 | 39 |
| (g) SLH cases confirmed by culture of M. bovis | 30 | 21 | 24 |
Note (c) Reactors detected during year per incidents disclosed during year, reactors may be from incidents disclosed in earlier years, as any found through testing during the report year count here.
Note (g) SLH cases confirmed by culture of M. bovis, not all cases reported are submitted for culture analysis. All cases reported are from any period prior to or during restrictions.
Appendix 3: Suspected sources of M. bovis infection for all the new OTF-W and OTF-S incidents identified in the report period
Each TB incident could have up to 3 potential risk pathways identified. Each risk pathway is given a score that reflects the likelihood of that pathway bringing TB into the herd. The score is recorded as either definite (score 8), most likely (score 6), likely (score 4) or possible (score 1). The source(s) for each incident are weighted by the certainty ascribed. Any combination of definite, most likely, likely, or possible can contribute towards the overall picture for possible routes of introduction into a herd. If the overall score for a herd is less than 6, then the score is made up to 6 using the ‘Other/Unknown Source’ option. Buffering up to 6 in this way helps to reflect the uncertainty in assessments where only ‘likely’ or ‘possible’ sources are identified.
Table 5 combines the data from multiple herds and provides the proportion of pathways in which each source was identified, weighted by the certainty that each source caused the introduction of TB. The output does not show the proportion of herds where each pathway was identified (this is skewed by the certainty calculation). WGS of M. bovis isolates can be a powerful tool in identifying a likely source of infection, however WGS clades are not determined for OTF-S herds. As a result of varying levels of uncertainty, only broad generalisations should be made from these data. A more detailed description of this methodology is provided in the Explanatory supplement for the annual reports 2021.
Table 5: Suspected sources of M. bovis infection for all new OTF-W and OTF-S incidents identified in Cheshire, in 2021
| Source of infection | Possible (1) | Likely (4) | Most likely (6) | Definite (8) | Weighted contribution |
|---|---|---|---|---|---|
| Badgers | 55 | 67 | 62 | 0 | 67% |
| Cattle movements | 21 | 16 | 3 | 1 | 11% |
| Contiguous | 10 | 2 | 0 | 0 | 2% |
| Residual cattle infection | 29 | 12 | 2 | 0 | 9% |
| Domestic animals | 0 | 0 | 0 | 0 | 0% |
| Non-specific reactor | 0 | 0 | 0 | 0 | 0% |
| Fomites | 8 | 0 | 0 | 0 | 1% |
| Other wildlife | 3 | 2 | 2 | 0 | 2% |
| Other or unknown source | 0 | 1 | 1 | 0 | 9% |
Please note that each TB incident could have up to three potential pathways so totals may not equate to the number of actual incidents that have occurred.