Buckinghamshire (edge area) year end report 2021
Updated 16 February 2023

© Crown copyright 2023
This publication is licensed under the terms of the Open Government Licence v3.0 except where otherwise stated. To view this licence, visit nationalarchives.gov.uk/doc/open-government-licence/version/3 or write to the Information Policy Team, The National Archives, Kew, London TW9 4DU, or email: psi@nationalarchives.gov.uk.
Where we have identified any third party copyright information you will need to obtain permission from the copyright holders concerned.
This publication is available at https://www.gov.uk/government/publications/bovine-tb-epidemiology-reports-2021/buckinghamshire-edge-area-year-end-report-2021
Introduction
The Edge Area was originally established in 2013. In 2014, the bovine tuberculosis (TB) surveillance strategy for this area was incorporated into the UK Government’s Strategy to achieve Officially Bovine Tuberculosis-Free (OTF) status for England by 2038. A key action was to recognise the different levels of TB in different parts of the country and to vary the approach to control accordingly. The aim is to obtain OTF status for the Edge Area as soon as possible.
This report describes the frequency and geographical distribution of TB in 2021 in cattle herds in Buckinghamshire, which forms part of the Edge Area. It examines what factors are likely to be driving TB in this area, and the risks the disease in this county may pose to neighbouring areas.
County map of England showing the Edge Area and highlighting the county of Buckinghamshire.
TB in cattle and other mammals is primarily caused by the bacterium Mycobacterium bovis (M. bovis), and the disease is subsequently referred to in this report as TB. Although other sources may refer to TB ‘breakdowns’, this report will use the term ‘incidents’ throughout.
This report is intended for individuals involved in the control of TB, both locally and nationally. This includes, but is not limited to farmers, veterinarians, policy makers and the scientific community.
Details of the data handling methodology used in this report, a glossary of terms, and the TB control measures adopted in the Edge Area, can be found in the explanatory supplement for the annual reports 2021.
Types of TB incident
Unless otherwise specified, this report includes all new TB incidents detected during the reporting period. This includes ‘Officially Tuberculosis-Free Status Withdrawn’ (OTF-W) incidents and ‘Officially Tuberculosis-Free Status Suspended’ (OTF-S) incidents.
OTF-W incidents are those involving one or more test reactors with typical lesions of TB identified at post-mortem meat inspection, or one or more animals with M. bovis- positive culture results from tissue samples, or both.
OTF-S incidents are triggered by reactors to the Single Intradermal Comparative Cervical Tuberculin (SICCT) test, but without subsequent detection of TB lesions or positive culture results from tissue samples collected from carcases during the PM inspection, or both.
TB incidents in non-grazing Approved Finishing Units (AFUs) are not included in the prevalence and incidence calculations in this report due to the limited epidemiological impact of these incidents.
Furthermore, herds restricted because of an overdue test rather than a TB incident are also excluded from calculations. Hence measures of incidence and prevalence in this report may be lower than those reported in the official TB statistics.
Cattle industry
Appendix 1 provides cattle industry demographics in Buckinghamshire. Beef herds are the predominant cattle enterprise in Buckinghamshire, with a large proportion of small cattle farms (fewer than 50 cattle).
Many cattle farms purchase cattle through Thame Market in Oxfordshire near the border with Buckinghamshire, channelling animals into Buckinghamshire from the Edge Area, Low Risk Area (LRA), but also from the High Risk Area (HRA) counties with more abundant cattle. No new Approved Finishing Units (AFUs) were approved in 2021 and there were a total of 7 active non-grazing AFUs in Buckinghamshire during 2021.
New TB incidents
Figure 1 shows in 2021, there was an increase in the number of new TB incidents in Buckinghamshire compared to 2020 (from 21 to 27). This was the first time the number of new TB incidents increased in Buckinghamshire since 2018.
Figure 1: Annual number of new TB incidents in Buckinghamshire, from 2012 to 2021.
| Year | OTF-W incidents | OTF-S incidents | Total |
|---|---|---|---|
| 2012 | 4 | 3 | 7 |
| 2013 | 6 | 5 | 11 |
| 2014 | 8 | 6 | 14 |
| 2015 | 6 | 7 | 13 |
| 2016 | 5 | 9 | 14 |
| 2017 | 19 | 17 | 36 |
| 2018 | 6 | 25 | 31 |
| 2019 | 12 | 15 | 27 |
| 2020 | 11 | 10 | 21 |
| 2021 | 7 | 20 | 27 |
Compared to 2020, the number of OTF-W incidents decreased by 4 in 2021 (from 11 to 7), whereas the number of OTF-S incidents doubled from 10 to 20.
Figure 2 shows beef suckler units were nearly 3 times as likely to sustain a TB incident in comparison to fattener or dairy units. This reflects the nature of the enterprise in which large numbers of cattle are purchased with a high turnover of stock to maintain the business. The largest number of TB incidents occurred in herds with between 201 to 350 cattle.
Figure 2: Number of new TB incidents (OTF-W and OTF-S) in Buckinghamshire in 2021, by cattle herd size and type.

By herd size: 1-50: 1 OTF-W, 3 OTF-S; 51-100: 5 OTF-W, 2 OTF-S; 101-200: 2 OTF-W; 201-350: 1 OTF-W, 2 OTF-S; 351-500: 1 OTF-S; 501+: 2 OTF-W. By herd type: beef suckler: 5 OTF-W, 5 OTF-S; beef fattener: 6 OTF-W, 2 OTF-S; dairy:1 OTF-S.
Figure 3 shows 33% of new TB incidents in 2021 were detected during enhanced surveillance (radial testing) of cattle herds, which is an increase on previous years.
Figure 3: Number of TB incidents (OTF-W and OTF-S) in Buckinghamshire, from 2012 to 2021, according to the surveillance methods that detected them.
| Year | New herd test | Whole herd test | Tracing test | Slaughterhouse case | Routine herd test | Radial test | Pre-movement test | Other test | 6-month test | 12-month test | Total |
|---|---|---|---|---|---|---|---|---|---|---|---|
| 2012 | 0 | 0 | 1 | 3 | 2 | 0 | 0 | 1 | 0 | 0 | 7 |
| 2013 | 0 | 4 | 0 | 1 | 2 | 0 | 1 | 1 | 2 | 0 | 11 |
| 2014 | 0 | 10 | 0 | 1 | 0 | 0 | 1 | 1 | 0 | 1 | 14 |
| 2015 | 0 | 5 | 0 | 2 | 0 | 0 | 3 | 1 | 2 | 0 | 13 |
| 2016 | 0 | 9 | 0 | 2 | 0 | 0 | 1 | 0 | 1 | 1 | 14 |
| 2017 | 0 | 28 | 1 | 1 | 0 | 0 | 4 | 1 | 0 | 1 | 36 |
| 2018 | 0 | 19 | 0 | 1 | 0 | 4 | 3 | 0 | 3 | 1 | 31 |
| 2019 | 0 | 9 | 0 | 0 | 0 | 6 | 1 | 2 | 6 | 3 | 27 |
| 2020 | 2 | 6 | 0 | 3 | 0 | 2 | 2 | 0 | 4 | 2 | 21 |
| 2021 | 0 | 10 | 0 | 2 | 0 | 9 | 1 | 0 | 3 | 2 | 27 |
Figure 4 shows the peak of new TB incidents occurred in June and July of 2021. This contrasts with the relatively low number of TB skin tests undertaken during this time shown in Figure 5. This could reflect a seasonal pattern in which new incidents result from exposure of cattle to TB infection at summer grazing or increased purchasing from the HRA and Edge Area, corresponding to availability of more grazing on farm. However, most of the TB incidents in this period were disclosed by inconclusive reactor (IR) retests and radial (RAD) tests. It is therefore likely that this pattern of test disclosure was observed due to the peak in surveillance TB testing during the spring. This could result in an increase of subsequent IR retests and radial testing during the summer months.
Figure 4: Number of new TB incidents (OTF-W and OTF-S) in Buckinghamshire in 2021, by month of disclosure.
| Month | OTF-W incidents | OTF-S incidents | Total |
|---|---|---|---|
| January | 1 | 2 | 3 |
| February | 1 | 1 | 2 |
| March | 1 | 2 | 3 |
| April | 0 | 1 | 1 |
| May | 0 | 0 | 0 |
| June | 2 | 3 | 5 |
| July | 1 | 4 | 5 |
| August | 0 | 2 | 2 |
| September | 0 | 1 | 1 |
| October | 0 | 1 | 1 |
| November | 0 | 2 | 2 |
| December | 1 | 1 | 2 |
Figure 5: Number of tests undertaken in OTF herds in Buckinghamshire in 2021, by month.
| Month | Number of tests |
|---|---|
| January | 4734 |
| February | 4381 |
| March | 4515 |
| April | 5583 |
| May | 3615 |
| June | 2895 |
| July | 1806 |
| August | 2622 |
| September | 2345 |
| October | 5671 |
| November | 6653 |
| December | 2336 |
TB in other species
The only bacteriologically confirmed incident of M. bovis infection in a non-bovine species was in an alpaca herd in the north-west of the county bordering Northamptonshire, which is also in the Edge Area. Whole Genome Sequence (WGS) clade of B6-62 (genotype 10:j) of M. bovis was isolated from visible lesions of TB found at post-mortem, in removed alpacas. This is likely to be part of a cluster of TB incidents in cattle where local spread appears to have occurred. This incident remained unresolved at the end of 2021.
Incidence of TB
Buckinghamshire had the eighth highest incidence of TB per 100 herd-years at risk (6.9) out of the 11 Edge Area counties. This was lower than the Edge Area overall (8.9). Figure 6 shows the annual incidence rate of TB (incidents per 100 herd-years at risk) in Buckinghamshire increased from 5.6 in 2020 to 6.9 in 2021, reflecting the rise in the number of incidents in 2021.
Figure 6: Annual incidence rate (per 100 herd-years at risk) for all new incidents (OTF-W and OTF- S) in Buckinghamshire, from 2012 to 2021.
| Year | TB incidence per 100 herd years at risk |
|---|---|
| 2012 | 2.2 |
| 2013 | 1.5 |
| 2014 | 2.1 |
| 2015 | 2.6 |
| 2016 | 3.0 |
| 2017 | 7.8 |
| 2018 | 6.9 |
| 2019 | 6.1 |
| 2020 | 5.6 |
| 2021 | 6.9 |
Prevalence of TB
In 2021, the end-of-year herd prevalence in Buckinghamshire decreased marginally to 3.6% in 2021, but has remained relatively stable over the past 4 years, shown in Figure 7. A higher percentage of new TB incidents were disclosed during the second half of the year.
Figure 7: Annual end of year prevalence in Buckinghamshire, from 2012 to 2021.
| Year | Proportion of herds under restriction (%) |
|---|---|
| 2012 | 0.3 |
| 2013 | 0.9 |
| 2014 | 0.7 |
| 2015 | 1.4 |
| 2016 | 0.7 |
| 2017 | 2.8 |
| 2018 | 3.9 |
| 2019 | 3.8 |
| 2020 | 4.0 |
| 2021 | 3.6 |
Geographical distribution of TB incidents
Figure 8 shows most new TB incidents in Buckinghamshire during 2021 were in the north-west of the county where there is the highest density of both cattle and cattle holdings. The geographical distribution of incidents was similar to that seen in 2020, albeit the total number of new TB incidents increased from 21 to 27.
Figure 8: Location of cattle holdings in Buckinghamshire with new TB incidents (OTF-W and OTF-S) in 2021 and cattle holdings with pre-2021 OTF-W incidents still ongoing at the beginning of 2021, overlaid on a cattle density map. Note that ‘OTF-W Introduced 2021’ refers to OTF-W incidents in which cattle movements were the most likely source of infection.
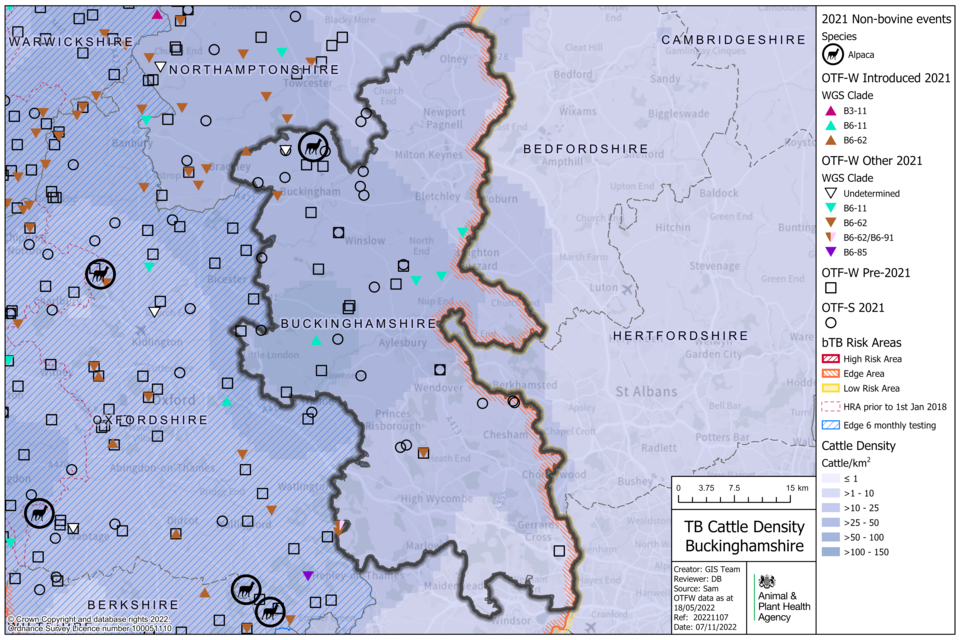
Most new TB incidents in Buckinghamshire during 2021 were in the north-west of the country where there is the highest density of both cattle and cattle holdings.
Figure 9 shows OTF-W incidents with a most likely risk pathway of infected wildlife accounted for 5 out of the 7 new OTF-W incidents disclosed in 2021. These incidents were located in the north-west (1), south (1) and east (3) of the county. Figure 8 shows of the OTF-W incidents, 4 were WGS clade B6-11 (genotypes 17:a (1) and 17:b (3)) and 2 were WGS clade B6-62 (genotype 10:a).
Figure 9: Map of the source of infection pathway recorded with the highest level of certainty, for all TB incidents (OTF-W and OTF-S) in Buckinghamshire that started in 2021. Local cattle refers to both residual infection and contiguous cattle risk pathways. Purchased refers to all cattle movement risk pathways. Wildlife refers to both badger and other wildlife risk pathways. Where none of the sources of infection were identified with greater than 50% certainty, the highest ranking source is displayed with an OTF-W undetermined ‘maximum DRF category’ symbol.
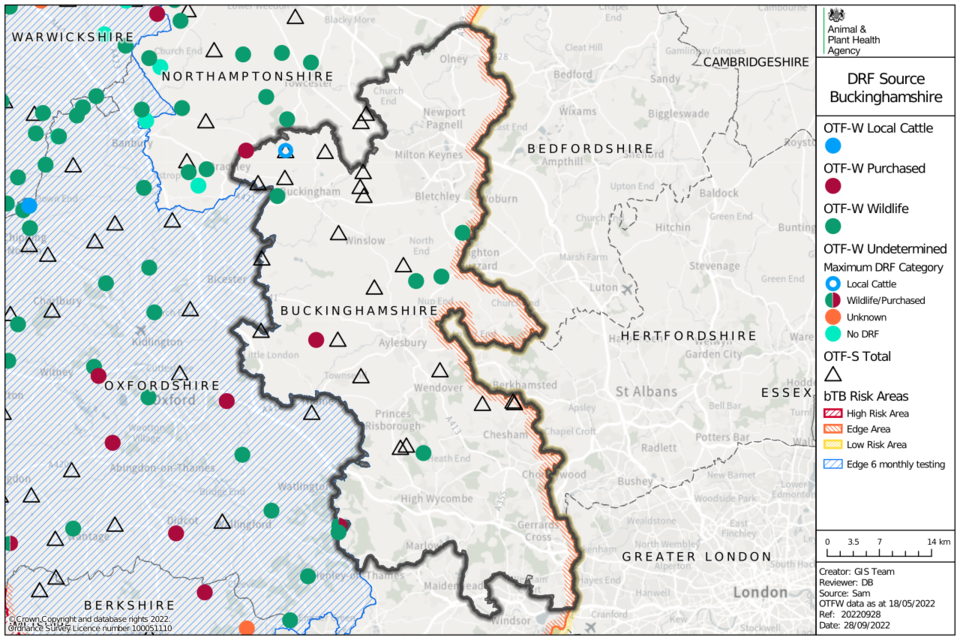
Map of Buckinghamshire showing data points of OTF-W as circles, and OTF-S as triangles. Colour is used to denote whether the source is from local cattle, purchased, wildlife or is undetermined.
A cluster of 3 new OTF-W incidents with WGS clade B6-11 (genotype 17:b) was located in the east of the county within close proximity to Leighton Buzzard, which is on the Bedfordshire (LRA) border, shown in Figure 10. In 2017, a cluster of 5 OTF-W incidents linked to genotype 17:b of M. bovis was located just to the west of the new 2021 cluster and, at the time, suggested possible wildlife infection within Buckinghamshire. There was limited evidence of any spread of infection to wildlife between 2018-2021, but this new 2021 cluster could represent a potential reservoir of infection in wildlife and further spread within the badger or wild deer population, or both.
Figure 10: WGS clades of M. bovis detected in Buckinghamshire between 2018 and 2021, where wildlife sources were attributed with a 75% certainty or above according to the DRF calculation, as an indication of local M. bovis reservoir in local wildlife populations (OTF-W incidents only).
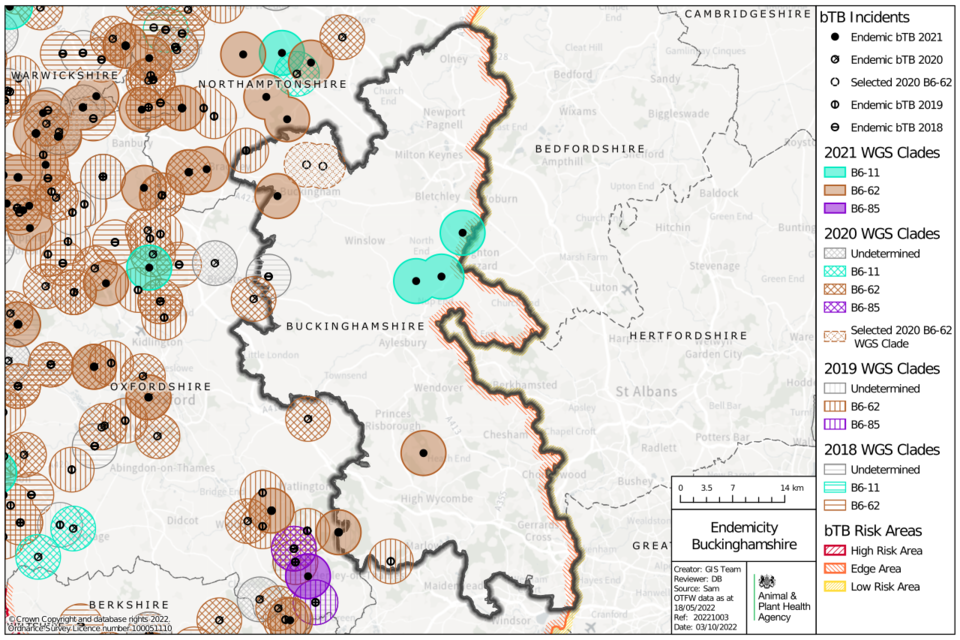
Map of Buckinghamshire showing locations of possible wildlife reservoirs of TB as points, between 2018 and 2021. Circles surrounding the points are coloured by TB WGS clade and year.
Main risk pathways and key drivers for TB infection
The main risk pathways and key drivers for TB infection within Buckinghamshire are considered here. Evidence collected during APHA veterinary investigations into the source of infection within herds is used to inform this understanding. In 2021 all 27 (100%) of new TB incidents in Buckinghamshire received a preliminary or final APHA veterinary investigation to identify the source of infection.
It can be challenging to retrospectively establish the route of infection for a TB incident herd. Ideally this investigation includes a thorough on-farm investigation and scrutiny of routinely collected data, such as cattle movement records, and the results of WGS where available. Up to 3 hazards and risk pathways are selected for each incident investigated. Each of these potential sources are given a score that reflects the likelihood of that pathway being the true one, based on the available evidence.
Details of the protocol used for these investigations, and the subsequent methodology used to calculate the weighted contribution of the different suspected sources of M. bovis infection can be found in the explanatory supplement to the annual reports 2021.
In Buckinghamshire the key drivers for infection during 2021 were identified as:
- purchase of undetected infected cattle
- exposure to probable infected local wildlife
Figure 11 presents the aggregated results of the APHA investigations into the source of infection. Further details are presented in Appendix 3, Table 5.
Figure 11: Summary of the weighted source of infection pathways attributed for OTF-W and OTF-S TB incidents that started in 2021 in Buckinghamshire, that had a completed DRF (n=27).

Sources attributed were badgers (41%), cattle movement (41%), contiguous infection (1%), residual infection (5%), fomites (1%), other wildlife source (1%), and other or unknown source (10%), n=27.
Movements of undetected infected cattle provided a weighted contribution of approximately 41% of all risk pathways. Buckinghamshire has a large beef finishing component in which farms are dependent on frequent purchases of cattle from both high cattle density and High Risk and Edge TB risk areas. This results in the potential spread of TB from the west of England.
Badgers were an equally important driver of the TB epidemic in Buckinghamshire in 2021, contributing to 41% of risk pathways. Figure 8 shows 67% (4 out of 6) of new OTF-W incidents yielded WGS clade B6-11 (one genotype 17:a and 3 17:b) of M. bovis. This may be an indication of endemic TB infection within the local wildlife population, especially in the east area of the county where a cluster of 3 incidents with WGS clade B6-11 was disclosed.
The remaining 33% of new OTF-W incidents (2 out of 6) were caused by infection with WGS clade B6-62 (genotype 10:a). These 2 incidents were either next or close to (within 15 km) the Oxfordshire border, where WGS clade B6-62 has a known homerange. This could represent possible spread of infection within the wildlife population in Oxfordshire over the county border into Buckinghamshire.
Other or unknown sources had a weighted contribution of 10%. This category is added to herds where there was high uncertainty around the selected pathways. See the explanatory supplement for details of the methodology used.
Skin test reactors and interferon gamma test positive animals removed
Appendix 2 provides a summary of headline cattle TB statistics in Buckinghamshire. A total of 160 cattle were removed from TB incidents in Buckinghamshire during 2021, of which 101 were detected by the tuberculin skin test and 59 through the IFN-γ blood test, shown in Figure 12. This is a decrease of 10 cattle since 2020, and has reduced the average number of reactors per TB incident from 8 to 7 between 2020 and 2021. The proportion of skin (63%) to IFN-γ blood (37%) test reactors remained similar to 2020.
The current testing policy requires the imposition of movement restrictions on the herd for a minimum of 4 months following the identification of a reactor (2 clear short interval tests with 60 days between each test). Just over half of TB incidents in Buckinghamshire in 2021 lasted between 6 and 7 months.
Figure 12: Number of skin test reactors and interferon IFN-γ test positive cattle removed by APHA for TB control reasons in Buckinghamshire, from 2012 to 2021.
| Year | Skin test reactors | Interferon gamma reactors | Total |
|---|---|---|---|
| 2012 | 13 | 48 | 61 |
| 2013 | 24 | 82 | 106 |
| 2014 | 36 | 60 | 96 |
| 2015 | 19 | 26 | 45 |
| 2016 | 30 | 43 | 73 |
| 2017 | 69 | 150 | 219 |
| 2018 | 92 | 191 | 283 |
| 2019 | 75 | 95 | 170 |
| 2020 | 101 | 59 | 160 |
| 2021 | 92 | 62 | 154 |
Forward look
Buckinghamshire did not achieve its target of less than 2% OTF-W herd incidence during the previous year of 2020 and this remains the case in 2021. If the practice of purchasing cattle from herds with undisclosed TB infection can be changed, Buckinghamshire could be on track to achieve the target of less than 1% OTF-W herd incidence by 2025. However, this is conditional on the introduction of effective wildlife interventions to prevent spread from Oxfordshire, and from current clusters of incidents within the county.
APHA, in collaboration with the University of Nottingham, is conducting a project to detect the presence and location of TB infection in badgers in Buckinghamshire, Oxfordshire, Berkshire, Hampshire and East Sussex - collectively known as the ‘Southern Edge Area’. Volunteers have been recruited in each county to help with the safe and timely retrieval of badger carcases. They are delivered to the University of Nottingham, where they undergo post-mortem examination and testing for the presence of TB infection by culture. Those that test positive are sent for further whole genome sequencing and clade identification (genetic strain). The project aims to collect 100 fresh, ‘found-dead’ badger carcases per county, most likely those killed in road traffic accidents (RTAs). Once 100 satisfactory carcases have been examined per county, collection will then cease in that county. Once county targets are achieved, all stakeholders will be informed. The results of this work will help develop a picture of the disease situation in the Southern Edge Area.
Further practical measures to help address the main risk pathways include:
- the use of non-grazing AFUs for cattle purchased from the HRA and other parts of the Edge Area - encourage farms to consider setting up an AFU for particular groups of purchased cattle and reduce the risk they present by preventing exposure of infected cattle to cattle on other farms and to wildlife
- to encourage implementation of effective on-farm biosecurity measures
- to incentivise ways of reducing badger to cattle interactions on farm to prevent the spread of TB from wildlife
- to encourage measures to prevent or reduce TB infection in wildlife
Appendix 1: Cattle industry demographics
Table 1: Number of cattle premises by size band in Buckinghamshire at 1 January 2021 (RADAR data)
| Size of herds | Number of herds in Buckinghamshire |
|---|---|
| Undetermined | 10 |
| 1-50 | 174 |
| 51-100 | 68 |
| 101-200 | 80 |
| 201-350 | 42 |
| 351-500 | 14 |
| 501+ | 18 |
| Total number of herds | 406 |
| Mean herd size | 122 |
| Median herd size | 56 |
Table 2: Number (and percentage of total) animals by breed purpose in Buckinghamshire at 1 January 2021
| Breed purpose | Number (and percentage of total) cattle in Buckinghamshire |
|---|---|
| Beef | 40,403 (80%) |
| Dairy | 8,954 (17%) |
| Dual purpose | 767 (1%) |
| Unknown | 0 |
| Total | 50,124 |
Appendix 2: Summary of headline cattle TB statistics
Table 3: Herd-level summary statistics for TB in cattle in Buckinghamshire between 2019 and 2021
| Herd-level statistics | 2019 | 2020 | 2021 |
|---|---|---|---|
| (a) Total number of cattle herds live on Sam at the end of the reporting period | 513 | 512 | 476 |
| (b) Total number of whole herd skin tests carried out at any time in the period | 600 | 511 | 554 |
| (c) Total number of OTF cattle herds having TB whole herd tests during the period for any reason | 423 | 399 | 400 |
| (d) Total number of OTF cattle herds at the end of the report period (herds not under any type of Notice Prohibiting the Movement of Bovine Animals (TB02) restrictions) | 473 | 468 | 438 |
| (e) Total number of cattle herds that were not under restrictions due to an ongoing TB incident at the end of the report period | 492 | 489 | 457 |
| (f.1) Total number of new OTF-S TB incidents detected in cattle herds during the report period (including all Finishing Units) | 15 | 10 | 20 |
| (f.2) Total number of new OTF-W TB incidents detected in cattle herds during the report period (including all Finishing Units) | 12 | 11 | 7 |
| (g.1) Of the new OTF-W herd incidents, how many can be considered the result of movement, purchase or contact from or with an existing incident based on current evidence? | 6 | 3 | 1 |
| (g.2) Of the new OTF-W herd incidents, how many were triggered by skin test Reactors or 2xIRs at routine herd tests? | 12 | 3 | 2 |
| (g.3) Of the new OTF-W herd incidents, how many were triggered by skin test Reactors or 2xIRs at other TB test types (such as forward and back-tracings, contiguous or check tests)? | 12 | 5 | 0 |
| (g.4) Of the new OTF-W herd incidents, how many were first detected through routine slaughterhouse (SLH) TB surveillance? | 0 | 3 | 2 |
| (h.1) Number of new OTF-W incidents revealed by enhanced TB surveillance (radial testing) conducted around those OTF-W herds | 7 | 1 | 1 |
| (h.2) Number of new OTF-S incidents revealed by enhanced TB surveillance (radial testing) conducted around those OTF-W herds | 2 | 1 | 5 |
| (i) Number of OTF-W herds still open at the end of the period (including any ongoing OTF-W incidents that began in a previous reporting period, but not including non-grazing Approved Finishing Units) | 8 | 9 | 6 |
| (j) New confirmed (positive M. bovis culture) incidents in non-bovine species detected during the report period (indicate host species involved) | 0 | 0 | 1 (alpaca) |
| (k.1) Number of grazing approved finishing units active at end of the period | 0 | 0 | 0 |
| (k.2) Number of non-grazing approved finishing units active at end of the period | 7 | 7 | 6 |
| (k.3) Number of grazing exempt finishing units active at end of the period | 0 | 0 | 0 |
| (k.4) Number of non-grazing exempt finishing units active at end of the period | 0 | 0 | 0 |
Table 4: Animal-level summary statistics for TB in cattle in Buckinghamshire between 2019 and 2021
| Animal-level statistics | 2019 | 2020 | 2021 |
|---|---|---|---|
| (a) Total number of cattle tested in the period (animal tests) | 92,392 | 73,862 | 82,938 |
| (b.1) Reactors detected by tuberculin skin tests during the year | 75 | 101 | 92 |
| (b.2) Reactors detected by additional IFN-γ blood tests (skin-test negative or IR animals) during the year | 95 | 59 | 62 |
| (c) Reactors detected during year per incidents disclosed during year | 6.3 | 7.6 | 5.7 |
| (d) Reactors per 1,000 animal tests | 1.8 | 2.2 | 1.9 |
| (e.1) Additional animals slaughtered during the year for TB control reasons (dangerous contacts, including any first time IRs) | 4 | 3 | 11 |
| (e.2) Additional animals slaughtered during the year for TB control reasons (private slaughters) | 11 | 0 | 1 |
| (f) SLH cases (tuberculous carcases) reported by Food Standards Agency (FSA) during routine meat inspection | 9 | 7 | 3 |
| (g) SLH cases confirmed by culture of M. bovis | 0 | 3 | 3 |
Note (c) Reactors detected during year per incidents disclosed during year, reactors may be from incidents disclosed in earlier years, as any found through testing during the report year count here.
Note (g) SLH cases confirmed by culture of M. bovis, not all incidents reported are submitted for culture analysis. All incidents reported are from any period prior to or during restrictions.
Appendix 3: Suspected sources of M. bovis infection for all the new OTF-W and OTF-S incidents identified in the report period
Each TB incident could have up to 3 potential risk pathways identified. Each risk pathway is given a score that reflects the likelihood of that pathway bringing TB into the herd. The score is recorded as either definite (score 8), most likely (score 6), likely (score 4) or possible (score 1). The sources for each incident are weighted by the certainty ascribed. Any combination of definite, most likely, likely, or possible can contribute towards the overall picture for possible routes of introduction into a herd. If the overall score for a herd is less than 6, then the score is made up to 6 using the ‘Other/Unknown Source’ option. Buffering up to 6 in this way helps to reflect the uncertainty in assessments where only ‘likely’ or ‘possible’ sources are identified.
Table 5 combines the data from multiple herds and provides the proportion of pathways in which each source was identified, weighted by the certainty that each source caused the introduction of TB. The output does not show the proportion of herds where each pathway was identified (this is skewed by the certainty calculation). WGS of M. bovis isolates can be a powerful tool in identifying a likely source of infection, however WGS clades are not determined for OTF-S herds. As a result of varying levels of uncertainty, only broad generalisations should be made from these data. A more detailed description of this methodology is provided in the explanatory supplement for the annual reports 2021.
Table 5: Suspected sources of M. bovis infection for all new OTF-W and OTF-S incidents identified in Buckinghamshire, in 2021
| Source of infection | Possible (1) | Likely (4) | Most likely (6) | Definite (8) | Weighted contribution |
|---|---|---|---|---|---|
| Badgers | 10 | 7 | 7 | 0 | 41.2% |
| Cattle movements | 12 | 9 | 4 | 1 | 41.4% |
| Contiguous | 1 | 0 | 0 | 0 | 0.5% |
| Residual cattle infection | 2 | 0 | 2 | 0 | 5.3% |
| Domestic animals | 0 | 0 | 0 | 0 | 0.0% |
| Non-specific reactor | 0 | 0 | 0 | 0 | 0.0% |
| Fomites | 2 | 0 | 0 | 0 | 1.2% |
| Other wildlife | 1 | 0 | 0 | 0 | 0.5% |
| Other or unknown source | 0 | 0 | 0 | 0 | 9.9% |
Please note that each TB incident could have up to 3 potential pathways so totals may not equate to the number of actual incidents that have occurred.