Berkshire (edge area) year end report 2021
Updated 16 February 2023

© Crown copyright 2023
This publication is licensed under the terms of the Open Government Licence v3.0 except where otherwise stated. To view this licence, visit nationalarchives.gov.uk/doc/open-government-licence/version/3 or write to the Information Policy Team, The National Archives, Kew, London TW9 4DU, or email: psi@nationalarchives.gov.uk.
Where we have identified any third party copyright information you will need to obtain permission from the copyright holders concerned.
This publication is available at https://www.gov.uk/government/publications/bovine-tb-epidemiology-reports-2021/berkshire-edge-area-year-end-report-2021
Introduction
The Edge Area was originally established in 2013. In 2014, the bovine tuberculosis (TB) surveillance strategy for this area was incorporated into the UK Government’s Strategy to achieve Officially Bovine Tuberculosis-Free (OTF) status for England by 2038. A key action was to recognise the different levels of TB in different parts of the country and to vary the approach to control accordingly. The aim is to obtain OTF status for the Edge Area as soon as possible.
From January 2018, cattle herds in the west of Berkshire have undergone routine TB surveillance testing every 6 months, while cattle herds in the east of the county are tested annually.
This report describes the frequency and geographical distribution of TB in 2021 in cattle herds in Berkshire, which forms part of the Edge Area. It examines what factors are likely to be driving TB in this area, and the risks the disease in this county may pose to neighbouring areas.
County map of England showing the Edge Area and highlighting the county of Berkshire.
TB in cattle and other mammals is primarily caused by the bacterium Mycobacterium bovis (M. bovis), and the disease is subsequently referred to in this report as TB. Although other sources may refer to TB ‘breakdowns’, this report will use the term ‘incidents’ throughout.
This report is intended for individuals involved in the control of TB, both locally and nationally. This includes, but is not limited to farmers, veterinarians, policy makers and the scientific community.
Details of the data handling methodology used in this report, a glossary of terms, and the TB control measures adopted in the Edge Area, can be found in the explanatory supplement for the annual reports 2021.
Types of TB incident
Unless otherwise specified, this report includes all new TB incidents detected during the reporting period. This includes ‘Officially Tuberculosis-Free Status Withdrawn’ (OTF-W) incidents and ‘Officially Tuberculosis-Free Status Suspended’ (OTF-S) incidents.
OTF-W incidents are those involving one or more test reactors with typical lesions of TB identified at post-mortem meat inspection, or one or more animals with M. bovis-positive culture results from tissue samples collected from carcases during the post-mortem inspection, or both.
OTF-S incidents are triggered by reactors to the Single Intradermal Comparative Cervical Tuberculin (SICCT) test, but without subsequent detection of TB lesions or positive culture results in any of those animals.
TB incidents in Approved Finishing Units (AFUs) without grazing are not included in the prevalence and incidence calculations in this report due to the limited epidemiological impact of these incidents.
Furthermore, herds restricted because of an overdue test rather than a TB incident are also excluded from calculations. Hence measures of incidence and prevalence in this report may be lower than those reported in the official TB statistics.
Cattle industry
There are approximately 200 cattle herds in Berkshire and beef herds are the predominant cattle enterprise in the county. The majority of herds are small and 66% of them have fewer than 50 cattle, as shown in Appendix 1 and 2. The overall number of cattle and herds in the county continued to fall from previous years.
Berkshire had no livestock markets or abattoirs in 2021. Markets close to Berkshire include Salisbury market in the neighbouring High Risk Area (HRA) county of Wiltshire, and Thame market in Oxfordshire (Edge Area).
There were 2 AFUs without grazing in Berkshire in 2021. There were no Exempt Finishing Units (EFUs) in Berkshire in 2021 - EFU are for the fattening of cattle from 6-monthly and annually tested herds that have not been pre-movement tested for TB.
Cattle herds in the western half of Berkshire routinely undergo 6-monthly surveillance testing, however 14% of cattle herds in this area were eligible for annual testing under the earned recognition scheme in 2021.
New TB incidents
A total of 19 new TB incidents were detected in Berkshire in 2021, an increase from 16 new incidents in 2020, as displayed in Figure 1. There was an increase in both OTF-S incidents (from six in 2020 to eight in 2021) and OTF-W incidents (from 10 to 11).
Prior to 2021, there had been a steady year-on-year decline in the number of new TB incidents in Berkshire, since 2018. As in 2020, beef suckler herds had the highest proportion of incidents (53%), followed by beef fatteners (42%). There was only one incident in a dairy herd (OTF-S) in 2021, which compares to 3 dairy herds (all OTF-W) in 2020, as shown in Figure 2.
Figure 1: Annual number of new TB incidents in Berkshire, from 2012 to 2021.
| Year | OTF-W incidents | OTF-S incidents | Total |
|---|---|---|---|
| 2012 | 9 | 1 | 10 |
| 2013 | 9 | 6 | 15 |
| 2014 | 5 | 4 | 9 |
| 2015 | 6 | 6 | 12 |
| 2016 | 8 | 4 | 12 |
| 2017 | 18 | 6 | 24 |
| 2018 | 13 | 16 | 29 |
| 2019 | 14 | 12 | 26 |
| 2020 | 10 | 6 | 16 |
| 2021 | 11 | 8 | 19 |
Figure 2: Number of new TB incidents (OTF-W and OTF-S) in Berkshire in 2021, by cattle herd size and type.

By herd size: 1-50: 1 OTF-W, 3 OTF-S; 51-100: 5 OTF-W, 2 OTF-S; 101-200: 2 OTF-W; 201-350: 1 OTF-W, 2 OTF-S; 351-500: 1 OTF-S; 501+: 2 OTF-W. By herd type: beef suckler: 5 OTF-W, 5 OTF-S; beef fattener: 6 OTF-W, 2 OTF-S; dairy: 1 OTF-S.
In general, the number of TB incidents disclosed each month follows the number of TB tests completed. However, in July there were 4 OTF-W incidents disclosed, see Figure 3, despite the lowest number of TB tests being completed that month, see Figure 4.
Figure 3: Number of new TB incidents (OTF-W and OTF-S) in Berkshire in 2021, by month of disclosure.
| Month | OTF-W incidents | OTF-S incidents | Total |
|---|---|---|---|
| January | 2 | 1 | 3 |
| February | 1 | 0 | 1 |
| March | 1 | 0 | 1 |
| April | 0 | 0 | 0 |
| May | 0 | 3 | 3 |
| June | 1 | 1 | 2 |
| July | 4 | 0 | 4 |
| August | 0 | 0 | 0 |
| September | 2 | 2 | 4 |
| October | 0 | 0 | 0 |
| November | 0 | 0 | 0 |
| December | 0 | 1 | 0 |
Figure 4: Number of tests undertaken in OTF herds in Berkshire in 2021, by month.
| Month | Number of tests |
|---|---|
| January | 1362 |
| February | 1474 |
| March | 2254 |
| April | 1563 |
| May | 1014 |
| June | 760 |
| July | 453 |
| August | 870 |
| September | 1989 |
| October | 1773 |
| November | 2217 |
| December | 507 |
Residual cattle infection was a likely source of infection for 3 of those herds with recent histories of TB incidents, 2 of which were disclosed at 6 month post-incident check tests (Figure 5). Two of the herds were geographically close to each other. Exposure to infected wildlife reservoirs could also explain the 4 incidents identified in July 2021.
Figure 5: Number of new TB incidents (OTF-W and OTF-S) in Berkshire in 2021, according to the surveillance methods that detected them.
| Disclosing test type | OTF-W incidents | OTF-S incidents | Total |
|---|---|---|---|
| 6 month test (6M) | 3 | 1 | 4 |
| Check test (CT) | 0 | 1 | 1 |
| Slaughterhouse test (SLH) | 1 | 0 | 1 |
| Whole herd test (WHT) | 7 | 6 | 13 |
Unusual TB incidents
Three dairy herds in Berkshire have remained under continuous movement restrictions for 5, 9, and 10 years respectively, because of continued detection of infected cattle at short interval tests. Two of these persistently infected dairy herds (under restrictions for more than 550 days) had a wildlife survey for wildlife activity on the farm and additional advice on reducing potential cattle-badger interactions. In partnership with the farmers, action plans were formulated. There has been additional interferon gamma (IFN-γ) blood testing, as well as supplementary IDEXX testing on one of the premises. However, the incidents have continued and were not resolved by the end of 2021.
TB in other species
There was one isolation of M. bovis in a wild fallow deer in west Berkshire near to the Wiltshire border. Whole Genome Sequencing (WGS) of the isolate identified M. bovis clade B6-62.
Incidence of TB
Berkshire had the third highest incidence of TB per 100 herd-years at risk out of the 11 Edge Area counties at 12.7. This was higher than the overall figure for the Edge Area (8.9), but slightly below the overall figure for the HRA (14.4). TB incidence increased in 2021 from 10.6 incidents per 100 herd-years at risk in 2020, as displayed in Figure 6. Despite the increase in 2021, incidence remained lower than the peak in 2019 (17.1), following a period of increase since 2014 (3.6).
Figure 6: Annual incidence rate (per 100 herd-years at risk) for all new incidents (OTF-W and OTFS) in Berkshire, from 2012 to 2021.
| Year | TB incidence per 100 herd years at risk |
|---|---|
| 2012 | 5 |
| 2013 | 4.5 |
| 2014 | 3.6 |
| 2015 | 6.1 |
| 2016 | 6.5 |
| 2017 | 13.3 |
| 2018 | 14.1 |
| 2019 | 17.1 |
| 2020 | 10.6 |
| 2021 | 12.7 |
Prevalence of TB
The end-of-year prevalence in Berkshire also increased marginally in 2021 (by 0.3%), to 7.2%, as indicated in Figure 7.
Figure 7: Annual end of year prevalence in Berkshire, from 2012 to 2021.
| Year | Proportion of hers under restriction (%) |
|---|---|
| 2012 | 2.90 |
| 2013 | 5.34 |
| 2014 | 2.42 |
| 2015 | 5.04 |
| 2016 | 5.26 |
| 2017 | 8.66 |
| 2018 | 12.67 |
| 2019 | 9.17 |
| 2020 | 6.94 |
| 2021 | 7.21 |
Geographical distribution of TB incidents
The TB incidence rate in Berkshire (12.7) was lower than its northern and western neighbours, Oxfordshire (16.0, Edge Area) and Wiltshire (17.0, HRA), but much higher than the Edge Area counties to the north-east and south of Berkshire: Buckinghamshire (6.9) and Hampshire (3.3).
All of the new TB incidents in 2021 were within the western half of the county. This is the area of the county with six-monthly surveillance testing and a higher cattle density, as indicated in Figure 8. There were no new incidents in the eastern area of Berkshire, where there is annual surveillance testing and a lower cattle density. There has been no apparent spread of new infection eastward from the endemic area in the west of the county. However, the cattle population density is lower in the east of the county, so it is possible that geographical spread of infection in wildlife has not been detected.
Out of the 11 OTF-W incidents, 3 were assessed as being most likely attributable to cattle movements, as shown in Figure 9. This was the category most frequently attributed as most likely. Two OTF-W incidents were most likely attributed to wildlife, and one was attributed to residual cattle infection within the herd. The most likely sources attributed to the 5 remaining OTF-W incidents were mixed or unknown.
Figure 8: Location of cattle holdings in Berkshire with new TB incidents (OTF-W and OTF-S) in 2021 and cattle holdings with pre-2021 OTF-W incidents still ongoing at the beginning of 2021, overlaid on a cattle density map. Note that ‘OTF-W Introduced 2021’ refers to OTF-W incidents in which cattle movements were the most likely source of infection.
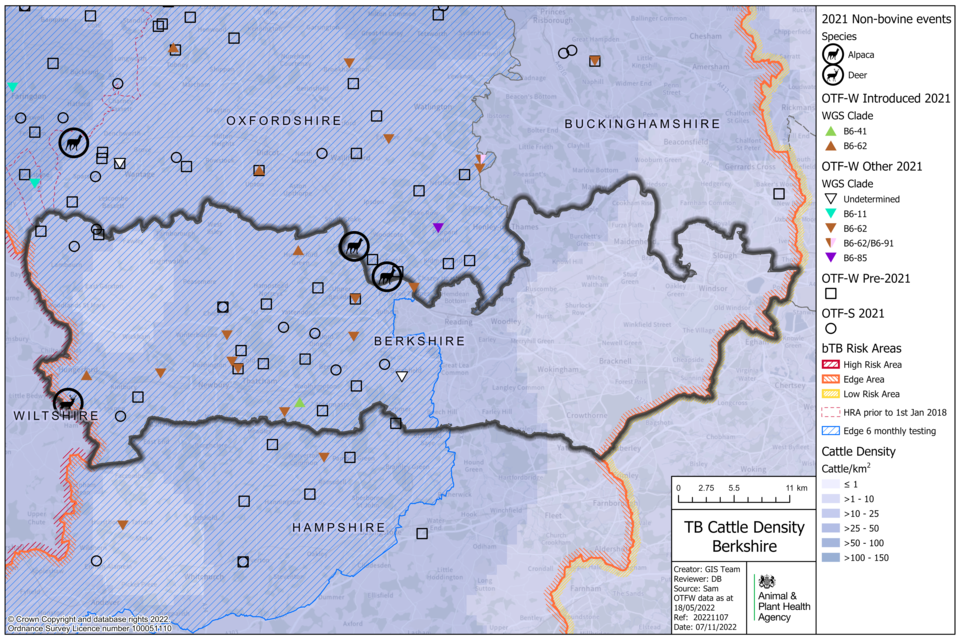
All new TB incidents in 2021 were within the western half of the county. All OTF-W incidents in Berkshire in 2021, aside from one, were caused by infection with WGS clade B6-62 of M. bovis.
Figure 9: Map of the source of infection pathway recorded with the highest level of certainty, for all TB incidents (OTF-W and OTF-S) in Berkshire that started in 2021. Local cattle refers to both residual infection and contiguous cattle risk pathways. Purchased refers to all cattle movement risk pathways. Wildlife refers to both badger and other wildlife risk pathways. Where none of the sources of infection were identified with greater than 50% certainty, the highest ranking source is displayed with an OTF-W undetermined ‘maximum DRF category’ symbol.
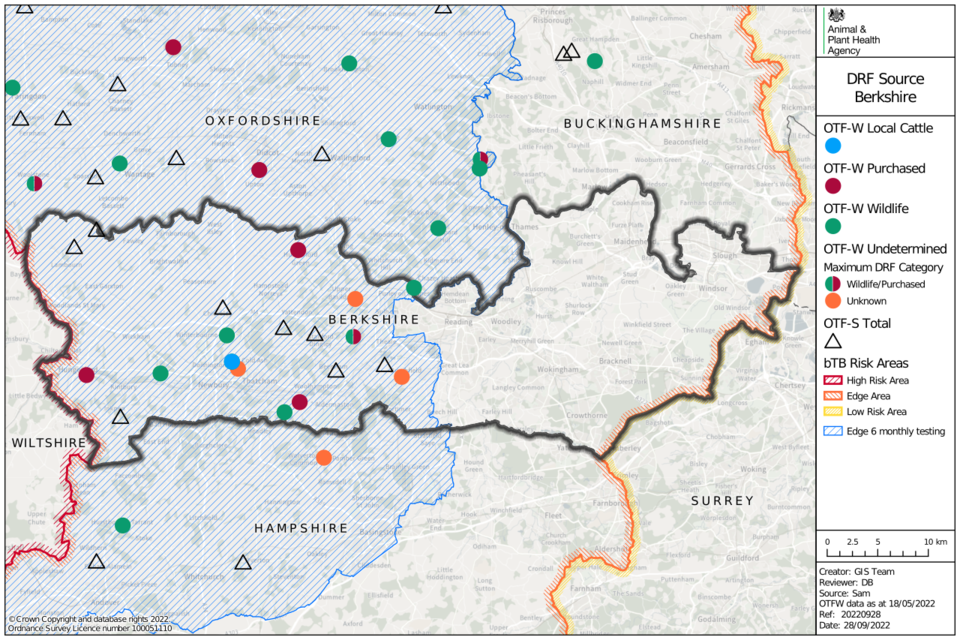
Map of Berkshire showing data points of OTF-W as circles, and OTF-S as triangles. Colour is used to denote whether the source is from local cattle, purchased, wildlife or is undetermined. Sources are mixed without evidence of clustering.
Genotyping was replaced with whole genome sequencing (WGS) of M. bovis isolates at Animal and Plant Health Agency (APHA) in 2021. In the 2020 report WGS clade information was provided alongside genotypes for comparison. Excepting a single incident, all OTF-W incidents in Berkshire in 2021, were caused by infection with WGS clade B6-62 of M. bovis (see Figure 10). WGS clade B6-62 encompasses the previous designated spoligotype 10, as well as other closely related spoligotypes.
Genotype 10:a and 10:u (both equivalent to clade B6-62) were first disclosed in Berkshire in around 2010 and have been present and spreading in the intervening years. Genotype 10:a had been present before this time in the area of Wiltshire bordering Berkshire suggesting the original incursion was from the west, possibly via north-west Hampshire. Genotype 10:a was the most frequently confirmed genotype in 2021, with 10:u isolated only once in the Thatcham area. This suggests local sources of infection, including residual infection in cattle herds or wildlife infection, and purchasing infected stock from 10:a or 10:u home range areas.
Genotype 10:a continues to appear across the western endemic area of Berkshire. There is a cluster of incidents that has been developing around the Thatcham area over the past 11 four years, as indicated in Figure 10. There were no new incidents of 10:u in the Aldermaston cluster area which was reported in 2020.
Genotype 10:d was isolated for the first time in Berkshire (in the Thatcham area), which has previously been found in incidents in south-eastern Oxfordshire on just three occasions.
The WGS clade B6-41 (home range: Dorset and Somerset border) was confirmed in a beef fattening premises in south Berkshire, which purchased cattle from the HRA and Edge Area.
Figure 10: WGS clades of M. bovis detected in Berkshire between 2018 and 2021, where wildlife sources were attributed with a 75% certainty or above according to the DRF calculation, as an indication of local M. bovis reservoir in local wildlife populations (OTF-W incidents only).
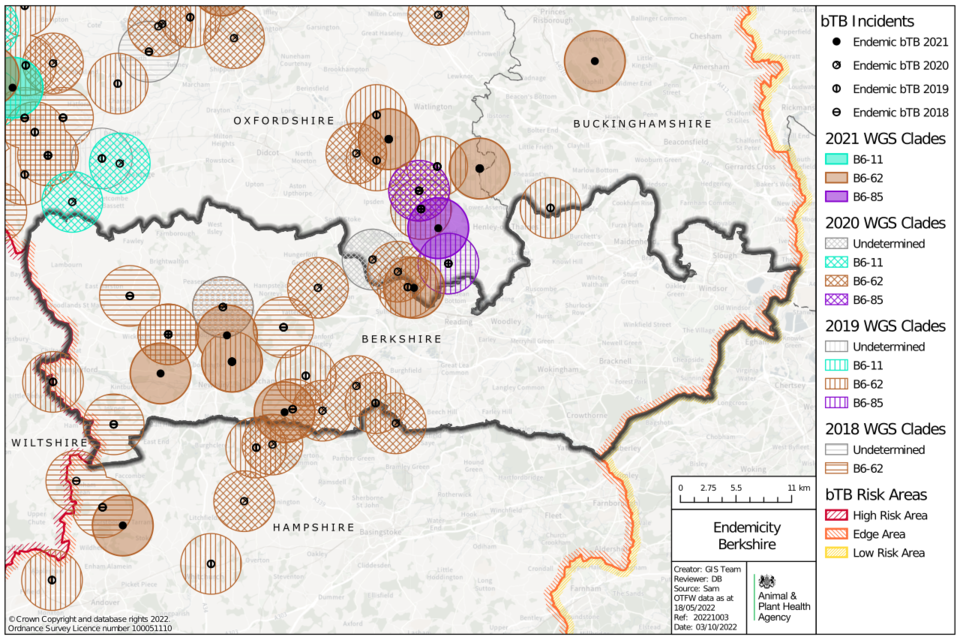
All areas identified as possible local M. bovis reservoirs are in the western half of the county.
Main risk pathways and key drivers for TB infection
The main risk pathways and key drivers for TB infection within Berkshire are considered here. Evidence collected during APHA veterinary investigations into the source of infection within herds is used to inform this understanding. In 2021, all 19 (100%) of new TB incidents in Berkshire received a preliminary or final APHA veterinary investigation to identify the source of infection.
It can be challenging to retrospectively establish the route of infection for a TB incident herd. Ideally this investigation includes a thorough on-farm investigation and scrutiny of routinely collected data; such as cattle movement records, and the results of WGS where isolates are available. Up to 3 hazards and risk pathways are selected for each incident investigated. Each of these potential sources are given a score that reflects the likelihood of that pathway being the true one, based on the available evidence.
Details of the protocol used for these investigations, and the subsequent methodology used to calculate the weighted contribution of the different suspected sources of M. bovis infection can be found in the explanatory supplement to the annual reports 2021.
The key drivers of the TB epidemic in Berkshire in 2021 were as follows:
- purchase of undetected infected cattle
- exposure to probable infected local wildlife
- residual infection from previous incidents
Figure 11 presents the aggregated results of the APHA investigations into the source of infection. Further details are presented in Appendix 3, Table 5.
Movements of undetected infected cattle remain an important driver of infection in Berkshire, with the highest weighted source of infection in 2021 (33%).
Infected wildlife also had a high source attribution, with 32% of weighted risk pathways for OTF-W and OTF-S incidents in Berkshire in 2021 (see Figure 11). Infected badgers contributed 27% towards the weighted source of infection for wildlife, while ‘other wildlife’ contributed 5%. The M. bovis WGS clade B6-62 (genotype 10:a and 10:u) incidents were all in the six-monthly surveillance testing area of west Berkshire where a local reservoir of infection in wildlife and cattle is considered to be present. Isolation of M. bovis with WGS clade B6-62 from a wild fallow deer in Berkshire close to the Wiltshire border raises the possibility that wild deer could have played a role in spreading disease in this area.
Residual cattle infection from previous incidents is also an important risk pathway (15%). In Berkshire, the majority of herds that had a TB incident in 2021 were recurrent incidents with a history of TB in the previous three years (Figure 12).
Other or unknown sources of infection had a weighted contribution of 19% (see Figure 11). This category is added to herds where there was high uncertainty around the selected pathways. See the explanatory supplement for details of the methodology used.
Figure 11: Summary of the weighted source of infection pathways attributed for OTF-W and OTF-S TB incidents that started in 2021 in Berkshire, that had a completed DRF (n= 19).

Sources attributed were badgers (27%), cattle movement (33%), contiguous infection (1%), residual infection (15%), other wildlife source (5%), and other or unknown source (19%), n=19.
Figure 12: Number of herds with a TB incident (OTF-W and OTF-S) in Berkshire in 2021, with a history of any TB incident in the previous 3 years, and holdings without a history of TB in the previous 3 years.

Column chart showing the number of incidents in Berkshire in 2021 in herds that have either had an incident in the previous three years (7 OTF-W, 5 OTF-S) or have no recent history of TB (4 OTF-W, 2 OTF-S).
Forward look
The number of new TB incidents in the county increased slightly in 2021 compared to 2020, but is continuing the downward trend from the peak of OTF-W incidents in 2017. In the east of Berkshire, the absence of TB incidents in 2021 and only one OTF-S incident in 2020, the spread of infection eastwards from west Berkshire appears to have stalled; with the caveat of less cattle herds to act as sentinels for detection of infection in wildlife.
Six-monthly surveillance testing in west Berkshire has likely helped to reduce the spread of TB through earlier detection of disease. This should lead to shorter incidents with fewer reactors by reducing time for cattle-to-cattle spread within herds.
In west Berkshire, there is evidence of infected wildlife acting as a reservoir and potential source of infection for cattle. M. bovis WGS clade B6-62 has been isolated over several years in clusters of cattle incidents and infected wildlife which are closely genetically related. Further improvements in on-farm biosecurity to reduce wildlife to cattle transmission are needed to break the cycle of infection. Additionally, control measures to reduce transmission from badgers through vaccination or population control would be advantageous.
APHA, in collaboration with the University of Nottingham, is conducting a project to detect the presence and location of TB infection in badgers in Buckinghamshire, Oxfordshire, Berkshire, Hampshire and East Sussex - collectively known as the ‘Southern Edge Area’. Volunteers have been recruited in each county to help with the safe and timely retrieval of badger carcases. They are delivered to the University of Nottingham, where they undergo post-mortem examination and testing for the presence of TB infection by culture. Those that test positive are sent for further whole genome sequencing and clade identification (genetic strain). The project aims to collect 100 fresh, ‘found-dead’ badger carcases per county, most likely those killed in road traffic accidents (RTA). Once 100 satisfactory carcases have been examined per county, collection will then cease in that county. Once county targets are achieved, all stakeholders will be informed. The results of this work will help develop a picture of the disease situation in the Southern Edge Area. Cattle movements remain an important source of TB in this county and informed purchasing by cattle keepers should be encouraged. The likelihood of achieving less than 1% OTF-W incidents in Berkshire by 2025 is low.
Appendix 1: Cattle industry demographics
Table 1: Number of cattle premises by size band in Berkshire at 1 January 2021 (RADAR data)
| Size of herds | Number of herds in Berkshire |
|---|---|
| Undetermined | 4 |
| 1-50 | 99 |
| 51-100 | 30 |
| 101-200 | 22 |
| 201-350 | 10 |
| 351-500 | 4 |
| 501+ | 8 |
| Total number of herds | 177 |
| Mean herd size | 101 |
| Median herd size | 35 |
Table 2: Number (and percentage of total) of animals by breed purpose in Berkshire at 1 January 2021
| Breed purpose | Number (and percentage of total) cattle in Berkshire |
|---|---|
| Beef | 13,589 (75%) |
| Dairy | 3,855 (21%) |
| Dual purpose | 454 (2%) |
| Unknown | 4 |
| Total | 17,902 |
Appendix 2: Summary of headline cattle TB statistics
Table 3: Herd-level summary statistics for TB in cattle in Berkshire between 2019 and 2021
| Herd-level statistics | 2019 | 2020 | 2021 |
|---|---|---|---|
| (a) Total number of cattle herds live on Sam at the end of the reporting period | 220 | 218 | 210 |
| (b) Total number of whole herd skin tests carried out at any time in the period | 332 | 288 | 278 |
| (c) Total number of OTF cattle herds having TB whole herd tests during the period for any reason | 173 | 168 | 170 |
| (d) Total number of OTF cattle herds at the end of the report period (herds not under any type of Notice Prohibiting the Movement of Bovine Animals (TB02) restrictions) | 196 | 196 | 186 |
| (e) Total number of cattle herds that were not under restrictions due to an ongoing TB incident at the end of the report period | 199 | 202 | 194 |
| (f.1) Total number of new OTF-S TB incidents detected in cattle herds during the report period (including all Finishing Units) | 12 | 6 | 8 |
| (f.2) Total number of new OTF-W TB incidents detected in cattle herds during the report period (including all Finishing Units) | 14 | 10 | 11 |
| (g.1) Of the new OTF-W herd incidents, how many can be considered the result of movement, purchase or contact from or with an existing incident based on current evidence? | 1 | 2 | 1 |
| (g.2) Of the new OTF-W herd incidents, how many were triggered by skin test Reactors or 2xIRs at routine herd tests? | 10 | 6 | 7 |
| (g.3) Of the new OTF-W herd incidents, how many were triggered by skin test Reactors or 2xIRs at other TB test types (such as forward and backtracings, contiguous or check tests)? | 4 | 0 | 3 |
| (g.4) Of the new OTF-W herd incidents, how many were first detected through routine slaughterhouse TB surveillance? | 0 | 2 | 1 |
| (h.1) Number of new OTF-W incidents revealed by enhanced TB surveillance (radial testing) conducted around those OTF-W herds | 0 | 0 | 0 |
| (h.2) Number of new OTF-S incidents revealed by enhanced TB surveillance (radial testing) conducted around those OTF-W herds | 4 | 0 | 0 |
| (i) Number of OTF-W herds still open at the end of the period (including any ongoing OTF-W incidents that began in a previous reporting period, but not including non-grazing Approved Finishing Units) | 14 | 11 | 10 |
| (j) New confirmed (positive M. bovis culture) incidents in non-bovine species detected during the report period (indicate host species involved) | 1 (cat) | 1 (badger) | 1 (wild fallow deer) |
| (k.1) Number of grazing approved finishing units active at end of the period | 0 | 0 | 0 |
| (k.2) Number of non-grazing approved finishing units active at end of the period | 2 | 2 | 2 |
| (k.3) Number of grazing exempt finishing units active at end of the period | 0 | 0 | 0 |
| (k.4) Number of non-grazing exempt finishing units active at end of the period | 0 | 0 | 0 |
Table 4: Animal-level summary statistics for TB in cattle in Berkshire between 2019 and 2021
| Animal-level statistics (cattle) | 2019 | 2020 | 2021 |
|---|---|---|---|
| (a) Total number of cattle tested in the period (animal tests) | 46,016 | 39,862 | 34,162 |
| (b.1) Reactors detected by tuberculin skin tests during the year | 146 | 80 | 97 |
| (b.2) Reactors detected by additional IFN-γ blood tests (skin-test negative or IR animals) during the year | 157 | 107 | 80 |
| (c) Reactors detected during year per incidents disclosed during year | 11.7 | 11.7 | 9.3 |
| (d) Reactors per 1,000 animal tests | 6.6 | 4.7 | 5.2 |
| (e.1) Additional animals slaughtered during the year for TB control reasons (dangerous contacts, including any first time IRs) | 27 | 15 | 19 |
| (e.2) Additional animals slaughtered during the year for TB control reasons (private slaughters) | 5 | 1 | 0 |
| (f) SLH cases (tuberculous carcases) reported by Food Standards Agency (FSA) during routine meat inspection | 5 | 5 | 1 |
| (g) SLH cases confirmed by culture of M. bovis | 2 | 4 | 1 |
Note (c) Reactors detected during year per incidents disclosed during year, reactors may be from incidents disclosed in earlier years, as any found through testing during the report year count here.
Note (g) SLH cases confirmed by culture of M. bovis, not all cases reported are submitted for culture analysis. All cases reported are from any period prior to or during restrictions.
Appendix 3: Suspected sources of M. bovis infection for all the new OTF-W and OTF-S incidents identified in the report period
Each TB incident could have up to 3 potential risk pathways identified. Each risk pathway is given a score that reflects the likelihood of that pathway bringing TB into the herd. The score is recorded as either definite (score 8), most likely (score 6), likely (score 4) or possible (score 1). The source(s) for each incident are weighted by the certainty ascribed. Any combination of definite, most likely, likely, or possible can contribute towards the overall picture for possible routes of introduction into a herd. If the overall score for a herd is less than 6, then the score is made up to 6 using the ‘Other/Unknown Source’ option. Buffering up to 6 in this way helps to reflect the uncertainty in assessments where only ‘likely’ or ‘possible’ sources are identified.
Table 5 combines the data from multiple herds and provides the proportion of pathways in which each source was identified, weighted by the certainty that each source caused the introduction of TB. The output does not show the proportion of herds where each pathway was identified (this is skewed by the certainty calculation). WGS of M. bovis isolates can be a powerful tool in identifying a likely source of infection, however WGS clades are not determined for OTF-S herds. As a result of varying levels of uncertainty, only broad generalisations should be made from these data. A more detailed description of this methodology is provided in the Explanatory supplement for the annual reports 2021.
Table 5: Suspected sources of M. bovis infection for all new OTF-W and OTF-S incidents identified in Berkshire, in 2021
| Source of infection | Possible (1) | Likely (4) | Most likely (6) | Definite (8) | Weighted contribution |
|---|---|---|---|---|---|
| Badgers | 9 | 6 | 0 | 0 | 26.6% |
| Cattle movements | 9 | 5 | 2 | 0 | 33.3% |
| Contiguous | 1 | 0 | 0 | 0 | 0.8% |
| Residual cattle infection | 6 | 2 | 1 | 0 | 15.1% |
| Domestic animals | 0 | 0 | 0 | 0 | 0.0% |
| Non-specific reactor | 0 | 0 | 0 | 0 | 0.0% |
| Fomites | 0 | 0 | 0 | 0 | 0.0% |
| Other wildlife | 6 | 0 | 0 | 0 | 5.0% |
| Other or unknown source | 1 | 0 | 0 | 0 | 19.3% |
Please note that each TB incident could have up to 3 potential pathways so totals may not equate to the number of actual incidents that have occurred.