Automatic Enrolment evaluation report 2019
Updated 12 May 2020

© Crown copyright 2020
This publication is licensed under the terms of the Open Government Licence v3.0 except where otherwise stated. To view this licence, visit nationalarchives.gov.uk/doc/open-government-licence/version/3 or write to the Information Policy Team, The National Archives, Kew, London TW9 4DU, or email: psi@nationalarchives.gov.uk.
Where we have identified any third party copyright information you will need to obtain permission from the copyright holders concerned.
This publication is available at https://www.gov.uk/government/publications/automatic-enrolment-evaluation-report-2019/automatic-enrolment-evaluation-report-2019
Executive summary
Background
The independent Pension Commission was set up to try to address long term retirement saving in the UK. Subsequently, to support the millions of people not saving enough for retirement, the Government introduced legislation in Pensions Acts from 2007, with the aim of increasing private pension saving in the UK. In 2012 automatic enrolment was introduced as part of a wider set of pension reforms designed to ensure that the UK has a pension system that enables individuals to save towards achieving the lifestyle they aspire to in retirement, while minimising the implementation challenges for employers and the pensions industry.
The reforms require employers to process automatic enrolment of eligible workers into a qualifying workplace pension scheme and make a minimum contribution. Workers are eligible provided they: are aged at least 22 and under State Pension age (SPa); earn over £10,000 per year in 2019/20 terms (these thresholds are reviewed annually); normally work in the UK and do not currently participate in a qualifying workplace pension scheme.
The automatic enrolment duties were staged in between October 2012 and February 2018 by employer size, starting with the largest employers. Since October 2017, all businesses employing someone for the very first time have to provide a workplace pension from the first day of their service.
In 2018, the first of two planned minimum contribution increases was implemented. Before April 2018, total minimum contributions were two per cent of a band of workers’ earnings, of which at least one per cent came from the employer. This rose to five per cent in April 2018, of which at least two per cent came from the employer. In 2019, the second planned increase was implemented. In April 2019, total minimum contributions rose to eight per cent of which at least three per cent must come from the employer.
Evaluation Strategy
The Department for Work and Pensions (DWP) is committed to evaluating fully the effects of the workplace pension reforms, as set out in its evaluation strategy[footnote 1], which was refreshed in 2017. Evaluation reports have been published annually since 2013, following a baseline report in 2012 which described the landscape before the implementation of automatic enrolment[footnote 2]. This report brings together the latest evidence, including evidence published within the last 12 months and new analysis conducted for the report, showing what has happened since automatic enrolment began. In line with the evaluation strategy, this is the last report we are planning to publish on an annual basis now that employer staging and the phased increases to minimum contribution rates (i.e. ‘implementation’) have been delivered.
Key findings
Existing evidence
Since the start of automatic enrolment in 2012, more than 10.2 million workers have been automatically enrolled, and over 1.6 million employers have met their duties, with 709,000 workers having been automatically re-enrolled and 342,855 employers having met their re-enrolment duties by the end of 2019[footnote 3]. As of the end of March 2019, National Employment Savings Trust (Nest) membership stood at 7.9 million members, with over 720,000 employers.
Levels of awareness and understanding of automatic enrolment are high. In particular, at least 91 per cent of micro, small and medium-sized employers were aware of each individual ongoing duty in relation to automatic enrolment[footnote 4].
Whilst there were some concerns (mainly in 2013) amongst large employers that ongoing administration tasks relating to automatic enrolment could become a burden, attitudes became increasingly positive as rollout progressed and employers became used to the new processes. Most employers interviewed in 2016 and 2018 found the cost and time burden involved with implementing automatic enrolment to be lower than they had initially anticipated[footnote 5] [footnote 6].
Employers were typically aware of both the April 2018 and April 2019 increases in contributions. Generally, employers said that they were confident about being able to pay these new rates which they perceived as a small proportion of their overall costs.
Data collected up to 2018 found that the number of eligible employees participating in a workplace pension has increased to 18.7 million (87 per cent), up from 10.7 million (55 per cent) in 2012[footnote 7].
The annual total amount saved on behalf of eligible employees across both sectors (public and private) stands at £90.4 billion in 2018, which is an increase of £7 billion from 2017. Annual total amounts increased in both public and private sectors from 2017. The public sector increased by around £2.5 billion and the private sector by £4.5 billion.
New analysis within this report
In 2019, the majority (62 per cent) of private sector employers currently had some form of workplace pension provision, up from 47 per cent in 2017. These organisations employed 94 per cent of all private sector employees.
In 2019, less than four in ten private sector employers (39 per cent) stated that the introduction of automatic enrolment had resulted in an increase in the total pension contributions that their organisation had to make[footnote 8]. However substantial variation existed by employer size.
The proportion of workplace pension savers who made an active decision to stop saving (including opt-out and cessation) shows a slight increase from the 2018/19 financial year to the first quarter of the 2019/20 financial year (0.72 to 0.76 per cent), following the second increase of the automatic enrolment minimum contribution rates. Despite this small increase, the overall rate remains low.
From April 2018 onwards, the period in which the increases to minimum contribution rates took place, those aged 22 to 29 and 30 to 39 saw the largest increases in their active decision stopping saving rates (0.23 percentage points and 0.15 percentage points respectively). These increases are modest but notable relative to other age groups where the changes observed are negligible.
Between April 2014 and June 2019, the average active decision stopping saving rate was slightly higher for males (0.76 per cent) than for females (0.59 per cent). Throughout the implementation period of automatic enrolment, the cohort opt-out rate has remained consistently low. Overall, among employers with a scheme used for automatic enrolment, nine per cent of employees who were automatically enrolled in the 2018/19 financial year (prior to the April 2019 minimum contribution rate increase) decided to opt out within one month. This rate remained at the same level as in 2016/17.
Findings from the DWP’s communications tracking research (April 2019 wave) found that the majority of individuals interviewed viewed automatic enrolment as a good thing for them personally (79 per cent); agreed saving into a workplace pension was normal for them (77 per cent); and knew where to go if they wanted to find more about workplace pensions (75 per cent). Evidence from the British Social Attitudes (BSA) survey indicates that “social norming” of workplace pensions has occurred across all eligible age groups and occupational classifications.
Eligible employees in the private sector with total contributions above the 2018 minimum are more likely to belong to older age brackets, have higher earnings and work for larger employers. However, the dominance of these groups among employees with total contributions above the 2018 minimum has lessened in recent years. The share of those belonging to younger age brackets, with lower earnings and working for smaller employers has increased significantly over time.
In April 2018, the number of eligible private-sector employees who were making contributions sufficient to meet the 2019 minimum requirements had risen to approximately 6.4 million. A further 6.9 million may have needed to increase contributions to meet the 2019 minimum requirements.
An update is also provided on DWP work with partners to encourage long-term saving behaviours amongst the self-employed, who are not covered by automatic enrolment. Initial findings from messaging trials suggest that initial ‘open’ rates of messages are relatively high in comparison with analogous industry marketing emails. However, the percentage of recipients engaging further by then logging into their accounts is lower than expected.
Next Steps
In line with the evaluation strategy, this is the last report we are planning to publish on an annual basis now that the implementation period for automatic enrolment is over (employer staging and the phased increases in minimum contributions have been delivered) and the policy has moved into steady-state.
Acknowledgements
We would like to thank the many contributors to this report from the Department for Work and Pensions (DWP), The Pensions Regulator (TPR), and HM Revenue and Customs (HMRC). We would like to thank the National Employment Savings Trust (Nest) for their helpful comments throughout.
We would also like to thank the cross-Government steering group that includes representatives from DWP, TPR, Her Majesty’s (HM) Treasury and the Office for National Statistics (ONS) for their support in producing this report.
The Authors
Matt Tapley – Senior Research Officer, Department for Work and Pensions
Rob Hardcastle – Senior Research Officer, Department for Work and Pensions
Maisey Hodges – Government Social Research Placement Student, Department for Work and Pensions
Annette Joseph – Senior Information Officer, Department for Work and Pensions
Nicolas Kreitmair – Assistant Economist, Department for Work and Pensions
Mycroft Leitch – Economist Placement Student, Department for Work and Pensions
Thomas Lloyd – Senior Scientific Officer, Department for Work and Pensions
Fiona Lynch – Senior Statistical Officer, Her Majesty’s Revenue and Customs
Lorraine Pearson – Principal Research Officer, Department for Work and Pensions
James Rees – Principal Scientific Officer, Department for Work and Pensions
Verite Savage – Government Social Research Placement Student, Department for Work and Pensions
Emily Severn – Research Officer, Department for Work and Pensions
Glossary of terms
Active member – Individuals currently contributing to a pension scheme, or having contributions made on their behalf.
Automatic enrolment – In 2008, the Government introduced a law designed to help people save more for their retirement. This requires, from 2012, all employers to enrol their eligible jobholders into a workplace pension scheme if they are not already in one. In order to preserve individual responsibility for the decision to save, workers have the right to opt out of the scheme.
Career average – A Defined Benefit (DB) scheme that gives individuals a pension based on their salary times the accrual rate in each year of their working life. Entitlements that are built up each year are revalued in line with inflation or earnings.
Ceasing active membership – If an eligible jobholder chooses to stop paying into an automatic enrolment scheme after the end of the opt-out period, they are said to cease active membership.
Cessation – When a worker has ceased active membership.
Contract-based pensions – Pensions where the legal contract is between the individual and the pension provider, usually an insurance company. Also known as personal pensions.
Contributions – The amount (often expressed as a percentage of earnings) that a worker and/or employer pays into a pension.
Defined Benefit (DB) – A type of occupational pension scheme. In a DB scheme the amount the member gets at retirement is based on various factors, but is predetermined (defined). These could include how long they have been a member of the pension scheme and earnings. Examples of DB pension schemes include final salary or career average earnings-related pension schemes. In most schemes, some of the pension can be taken as a tax-free lump sum. The rest is then received as regular income, which might be taxable.
Defined Contribution (DC) – A type of pension scheme. In a DC scheme a member’s pension pot is put into various investments such as shares (shares are a stake in a company). The amount in the pension pot at retirement is based on how much is paid in and how well the investments have performed. The pension can usually be accessed from age 55. These are also known as ‘money purchase’ schemes.
Duties start date – An employer’s automatic enrolment duties begin on the day an employers’ first member of staff starts working for them. This is referred to as their ‘Duties Start Date’.
Eligible jobholder – A worker (sometimes referred to as an employee) who is ‘eligible’ for automatic enrolment. An eligible jobholder must be aged at least 22 but under State Pension age, earn above the earnings trigger for automatic enrolment, and work or usually work in the UK and not already be a member of a qualifying pension scheme.
Employer size – Employer size is determined by the number of employees. For the purpose of staging dates, The Pensions Regulator categorises employer size based on number of employees in Pay As You Earn (PAYE) schemes as follows:
Micro = 1 to 4 employees Small = 5 to 49 employees Medium = 50 to 249 employees Large = 250+ employees
If any alternative definitions of employer size are used, they will be defined in the report.
Entitled worker – A worker who is aged at least 16 and under 75; works, or ordinarily works, in the UK; and earns below the lower earnings level of qualifying earnings (£6,136 for the 2019/20 tax year). Entitled workers are not eligible for automatic enrolment, although they can choose to join a workplace pension. Their employer is not required to make a contribution if they do so.
Group Personal Pension (GPP) – A type of personal pension scheme set up by an employer on behalf of its workers. Although the scheme is arranged by the employer, each pension contract is between the pension provider and the worker. The employer may also pay into the scheme, adding money to each worker’s pension pot.
Group Stakeholder Pension – An arrangement made for the employees of a particular employer, or group of employers, to participate in a stakeholder pension on a group basis. This is a collective arrangement only; the contract is between the individual and the pension provider, normally an insurance company.
Group self-invested personal pension (GSIPP) – A personal pension in which the policy holder rather than the pension company chooses the investments. GSIPPs allow members to invest in a wide range of assets, including commercial property and individual shares.
Hybrid pension scheme – A private pension scheme which is neither purely a DB nor DC arrangement. Typically a hybrid scheme is a DB scheme, which includes elements of DC pension design.
Levelling down – Strategies employers might use to reduce the generosity of contributions or outcomes for existing pension scheme members.
Lower Earnings Limit (LEL) – Under automatic enrolment individuals and their employers must contribute above a certain minimum amount. That minimum amount is based on a band of earnings – between the Lower Earnings Limit (LEL) and the Upper Earnings Limit (UEL). Where an individual earns over the trigger of £10,000 and they are aged between 22 and State Pension age (SPA), they will automatically be enrolled into a pension and pay contributions on at least this band of earnings. The 2019/20 levels for the LEL and UEL are £6,136 and £50,000 respectively, reviewed annually.
Master trust – A multi-employer trust-based pension scheme, which is promoted to and used by a range of unconnected employers.
National Employment Savings Trust (Nest) – A multi-employer trust-based workplace pension scheme, established by legislation, to support automatic enrolment and ensure that all employers have access to a quality, low-cost pension scheme with which to meet the employer duties.
Non-eligible jobholder – A worker who is not eligible for automatic enrolment but can choose to ‘opt in’ to an automatic enrolment scheme and will be entitled to a mandatory employer contribution should they do so. Non-eligible jobholders are in either of the following two categories: a worker who is aged at least 16 and under 75 and earns above the lower earnings level of qualifying earnings but below the earnings trigger for automatic enrolment; or is aged at least 16 but under 22, or between State Pension age and under 75; and earns above the earnings trigger for automatic enrolment.
Occupational pension scheme – A type of workplace pension organised by an employer (or on behalf of a group of employers) to provide benefits for employees on their retirement and for their dependants on their death. In the private sector, occupational schemes are trust-based. Types of occupational scheme include DB, DC and hybrid schemes.
Opt in – If a worker is not eligible for automatic enrolment, for example a non-eligible jobholder or entitled worker, they can ask their employer to become a member of the pension scheme. If the employer receives such a request then they must put the worker into the pension scheme and, in the case of the non-eligible jobholder, pay contributions to the scheme on their behalf.
Opt out – Where a jobholder has been automatically enrolled, they can choose to ‘opt out’ of a pension scheme. This has the effect of undoing active membership, as if the worker had never been a member of a scheme on that occasion. It can only happen within a specific time period, known as the ‘opt-out period’.
Opt-out period – A jobholder who becomes an active member of a pension scheme under the automatic enrolment provisions has a period of one calendar month during which they can opt out and get a full refund of any contributions made. This ‘opt-out period’ starts from whichever date is the later of the date active membership was achieved or the date they received a letter from their employer with their enrolment information. After this opt-out period a jobholder can still choose to leave the scheme at any time, but will not usually get a refund of contributions. These will instead be held in their pension until they retire. A jobholder cannot opt out before the opt-out period starts (i.e. they cannot opt out before they have been automatically enrolled).
PAYE – PAYE is the system that HM Revenue and Customs (HMRC) uses to collect Income Tax and National Insurance contributions from employees. They are deducted throughout the tax year based on employees’ earnings and then paid to HMRC.
Pension provider – An organisation, often a life assurance or asset management company, that offers financial products and services relating to retirement income.
Pension scheme – A legal arrangement offering benefits to members.
Personal pension (PP) – An arrangement where the pension is set up directly between an individual and a pension provider. This could be set up by an employer (see Group Personal Pension) or by an individual (sometimes referred to as an Individual Personal Pension). The individual pays regular monthly amounts or a lump sum to the pension provider who will invest it on the individual’s behalf. The fund is usually run by financial organisations such as insurance companies or asset managers. Personal pensions are a form of DC pension. See also Contract-based pensions.
Planned contribution increases – The Government set a minimum level of contributions that have to be put into a pension scheme by a worker and an employer, and within that has set a minimum level for the employer contribution:
| Date effective | Employer minimum contribution | Employee contribution (if employer pays minimum) | Minimum total contribution |
|---|---|---|---|
| Up until 5 April 2018 | 1% | 1% | 2% |
| 6 April 2018 to 5 April 2019 | 2% | 3% | 5% |
| 6 April 2019 onwards | 3% | 5% | 8% |
The state contributes to the worker’s pension through tax relief, typically at their marginal tax rate.
Postponement – An additional flexibility for an employer that allows them to choose to postpone automatic enrolment for a period of their choice of up to three months. Postponement can only be used for a worker on the employer’s staging date; the first day of worker’s employment; or on the date a worker employed by them meets the criteria to be an eligible jobholder. If an employer chooses to use postponement, they must provide written notice of this to their workers. This is also called ‘deferral’.
Protected groups – Under the Equality Act 2010, protected groups share a particular characteristic against which it is illegal to discriminate.
Qualifying scheme – To be a qualifying scheme for automatic enrolment, a pension scheme must meet certain minimum requirements, which differ according to the type of pension scheme. DC scheme requirements are based on the contribution rate and require a minimum total contribution based on qualifying earnings, of which a specified amount must come from the employer. The minimum requirements for DB schemes are based on the benefits a jobholder is entitled to under the scheme. Hybrid pension schemes contain elements of DB and DC and, depending on what type of hybrid they are, will have to meet either the same, or a modified version of, the minimum requirements for DB or DC pension schemes or a combination of both.
Real Time Information (RTI) – Under RTI, information about tax and other deductions (including employee pension contributions) under the PAYE system is transmitted to HMRC by the employer every time an employee is paid.
Re-enrolment – Every three years, staff who were automatically enrolled but opted out of or ceased active membership of a pension scheme more than 12 months before an employer’s re-enrolment date must be automatically re-enrolled into the scheme. Again, they have the choice to opt out. This is intended to prompt them to revisit their initial decision to opt out.
Staging – Refers to the staggered introduction of the employer duties, starting with the largest employers, based on PAYE scheme size, in October 2012, to the smallest in 2017. New PAYE schemes from April 2012 staged last, in 2017 and 2018. Staging has now completed, following the last staging date in February 2018.
Staging date – The date on which an employer was required to begin automatic enrolment. This date was determined by the total number of employees in an employer’s largest PAYE scheme on 1 April 2012.
Stakeholder pension – A type of personal pension arrangement introduced in April 2001 which could be taken out by an individual or facilitated by an employer. Where an employer had five or more staff and offered no occupational pension and an employee earned over the lower earnings limit, the provision of access to a stakeholder scheme, with contributions deducted from payroll, was compulsory. Stakeholder pensions are usually a contract-based pension scheme, subject to government regulations, which limited charges and allowed individuals flexibility about contributions and transfers, introduced in April 2001. These ceased to be mandatory after the workplace pension reforms were introduced.
State Pension age (SPA) – The earliest age at which an individual can claim their State Pension.
The Pensions Regulator (TPR) – Referred to as ‘the regulator’ and is the UK regulator of workplace pension schemes, including limited aspects of workplace personal pensions. It is responsible for ensuring employers are aware of their duties relating to automatic enrolment, how to comply with them and enforcing compliance. It uses a programme of targeted communications and a range of information to help employers understand what they need to do and by when. TPR is also responsible for regulating occupational pension schemes, including Master Trusts.
Trust-based pensions – Pension schemes set up under trust law by one or more employers for the benefit of workers. In a trust-based scheme a board of trustees is set up to run the scheme. Trustees are accountable for making decisions about the way the scheme is run, although they may delegate some of the everyday tasks to a third party. See also occupational pension scheme and master trust.
Upper Earnings Limit (UEL) – Under automatic enrolment individuals and their employers must make contributions above a certain minimum amount. That minimum amount is based on a band of earnings – between the Lower Earnings Limit (LEL) and the Upper Earnings Limit (UEL). Where an individual earns over the trigger of £10,000 and they are aged between 22 and State Pension age (SPA), they will automatically be enrolled into a pension and pay contributions on this band of earnings. The 2019/20 levels for the LEL and UEL are £6,136 and £50,000 respectively, reviewed annually.
Waiting period – A type of postponement, where new workers or newly eligible workers may have their automatic enrolment delayed for up to three months.
Worker – An employee or individual who has a contract to provide work or services personally and is not undertaking the work as part of their own business.
Workplace pensions – Any pension scheme provided as part of an arrangement made for the employees of a particular employer.
Workplace pension reforms – The reforms introduced as part of the Pensions Acts 2007 and 2008 (and updated as part of the Pensions Act 2011 and 2014). Starting in 2012, the reforms include a duty on employers to automatically enrol all eligible jobholders into a qualifying workplace pension scheme.
1. Introduction
1.1. Background
The independent Pension Commission was set up to try to address long term retirement saving in the UK. Subsequently, to support the millions of people not saving enough for retirement, the Government introduced legislation in Pensions Acts from 2007, with the aim of increasing private pension saving in the UK. In 2012 automatic enrolment was introduced as part of a wider set of pension reforms designed to ensure that the UK has a pension system that enables individuals to save towards achieving the lifestyle they aspire to in retirement, while minimising the implementation challenges for employers and the pensions industry.
The reforms require employers to process automatic enrolment of eligible workers into a qualifying workplace pension scheme and make a minimum contribution. Workers are eligible provided they: are aged at least 22 and under State Pension age (SPa); earn over £10,000 per year in 2019/20 terms (these thresholds are reviewed annually); normally work in the UK and do not currently participate in a qualifying workplace pension scheme.
The automatic enrolment duties were staged in between October 2012 and February 2018 by employer size, starting with the largest employers. Since October 2017, all businesses employing someone for the very first time have to provide a workplace pension from the first day of their service.
In 2018, the first of two planned minimum contribution increases was implemented. Before April 2018, total minimum contributions were two per cent of a band of workers’ earnings, of which at least one per cent came from the employer. This rose to five per cent in April 2018, of which at least two per cent came from the employer. In 2019, the second planned increase was implemented. In April 2019, total minimum contributions rose to eight per cent of which at least three per cent must come from the employer.
1.2. Evaluation strategy
The Department for Work and Pensions (DWP) is committed to fully evaluating the effects of the workplace pension reforms, as set out in its evaluation strategy[footnote 9], which was refreshed in 2017. Evaluation reports have been published annually since 2013, following a baseline report in 2012 which described the landscape before the implementation of automatic enrolment[footnote 10]. This report brings together the latest evidence showing what has happened since automatic enrolment began. In line with the evaluation strategy, this is the last report we are planning to publish on an annual basis now that employer staging and the phased increases to minimum contribution rates (i.e. ‘implementation’) have been delivered.
It is important to note that owing to time lags and data availability, the latest research and analysis in this report will capture different stages of automatic enrolment implementation (for example, analysis may fall before or after the planned minimum contribution increases in April 2018 and April 2019). The data source underlying the research and analysis presented and the period being captured is noted in the supporting commentary. The DWP’s biennial Employers’ Pension Provision (EPP) survey[footnote 11] is an important source of evidence throughout the report. Headlines from the recently conducted 2019 EPP survey, for which a full report is planned for publication in 2020, are included where possible[footnote 12]. However, in other cases, EPP 2017 remains our most recent source of evidence at this stage.
1.3. Report structure
The structure of this year’s report is as follows:
- delivery of reforms (Chapter 2)
- employers’ implementation of reforms (Chapter 3)
- impact of automatic enrolment on individuals and saving (Chapter 4)
- wider impact of automatic enrolment and developments to the pensions landscape (Chapter 5)
- conclusion (Chapter 6)
2. Delivery of reforms
This chapter encompasses key findings from research and analysis on the delivery of the National Employment Savings Trust (Nest); The Pensions Regulator (TPR)’s compliance regime; and DWP and the Regulator’s communication strategies in relation to automatic enrolment. This relates to the following evaluation strategy question:
Do established delivery mechanisms support automatic enrolment objectives? (EQ1)
Summary
Existing evidence
-
since the start of automatic enrolment in 2012, more than 10.2 million workers have been automatically enrolled, and over 1.6 million employers have met their duties, with 709,000 workers having been automatically re-enrolled and 342,855 employers having met their re-enrolment duties by the end of 2019
-
as of the end of March 2019, National Employment Savings Trust (Nest) membership stood at 7.9 million members, with over 720,000 employers
2.1. Role of The Pensions Regulator
The role of The Pensions Regulator (TPR) is to maximise compliance with the employer duties and safeguards set out in legislation, using a risk-based approach to deter, prevent or address non-compliance. It is also the UK regulator of workplace pension schemes, including limited aspects of workplace personal pensions.
2.1.1. Communicating reforms to employers and their advisers
TPR aims to help employers understand what they need to do, and when, in order to meet their automatic enrolment duties. TPR operate a communications strategy based on direct engagement with employers, and through their advisers, which involves writing (via emails and letters) at key intervals. Previously, this would have been during the roll out of automatic enrolment to different sized employers in relation to the date that their automatic enrolment duties start, and more recently, to inform them of the planned April 2019 minimum contribution increase[footnote 13].
In TPR’s Winter 2019 Ongoing Duties Survey[footnote 14], employers were asked how they first became aware of the planned increase in minimum contributions in April 2019. A wide range of sources were mentioned but the most common were emails or letters from TPR (36 per cent of micro employers, 42 per cent of small employers and 32 per cent of medium employers).
For all new employers, TPR sends them an information pack containing details of their duties start date and declaration of compliance deadline, based upon the first day of employment of their first worker. This pack contains guidance on how to complete their automatic enrolment duties, with links to relevant online tools and information on the TPR website.
TPR’s Adviser Engagement 2019 report surveyed relevant advisers operating in the automatic enrolment market (accountants, bookkeepers, payroll administrators, and independent financial advisers)[footnote 15]. The research found that the TPR website was the most widely used active channel by accountants (91 per cent), payroll administrators (94 per cent) and bookkeepers (85 per cent). An active channel is a source an adviser would use if they needed specific information or assistance about automatic enrolment. TPR’s website was also the most heavily relied upon channel by these advisers (between 56 per cent to 60 per cent).
Advisers were also asked about the channels through which they received information about automatic enrolment. 88 per cent of accountants, 94 per cent of payroll administrators and 85 per cent of bookkeepers received client-specific emails or letters from TPR (that either came direct to the adviser or were forwarded to the adviser by their client). In terms of advisers’ reliance on these channels, to ensure they had the information on automatic enrolment they needed, the majority of accountants (52 per cent), payroll administrators (61 per cent) and bookkeepers (59 per cent) reported that they relied heavily on client-specific emails and letters from TPR.
2.1.2. Declarations of compliance
TPR publishes monthly information about the number of employers who have complied with their duties by completing their declaration of compliance and reporting on the number of eligible jobholders automatically enrolled[footnote 16]. Since July 2012, up to the end of December 2019, 1,609,947 employers had declared their compliance with the duties, with over 10.2 million workers automatically enrolled. Similarly, 342,855 employers had confirmed that they had completed their re-declaration of compliance, with 709,000 workers having been automatically re-enrolled.
The data also show that 12.11 million workers were not automatically enrolled because they were already active members of a qualifying workplace pension scheme or had Defined Benefit (DB) or hybrid scheme transitional arrangements applied to them. A further 9.6 million workers were not automatically enrolled as they did not meet either the earnings or age criteria at the time (e.g. a worker who earned over £10,000 per year, but was aged under 22 years old would not be automatically enrolled).
Additional detailed analysis of declaration of compliance data is available in the regulator’s 2019 ‘Automatic enrolment: commentary and analysis’ report[footnote 17].
2.1.3. Enforcement
TPR’s approach is to tell employers what they must do to comply with the law in the first instance, but where it encounters non-compliance, TPR uses its powers to ensure that employers comply with their legal obligations. Its approach to maximising compliance is set out in its compliance and enforcement strategy[footnote 18] and policy[footnote 19].
TPR publishes information on a quarterly basis about its cases and the powers it has used relating to automatic enrolment and associated employer duties[footnote 20]. From July 2012 to the end of September 2019, the regulator had concluded 319,720 cases investigating possible non-compliance by employers. Between July and September 2019, TPR continued to use its powers: in Q2 2019/20 it served 11,202 compliance notices, with most employers subsequently complying when given this prompt to remind them of their duties.
Since the start of the year, TPR has carried out country-wide inspections or ‘spot checks’. Employers are identified through data and intelligence analysis and scheduled for either desk-based investigation or an inspection in person at their place of business. In the first quarter of 2019/20, 74 per cent of spot checks revealed breaches of pensions legislation, with 76 per cent of these resulting in enforcement action[footnote 21].
Between April 2018 - March 2019, TPR used its formal powers on 128,807 occasions. The proportion of formal notices has increased significantly due to TPR transitioning from enforcing against medium employers to the higher-volume small and micro employers. More information can be found in the 2019 ‘Automatic enrolment: Commentary and analysis’ report[footnote 22].
2.1.4. Employer forecast
During the rollout of automatic enrolment, TPR were largely focused on compliance amongst large volumes of staged employers, and re-enrolment for the largest employers. Following the end of the policy’s implementation period, the focus shifted to the steady volumes of new employers, and the re-enrolment of staged employers.
All employers will still be subject to some duties even if they do not employ eligible staff, such as needing to provide information to their employees and declaring their compliance with TPR. If their staff ask to join or opt in to a pension scheme, they will need to meet their request. They should also monitor the age and earnings of their staff and enrol any future workers who are eligible, or existing ones that later trigger eligibility (e.g. when a 21 year-old turns 22).
TPR included a forecast of employers who are expected to have automatic enrolment duties to the end of 2020/21 in its 2019 ‘Automatic enrolment: Commentary and analysis’ report[footnote 23]. This is a forecast, so the data is presented as a range of the number of employers who are due to reach their duties start date and have eligible jobholders to automatically enrol based on a lower and upper estimate, as illustrated by Figure 2.1.
Figure 2.1 - Quarterly forecast of employers due to comply with automatic enrolment
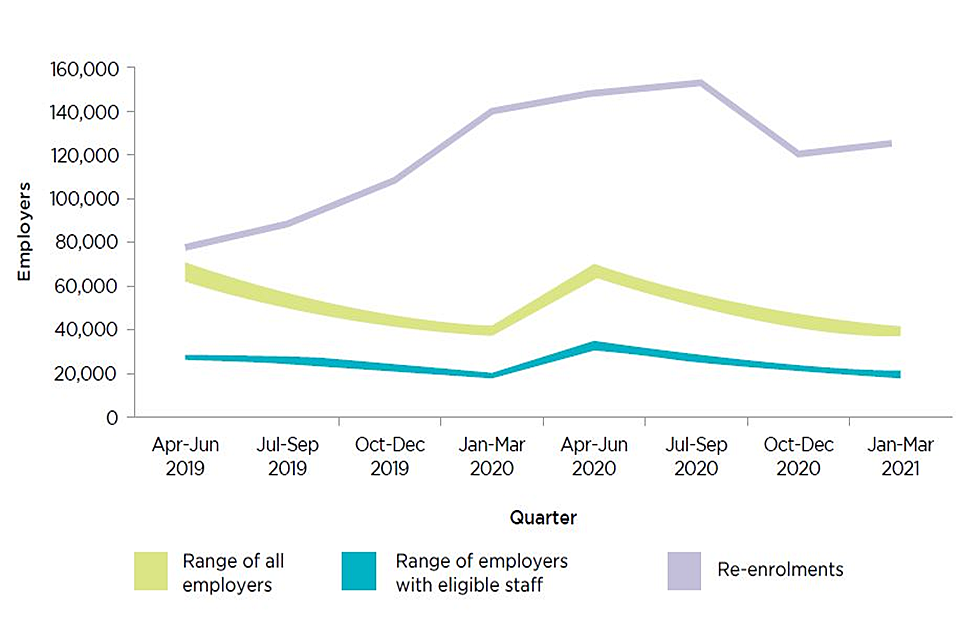
Figure 2.1 - Quarterly forecast of employers due to comply with automatic enrolment
Source: TPR forecast from “Automatic enrolment: Commentary and analysis: April 2018 – March 2019”.
The forecast is, by its nature, uncertain and does not account for future economic factors, threshold changes or the effect of the National Living Wage, to give a few examples. It also does not account for cases where employers may come into existence or cease to exist as a result of changes to financial or legal status.
2.2. Communicating reforms to individuals
To assist the delivery of the reforms, DWP has delivered advertising campaigns to raise awareness and understanding of automatic enrolment among individuals and employers. Launching in 2012, the campaigns have aimed to build awareness of workplace pensions amongst employees and help employers recognise their responsibilities. Campaign activity has continued to evolve through employer staging and the planned increases in minimum contribution levels.
Over the last few years, wider pensions campaigns have been aligned under a single ‘Get to know your pension’ branding, ensuring clear links between Workplace Pensions messaging and wider retirement planning nudges. The latest iteration of the campaign, using the “You Work, Your Pension Works” creative approach, launched in October 2017 and is planned to run through until Summer 2020.
Messages for individuals are benefits led, reminding employees that a workplace pension is like having another you, at work, helping you earn money for when you retire. Campaign activity runs across multiple channels including television, video on demand, radio, digital and social media. This included a media partnership with the Channel 4 programme Gogglebox, to support the second planned increase in minimum contributions.
DWP monitors campaign activity through a communications tracking survey, measuring awareness, positivity, social norms and intention. The most recent wave (April 2019) showed that overall campaign recognition was 76 per cent and broadly consistent with previous waves (Figure 2.2)[footnote 24].
Figure 2.2 - Awareness of DWP communications campaign activity, Nov 2014 – Apr 2019
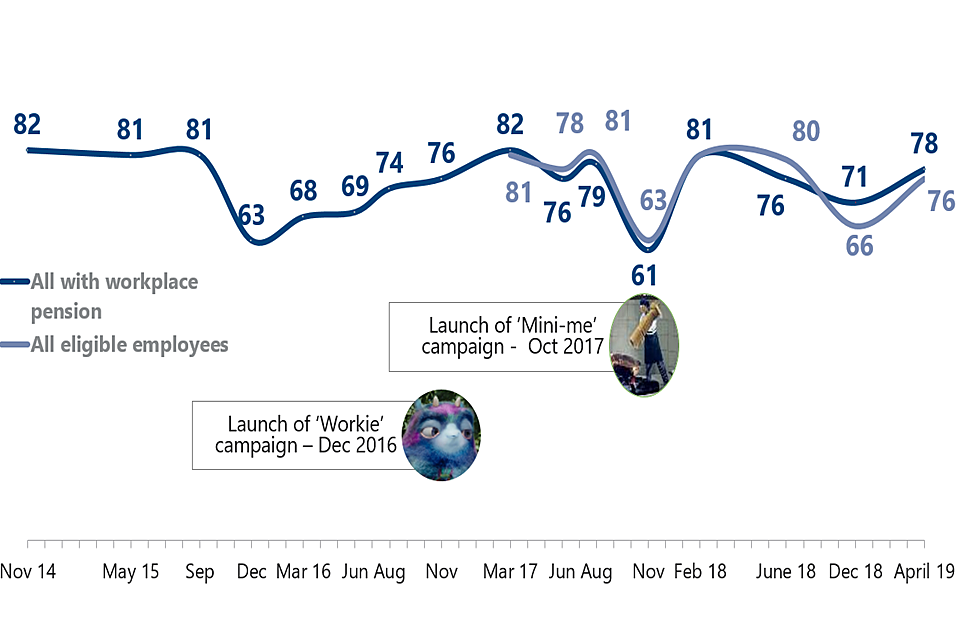
Figure 2.2 - Awareness of DWP communications campaign activity, Nov 2014 – Apr 2019
Source: Workplace Pension: research into saving for retirement, communications tracker (2014 – 2019).
Results from the communications tracker survey are covered in more detail in section 4.4.
2.3. Nest
The National Employment Savings Trust (Nest) is a workplace pension scheme established in 2010 with a primary purpose to support the introduction of automatic enrolment. It is a trustee-governed automatic enrolment qualifying scheme. In 2011, Nest began on a voluntary basis in preparation for the first wave of employer duties from September 2012. It is subject to a Public Service Obligation (PSO) to accept all employers wanting to join the scheme to fulfil their automatic enrolment duties.
The Nest Corporation’s annual report for 2018/19[footnote 25] outlined what Nest had achieved over the year from April 2018 to the end of March 2019. Significant results over the year as of March 31st 2019 included:
- Nest’s membership had risen to 7.9 million members and over 720,000 employers, compared to 6.4 million members and 616,000 employers at the time of the 2017/18 Nest annual report[footnote 26].
- at the end of March 2019, Nest managed around £5.7 billion in assets, compared to approximately £2.7 billion at the end of March 2018.
Figure 2.3 illustrates the growth in membership and the number of employers using Nest since 2012.
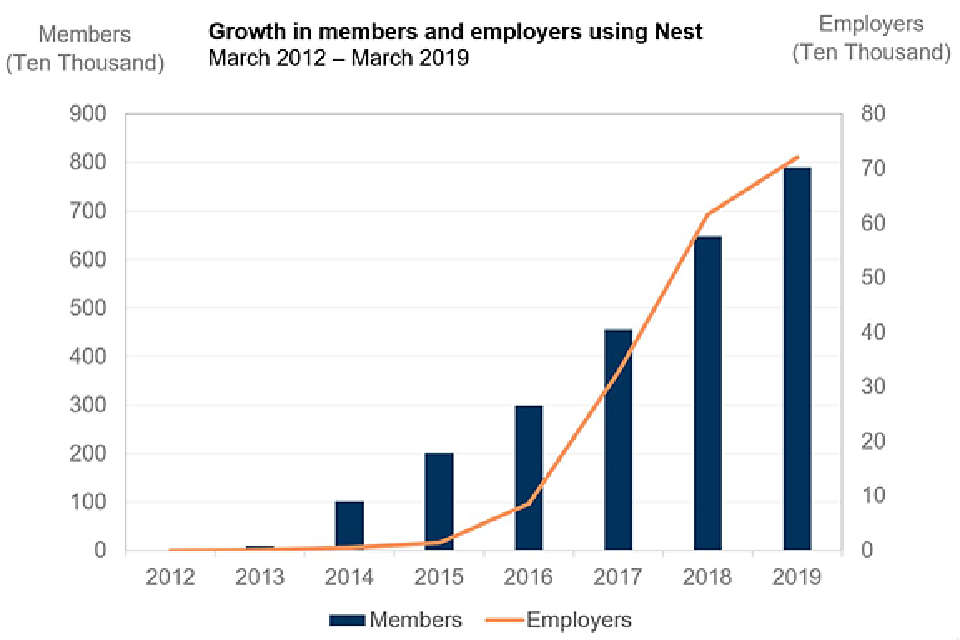
Figure 2.3 - Growth in members and employers using Nest, from March 2012 to March 2019
Source: Nest administrative data from Nest Corporation’s Annual Report and Accounts (2012 – 2019).
As at November 2019, Nest’s membership had further risen to over 8.6 million members and 770,000 employers. Their assets under management had also increased reaching over £8.5 billion.
3. Employers’ implementation of reforms
This chapter examines how employers have responded to the requirement to implement automatic enrolment. This relates to the following evaluation strategy questions:
Do employers know about, understand and comply with their employer duties? (EQ2) To what extent is delivery achieved with minimal employer burden? (EQ5)
Summary
Existing evidence
-
levels of awareness and understanding of automatic enrolment are high. In particular, at least 91 per cent of micro, small and medium-sized employers were aware of each individual ongoing duty in relation to automatic enrolment
-
employers were typically aware of both the April 2018 and April 2019 increases in contributions, and had relatively neutral attitudes towards the rise
-
virtually all medium and large employers (97 per cent and 99 per cent respectively), and the vast majority of small employers (84 per cent), stated that they had automatically enrolled employees into a qualifying pension scheme by late 2017
-
whilst there were early concerns amongst large employers that ongoing administration tasks relating to automatic enrolment could become a burden, attitudes became increasingly positive as rollout progressed and employers became used to the new processes. Most employers interviewed in 2016 and 2018 found the cost and time burden involved with implementing automatic enrolment to be lower than they had initially anticipated
New analysis within this report
-
in 2019, the majority (62 per cent) of private sector employers currently had some form of workplace pension provision, up from 47 per cent in 2017. These organisations employed 94 per cent of all private sector employees
-
in 2019, less than four in ten private sector employers (39 per cent) stated that the introduction of automatic enrolment had resulted in an increase in the total pension contributions that their organisation had to make. However substantial variation existed by employer size
3.1. Employer awareness, understanding and activity
3.1.1. Initial automatic enrolment duties
Automatic enrolment began in October 2012 with the largest employers (250 or more employees) and then continued in a series of stages of decreasing employer sizes until its complete roll out in 2018. Since 2018, the only organisations with initial automatic enrolment duties are ‘newborn’ employers. During the staged rollout of the policy, DWP commissioned a series of qualitative research studies to explore views and experiences of automatic enrolment amongst employers who were implementing the policy at various stages.
Most recently, interim findings from DWP qualitative research with ‘newborn’ employers suggest that individuals responsible for implementing automatic enrolment had typically been aware of the requirement due to their seniority within their current company and previous companies[footnote 27]. These individuals would often hold Human Resources responsibilities.
This research interviewed two groups of ‘newborn’ employers: those who took on their first workers between 2012 and 2017 who were required to implement automatic enrolment by February 2018, and ‘instantaneous newborn’ employers (employers who were required to implement automatic enrolment immediately from October 2017 onwards).
In instantaneous newborns, prior experience of automatic enrolment implementation was even more common. The person responsible for setting it up had usually been employed at a previous workplace when automatic enrolment was introduced. Some employers also mentioned having heard about automatic enrolment in the media ahead of setting it up at their current workplace.
3.1.2. Ongoing automatic enrolment duties
Micro, small and medium employers’ awareness and understanding of their ongoing automatic enrolment duties was assessed in a recent TPR-commissioned report[footnote 28]. There are five ongoing duties for employers (in addition to re-enrolment), which are as follows:
- keeping records of all automatic enrolment activities
- monitoring the ages and earnings of new and existing staff every time they are paid to check whether they are eligible to join the pension scheme
- enrolling staff and informing them as they become eligible to join the pension scheme
- managing requests to join or leave the pension scheme
- paying contributions into the employees’ pension scheme (at the legal minimum contribution rates)
Key findings from the Winter 2019 report included[footnote 29]:
- at least 91 per cent of employers across all three sizes were aware of each of the five individual ongoing duties in relation to automatic enrolment
- as in previous surveys[footnote 30], the majority of employers (82 per cent of micro, 87 per cent of small and 93 per cent of medium) did not report any difficulty keeping up with their ongoing duties. 63 per cent of micro, 63 per cent of small and 70 per cent of medium found them less onerous than expected. Furthermore, almost all the employers were confident that their organisation was fully compliant with its ongoing duties (ranging from 98 per cent to 100 per cent)
- 81 per cent of micro and 91 per cent of small employers interviewed, all of which were in their re-enrolment window at the time, were aware of the re-enrolment requirement
- 74 per cent of micro employers knew that minimum contributions would increase again (in April 2019), compared with 87 per cent of small and 94 per cent of medium employers. This was an increase from the awareness levels seen in Summer 2018 for micro employers (+10 percentage points)
- since TPR’s Summer 2018 report[footnote 31], there were no changes in the percentage of employers who thought the increases in minimum contribution levels in April 2019 were a good idea (54 per cent of micro, 59 per cent of small employers and 75 per cent of medium)
- over half of micro (54 per cent) and small employers (52 per cent) disagreed they would find it difficult to afford the increase minimum employer contributions. 65 per cent of medium employers disagreed, a 10 percentage point increase from Summer 2018
Similar findings were reported in the interim report of DWP’s Automatic enrolment: qualitative research with newborn employers:
- those with an ongoing relationship with an intermediary often asked them to take on the monthly administration of automatic enrolment as part of that relationship, but in rare cases employers were also willing to pay an ad hoc fee for consultative support with understanding their duties and choosing a provider
- employers were typically aware of both the previous April 2018 and the future (at the time of interview) April 2019 increases in contributions, and felt relatively neutral about the rise. Generally, employers said that they were confident about being able to pay these new rates and were relaxed about the cost, which they perceived as a small proportion of their overall costs
- employers were occasionally somewhat concerned about the impact of pension contributions upon general cash flow; though did not typically identify any specific cut-backs that they felt they needed to make in order to afford the ongoing cost of administering automatic enrolment.
3.1.3. Extent of employers’ pension provision
The DWP’s Employers’ Pension Provision (EPP) survey measures the extent and nature of pension provision among private sector employers in Great Britain.
EPP 2017 found that virtually all medium and large employers (97 per cent and 99 per cent respectively), and the vast majority of small employers (84 per cent), stated that they had automatically enrolled employees into a qualifying pension scheme by the time of fieldwork for the survey[footnote 32]. Micro employers were less likely to have automatically enrolled staff (31 per cent), reflecting that only around two-fifths (42 per cent) of micro employers stated they had passed their staging date at the time of interview for the 2017 survey.
Following the last employer staging date in February 2018, all employers are legally obliged to automatically enrol their eligible jobholders into a workplace pension scheme if they are not already in one. The 2019 EPP survey, to be published later in 2020, found that the majority (62 per cent) of private sector employers currently have some form of workplace pension provision (Table 3.1). The proportion of private sector employers with some form of workplace pension provision has risen significantly since the introduction of automatic enrolment. In 2013, this stood at 19 per cent, increasing to just under half (47 per cent) in 2017. A further 15 percentage point increase is observed between 2017 and 2019. In 2019, organisations who have some form of workplace pension provision employed 94 per cent of all private sector employees.
Table 3.1 - Workplace pension provision, by size of organisation, 2013, 2017 and 2019
Private sector employees
| Pension provision | 2013 (%) | 2017 (%) | 2019 (%) |
|---|---|---|---|
| Any workplace pension scheme | 19 | 47 | 62 |
| Size of organisation: Micro (1-4 employees) | 9 | 35 | 51 |
| Size of organisation: Small (5-49 employees) | 41 | 89 | 97 |
| Size of organisation: Medium (50-249 employees) | 80 | 98 | 98 |
| Size of organisation: Large (250+ employees) | 96 | 99 | 99 |
Employees working for such employers
| Pension provision | 2013 (%) | 2017 (%) | 2019 (%) |
|---|---|---|---|
| Any workplace pension scheme | 76 | 91 | 94 |
| Size of organisation: Micro (1-4 employees) | 8 | 43 | 61 |
| Size of organisation: Small (5-49 employees) | 51 | 92 | 97 |
| Size of organisation: Medium (50-249 employees) | 83 | 98 | 98 |
| Size of organisation: Large (250+ employees) | 99 | 100 | 100 |
Base: All private sector employers as indicated by row headings. Unweighted base for estimates for all employers is 2,948 in 2019, 2,713 in 2017 and 3,043 in 2013.
Note: In 2017 and 2019, ‘Any workplace pension provision’ refers to the provision of an occupational scheme, a GPP scheme, a workplace-based SHP scheme, access to the NEST scheme or access to a Master Trust scheme (other than NEST). It thus excludes contributions to personal pensions. Access to a Master Trust scheme other than NEST is not included in the 2013 figures as this information is not available in the 2013 data.
Source: Employers’ Pension Provision survey 2019.
Splitting the results by employer size, in 2019, 99 per cent of large employers, 98 per cent of medium, 97 per cent of small and 51 per cent of micro employers provided a workplace pension scheme. Since EPP 2017, substantial increases in pension scheme provision have taken place amongst small employers (8 percentage points) and micro employers (16 percentage points). The proportion of medium and large employers providing a workplace pension scheme to their employees has remained almost universal since 2017.
3.1.4. Employers going beyond the minimum requirements
The minimum contribution rate required for employers has increased over time. Initially employers were required to contribute a minimum of one per cent on a band of qualifying earnings, with this increasing to two per cent in April 2018 and to three per cent in April 2019.
EPP 2017 asked employers whether they were phasing in the level of contributions at the time, or whether they were already contributing at least three per cent[footnote 33]. In two-thirds (66 per cent) of schemes used for automatic enrolment, contributions were being phased in, while in around one quarter (24 per cent) of such schemes, employers were contributing at least three per cent from the start. For around one in ten schemes (11 per cent) respondents did not know whether they were phasing in contributions or not. Contributing at least three per cent from the start was more common among micro (30 per cent) and large employers (35 per cent) than small (17 per cent) and medium employers (26 per cent). The most common reason for contributing at least three per cent from the start was that employers wanted to offer a better option for their employees, applying to 44 per cent of such schemes.
DWP’s survey with small and micro employers, conducted at approximately the same time as EPP 2017, found that 21 per cent of these employers offered more than the then-minimum contribution of one per cent[footnote 34].
3.1.5. Pension scheme choice
DWP research with ‘newborn’ (new) employers in 2018 explored the drivers of employers’ decision making when selecting a pension scheme for automatic enrolment[footnote 35]. Whilst previous jobs meant some employers in the study had been involved in selecting a provider before, most were selecting the first pension scheme ever to be offered at their workplace. The research found that these employers often had little knowledge of the providers offering automatic enrolment schemes, or of the differences between providers. This was also a common finding for the small and micro employers interviewed in 2016 as part of research study published the following year[footnote 36].
It was common for newborn employers to spend only a little time researching providers and to consider only one provider seriously. While some employers explained they had considered two or three providers, these were the exception. Employers’ limited research into available providers was typically due to a cautious attitude to compliance, and willingness to follow what they saw as an authoritative recommendation.
The typical decision-making process followed by newborn employers was to choose Nest in the first instance, unless they were prompted to do otherwise by some external factor. Where employers considered an alternative provider to Nest, this was usually triggered by a recommendation from a third party. Research with small and micro employers in 2017 indicated similar approaches. Most of these employers governed their selection of a pension scheme around the schemes ease of set up and use as well as its reliability, often choosing the “safest option” which was seen to be Nest.
Making decisions around which qualifying scheme to enrol members into was slightly less simple for larger employers who staged earlier because some of them already had some kind of pension scheme in place prior to automatic enrolment[footnote 37]. For those employers DWP spoke to staging in 2014 - which were predominantly medium sized - most set up a new pension scheme for automatic enrolment[footnote 38]. Some of these employers used advisers to review other providers, however if the employer took responsibility for reviewing this themselves, the majority tended to describe only looking at new master trusts (e.g. Nest, Now Pensions, The Peoples Pension).
The DWP survey with small and micro employers in 2017 found that 90 per cent of these employers had sought advice or guidance on choosing their new workplace pension scheme[footnote 39]. Most commonly, they approached an accountant or financial services firm (49 per cent), TPR (28 per cent), pension providers (27 per cent), payroll providers (22 per cent), Independent Financial Advisers (IFAs) (18 per cent) or pensions advisers (12 per cent). Nest was the most popular pension provider amongst small and micro employers (chosen by 58 per cent), followed by The People’s Pension (11 per cent) and a range of other providers (each chosen by three per cent of employers or fewer).
3.2. Employer burden and responses
3.2.1. Administrative costs
Recent TPR research[footnote 40] investigated the ongoing financial and time costs of automatic enrolment. Over three-quarters of micro (78 per cent), small (77 per cent) and medium (83 per cent) employers had not incurred any additional ongoing costs in meeting their duties (beyond their staff’s time). For the minority who did pay for support, the median monthly cost varied from £15 for micro employers, £50 for small employers and £100 for medium employers. Both the proportion of employers incurring no additional costs and the median costs for those who paid for support have shown no significant change since the TPR survey of employers in Summer 2018.
The most recent evidence on initial costs of automatic enrolment remains the 2017 EPP survey[footnote 41]. EPP 2017 found that just over half (52 per cent) of employers reported that the introduction of automatic enrolment had resulted in an increase in administrative costs. Around two-fifths (44 per cent) of employers stated that administrative costs had not increased, while the remaining four per cent said that they did not know. Micro employers were less likely to report that administrative costs had increased compared with larger employers; 46 per cent of micro employers reported an increase in administrative costs compared with 62 per cent of large employers.
In 2017, small and micro employers (the group that were then staging) were asked how much it cost to implement automatic enrolment in a separate DWP survey[footnote 42]. The median level of cost reported was £400: £200 for micro employers (one to four employees) and £500 for small employers with up to 29 employees.Around a third (35 per cent) of micro employers and one fifth (20 per cent) of small employers reported zero cost to implement automatic enrolment.
3.2.2. Contribution costs
Evidence from DWP’s series of qualitative research studies on automatic enrolment suggest that employers’ attitudes towards contribution costs have remained fairly consistent throughout the policy’s implementation period.
Generally, large employers interviewed in 2013 felt relatively able to accommodate the employer contribution costs[footnote 43]. However, for those with large workforces who were not previously enrolled in a workplace pension, the cost of ongoing employer contributions was sometimes substantial enough for them to want to delay taking on that cost for as long as possible.
Research with employers staging in 2014[footnote 44], and with small and micro employers in 2016[footnote 45] found that some employers anticipated they’d need to think about measures to reduce costs as employer contributions rose. Employer contributions could also be seen to represent more of a financial burden for smaller organisations. However, such concerns were rare among newborn employers interviewed in 2018: these employers did not typically identify any specific cut-backs that they were planning to make in order to afford the cost of administering automatic enrolment in future[footnote 46].
Newborn employers were typically aware of both the previous April 2018 and the future April 2019 increases in contributions, and generally said that they were confident about being able to pay these new rates.
The 2019 EPP survey found that less than four in ten private sector employers (39 per cent) stated that the introduction of automatic enrolment had resulted in an increase in the total pension contributions that their organisation had to make[footnote 47]. Significant variation existed by employer size. In 2019, 27 per cent of micro employers reported experiencing an increase in total pension contributions, compared with 78 per cent of small employers, 83 per cent of medium employers and 82 per cent of large employers.
3.2.3. Responses to costs incurred through implementing automatic enrolment
EPP 2019 investigated what actions employers had taken to absorb increased contribution costs, if they reported that these costs had increased as a result of automatic enrolment. The most common action reported was that these costs had been absorbed as part of other overheads (68 per cent). The next most common responses were that employers had: taken a reduction in profits (52 per cent) or increased prices (13 per cent). Only seven per cent of employers who reported experiencing increased costs as a result of automatic enrolment said they had implemented lower wage increases, six per cent said they had changed an existing pension scheme and five per cent reported restructuring or reducing their workforce to absorb these costs. Just one per cent of employers had reduced contribution levels for existing members prior to the reforms. 15 per cent of employers reported adopting none of the stated actions to absorb increased contribution costs.
Overall, the most common actions employers report taking have remained at similar levels since the 2017 EPP survey. Table 3.2 shows employers’ strategies to absorb increases in total pension contributions, by size of organisation in 2019.
Table 3.2 - Employers’ strategies to absorb increase in total pension contributions, by organisation size (per cent)
Size of organisation (employees)
| Employers’ strategies | Micro (1-4) (%) | Small (5-49) (%) | Medium (50-249) (%) | Large (250+) (%) | All private sector employers reporting an increase in contributions (%) |
|---|---|---|---|---|---|
| Absorbed as part of other overheads | 68 | 68 | 64 | 61 | 68 |
| Reduction in profits | 52 | 54 | 51 | 41 | 52 |
| Increased prices | 10 | 17 | 18 | 14 | 13 |
| Lower wage increases | 3 | 11 | 12 | 10 | 7 |
| Changed existing pension scheme | 4 | 7 | 15 | 12 | 6 |
| Re-structured/reduced workforce | 3 | 6 | 6 | 4 | 5 |
| Reduced contribution levels for existing members prior to reform | 2 | 0 | 2 | 2 | 1 |
| Other | 0 | 0 | 1 | 1 | 0 |
| None of these | 16 | 14 | 14 | 18 | 15 |
| Unweighted base | 187 | 909 | 362 | 669 | 2,127 |
Source: Employers’ Pension Provision survey 2019.
3.2.4. Employer views and attitudes on the level of burden
The previously mentioned series of DWP qualitative research studies conducted with employers throughout the implementation of automatic enrolment included asking questions about any associated burdens employers may face.
Early qualitative research with large employers[footnote 48] indicated that ongoing administration could become a burden for employers when they were required to identify and process large numbers of new workers on a regular basis. However, research conducted in 2014[footnote 49] found that employers implementing at the time commonly expected the administrative tasks to get quicker and easier as they became more accomplished at running these processes. Some employers who had initially perceived implementing automatic enrolment to be complex and time-consuming indicated a change in their attitudes since completing the process, becoming more favourable to the idea now the pension was in place.
A 2016 study of small and micro employers[footnote 50] suggested that most employers found the cost and time burden involved with implementing automatic enrolment to be lower than they had initially anticipated, a view echoed by newborn employers in a 2018 study[footnote 51]. In 2018, newborn employers typically measured the amount of time given over to complying with their duties in hours, rather than days or weeks and were rare to express any concern about the expected burden to be placed on them by the ongoing administration of automatic enrolment.
A recent TPR survey[footnote 52] found that the majority of employers (82% of micro, 87% of small and 93% of medium) did not report any difficulty keeping up with their ongoing duties. Since the survey begun in Winter 2017, this proportion has remained in excess of 80% across all employer sizes. In the latest survey, around two-thirds of employers (63% of micro, 63% of small and 70% of medium) also said that they found their duties less onerous than expected.
4. Impact of automatic enrolment on individuals and saving
This chapter looks at the impact that automatic enrolment has had on individuals and the amount being saved in workplace pensions. This relates to the following evaluation strategy questions:
Has automatic enrolment increased the number of individuals saving in workplace pensions, and if so, how? (EQ3)
Has automatic enrolment increased the amount being saved in workplace pensions, and if so, how? (EQ4)
Summary
Existing evidence
-
data collected up to 2018 found that the number of eligible employees participating in a workplace pension has increased to 18.7 million (87 per cent), up from 10.7 million (55 per cent) in 2012
-
the annual total amount saved on behalf of eligible employees across both sectors stands at £90.4 billion in 2018, which is an increase of £7 billion from 2017. Annual total amounts increased in both public and private sectors from 2017. The public sector increased by around £2.5 billion and the private sector by £4.5 billion
New analysis within this report
-
the proportion of workplace pension savers who made an active decision to stop saving (including opt-out and cessation) shows a slight increase from the 2018/19 financial year to the first quarter of the 2019/20 financial year (0.72 to 0.76 per cent), following the second increase of the automatic enrolment minimum contribution rates. Despite this slight increase, the overall rate remains low
-
from April 2018 onwards, the period in which the increases to minimum contribution rates took place, the largest increases in rates of stopping saving (due to active decisions) were observed among those aged 22 to 29 and 30 to 39 (0.23 percentage points and 0.15 percentage points respectively). These increases are modest but notable relative to other age groups where the changes observed are negligible
-
between April 2014 and June 2019, the average active decision stopping saving rate was slightly higher for males (0.76 per cent) than for females (0.59 per cent)
-
throughout the implementation period of automatic enrolment, the cohort opt-out rate has remained consistently low. Overall, among employers with a scheme used for automatic enrolment, nine per cent of employees who were automatically enrolled in the 2018/19 financial year (prior to the April 2019 minimum contribution rate increase) decided to opt out within one month. This rate remained at the same level as in 2016/17
-
findings from the DWP’s communications tracking research (April 2019 wave) found that the majority of individuals interviewed viewed automatic enrolment as a good thing for them personally (79 per cent); agreed saving into a workplace pension was normal for them (77 per cent); and knew where to go if they wanted to find more about workplace pensions (75 per cent)
-
evidence from the British Social Attitudes (BSA) survey indicates that “social norming” of workplace pensions has occurred across all eligible age groups and occupational classifications<
-
in 2018, the number of employees contributing two per cent or above to a workplace pension (as a proportion of their reported pensionable pay) was almost 10.3 million following the first increase in the minimum contribution rates in April 2018. In 2017, this number stood at approximately 6 million
-
eligible employees in the private sector with total contributions above the 2018 minimum are more likely to belong to older age brackets, have higher earnings and work for larger employers. However, the proportion belonging to younger age brackets, with lower earnings and working for smaller employers has increased significantly over time
-
in April 2018, the number of employees receiving employer contributions of two per cent or above (as a proportion of their reported pensionable pay) increased to over 9.4 million after the first increase in the minimum contribution rates in April 2018. In 2017, this number stood at approximately 7 million
-
in April 2018, the number of eligible private-sector employees who were making contributions sufficient to meet the 2019 minimum requirements had risen to approximately 6.4 million. A further 6.9 million may have needed to increase contributions to meet the 2019 minimum requirements
4.1. Trends in workplace pension participation
This section looks at measures indicating the effects of automatic enrolment on increasing the number of savers participating in workplace pensions. The Department for Work and Pensions’ (DWP) analysis of the Office for National Statistics’ (ONS) Annual Survey of Hours and Earnings (ASHE) data estimates the pension participation trends of eligible employees[footnote 53], [footnote 54] over time. This is broken down according to public and private sector, employer size, employee earnings, and certain protected groups (gender, age, disability and ethnicity)[footnote 55]. The DWP Family Resources Survey (FRS)[footnote 56] provides specific characteristic breakdowns that are not accounted for by ASHE.
Together these annual surveys can monitor shifts in workplace pension participation since the reforms were introduced. The most recent ASHE data including pension information[footnote 57] were collected with reference to April 2018, showing significant increases in participation and pension saving. The FRS data were collected throughout the 2017/2018 financial year. Therefore any potential impact of automatic enrolment may be lessened, in the FRS data, because not all employees will have been automatically enrolled at the time due to the staged implementation approach[footnote 58].
4.1.1. Overall number of savers
Between 2008 and 2012 there was a general downward trend in workplace pension participation, from 59 per cent (11.8 million eligible employees) to 55 per cent (10.7 million). However, since the reforms there has been a significant increase in the number of eligible employees participating in a workplace pension, up to 87 per cent (18.7 million) in 2018. Figure 4.1 illustrates trends in workplace pension participation for eligible employees by sector over time. Public sector pension participation remained high in 2018 at 93 per cent (4.9 million employees), an increase of five percentage points since 2012. Within the private sector, participation has increased by 43 percentage points since 2012, up to 85 per cent of eligible employees participating (13.9 million) in 2018.
Figure 4.1 - Eligible employees participating in workplace pensions, by sector
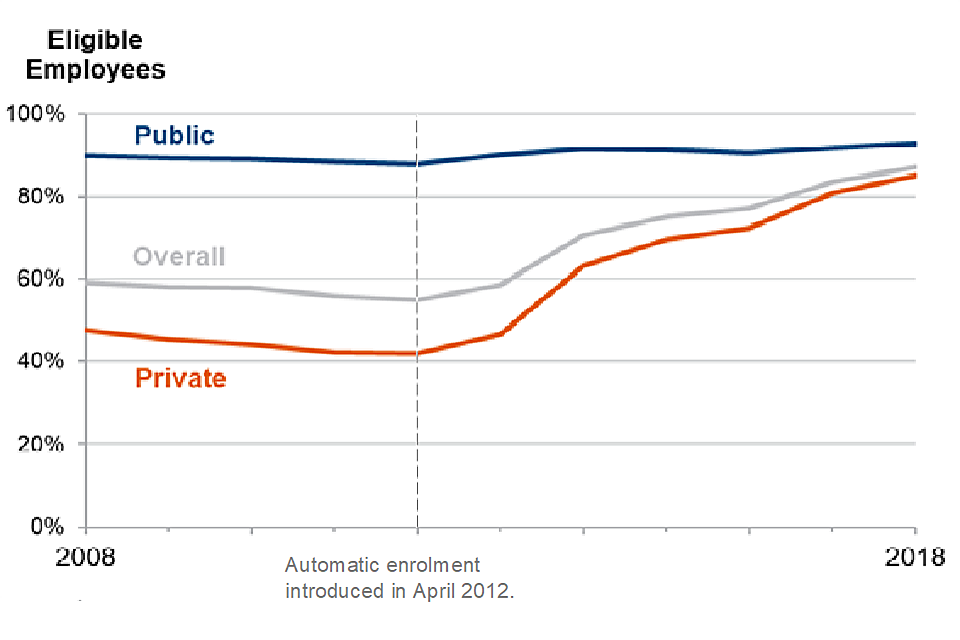
Figure 4.1 - Eligible employees participating in workplace pensions, by sector
Source: DWP estimates derived from the ONS ASHE, GB, 2008–2018.
4.1.2. Employer size
Figure 4.2 displays the proportion of eligible employees participating in workplace pension schemes by employer size. In 2018, the largest employers (5,000 or more employees) and second largest employers (250 to 4,999 employees) had the highest participation rate at 91 per cent, compared with 58 per cent for micro employers (one to four employees). This may historically be explained by the high proportions of employees working for large public sector employers where participation rates have always been high, whereas, the more recent increases correspond with the staged implementation of automatic enrolment which began with large employers.
Figure 4.2 - Eligible employees participating in workplace pensions, by employer size
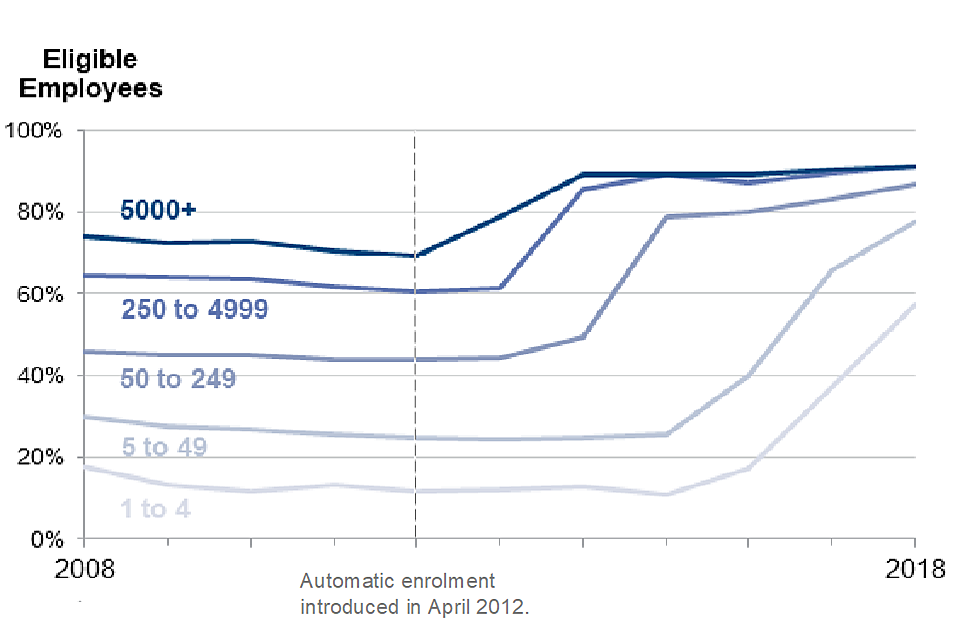
Figure 4.2 - Eligible employees participating in workplace pensions, by employer size
Source: DWP estimates derived from the ONS ASHE, GB, 2008–2018.
Overall, participation amongst eligible employees in 2018 was 87 per cent for those with 50 to 249 employees and 78 per cent for those with five to 49 employees (an increase of 13 percentage points since 2017). Increases in participation clearly align with the staging profile for implementing automatic enrolment, with the largest increases in participation from 2016 to 2018 being amongst the small and micro employers, who were undergoing staging during this period.
4.1.3. Earnings
Figure 4.3 shows the relationship between pension participation and earnings. Those who earn £50,000 to £60,000 have the highest participation levels at 93 per cent, with participation being high in the upper income brackets of £40,000 to £50,000 as well as £60,000+ at 92 per cent in 2018. However, the introduction of automatic enrolment has seen larger increases in participation amongst lower earners. For example, those earning between £10,000 (the level of the earnings trigger for automatic enrolment from 2014/15 to present for 2019/2020) and £20,000 had a workplace pension participation rate of 81 per cent as of 2018, an increase of 47 percentage points since 2012. As a result, the differences in participation rates between earning bands have narrowed since 2012.
Figure 4.3 - Eligible employees participating in workplace pensions, by gross annual earnings
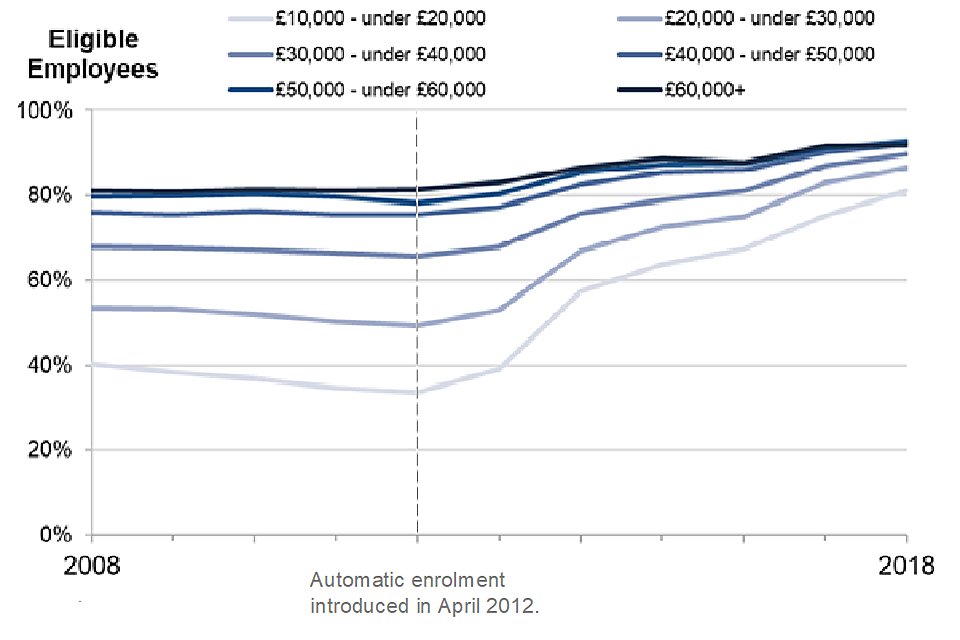
Figure 4.3 - Eligible employees participating in workplace pensions, by gross annual
Source: DWP estimates derived from the ONS ASHE, GB, 2008–2018.
4.1.4. Gender
Figure 4.4 illustrates pension participation by gender and sector. Overall, women have higher participation rates than men (88 per cent compared to 86 per cent)[footnote 59]. In the public sector in 2018, participation was 93 per cent for both men and women.
Figure 4.4 - Eligible employees participating in workplace pensions, by gender and sector
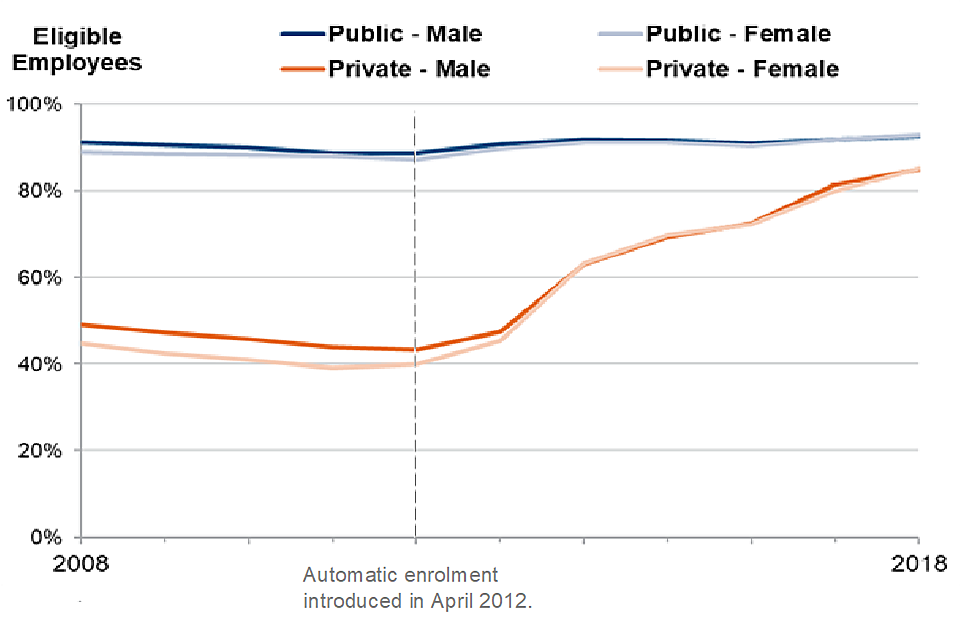
Figure 4.4 - Eligible employees participating in workplace pensions, by gender and sector
Source: DWP estimates derived from the ONS ASHE, GB, 2008–2018.
Since the introduction of automatic enrolment, the private sector has seen the largest increases in participation, and in 2018 women and men had equal participation rates at 85 per cent. This represents an increase of 42 percentage points for males and 45 percentage points for females since 2012.
4.1.5. Age
Figure 4.5 shows pension participation of eligible employees by age group. Overall, participation remained the highest for older employees, although in recent years there have been significant increases in participation amongst younger age bands, and as a result, substantial convergence in participation levels between age bands.
Figure 4.5 - Eligible employees participating in workplace pensions, by age band
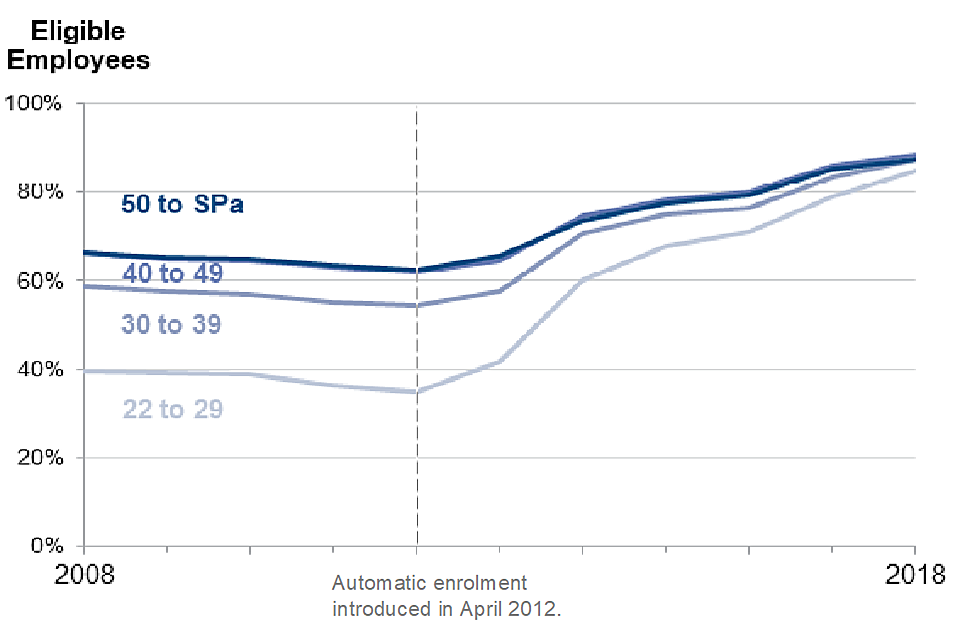
Figure 4.5 - Eligible employees participating in workplace pensions, by age band
Source: DWP estimates derived from the ONS ASHE, GB, 2008–2018.
The largest increase between 2012 and 2018 was in the youngest age band; those aged 22 to 29 saw a 50 percentage point increase in participation to 85 per cent. All other age groups also saw an increase over the same period; participation for those aged 30 to 39 increased by 33 percentage points to 87 per cent; for those aged 40 to 49 there was a 26 percentage point increase to 88 per cent; and for those aged between 50 and State Pension age (SPA) participation increased by 25 percentage points to 87 per cent.
4.1.6. Economic status
Figure 4.6 shows changes to pension participation for eligible employees compared to non-eligible employees and the self-employed. Participation of eligible employees increased from 56 per cent in 2012/13 to 80 per cent in 2017/18, reversing the decline in participation seen prior to automatic enrolment.
Figure 4.6 - Participation in all pensions, by economic status
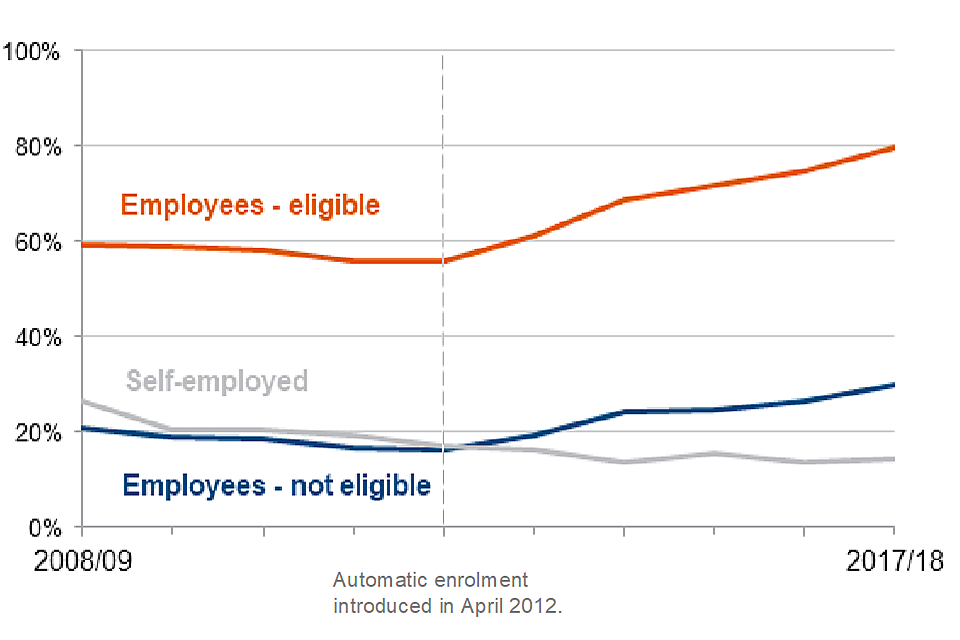
Figure 4.6 - Participation in all pensions, by economic status
Source: Modelled analysis derived from the FRS, UK, 2008/09 to 2017/18
Participation of non-eligible employees has increased from 16 per cent in 2012/13 to 30 per cent in 2017/18. In contrast, participation of self-employed workers has declined by 12 percentage points since 2008/09, falling to 15 per cent in 2017/18[footnote 60]. Self-employed workers are not captured by automatic enrolment[footnote 61]. Other categories remained relatively stable, with participation of unemployed and inactive workers extremely low as would be expected.
4.1.7. Disability
Figure 4.7 shows trends in pension participation for disabled and non-disabled employees. In 2017/18 there was a small difference between these groups: the participation rate for disabled employees was 83 per cent (an increase of 30 percentage points from 2012/13), and 80 per cent for non-disabled employees (an increase of 24 percentage points from 2012/13).
Figure 4.7 – Eligible employees participating in workplace pensions, by disability
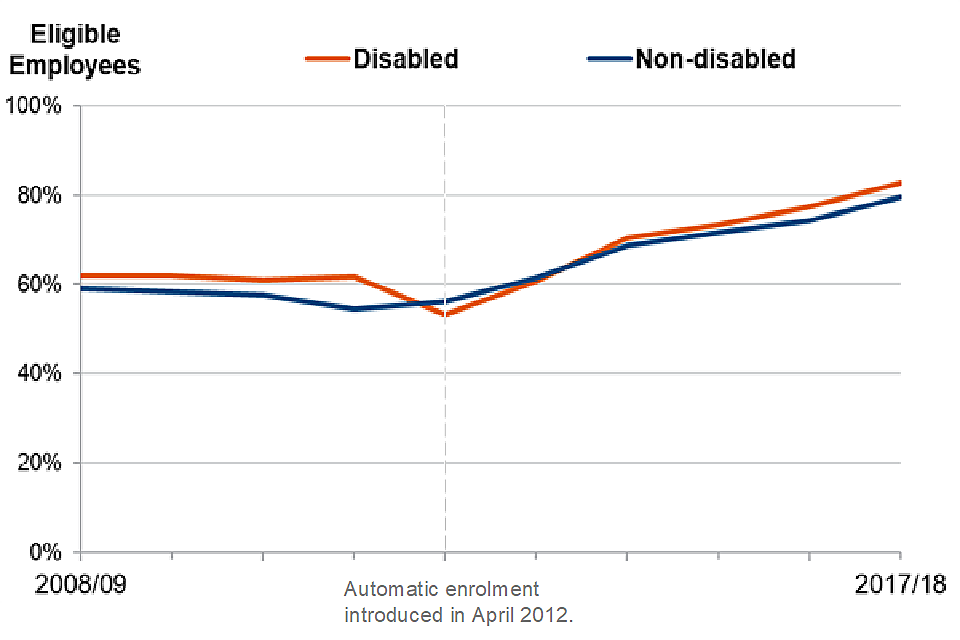
Figure 4.7 – Eligible employees participating in workplace pensions, by disability
Source: Modelled analysis derived from the FRS, UK, 2008/09 to 2017/18.
Note: Impairment types changed 2012/13 - caution needed.
4.1.8. Ethnicity
This presents trends in the pension participation rate by ethnic group. The White ethnic group still had the highest participation rate of 76 per cent in 2015/16-2017/18, this was in line with the overall participation rate of 76 per cent across all groups over this three-year period. Between the 2011/12-2013/14 period and 2015/16-2017/18 there were large increases amongst all ethnic groups. The Pakistani and Bangladeshi ethnic group showed the largest increase from 36 per cent to 60 per cent (24 percentage point increase). In comparison the lowest increase over the same period occurred in the Mixed ethnic group. This group saw a 17 percentage point increase from 53 per cent to 70 per cent.
4.1.9. Persistency of saving
In this report, persistency of saving is defined as saving into a pension in at least three out of a period of four years, calculated using ONS ASHE data. Figure 4.9 shows the estimates of persistency based on the number of years an eligible saver had been saving in a four-year period. For example, the 2018 estimate is based on the number of years saving between 2015 and 2018 among those eligible employees who were saving in 2015. This means the measure will be slow to reflect the effect of the increasing trend in workplace pension participation[footnote 62].
Figure 4.9 - Persistency of eligible employees participating in workplace pensions
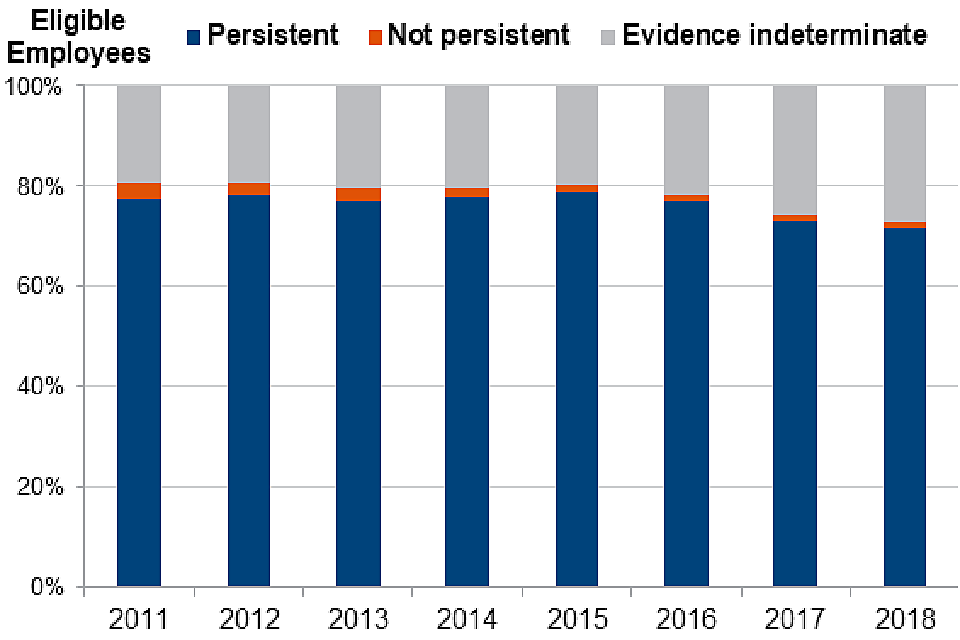
Figure 4.9 - Persistency of eligible employees participating in workplace pensions
Source: DWP estimates derived from the ONS un-weighted longitudinal ASHE, GB, 2011 to 2018
Note:
1. This analysis shows the persistency measure from 2011, as the ASHE sample was cut in the 2007 and 2008 surveys and resulted in employees for these years moving into the evidence indeterminate group due to a lack of data.
2. 2. An eligible employee can disappear from the cohort either through stopping saving, leaving the labour market, staying with or moving to an employer who does not return the ASHE questionnaire.
Figure 4.9 illustrates that overall, the majority of eligible employees are continuing to save persistently, but the rate has fallen slightly since 2015 from 79 per cent to 72 per cent in 2018. The proportion of eligible savers not saving persistently remained at one per cent in 2018, and for the remaining 27 per cent there is an indeterminate amount of evidence in the ASHE dataset to judge either way. The ‘evidence indeterminate group’ has been increasing in recent years. The reasons for this are not clear, although there has been a small decrease in the ASHE response rate since 2014. The growth in this evidence indeterminate group appears to continue to be the driver of the decrease in those identified as persistent savers.
4.2. Trends in occupational pension scheme provision
The Occupational Pension Schemes Survey (OPSS) is an annual survey of occupational pension schemes in the UK that is run by the Office for National Statistics (ONS)[footnote 63]. Unlike much of the analysis in this report, the OPSS covers all employees and not just those eligible for automatic enrolment. Whilst the OPSS covers all employees, it also differs from other sources in that occupational pensions are only a subset of the group of pension schemes defined as workplace pensions[footnote 64].
Overall, the 2018 survey suggests that the total membership of occupational pension schemes in the UK is at its highest recorded level, with 45.6 million memberships. This represents an increase of almost 11 percentage points from the previous year’s figure (41.1 million). As illustrated by Figure 4.10, active membership of occupational pension schemes was 17.3 million in 2018, split between the private (11.0 million) and public sector (6.3 million).
Figure 4.10 - Active membership of occupational pension schemes by sector
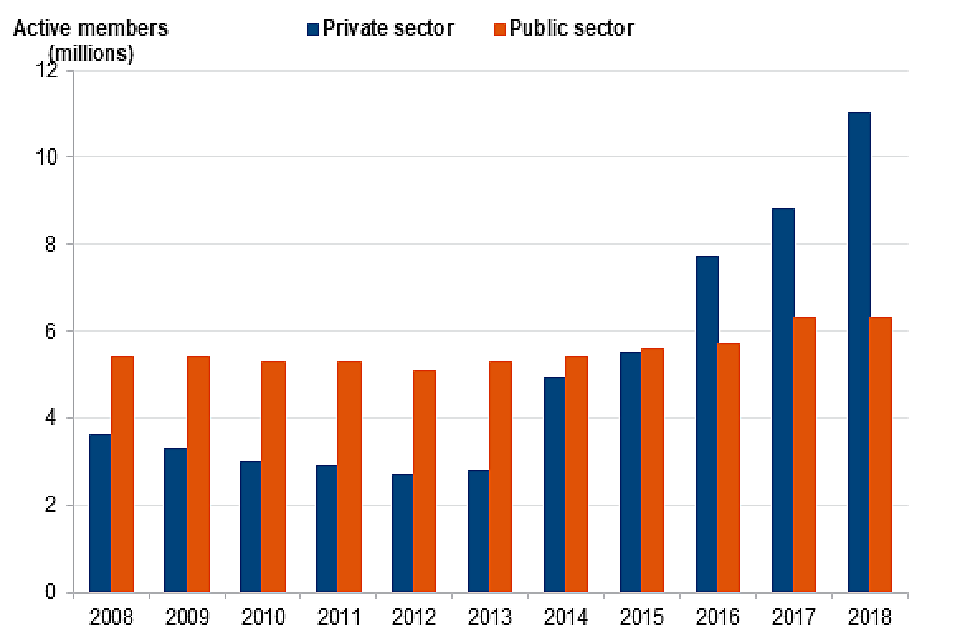
Figure 4.10 - Active membership of occupational pension schemes by sector
Source: Office for National Statistics
Looking specifically at private sector occupational pension membership by type of scheme, the survey suggests that active membership of private sector Defined Contribution (DC) schemes, which remained around 1 million from 2008 to 2012 (Figure 4.11), rose each year through 2012 to 2018, following the roll-out of automatic enrolment. In contrast, active membership of private sector Defined Benefit (DB) schemes remained at around 1.6 million between 2013 and 2015, before falling to 1.3 million in 2016, and 1.1 million in 2017 and 2018. While employers can use DB schemes for automatic enrolment, the minimum requirements for a qualifying scheme focus on DC provision.
Figure 4.11 - Active membership of private sector occupational pension scheme by benefit structure
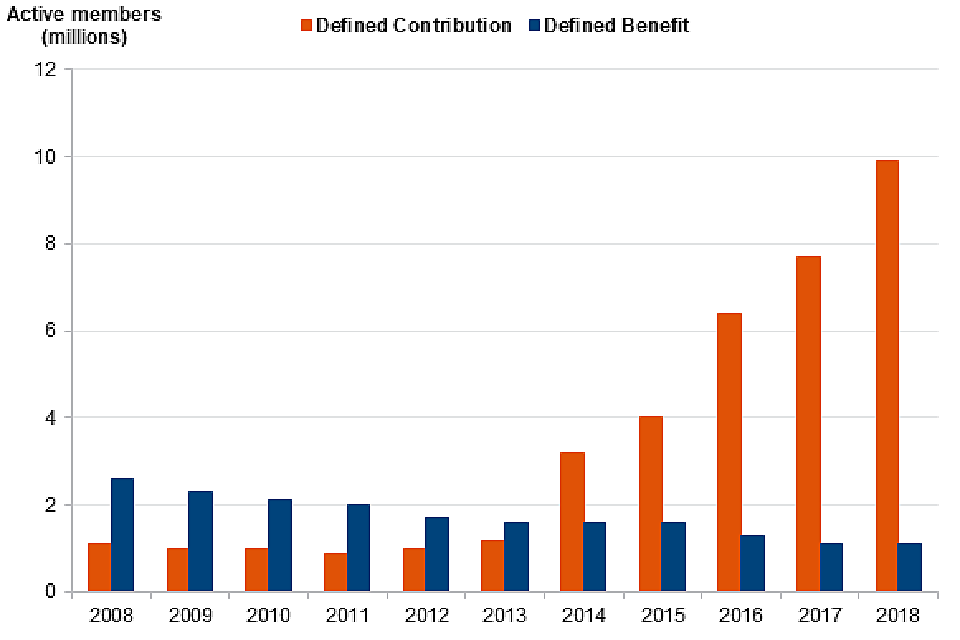
Figure 4.11 - Active membership of private sector occupational pension scheme by benefit structure
Source: Office for National Statistics
4.3. Stopping saving, re-enrolment and non-eligible employee enrolment
4.3.1. Measures of stopping saving
Where an employee has been automatically enrolled, they can choose to ‘opt out’ of a pension scheme. This has the effect of undoing active membership, as if the worker had never been a member of a scheme on that occasion. It can only happen within a specific time period, known as the ‘opt-out period’. If an eligible employee chooses to stop paying into an automatic enrolment scheme after the end of the opt-out period, they are said to cease active membership, known as cessation. The term, “stopping saving” is used, in this report, to encompass both of these actions.
During the implementation of automatic enrolment (2012 – 2018), large numbers of employees were being newly enrolled as employers were staged and complied with their new automatic enrolment duties. During this period, opt-out rates provided an important early indication of whether automatic enrolment was effective in increasing pension participation, by monitoring what newly enrolled employees do at the point of enrolment.
In order to monitor how rates of initial opt-out varied throughout employer staging, and subsequently the phased increases in minimum contribution rates, measures have predominantly used a cohort-based rate where the estimate has been the proportion of those who started saving in a particular time period (e.g. the 2016/17 financial year) who subsequently opted out within one month.
Staging of employers came to an end in February 2018 and the rate of employees being newly enrolled has begun to stabilise[footnote 65]. Now that automatic enrolment has entered “steady-state” and the vast majority of the eligible population is already saving, further changes to participation levels are likely to be primarily driven by job churn. In this new, business-as-usual context, the emphasis for the automatic enrolment policy shifts from initially getting individuals to participate in saving at the point of entry, onto whether individuals who have started to save continue to do so.
To reflect this change in emphasis, the analyses presented in the following sections of this report (and those that will form the basis of future evaluation outputs) will place a greater focus upon:
1) Rates of cessation and overall stopping saving – rather than initial opt-out rates. 2) Month-on-month saving behaviour for the entire population of eligible savers – rather than looking only at specific cohorts - as was the focus during implementation.
Despite the shift in focus to measuring the ongoing success of automatic enrolment in steady-state described above, evaluating the initial effectiveness of the policy remains important and within the scope of this report. With this in mind, cohort-based opt-out rates measured during and at the end of the automatic enrolment implementation period are included but presented separately to the stopping saving rates of the entire population of savers.
4.3.2. Opt-out and cessation during implementation
Overall, among employers with a scheme used for automatic enrolment, EPP 2017 found that nine per cent of employees who were automatically enrolled in the 2016/17 financial year decided to opt out within one month[footnote 66], [footnote 67]. Opt-out rates varied slightly by employer size (average of ten per cent for employees of micro employers; 12 per cent for those at small employers; nine per cent for medium employers; and eight per cent for large employers), however these differences by employer size were not statistically significant.
The 2019 EPP survey, due for publication later this year, indicates that the overall opt-out rate for employees enrolled in the financial year 2018/19 remained at nine per cent. This estimate covers the twelve months following the first phased increase to minimum contribution rates that took place in April 2018.
Overall, in EPP 2017, employers estimated that 16 per cent of employees who had been automatically enrolled in the 2016/17 financial year had ceased active membership by the time of survey fieldwork (July to October 2017)[footnote 68]. Large and medium-sized employers reported higher cessation rates (23 and 14 per cent respectively) compared with small and micro employers (with seven and six per cent respectively). EPP 2017 also found that on average, employers said that around two-thirds (67 per cent) of employees who had ceased did so due to leaving their job.
An update to the estimated overall cessation rate (for the 2018/19 financial year) will be available in the full EPP 2019 report due to be published later this year.
4.3.3. Using Real Time Information to measure stopping saving
Real Time Information (RTI) is the reporting system for earnings taxed via Pay As You Earn (PAYE). Under RTI, employers are required to report to HMRC information about payments made to their employees through the PAYE system, including details of tax and other deductions from pay. Since April 2014, employers have been required to report in real time with around 2.3 million PAYE schemes covering a total of 45 million employees and pensioners reporting through RTI[footnote 69].
RTI is an employment-level dataset, so an individual would appear multiple times in the data if they had multiple jobs.
RTI collects information on the amount of employee pension contributions deducted from each payment. By looking longitudinally across payments for a given employment, we use the presence and absence of employee pension contributions to identify when an employment starts and stops pension saving. Applying this method to all employments appearing on RTI, we can count the numbers stopping saving each month.
Because RTI does not collect information on employer pension contributions, it cannot identify employments with employer-only pension contributions. Additionally, pension contributions made via salary sacrifice[footnote 70] cannot be identified within RTI as pension contributions. Evidence from ASHE 2018 suggests that RTI therefore can be used to identify around 65 per cent of workplace pension savers. As such, RTI does not give a complete picture of all employments who have been automatically enrolled[footnote 71].
RTI cannot identify cases where employments have been enrolled but stopped saving before making their first contribution. Since these employments have not made any pension contributions, we cannot identify that they have been enrolled. This group is captured in other measures such as those in the EPP survey.
Given the differences in population coverage, definitions, and methodology, the stopping saving figures produced by RTI will not be directly comparable with other data sources. Therefore, the focus of this section is to look for changes in the RTI measures over time and between groups to evaluate savings behaviour.
The figures presented through section 4.3.4 are based on employments eligible[footnote 72] for automatic enrolment, both in the public and private sector.
4.3.4. RTI analysis of stopping saving trends
This section presents RTI stopping saving rates from April 2014 to June 2019[footnote 73]. The RTI stopping saving rate is calculated as the proportion of all workplace pension savers who cease pension saving in a particular month[footnote 74].
The RTI stopping saving rate differs from the EPP cessation and opt-out rates. The EPP uses a cohort-based rate, where the 2019 estimate is the proportion of those who started saving in the 2018-2019 financial year who subsequently cease pension saving after the opt-out period. In contrast the RTI stopping saving rate is the proportion of all pension savers who stopped saving in March, regardless of when they started saving. The latter type of measure has a significantly larger denominator, so will produce lower absolute rates.
RTI overall stopping saving rate
Figure 4.12 presents the RTI stopping saving rate from April 2014 to June 2019, split by reason for stopping saving[footnote 75]. Figure 4.13 presents the rate of stopping saving due to active decisions by financial year to aide comparison across years[footnote 76].
From April 2014 to June 2019, on average 2.67 per cent of savers stopped saving each month due to active decisions, end of employments and becoming non-eligible. Of those stoppages across this time period, end of employments account for the majority (63 per cent), followed by active decisions (25 per cent), and becoming ineligible (11 per cent).
The overall stopping saving level has decreased in 2019, driven by the fall in the percentage of people stopping saving due to end of employment. The active decision rate (proportion of workplace pension savers who made an active decision to stop saving each period) shows a slight increase from the 2018-19 financial year to the first quarter of the 2019-20 financial year[footnote 77] (0.72 to 0.76 per cent), following the second increase of the automatic enrolment minimum contribution rates.
Figure 4.12 - Stopping saving: the proportion of workplace pension savers who stop saving each month averaged over financial year, by reason.
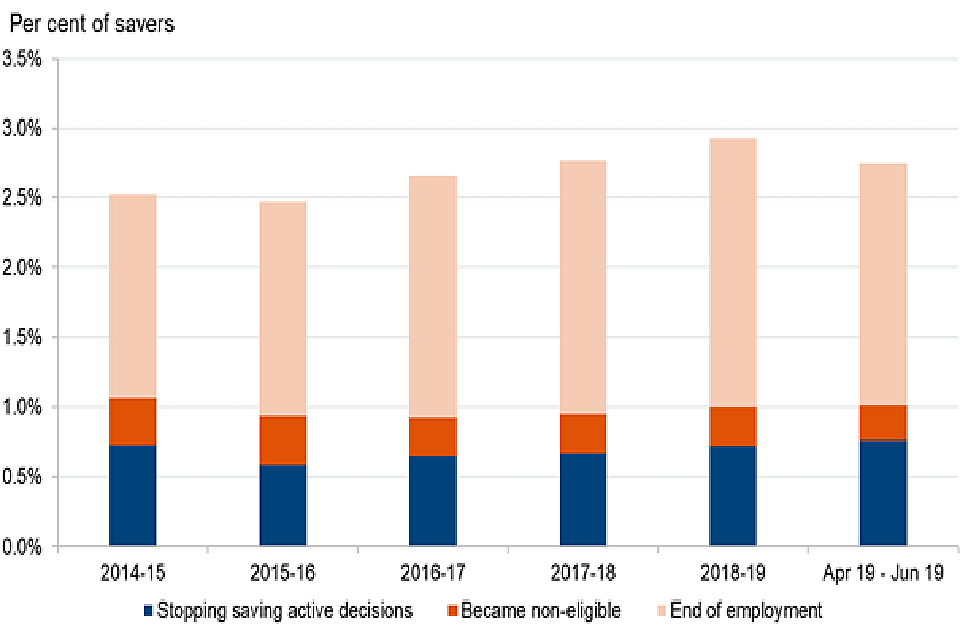
Figure 4.12 - Stopping saving: the proportion of workplace pension savers who stop saving each month averaged over financial year, by reason
Source: HMRC Real Time Information (RTI) data
Figure 4.13 shows an increase in the active decision rate in March 2019 to 1.7 per cent. This is consistent with the seasonal pattern of increases in the stopping saving rate at the end of the financial year, and is slightly below the levels observed in March 2018 (2.0 per cent). This seasonal increase is related to how employments in RTI operate across tax years. The active decision stopping saving rates from April 2019 onwards are largely consistent with levels in previous years (though there is a slight increase in April 2019).
Figure 4.13 – Stopping saving: the proportion of workplace pension savers who make an active decision to stop saving each month, by financial year.
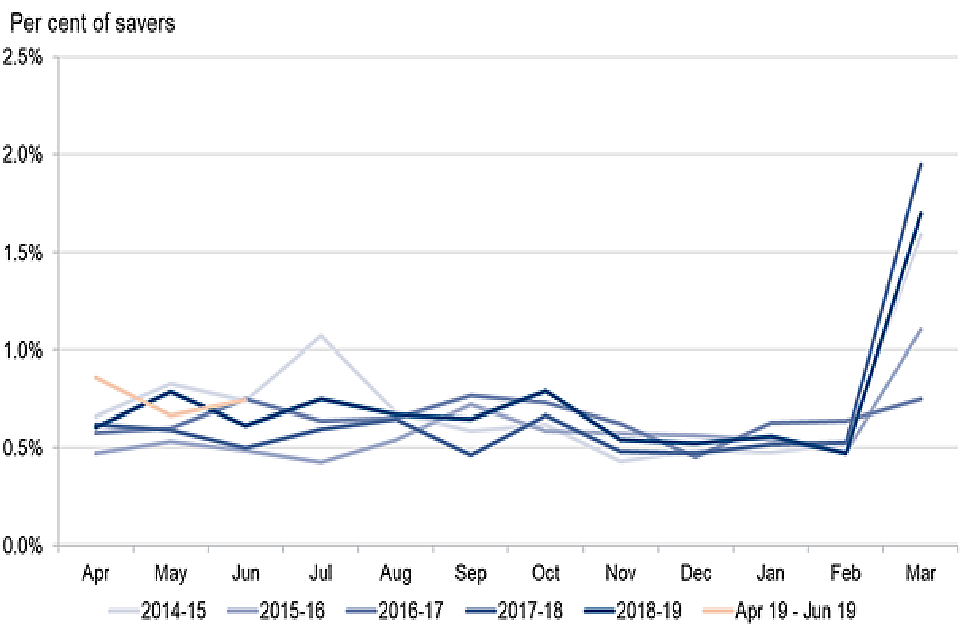
Figure 4.13 – Stopping saving: the proportion of workplace pension savers who make an active decision to stop saving each month, by financial year
Source: HMRC Real Time Information (RTI) data
RTI active decision stopping saving rate by gender
Figure 4.14 presents the active decision stopping saving rate by gender from April 2014 to June 2019.
The average rate across this period has been slightly higher for males (0.76 per cent) than for females (0.59 per cent). The chart shows an upward trend in the active decision stopping saving rates since April 2015 for both genders. However, in the period between March and June 2019, these rates were only 0.06 percentage point higher for women and identical for men compared to their respective rates in 2014-2015.
Figure 4.14 – Stopping saving: the proportion of workplace pension savers who make an active decision to stop saving each month averaged over financial year, by gender.
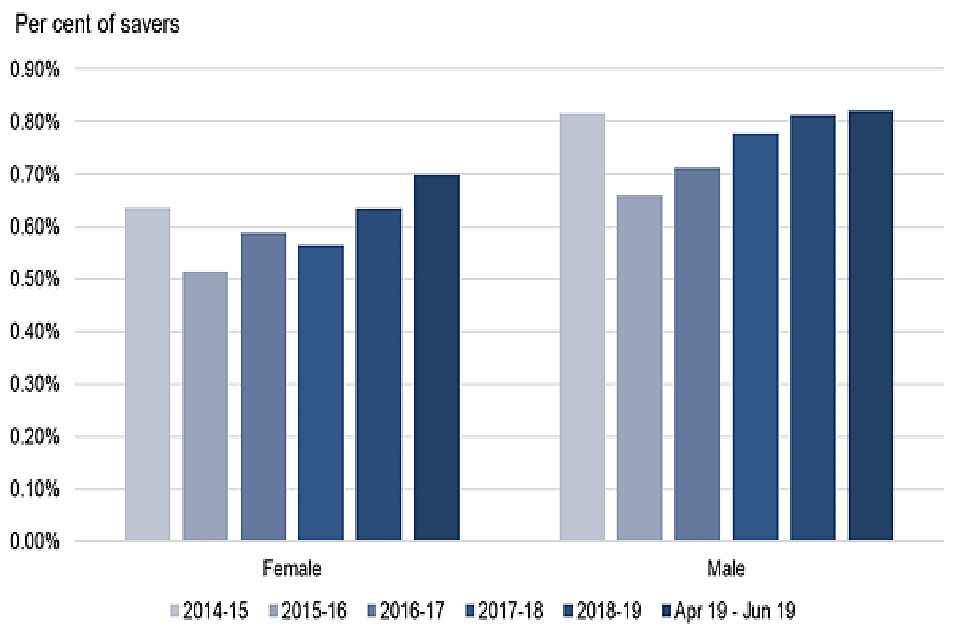
Figure 4.14 – Stopping saving: the proportion of workplace pension savers who make an active decision to stop saving each month averaged over financial year, by gender
Source: HMRC Real Time Information (RTI) data
RTI active decision stopping saving rate by age group
Figure 4.15 presents the active decision stopping saving rate, split by age group.
From April 2014 to June 2019, the active decision stopping saving rate was highest for those aged 22 to 29 (0.88 per cent) and 60 to State Pension age (0.79 per cent). Rates were lower for those in the 30 to 39 (0.70 per cent), 40 to 49 (0.58 per cent) and 50 to 59 (0.58 per cent) age bands.
From April 2014 to March 2018, the active decision rate fell for the youngest age group from 1.00 per cent to 0.77 per cent. There was less variation among other age groups, none of which varied by more than 0.12 percentage points.
From April 2018 onwards, those aged 22 to 29 and those aged 30 to 39 saw the largest increases in their active decision stopping saving rates (0.23 percentage points and 0.15 percentage points respectively). The other age groups exhibit very minor changes in this period.
Figure 4.15 – Stopping saving: the proportion of workplace pension savers who make an active decision to stop saving each month averaged over financial year, by age group.
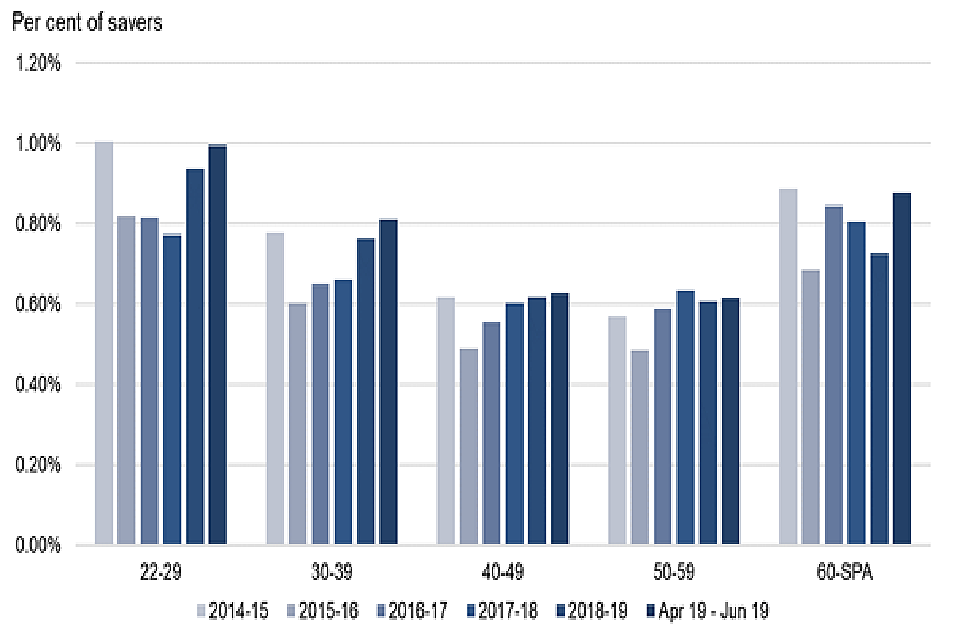
Figure 4.15 – Stopping saving: the proportion of workplace pension savers who make an active decision to stop saving each month averaged over financial year, by age group
Source: HMRC Real Time Information (RTI) data
RTI active decision stopping saving rate by earnings level
Figure 4.16 presents the active decision stopping saving rate, split by earnings level.
With the exception of the highest earnings group, savings behaviours did not vary substantially between April 2014 and June 2019. Active decision stopping saving rates averaged between 0.59 and 0.71 per cent for those earning between £10,000 and £60,000 per year. Active decision stopping saving rates for those earning over £60,000 averaged 0.90 per cent, mainly driven by the increase observed in 2018-2019. For the lowest earnings group, who had the lowest participation levels prior to the rollout of automatic enrolment[footnote 78], rates have remained in line or only marginally above those for higher earnings groups, reaching a high of 0.86 per cent in April to June 2019.
Figure 4.16 – Stopping saving: the proportion of workplace pension savers who make an active decision to stop saving each month averaged over financial year, by earnings level.
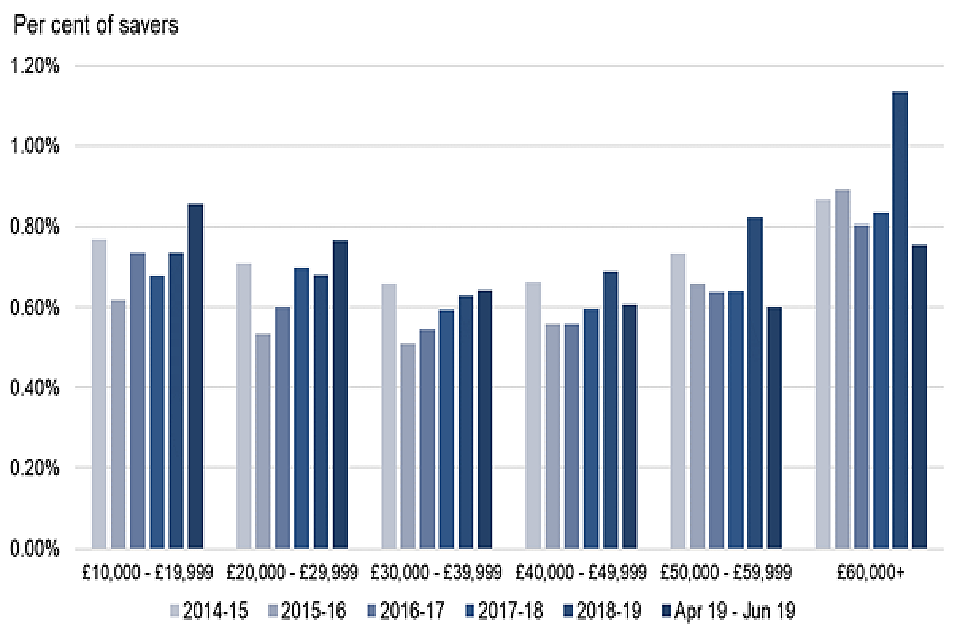
Figure 4.16 – Stopping saving: the proportion of workplace pension savers who make an active decision to stop saving each month averaged over financial year, by earnings level
Source: HMRC Real Time Information (RTI) data
RTI active decision stopping saving rate by employer size
Figure 4.17 presents the active decision stopping saving rate, split by PAYE scheme size. PAYE scheme size is used as a proxy for employer size. They are not identical as multiple employers can operate under the same PAYE scheme and one employer can operate multiple PAYE schemes. However, the vast majority of employers operates just one PAYE scheme and the vast majority of PAYE schemes are operated by just one employer.
The figure shows substantial variation in the trends in stopping saving rates – by employer size - between April 2014 to June 2019. This is likely due to the different dates at which employers had to comply with automatic enrolment duties, commencing in 2012 with the largest employers with smaller employers coming later. From February 2018 onwards, every employer had to comply with automatic enrolment duties. Post-April 2018 estimates show that very large employers exhibited the highest active decision stopping saving levels and small employers the lowest.
Figure 4.17 – Stopping saving: the proportion of workplace pension savers who make an active decision to stop saving each month averaged over financial year, by employer size.
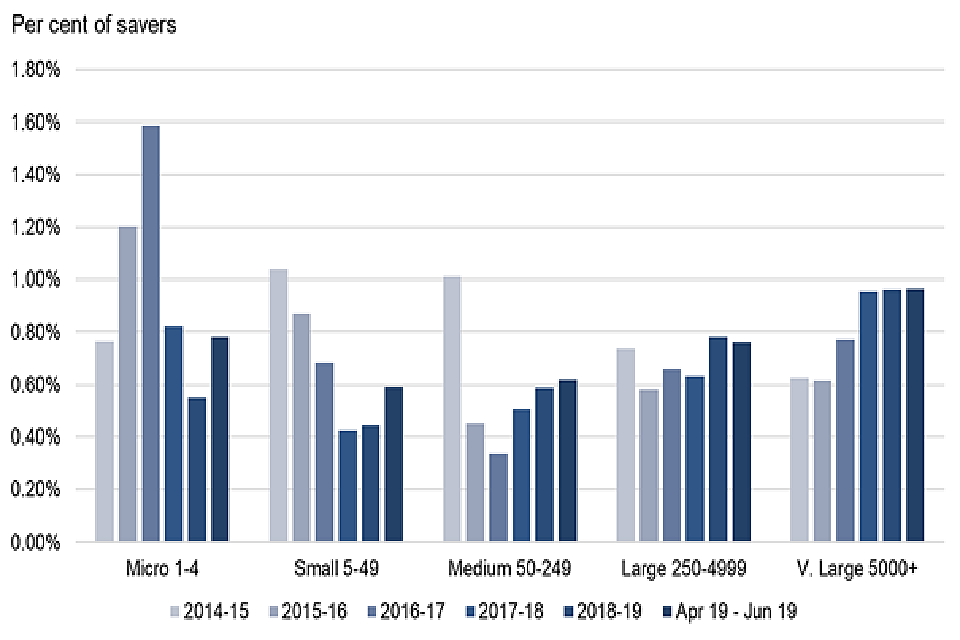
Figure 4.17 – Stopping saving: the proportion of workplace pension savers who make an active decision to stop saving each month averaged over financial year, by employer size
Source: HMRC Real Time Information (RTI) data
4.3.5. Re-enrolment
Every three years, staff who were automatically enrolled but opted out of or ceased active membership of a pension scheme more than 12 months before an employer’s re-enrolment date must be automatically re-enrolled into the scheme[footnote 79]. Re-enrolment is designed in recognition that people’s circumstances can change over time and re-enrolment enables them to re-engage with workplace pension saving through automatic enrolment.
EPP 2017 found that of those employers who have automatically re-enrolled employees, the majority have only re-enrolled relatively small numbers, with 50 per cent reporting that they re-enrolled between one and 24 employees[footnote 80]. Levels of opt-out following re-enrolment are higher than those reported following original automatic enrolment, however this is not surprising as everyone who was automatically re-enrolled would have previously opted out or ceased active membership. The overall opt-out level following re-enrolment among medium and large employers was 33 per cent. This varied by size of employer, with an opt-out rate of 50 per cent for medium employers and 31 per cent for large employers.
The reported cessation rate, that is the proportion of employees re-enrolled who left the pension scheme after the one month opt-out period, followed a similar pattern. The overall level of cessation following re-enrolment among medium and large employers was 24 per cent, with medium employers having a higher cessation rate compared with large employers (51 per cent compared with 18 per cent).
The staged roll-out of automatic enrolment, and three-year cycle of re-enrolment, means that it is too soon to see the full impact of re-enrolment on employees of small and micro employers. Results from EPP 2019 will provide further insight later this year.
4.3.6. Enrolment of non-eligible employees
A worker who is not eligible for automatic enrolment can choose to ‘opt in’ to an automatic enrolment scheme[footnote 81]. The pension participation rate of non-eligible employees has increased since automatic enrolment was introduced, in addition to the rate for eligible employees, as mentioned earlier in Chapter 4.
EPP 2019 measured the extent of employers enrolling non-eligible employees into a qualifying pension scheme. Overall, in five per cent of employers with a scheme used for automatic enrolment, at least some non-eligible employees had been enrolled into a scheme in the last financial year (2018/19). This increased substantially with employer size; in 44 per cent of large employers at least some non-eligible employees had been enrolled into a scheme used for automatic enrolment, compared with three per cent among micro employers. Just over a third (34 per cent) of private sector employees were employed by organisations where at least some non-eligible employees were enrolled in the 2018/19 financial year.
EPP 2017 measured the extent to which enrolment of non-eligible employees was due to the employer contractually enrolling staff versus these employees making an active choice to opt in to pension saving, or some other reason[footnote 82]. In 63 per cent of pension schemes used for automatic enrolment where at least some non-eligible employees had been enrolled, the employees had actively asked to join, while in 29 per cent the employer stated that it was company policy to enrol everyone. For nine per cent of schemes, employers stated this was due to some other reason. Small employers were more likely to say that it was company policy to enrol everyone; this was given as the reason for 28 per cent of schemes that had enrolled non-eligible employees among small employers, compared with 14 per cent of schemes provided by large employers. An updated view of the reasons why non-eligible employees have been enrolled in workplace pension schemes will be provided in the EPP 2019 report.
4.4. Individual attitudes, understanding and activities
As mentioned in section 2.2, the DWP has been undertaking communication activity to raise awareness and understanding of automatic enrolment among individuals. To gather insight into the effectiveness of this activity, the department runs a communications tracking survey, measuring awareness, positivity, social norms and intention. NatCen’s British Social Attitudes survey (BSA) also includes measures of public attitudes towards workplace pension saving[footnote 83].
4.4.1. Recognising the benefits of pension saving
Findings from the DWP’s communications tracking research in April 2019 showed that the vast majority of individuals interviewed viewed automatic enrolment and workplace pensions in a positive light, with 79 per cent saying that it is a good thing for them personally (83 per cent for advert recognisers, vs. 68 per cent for non-recognisers)[footnote 84]. 77 per cent of employees agreed that they knew what the benefit of being in a workplace pension was for them (81 per cent for advert recognisers, vs. 66 per cent for non-recognisers).
Evidence from BSA 2018 suggests 83 per cent of employees agree ‘Overall, it is worthwhile for me to save into a workplace pension’ and less than a quarter (23 per cent) of employees agree ‘I have more important things to spend my money on than saving into a workplace pension’. Agreement with these statements has remained at similar levels since BSA 2016[footnote 85].
4.4.2. The social norms of workplace pension saving
In the April 2019 DWP communications tracker, the majority of employees (81 per cent) agreed that ‘saving into a workplace pension is the normal thing to do if you work for an employer’ (84 per cent for advert recognisers vs. 71 per cent for non-recognisers)[footnote 86]. A majority (77 per cent) also agreed that ‘saving into a workplace pension is normal for someone like me’ (80 per cent for advert recognisers vs. 66 per cent for non-recognisers).
Evidence from BSA 2018 indicates 82 per cent of employees agree ‘It is normal for someone like me to save into a workplace pension’.This level of agreement has remained high since BSA 2016. The percentage of employees who agree ‘saving into a workplace pension is something I am used to doing’ has increased significantly from 68 per cent in 2016 to 76 per cent in 2018.
4.4.3. Individuals’ access and understanding of information on pension saving
Findings from the April 2019 communications tracker revealed that the majority of employees (75 per cent) said they knew where to go if they wanted to find out more about workplace pensions (78 per cent for advert recognisers, vs. 64 per cent for non-recognisers)[footnote 87].
4.4.4. Attitudes by age, gender and occupation
BSA 2018 also enables the identification of differences in attitudes to workplace pensions by gender, age and occupation. Results by gender suggest only marginal differences between male and female employees in their agreement with most attitudinal statements. However, a gap in perceived knowledge appears to exist with 41 per cent of men stating they know “a lot” or “a fair amount” about workplace pensions compared to 33 per cent of women[footnote 88].
Section 4.4.2 presented evidence on the extent to which workplace pension saving has become a social norm. Further evidence from BSA 2018 suggests that “social norming” of workplace pensions has not been limited to particular age groups. Across all age groups eligible for automatic enrolment, over 80 per cent of employees agree ‘It is normal for someone like me to save into a workplace pension’. Figure 4.18 shows that the majority of all eligible age groups disagree ‘I have more important things to spend my money on than saving into a workplace pension’. The percentage of employees agreeing with this statement decreases with age with the exception of the 35-49 age group.
Figure 4.18 – Agreement with the statement, ‘I have more important things to spend my money on than saving into a workplace pension’. All employees, by age band.
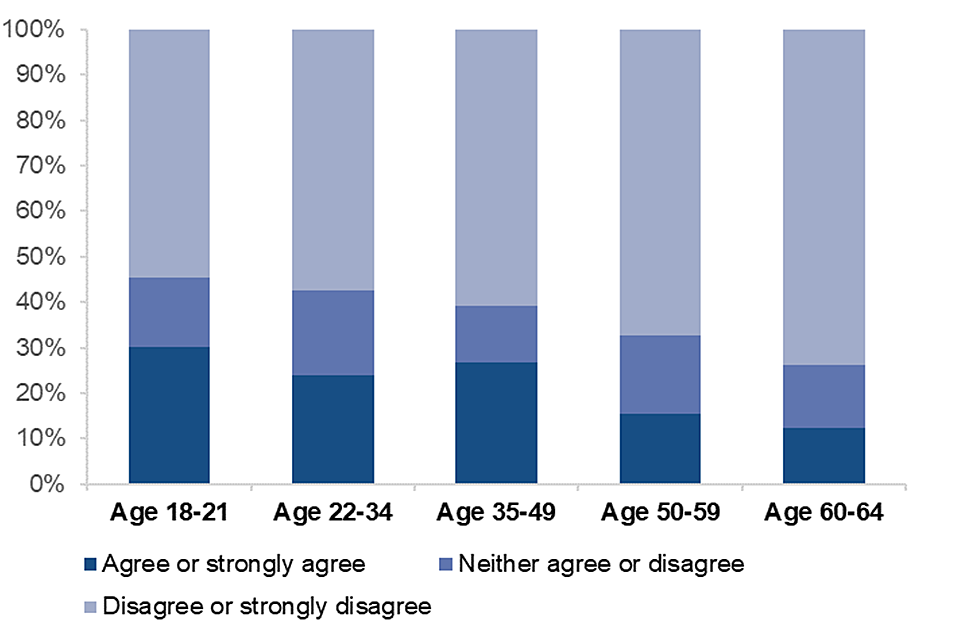
Figure 4.18 – Agreement with the statement, ‘I have more important things to spend my money on than saving into a workplace pension’. All employees, by age band.
Source: NatCen’s British Social Attitudes survey (2018).
Figure 4.19 shows that across all four occupation groups, over 70 per cent of employees agree ‘It is normal for someone like me to save into a workplace pension’. Evidence from BSA suggests that “social norming” of workplace pensions has occurred to the greatest extent among employees in managerial and professional occupations (88 per cent agree it is normal). However, substantial increases in “social norming” among those in semi-routine and routine occupations have also been observed. The proportion of employees in semi-routine and routine occupations who agree it is normal for them to save into a workplace pension has risen from 62 per cent in 2016 to 73 per cent in 2018.
Figure 4.19 – Agreement with the statement, ‘It is normal for someone like me to save into a workplace pension’. All employees, by occupation.
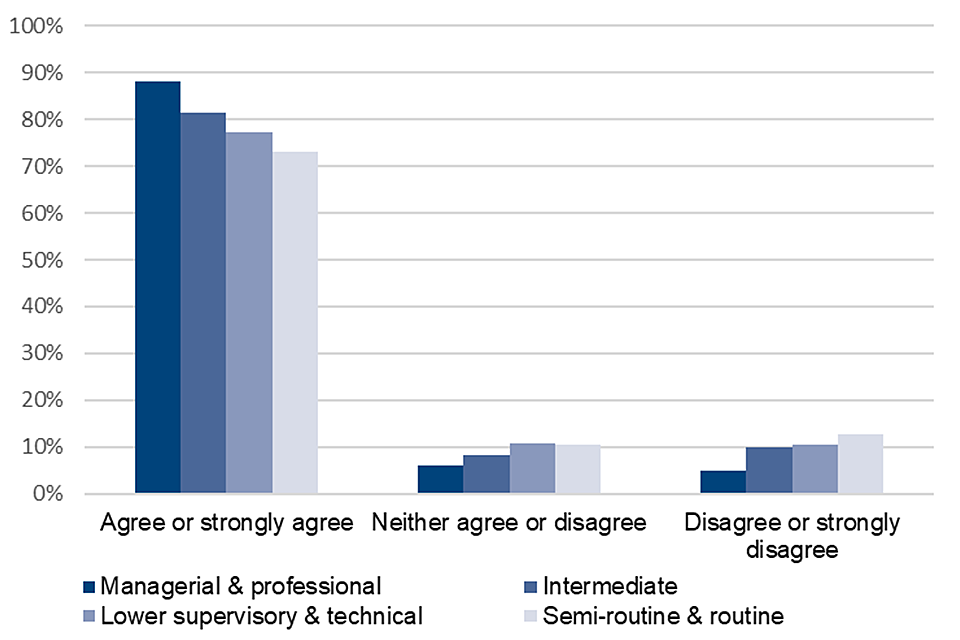
Figure 4.19 – Agreement with the statement, ‘It is normal for someone like me to save into a workplace pension’. All employees, by occupation
Source: NatCen’s British Social Attitudes survey (2018).
4.4.5. Employee contributions of eligible employees participating in workplace pensions.
Following the introduction of automatic enrolment, total contributions to workplace pensions have increased, as more people are contributing. However, during roll-out, median contribution rates of savers fell because those employees newly saving were likely to be making the minimum contributions specified under automatic enrolment rules at the time. This has resulted in a decrease in the overall median contribution rates for pension savers until the first increase in the minimum rates in April 2018, where the median contribution rates of savers began to increase.
This analysis examines the contribution rates from ASHE data calculated using the reported value of the pension contribution as a proportion of reported pensionable pay. Pensionable pay may include earnings below the lower earnings limit or above the upper earnings limit, so these contribution rates should not be used for estimates of employees contributing the minimum amounts on qualifying earnings under automatic enrolment regulations. That topic is covered in section 4.4.6.
The latest available ASHE data is for April 2018, so the figures for 2018 represent the period immediately after the first increase of minimum contributions and would not pick up lagged behavioural effects of the increase. Figures 4.20 and 4.21 show the percentage and number of eligible employees with workplace pensions, in the private sector, by banded rate of employee contribution (size of the contribution as a proportion of pensionable pay reported in ASHE)[footnote 89].
The data show that in 2017 over 6 million eligible private sector employees saving into a workplace pension made a contribution of two per cent or above. In 2018, almost 10.3 million were contributing two per cent or above following the first increase in the minimum contribution rates in April 2018.
Figure 4.20 – Percentage of eligible employees with workplace pensions: by banded rate of employee contribution in the private sector, 2012 to 2018, Great Britain.
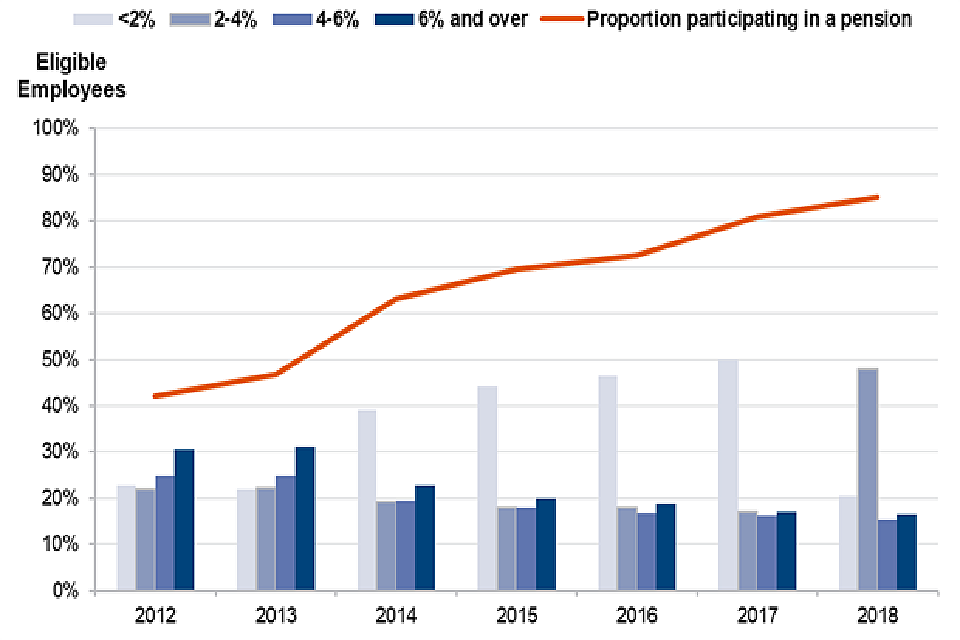
Figure 4.20 – Percentage of eligible employees with workplace pensions: by banded rate of employee contribution in the private sector, 2012 to 2018, Great Britain
Source: DWP estimates derived from the ONS ASHE, GB, 2012–2018.
Figure 4.21 – Number of eligible employees with workplace pensions (in thousands): by banded rate of employee contribution in the private sector, 2012 to 2018, Great Britain.
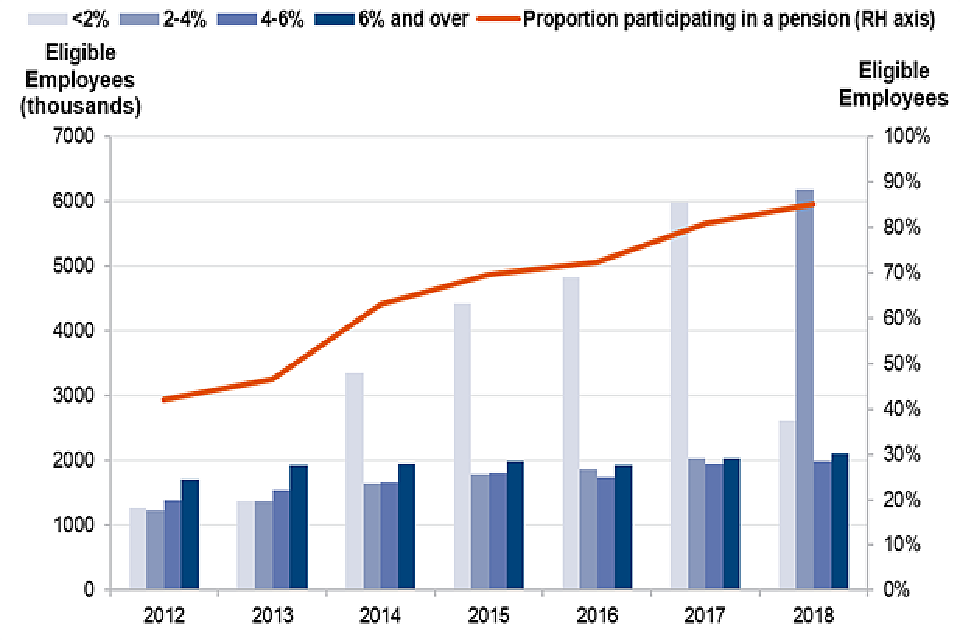
Figure 4.21 – Number of eligible employees with workplace pensions (in thousands): by banded rate of employee contribution in the private sector, 2012 to 2018, Great Britain
Source: DWP estimates derived from the ONS ASHE, GB, 2012–2018.
4.4.6. Characteristics of eligible employees with contributions above the 2018 minimum
Figures 4.20 and 4.21 in section 4.4.5 showed the distribution of reported contribution rates in ASHE, calculated using the reported value of the pension contribution as a proportion of reported pensionable pay. Pensionable pay may include earnings below the lower earnings limit or above the upper earnings limit. The following tables estimate contributions as a proportion of qualifying earnings[footnote 90] and examine the characteristics of eligible employees in the private sector for whom total contributions are greater than the 2018 minimum: total contributions over five per cent of qualifying earnings and employer contribution of at least two per cent of qualifying earnings. The characteristics of those with contributions above the 2018 minimums in 2018 are compared to the characteristics of employees who had contributions above the 2018 minimums in previous years.
Employees may have contributions greater than the automatic enrolment minimums because their contribution rates are higher than the minimums, or because their pensionable earnings consist of a greater range of earnings than the qualifying earnings minimum. The estimates in the following tables do not distinguish between these cases. They also do not distinguish between cases where individuals make additional voluntary contributions and cases where their employer offers a more generous (default) scheme.
The data is not restricted to employees at employers who had completed staging. From 2012 onwards, the data uses the automatic enrolment thresholds as they were in each year. For 2011, the data uses 2012/13 thresholds deflated by earnings.
In April 2018, approximately 8.9 million eligible employees had contributions higher than the minimum contributions required by automatic enrolment at the time. Tables 4.1 and 4.2 show that eligible employees in the private-sector with total contributions above the 2018 minimum are more likely to belong to older age groups. Around three out of ten (29.2 per cent) of this group are in the 50 to SPA age band. However, the proportion belonging to younger age bands has increased over time. The number of eligible employees aged 22 to 29 with contributions above the 2018 minimums increased from around 0.6 million in 2011 to around 0.9 million in 2017, and further to 1.5 million in 2018.
Table 4.1 – Number of eligible employees paying contributions above the 2018 minimum, by age band, in the private sector, 2011 to 2018, Great Britain
Figures are for Great Britain and number of employees in thousands
| Age band | 2011 | 2012 | 2013 | 2014 | 2015 | 2016 | 2017 | 2018 |
|---|---|---|---|---|---|---|---|---|
| 22 to 29 | 557 | 581 | 664 | 796 | 827 | 861 | 937 | 1,543 |
| 30 to 39 | 1,315 | 1,319 | 1,394 | 1,550 | 1,586 | 1,595 | 1,724 | 2,390 |
| 40 to 49 | 1,671 | 1,701 | 1,757 | 1,859 | 1,874 | 1,817 | 1,892 | 2,354 |
| 50 to SPA | 1,457 | 1,529 | 1,675 | 1,789 | 1,937 | 2,000 | 2,122 | 2,590 |
Source: DWP estimates derived from the ONS ASHE, GB, 2011–2018.
Table 4.2 – Distribution of eligible employees paying contributions above the 2018 minimum, by age band, in the private sector, 2011 to 2018, Great Britain
Figures are for Great Britain and data in percentages
| Age band | 2011 | 2012 | 2013 | 2014 | 2015 | 2016 | 2017 | 2018 |
|---|---|---|---|---|---|---|---|---|
| 22 to 29 | 11.1% | 11.3% | 12.1% | 13.3% | 13.3% | 13.7% | 14.0% | 17.4% |
| 30 to 39 | 26.3% | 25.7% | 25.4% | 25.9% | 25.5% | 25.4% | 25.8% | 26.9% |
| 40 to 49 | 33.4% | 33.2% | 32.0% | 31.0% | 30.1% | 29.0% | 28.3% | 26.5% |
| 50 to SPA | 29.1% | 29.8% | 30.5% | 29.9% | 31.1% | 31.9% | 31.8% | 29.2% |
Source: DWP estimates derived from the ONS ASHE, GB, 2011–2018.
Note: Percentages may not sum to 100 per cent due to rounding. Figures refer to April of each year.
Tables 4.3 and 4.4 show that the eligible employees in the private-sector with total contributions above the 2018 minimums are most likely to belong to the highest earnings bracket. Around a third (33.4 per cent) of this group earn £40,000 or over. However, the proportion belonging to lower earnings brackets has increased over time. The number of eligible employees earning under £20,000 with contributions above the 2018 minimums increased from around 0.6 million in 2011 to around 1.0 million in 2017, and further to 1.7 million in 2018.
Table 4.3 - Number of eligible employees paying contributions above the 2018 minimum: by earnings band, in the private sector, 2011 to 2018, Great Britain
Figures are for Great Britain and number of employees in thousands
| Earning band | 2011 | 2012 | 2013 | 2014 | 2015 | 2016 | 2017 | 2018 |
|---|---|---|---|---|---|---|---|---|
| Under £10,000[footnote 91] | 39 | 38 | . | . | . | . | . | . |
| £10,000 - under 20,000 | 608 | 644 | 752 | 875 | 875 | 893 | 1,015 | 1,694 |
| £20,000 - under 30,000 | 1,096 | 1,139 | 1,262 | 1,485 | 1,540 | 1,523 | 1,636 | 2,459 |
| £30,000 - under 40,000 | 1,099 | 1,135 | 1,200 | 1,290 | 1,353 | 1,333 | 1,377 | 1,762 |
| £40,000+ | 2,158 | 2,174 | 2,275 | 2,345 | 2,456 | 2,525 | 2,647 | 2,962 |
Source: DWP estimates derived from the ONS ASHE, GB, 2011–2018.
Table 4.4 – Distribution of eligible employees paying contributions above the 2018 minimum: by earnings band, in the private sector, 2011 to 2018, Great Britain
Figures are for Great Britain and data in percentages
| Earning band | 2011 | 2012 | 2013 | 2014 | 2015 | 2016 | 2017 | 2018 |
|---|---|---|---|---|---|---|---|---|
| Under £10,000 | 0.8% | 0.7% | . | . | . | . | . | . |
| £10,000 - under 20,000 | 12.2% | 12.6% | 13.7% | 14.6% | 14.1% | 14.2% | 15.2% | 19.1% |
| £20,000 - under 30,000 | 21.9% | 22.2% | 23.0% | 24.8% | 24.7% | 24.3% | 24.5% | 27.7% |
| £30,000 - under 40,000 | 22.0% | 22.1% | 21.9% | 21.5% | 21.7% | 21.2% | 20.6% | 19.8% |
| £40,000+ | 43.2% | 42.4% | 41.4% | 39.1% | 39.5% | 40.2% | 39.6% | 33.4% |
Source: DWP estimates derived from the ONS ASHE, GB, 2011–2018.
Note: Percentages may not sum to 100 per cent due to rounding.
Tables 4.5 and 4.6 show that a majority of eligible employees in the private-sector with total contributions above the 2018 minimum are working at either large employers (250 to 4,999 employees) or very large employers (5,000 plus employees). In 2018 around two thirds (65 per cent) of employees in this group were working at large or very large employers. Larger employers are more likely to have had existing pension provision, which could result in their employees paying contributions on a wider band of earnings than the automatic enrolment minimum qualifying earnings.
Table 4.5 – Number of eligible employees paying contributions above the 2018 minimum, by employer size, in the private sector, 2011 to 2018, Great Britain
Figures are for Great Britain and number of employees in thousands
| Employer size | 2011 | 2012 | 2013 | 2014 | 2015 | 2016 | 2017 | 2018 |
|---|---|---|---|---|---|---|---|---|
| 1 to 4 | 42 | 36 | 37 | 34 | 35 | 39 | 51 | 129 |
| 5 to 49 | 529 | 533 | 534 | 527 | 585 | 650 | 734 | 1,326 |
| 50 to 249 | 796 | 810 | 841 | 879 | 1,052 | 1,070 | 1,099 | 1,651 |
| 250 to 4,999 | 2,043 | 2,194 | 2,341 | 2,621 | 2,711 | 2,646 | 2,752 | 3,510 |
| 5,000+ | 1,570 | 1,550 | 1,733 | 1,930 | 1,837 | 1,865 | 2,036 | 2,256 |
Source: DWP estimates derived from the ONS ASHE, GB, 2011–2018.
Table 4.6 – Distribution of eligible employees paying contributions above the 2018 minimum, by employer size, in the private sector, 2011 to 2018, Great Britain
Figures are for Great Britain and data in percentages
| Employer size | 2011 | 2012 | 2013 | 2014 | 2015 | 2016 | 2017 | 2018 |
|---|---|---|---|---|---|---|---|---|
| 1 to 4 | 0.8% | 0.7% | 0.7% | 0.6% | 0.6% | 0.6% | 0.8% | 1.5% |
| 5 to 49 | 10.6% | 10.4% | 9.7% | 8.8% | 9.4% | 10.4% | 11.0% | 14.9% |
| 50 to 249 | 16.0% | 15.8% | 15.3% | 14.7% | 16.9% | 17.1% | 16.5% | 18.6% |
| 250 to 4,999 | 41.0% | 42.8% | 42.7% | 43.7% | 43.6% | 42.2% | 41.2% | 39.6% |
| 5,000+ | 31.5% | 30.3% | 31.6% | 32.2% | 29.5% | 29.7% | 30.5% | 25.4% |
Source: DWP estimates derived from the ONS ASHE, GB, 2011–2018.
Note: Percentages may not sum to 100 per cent due to rounding.
From 2011 to 2018 the number of eligible employees at micro employers (1 to 4 employers) making contributions above the 2018 minimums more than trebled, from 42 thousand to 129 thousand. By contrast, the number at very large employers (5,000 plus employees) making increases above the 2018 minimums increased by 44 per cent over the same period, from around 1.6 million to around 2.3 million.
4.5. Trends in workplace pension saving
As shown in Table 4.7, the annual total amount saved on behalf of eligible employees across both sectors stands at £90.4 billion in 2018, which is an increase of £7 billion from 2017. Annual total amounts increased in both public and private sectors from 2017. The public sector increased by around £2.5 billion and the private sector by £4.5 billion.
Since the introduction of automatic enrolment in 2012, the overall amount saved has increased every year. In the private sector, there has been a £12.8 billion increase since 2012, to £50.2 billion in 2018. The public sector has seen a £4 billion increase over the same period.
Overall in 2018, contributions by employees accounted for 26 per cent of saving, with employer contributions accounting for 64 per cent, and tax relief the remaining ten per cent.
Within the public sector the average amount saved per eligible saver (i.e. those who are saving into a workplace pension) increased by £447 in 2018 to reach £8,263.
In the private sector there was a slight increase in the average amount saved per eligible saver between 2017 and 2018 (to reach £3,616) after several years of decline since 2012. The falling trend was a result of the increased number of savers in the private sector many of whom will be making contributions at the automatic enrolment minimum level and therefore lowering the average overall. 2018 has shown the first increase in six years likely as a result of the first increase in the minimum contribution levels in April 2018.
Table 4.7 - Trends in workplace pension saving
Total pension saving of eligible savers 2008-2018, by employer and employee contributions and sector
Public sector
| Year | 2008 | 2009 | 2010 | 2011 | 2012 | 2013 | 2014 | 2015 | 2016 | 2017 | 2018 |
|---|---|---|---|---|---|---|---|---|---|---|---|
| Total saved (£ billions) | 35.3 | 36.5 | 39.1 | 37.3 | 36.2 | 37.4 | 36.6 | 37.9 | 38.1 | 37.7 | 40.2 |
| Employee contributions | 7.5 | 7.4 | 8.0 | 7.6 | 8.0 | 8.9 | 9.2 | 9.4 | 9.3 | 9.2 | 10.1 |
| Employer contributions | 25.3 | 26.6 | 28.3 | 26.9 | 25.4 | 25.2 | 23.9 | 25.0 | 25.4 | 25.1 | 26.7 |
| Tax relief | 2.5 | 2.5 | 2.7 | 2.7 | 2.9 | 3.3 | 3.4 | 3.5 | 3.4 | 3.3 | 3.4 |
| Per eligible saver (£s) | 7,197 | 7,156 | 7,311 | 7,213 | 7,521 | 7,662 | 7,839 | 7,958 | 7,975 | 7,817 | 8,263 |
| Per eligible employee (£s) | 6,464 | 6,390 | 6,506 | 6,367 | 6,604 | 6,906 | 7,173 | 7,271 | 7,231 | 7,178 | 7,671 |
Private sector
| Year | 2008 | 2009 | 2010 | 2011 | 2012 | 2013 | 2014 | 2015 | 2016 | 2017 | 2018 |
|---|---|---|---|---|---|---|---|---|---|---|---|
| Total saved (£ billions) | 41.7 | 38.9 | 37.9 | 36.8 | 37.4 | 39.3 | 42.2 | 43.1 | 43.1 | 45.7 | 50.2 |
| Employee contributions | 8.5 | 8.0 | 7.8 | 7.3 | 7.5 | 8.6 | 9.6 | 10.0 | 10.1 | 10.9 | 13.2 |
| Employer contributions | 29.9 | 27.7 | 26.9 | 26.3 | 26.6 | 26.9 | 28.4 | 28.6 | 28.6 | 30.0 | 31.5 |
| Tax relief | 3.4 | 3.2 | 3.2 | 3.2 | 3.3 | 3.9 | 4.2 | 4.4 | 4.4 | 4.7 | 5.4 |
| Per eligible saver (£s) | 6,084 | 6,135 | 6,324 | 6,333 | 6,336 | 5,971 | 4,624 | 4,060 | 3,858 | 3,553 | 3,616 |
| Per eligible employee (£s) | 2,894 | 2,791 | 2,786 | 2,672 | 2,662 | 2,788 | 2,919 | 2,824 | 2,797 | 2,875 | 3,078 |
All employees
| Year | 2008 | 2009 | 2010 | 2011 | 2012 | 2013 | 2014 | 2015 | 2016 | 2017 | 2018 |
|---|---|---|---|---|---|---|---|---|---|---|---|
| Total saved (£ billions) | 77.1 | 75.4 | 77.0 | 74.0 | 73.6 | 76.7 | 78.7 | 81.0 | 81.3 | 83.4 | 90.4 |
| Employee contributions | 15.9 | 15.4 | 15.8 | 14.9 | 15.5 | 17.5 | 18.8 | 19.4 | 19.4 | 20.2 | 23.3 |
| Employer contributions | 55.2 | 4.3 | 55.2 | 53.2 | 51.9 | 52.1 | 52.3 | 53.6 | 54.0 | 55.1 | 58.2 |
| Tax relief | 5.9 | 5.6 | 5.9 | 5.9 | 6.1 | 7.2 | 7.6 | 7.9 | 7.8 | 8.0 | 8.9 |
| Per eligible saver (£s) | 6,548 | 6,590 | 6,790 | 6,748 | 6,869 | 6,691 | 5,712 | 5,268 | 5,091 | 4,716 | 4,822 |
| Per eligible employee (£s) | 3,875 | 3,837 | 3,927 | 3,775 | 3,769 | 3,932 | 4,029 | 3,956 | 3,927 | 3,943 | 4,195 |
Source: DWP estimates derived from the ONS ASHE, GB, 2008 to 2018
Note:
1. Annual earnings are uprated using Average Weekly Earnings values. 2. Eligible saver is defined as those eligible employees who are saving into a workplace pension. 3. Some figures may differ to those quoted in the text due to rounding.
4.6. Employer contributions
4.6.1. Employer contributions of eligible employees participating in workplace pensions
This analysis examines the contribution rates from ASHE data calculated as the reported value of the pension contribution as a proportion of reported pensionable pay. Pensionable pay may include earnings below the lower earnings limit or above the upper earnings limit, so these contribution rates should not be used for estimates of employers contributing the minimum amounts under automatic enrolment regulations. That topic is covered in section 4.4.6.
Figures 4.22 and 4.23 show the percentage and number of eligible employees with workplace pensions, in the private sector, by banded rate of reported employer contribution[footnote 92]. In 2017, around 7 million eligible private sector employees saving into a workplace pension received an employer contribution of two per cent or above. In 2018, this number increased to over 9.4 million after the first increase in the minimum contribution rates in April 2018.
Figure 4.22 – Percentage of eligible employees with workplace pensions: by banded rate of employer contribution in the private sector, 2012 to 2018, Great Britain.
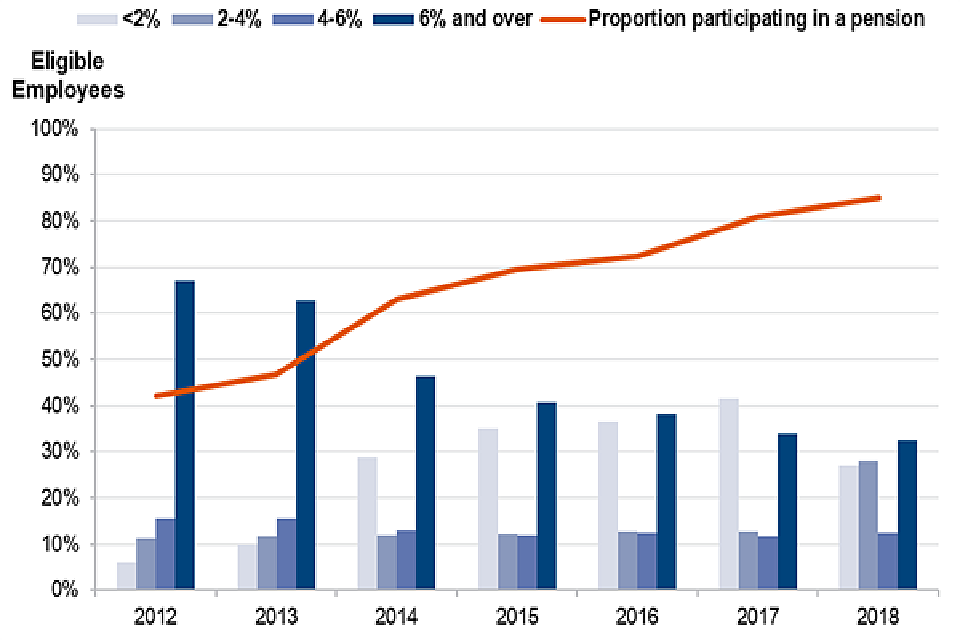
Figure 4.22 – Percentage of eligible employees with workplace pensions: by banded rate of employer contribution in the private sector, 2012 to 2018, Great Britain
Source: DWP estimates derived from the ONS ASHE, GB, 2012–2018.
Figure 4.23 – Number of eligible employees with workplace pensions (in thousands): by banded rate of employer contribution in the private sector, 2012 to 2018, Great Britain.
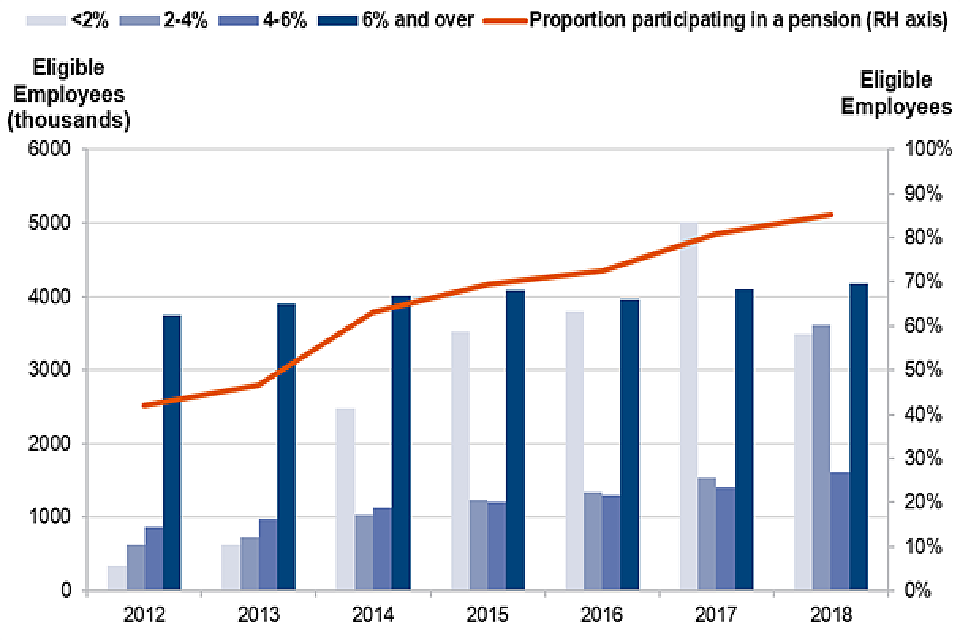
Figure 4.23 – Number of eligible employees with workplace pensions (in thousands): by banded rate of employer contribution in the private sector, 2012 to 2018, Great Britain
Source: DWP estimates derived from the ONS ASHE, GB, 2012–2018.
4.6.2. Employers matching employee contributions
The proportion of employers who are contributing at least as much to their employee’s pension as the employee themselves can be assessed using the reported contribution rates in ASHE 2018. In this analysis, contribution amounts are measured as a proportion of pensionable earnings and the employee contribution includes tax relief. Table 4.8 shows the proportion of eligible employees who were receiving at least a matching contribution rate from their employer at different employee contribution levels.
Table 4.8 – Percentage of eligible employees receiving a matching employer contribution, by banded rate of employee contribution, in the private sector, 2017 and 2018, Great Britain
Figures are for Great Britain and data in percentages for 2017
| Employee contribution band | Employees receiving a matching contribution or more |
|---|---|
| 2-<3% | 92.4% |
| 3-<4% | 35.6% |
| 4-<5% | 89.8% |
| 5-<6% | 90.5% |
| 6-<7% | 88.3% |
| 7-<8% | 88.9% |
| 8-<9% | 86.7% |
| 9-<10% | 80.1% |
| 10+% | 52.4% |
Figures are for Great Britain and data in percentages for 2018
| Employee contribution band | Employees receiving a matching contribution or more |
|---|---|
| 2-<3% | 35.6% |
| 3-<4% | 62.7% |
| 4-<5% | 86.3% |
| 5-<6% | 89.3% |
| 6-<7% | 86.5% |
| 7-<8% | 85.3% |
| 8-<9% | 87.0% |
| 9-<10% | 76.2% |
| 10+% | 48.2% |
Source: DWP estimates derived from the ONS ASHE, 2018.
The data suggests that most employees in most contribution rate bands were receiving at least matching contributions from their employers. For example, in 2018, around 62.7 per cent of eligible employees in the private sector contributing between three and four per cent received a matching (or higher) employer contribution.
The exception is the proportion in the 2-3 per cent band in 2018. Looking at the comparison between 2017 and 2018 we see a decrease in employers matching contributions in 2018, particularly in the 2-3 per cent and 3-4 per cent bands. In 2017, the minimum contribution rates were two per cent of qualifying earnings of which one per cent had to be contributed by the employer, so, at the minimum contribution rates, employers were required to match the employee contribution. In 2018 the minimum requirements were five per cent of which two per cent had to be contributed by the employer, so, at the minimums, the employer is no longer required to match. This might explain why, despite employers contributing more in total in 2018, a smaller proportion of employees are receiving matching contributions.
It is not necessarily the case that if employees were to continue to increase their contributions that this would be matched by employers. It is also not possible to determine from the data how the willingness to contribute at higher levels is split by those employers who did and did not offer pension provision prior to 2012 (when the reforms were introduced). Whilst we do not have the information to tell us why so many employees are receiving matching contributions, the data presented in Table 4.8, viewed alongside the evidence on employer contribution rates in section 4.6.1, indicates that contribution matching is a common employer behaviour which appears to be persisting.
4.6.3. Preparedness for contribution increases
Under automatic enrolment, minimum contribution rates prior to April 2018 were two per cent of qualifying earnings[footnote 93], of which at least one per cent must come from the employer. In April 2018 this increased to five per cent of qualifying earnings of which at least two per cent must come from the employer, and in April 2019 it increased to eight per cent of which at least three per cent must come from the employer. Figure 4.24 shows the number of eligible private-sector employees who were already contributing at the 2018 and 2019 minimums in April 2017, and the number who were already contributing at the 2019 minimums in April 2018.
Figure 4.24 – Number of eligible employees making contributions at or above future minimum levels, in the private sector, 2017 and 2018, Great Britain.
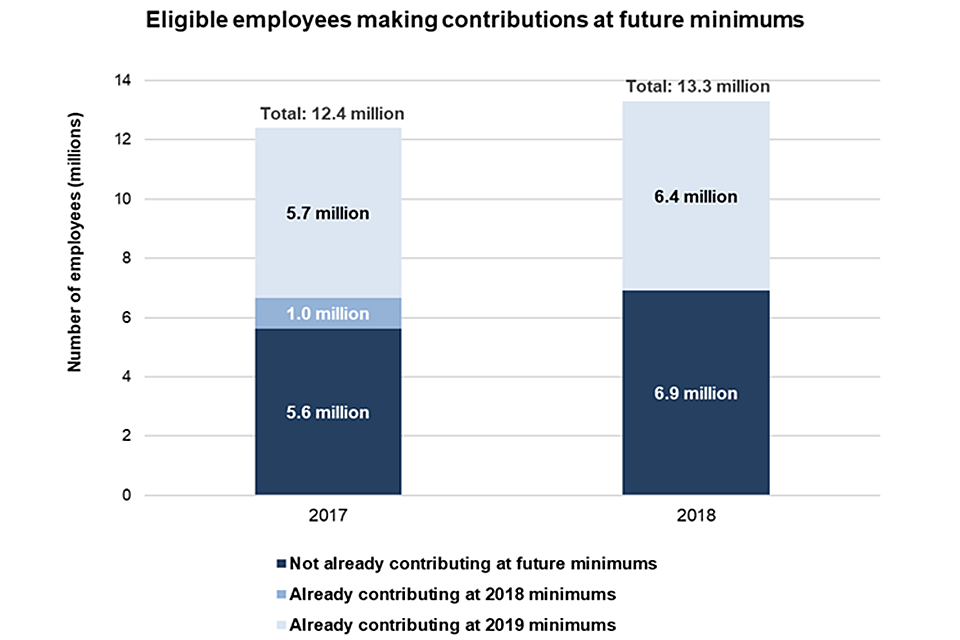
Figure 4.24 – Number of eligible employees making contributions at or above future minimum levels, in the private sector, 2017 and 2018, Great Britain
Source: DWP estimates derived from the ONS ASHE, GB, 2018
In April 2017, approximately 5.7 million eligible private-sector employees already had total contributions and employer contributions sufficient to meet the April 2019 minimum contribution requirements. A further 1.0 million employees had contributions which were sufficient to meet the April 2018 minimum contribution requirements, but which may need to be increased further to meet the April 2019 requirements. Approximately 5.6 million employees may have needed to increase their contributions to meet the 2018 requirements.
In April 2018, the number of eligible private-sector employees who were making contributions sufficient to meet the 2019 minimum requirements had risen to approximately 6.4 million. A further 6.9 million may have needed to increase contributions to meet the 2019 minimum requirements.
4.6.4. Changes in employer contributions
Section 4.6.1 examined the overall trend in employer contributions of eligible savers over time. This does not show the changes in employer contributions that an individual employee might experience. ASHE data follows individuals over time and shows how their pension status changes from one year to the next. This is of interest because employers may choose to change their contributions to manage their pensions costs, particularly in the face of additional costs due to automatic enrolment.
Tables 4.9 and 4.10 and Figure 4.25 show, for each pair of years from 2010-2011 to 2017-2018, estimates of the numbers of private sector employees who were:
- present in both years of data
- eligible for automatic enrolment and contributing to a pension in the first year
- did not move jobs between years
It also divides employees into categories based on their pension status in each year.
There were 4.7 million eligible employees observed in both 2010 and 2011 not moving jobs. Of these, 0.7 million (15.4 per cent) saw their employer contributions increase between 2010 and 2011 and 0.6 million (13.3 per cent) saw them decrease. By 2017 roll-out of automatic enrolment had nearly completed, so the number of eligible employees contributing to a pension in the first year had increased substantially. In 2017-2018 the number of eligible employees observed in both years had increased to 8.6 million of which 3.0 million (34.5 per cent) saw an increase in employer contributions and 0.8 million (9.3 per cent) saw a decrease.
Table 4.9 – Percentage of private sector eligible savers in both years of data with employer changing contributions, Great Britain
Figures are for Great Britain and data in percentages
| Savers | 2010-2011 | 2011-2012 | 2012-2013 | 2013-2014 | 2014-2015 | 2015-2016 | 2016-2017 | 2017-2018 |
|---|---|---|---|---|---|---|---|---|
| Total eligible employees in both years of data (thousands) | 4,737 | 4,399 | 4,660 | 5,169 | 6,564 | 7,429 | 7,655 | 8,638 |
| Became non-eligible | 1.6% | 1.7% | 2.5% | 2.5% | 2.4% | 2.7% | 2.6% | 2.8% |
| Stopped saving | 4.2% | 4.3% | 3.7% | 2.5% | 2.4% | 5.9% | 4.1% | 4.8% |
| DB both years | 32.7% | 30.9% | 30.8% | 28.6% | 22.2% | 18.2% | 17.4% | 14.0% |
| Switched saving | 14.3% | 14.3% | 16.0% | 16.1% | 17.8% | 18.9% | 20.1% | 20.3% |
| No change in contributions | 18.6% | 19.5% | 18.5% | 19.8% | 23.8% | 23.6% | 25.9% | 14.3% |
| Increased contributions | 15.4% | 15.7% | 14.0% | 17.1% | 17.8% | 16.6% | 16.4% | 34.5% |
| Decreased contributions | 13.3% | 13.6% | 14.4% | 13.4% | 13.6% | 14.2% | 13.5% | 9.3% |
Source: DWP estimates derived from the ONS ASHE, GB, 2010 to 2018.
Notes:
1. Numbers refer to eligible employees present in both years not changing job. 2. Employee categories are defined as:
- became non-eligible: These employees have become non-eligible for automatic enrolment in Year 2 after being eligible in Year 1[footnote 94]
- stopped saving: Employees in this group were saving in a workplace pension in Year 1 but weren’t in a workplace pension in Year 2. This may be because they left employment, switched to an employer who wasn’t providing a pension at the time or because they chose to stop saving
- DB both years: Saving in defined benefit (DB) schemes in both years
- switched saving: Employees in this group were saving in a workplace pension in Year 1 and saving in a different type of workplace pension in Year 2 (e.g. from DB to DC scheme). The types of pension included here are DB, DC, GPP, GSIPP and group stakeholder pension
- no change in contributions: These employees have seen no changes in their employer contributions between Year 1 and Year 2
- increased contributions: These employees have seen an increase their employer contributions between Year 1 and Year 2
- decreased contributions: These employees have seen a decrease in their employer contributions between Year 1 and Year 2
Table 4.10 – Number of private sector eligible savers in both years of data with employer changing contributions, Great Britain
Figures are for Great Britain and number of employees in thousands
| Savers | 2010-2011 | 2011-2012 | 2012-2013 | 2013-2014 | 2014-2015 | 2015-2016 | 2016-2017 | 2017-2018 |
|---|---|---|---|---|---|---|---|---|
| Total eligible employees in both years of data (thousands) | 4,737 | 4,399 | 4,660 | 5,169 | 6,564 | 7,429 | 7,655 | 8,638 |
| Became non-eligible | 75 | 74 | 116 | 130 | 159 | 198 | 199 | 243 |
| Stopped saving | 200 | 190 | 172 | 130 | 159 | 441 | 314 | 411 |
| DB both years | 1,548 | 1,360 | 1,437 | 1,480 | 1,460 | 1,351 | 1,333 | 1,208 |
| Switched saving | 678 | 631 | 747 | 833 | 1,166 | 1,406 | 1,537 | 1,758 |
| No change in contributions | 879 | 858 | 863 | 1,023 | 1,560 | 1,750 | 1,984 | 1,232 |
| Increased contributions | 729 | 689 | 652 | 883 | 1,167 | 1,231 | 1,258 | 2,979 |
| Decreased contributions | 629 | 596 | 673 | 691 | 893 | 1,051 | 1,030 | 806 |
Source: DWP estimates derived from the ONS ASHE, GB, 2010 to 2018.
Note: See notes for Table 4.9.
Figure 4.25 – Number of private sector eligible savers in both years of data with employer changing contributions, Great Britain.

Figure 4.25 – Number of private sector eligible savers in both years of data with employer changing contributions, Great Britain
Source: DWP estimates derived from the ONS ASHE, GB, 2010 to 2018.
Note: See notes for Table 4.9.
During the period where automatic enrolment was rolled out, the proportion of eligible employees experiencing changes in their employer contributions remained stable. This was not the case between 2017 and 2018, where the number of eligible employees with employers decreasing contributions fell by around 20 per cent and the number of eligible employees with employers increasing contributions more than doubled. This is likely to be a response to the first increase in the automatic enrolment minimum contributions that took place in April 2018.
The data does not allow us to draw conclusions about the reasons explaining these changes. However, findings from EPP 2019 suggest that where employers have experienced increased contribution costs as a result of automatic enrolment, only one per cent of employers have chosen to reduce existing contributions as a strategy to absorb these costs. Further detail on the strategies used can be found in section 3.2.3.
5. Wider impacts of automatic enrolment and developments to the pensions landscape
This chapter looks at the impact that automatic enrolment has had on the pensions industry whilst noting important developments to the wider pensions and saving landscape including the self-employed. This relates to the following evaluation strategy questions:
EQ6: How has the pensions industry reacted to automatic enrolment?
EQ7: What are the wider impacts of automatic enrolment?
Summary
Existing evidence
-
71 per cent of DC members were in schemes meeting all of TPR’s Key Governance Requirements relating to trustee knowledge and understanding, master trust independence, suitable design of default investment, value for members and core scheme financial transactions. This is an increase from 2018
-
at least 95 per cent of all adviser types (accountants, payroll administrators, bookkeepers and independent financial advisers) were aware of instant pensions duties, the declaration of compliance, postponement and re-enrolment. Awareness has improved since 2017, particularly in relation to instant automatic enrolment duties
-
whilst workplace pension participation of eligible employees has increased since 2012, the proportion of self-employed people actively contributing to a pension has decreased steadily since the late 2000s, from 27 per cent in 2008-09 to 15 per cent in 2017-18
-
the main reason behind the fall in the self-employed pension participation rate was a large net inflow into self-employment of people aged 50 plus who stopped saving once entering from employment, combined with a net outflow of people who had been saving into retirement/inactivity
New analysis within this report
-
a positive relationship exists between age and the probability of self-employed individuals saving into a pension. However the strength of this relationship decreases with age. Self-employed men and those with higher income are also more likely to save into a pension
-
trialing of messaging to encourage self-employed individuals to engage with long-term saving has found that initial ‘open’ rates of messages are relatively high in comparison with analogous industry marketing emails. However, the percentages of recipients engaging further by then logging into their accounts are lower than expected
5.1. Pensions industry
5.1.1. Protecting the interests of employees and employers
Government’s regulatory approach to occupational pension schemes has continued to evolve to address emerging risks, strengthen pension scheme governance and stability and facilitate increased engagement where members choose to do so.
The introduction of automatic enrolment led to a significant increase in the number of Master Trust schemes to over 90 schemes. Master Trusts offer workplace pensions to groups of employers that are not connected with each other and are run by a trustee board. More than 90 per cent of those brought into a workplace pension through automatic enrolment were enrolled in a Master Trust. There are almost 14 million pots in Master Trusts accounting for £29 billion.
To improve protection for members, legislation introducing an authorisation and supervision regime for Master Trusts came into effect on 1 October 2018. This was a significant new step requiring all existing schemes to be authorised by TPR to be able to operate in the market or take steps to leave the market and transfer their members to another scheme. The authorisation process for existing schemes is now complete. At the start of the authorisation process, 90 Master Trusts were operating in the market. Of the 38 Master Trusts that submitted an application for authorisation, 37 have been granted authorisation and one scheme withdrew its application. This is a reduction in the overall size of the market by almost 60 per cent[footnote 95].
Going forward, TPR’s supervision regime will ensure schemes continue to meet the authorisation criteria and provide it with greater powers to engage with and intervene, including potentially to close schemes. The Government is working with the Regulator to ensure that the supervisory regime will be proportionate to the current risks in the market and potential impact on members including confidence in pension saving.
A simpler regulatory framework for transfers without consent between DC schemes is enabling continued consolidation of schemes, improving efficiency and governance whilst also reducing costs. DC Pension scheme numbers have fallen by more than half in the last 8 years, and this year Government consulted on policy proposals to encourage further consolidation by requiring smaller schemes to regularly report on whether it would be in members’ interests to consolidate. We expect to consult on legislation to achieve this in early 2020.
DWP has consulted on simpler annual benefit statements and will be publishing a response later this year. The consultation looked at how to deliver better annual workplace pension benefit statements that are shorter, simpler and have information that is easy to understand and will help members plan for the retirement they want. It was structured around three issues:
- views and evidence on the principle of short, simple, statements, presenting 3 options – and how adoption can be delivered through voluntary or mandatory approaches
- the presentation of information on costs and charges that can help members identify what they have paid for their pensions
- ownership of the guidance on the assumptions used in statements and how they can help members identify if their savings are on track
It also looked for views on the relationship of simpler statements with innovative communication tools, including pension dashboards, and how to encourage savers to open their statements.
Putting individuals in control of how and when they access their information can help to increase awareness and understanding of saving for retirement. Pensions dashboards will offer people the opportunity to securely access their pensions information online, all in one place and at a time of their choosing. DWP published its pension dashboards consultation response in April 2019, and has recently introduced legislation to support this new service on the 7th January 2020. Government has asked the arms-length body the Money and Pensions Service to bring together a delivery group, involving industry and consumer representatives, to support the design and delivery of the infrastructure required to support dashboards introduction. This approach will harness the best of industry innovation while ensuring that industry meets its responsibilities to protect consumers.
5.1.2. Guidance from TPR
Automatic enrolment has led to a large increase in the number of savers in DC pension schemes. In April 2015, new legislative requirements regarding the governance of these schemes commenced and TPR was entrusted with regulating compliance, while continuing to raise standards of governance and administration across all areas of DC scheme management.
TPR’s revised code of practice for DC schemes, which came into force in July 2016, sets out the standards that TPR expects the trustees of DC schemes to meet when they are complying with their legal requirements[footnote 96]. The regulator has been measuring the extent to which these schemes are meeting five key governance requirements (KGRs) through their annual survey of trust-based occupational DC schemes[footnote 97].
Some of the key findings of the 2019 report included:
- 71 per cent of DC members were in schemes meeting all their KGRs, which is an increase from 2018. At least 90 per cent were in schemes meeting each of KGR 1 (trustee knowledge and understanding), KGR 4 (master trust independence requirements) and KGR 5 (suitable design of default investment strategy)[footnote 98]
- the percentage of DC members in schemes meeting all their KGRs has increased by 39 percentage points since 2017 and 17 percentage points since 2018
- compared with 2018, there has been a large increase in the proportion of members in schemes meeting KGR 3 (core scheme financial transactions) from 63 per cent to 85 per cent. But there has been a decrease for KGR 2 (value for members assessment) from 86 per cent to 80 per cent and KGR 5 (suitable design of default investment strategy) from 95 per cent to 90 per cent
- there was a strong correlation between scheme size and the number of requirements being met. All master trusts met two or more applicable requirements, compared to 84 per cent of large, 64 per cent of medium, 15 per cent of small and 12 per cent of micro schemes[footnote 99]
- 62 per cent of schemes did not meet any of the KGRs that applied to them, an increase from 48 per cent in 2018. This was primarily driven by micro schemes; 74 per cent did not meet any KGRs. While 59 per cent of small schemes also did not meet any KGRs, this proportion fell to 16 per cent of medium schemes and 4 per cent of large schemes
5.1.3. Adviser engagement with Automatic Enrolment
The regulator published research in July 2019 measuring advisers’ knowledge about Automatic Enrolment, to understand the extent to which they supported newly established businesses with their initial duties and small businesses with their ongoing duties. The survey was carried out with advisers who provided pensions information or assistance to business clients, including accountants, payroll administrators, bookkeepers and independent financial advisers (IFAs)[footnote 100]. Key findings included:
- at least 95 per cent of each adviser type were aware of instant pensions duties[footnote 101], the declaration of compliance, postponement and re-enrolment
- awareness has improved since the 2017 Intermediaries Survey, particularly for instant pension duties (from 73 per cent to 100 per cent for accountants, 69 per cent to 99 per cent for payroll administrators and from 67 per cent to 97 per cent for bookkeepers)
- almost all advisers provided support or assistance with Automatic Enrolment to at least some of their newly established business clients (97-100 per cent). The majority of accountants, payroll administrators and bookkeepers believed that their newly established business clients relied on them completely to help them through Automatic Enrolment (58 per cent, 63 per cent and 70 per cent respectively). This proportion was lower among IFAs (33 per cent)
- there was no evidence of any significant barriers to helping newly established businesses with Automatic Enrolment. The most commonly mentioned challenge among accountants, payroll administrators and bookkeepers was a lack of knowledge among clients (mentioned by 31 per cent, 37 per cent and 23 per cent respectively). Among IFAs, the most common challenge was that clients were not prepared to pay them what was required (mentioned by 26 per cent)
- the majority of accountants (92 per cent), payroll administrators (99 per cent) and bookkeepers (95 per cent) helped small business clients with their ongoing duties. A lower proportion of IFAs (62 per cent) did so. These findings are consistent with those from the 2017 Intermediaries Survey
5.2. Promoting long-term saving amongst the self-employed
5.2.1. Introduction and context
The 2017 Automatic Enrolment Review set out the rationale and scope of the government’s strategy behind enabling retirement saving for the self-employed, with proposed trialling[footnote 102] and further plans set out in more detail in December 2018[footnote 103].
Where possible the intention is to build on and apply the successful behavioural principles underpinning automatic enrolment. This chapter provides a short update on evidence-based development and trialling activity since December 2018[footnote 104].
According to ONS, nearly 5 million people are self-employed in the UK[footnote 105], out of a working population of over 32 million. The proportion of self-employed in the workforce has increased from 12% in 2001 (3.3 million people) to 15% in 2019[footnote 106]. As these figures are based on self-reported employment status, it is likely that some ‘gig workers’ are included in these figures. However, the number is likely to be small. Definitions and estimates of the size and scope of the ‘gig economy’[footnote 107] vary markedly, making, in turn, any estimate of the number of self-employed ‘gig workers’ highly uncertain.
Whilst workplace pension participation of eligible employees has increased since 2012, as shown in Chapter 4.1, the proportion of self-employed people actively contributing to a pension has decreased steadily since the late 2000s, from 27 per cent in 2008-09 to 15 per cent in 2017-18[footnote 108]. Other surveys also indicate around a halving in the pensions participation rate over a similar period[footnote 109].
5.2.2. The self-employed and pensions – why the decline?
At the ‘macro’ level, DWP analysis of a longitudinal sample of self-employed people taken from the Wealth and Assets Survey (WAS)[footnote 110] suggests that while there was a decline in the pension participation rate of people who were self-employed throughout all five waves (i.e. from 2006-08 to 2014-16), the main reason behind the fall in the participation rate was a large net inflow into self-employment of people aged 50 plus[footnote 111] who stopped saving once entering from employment, combined with a net outflow of people who had been saving into retirement/inactivity.
There may be many reasons for this:
- the self-employed, including so-called ‘baby boomers’, are more likely to have savings and wealth in other types of assets especially property[footnote 112]
- new entrants to self-employment from age 55 may already be decumulating pensions[footnote 113]
- people may be retiring gradually or prolonging their working lives through self-employment and moving into casual or part-time work and feeling no need to continue saving
- the increase in self-employment may well be among those who do not employ others – so they would not necessarily have to consider issues around automatic enrolment and pensions (and therefore may not consider their own as part of any ‘social norming’ of pension saving)
- approaching ‘retirement age’ may serve as a behavioural ‘signal’ to stop saving for retirement
- the economic downturn of 2008-09 – there has been a steady decline in the pension participation rate between WAS waves 1 and 5 i.e. 2006-08 to 2014-16
- there may be a gender effect in that growing numbers of women have become self-employed in recent years: traditionally, female pension participation has been lower than that of men
Some of these potential reasons are explored, directly and indirectly, in the research and analysis that has been carried out since December 2018 looking at participation in long-term saving, including pensions, of the self-employed across the whole age range; attitudes to and behaviours around saving; barriers to saving[footnote 114]; and how long-term saving can be enabled.
5.2.3. The self-employed and pensions – factors associated with pension and long-term saving
At the ‘micro’ level, it is worth looking at factors (demographic, socio-economic, attitudes and behaviours etc.) associated with pensions participation. Two recent studies, an internal DWP econometric analysis of participation based on WAS wave 5 data, and research commissioned by Nest Insight[footnote 115] highlight, in the former, factors associated with saving into a pension on the part of the self-employed, and, in the latter, attitudes towards and behaviours around pension saving.
5.2.4. Analysis of self-employed pension participation
The econometric analysis estimated the probability of a self-employed individual saving into a pension scheme[footnote 116]. It used logistic regression[footnote 117] to assess the strength of association with saving of a wide range of variables including personal characteristics, personal finances and wealth, working-age benefits, business assets and attitudinal variables.
Table 5.1 shows the variables, coefficient estimates, standard errors (SE), average marginal effects[footnote 118] and the p-values (measure of statistical significance) for each covariate.
Table 5.1 - Logistic regression outcomes
| Variable | Variable Type[footnote 119] | Estimate | Standard Errors | Average Marginal Effect | P-Value |
|---|---|---|---|---|---|
| Age | Continuous (actual age in yrs.) | 0.250 | 0.028 | 8.07 ppts | <.0001 |
| Age squared | Continuous (actual age in yrs.) | -0.002 | 0.000 | -0.08 ppts | <.0001 |
| Gender | Discrete | 0.214 | 0.069 | 6.93 ppts | 0.002 |
| Migrant | Discrete | -0.275 | 0.085 | -8.90 ppts | 0.001 |
| Has employees | Discrete | 0.081 | 0.082 | 2.62 ppts | 0.325 |
| HH net financial wealth | Continuous (in £10k. bands) | 0.003 | 0.001 | 0.11 ppts | 0.007 |
| HH property wealth | Continuous (in £100k. bands) | -0.009 | 0.006 | -0.29 ppts | 0.157 |
| HH physical wealth | Continuous (in £10k. bands) | 0.004 | 0.005 | 0.12 ppts | 0.425 |
| Paying rent | Discrete | -0.440 | 0.091 | -14.22 ppts | <.0001 |
| Has a degree | Discrete | -0.074 | 0.061 | -2.39 ppts | 0.228 |
| Working full time | Discrete | 0.055 | 0.074 | 1.77 ppts | 0.457 |
| Gross income | Continuous (in £10k. bands) | 0.065 | 0.013 | 2.10 ppts | <.0001 |
| More than one job | Discrete | 0.447 | 0.120 | 14.44 ppts | 0.000 |
| Will sell business for retirement | Discrete | 0.337 | 0.104 | 10.87 ppts | 0.001 |
| Working age benefits | Discrete | -0.169 | 0.105 | -5.44 ppts | 0.107 |
| Has a partner | Discrete | -0.129 | 0.088 | -4.17 ppts | 0.143 |
| Has dependent children | Discrete) | -0.044 | 0.077 | -1.41 ppts | 0.572 |
| Single parent | Discrete | -0.108 | 0.218 | -3.50 ppts | 0.620 |
| Urban resident | Discrete | -0.189 | 0.064 | -6.12 ppts | 0.003 |
N= 2209. Shaded estimates are statistically different from zero with at least 99% confidence
The results show:
- an average significant positive relationship between age and the probability of pension saving; but incorporating an ‘age squared’ variable suggests that this relationship decreases with age. Note that the model does not control for cohort effects that could be affecting these outcomes
- men are significantly more likely (around seven percentage points) to save on average than women
- migrants are nine percentage points less likely to save[footnote 120]
- a £10,000 higher net financial wealth leads to an average increase in the probability of pension saving of just 0.11 percentage points
- individuals who are paying rent are 14 percentage points less likely to save into a pension scheme
- a £10,000 higher income increases the probability of pension saving by two percentage points on average
- self-employed individuals with more than one job are around 14 percentage points more likely to save into a pension scheme. It is important to note that some of these individuals could be employees in one of their secondary jobs and be contributing in their respective schemes
- those who own their own business and are planning to sell it to fund their retirement are nearly 11 percentage points more likely to save into a pension compared to those who either do not own their business or are not planning to sell it to fund their retirement
- urban residents are, on average six percentage points less likely to save into their pension schemes. This could be related to higher living costs in urban areas
The analysis suggests that age and gender are clear factors associated with pension participation of the self-employed. Income, although significant, was found to be less significant than might be expected
5.2.5. Self-employed women’s pension participation
Self-employed women’s active pension participation rates have been consistently lower than men’s, see Figure 5.1 below, which looks at WAS waves 1 (2006-08), 3 (2010-12) and 5 (2014-16). However, the gap appears to have narrowed since wave 1. Indeed, if the definition of participation is extended to include retained pensions (i.e. pensions that people have previously saved into but not currently), the gap is narrower still, see Figure 5.2, to the extent that women’s participation rate at wave 5 was on a par with that of men.
Figure 5.1 - Percentage of self-employed actively saving into a workplace or personal pension, 2006-08 to 2014-16.
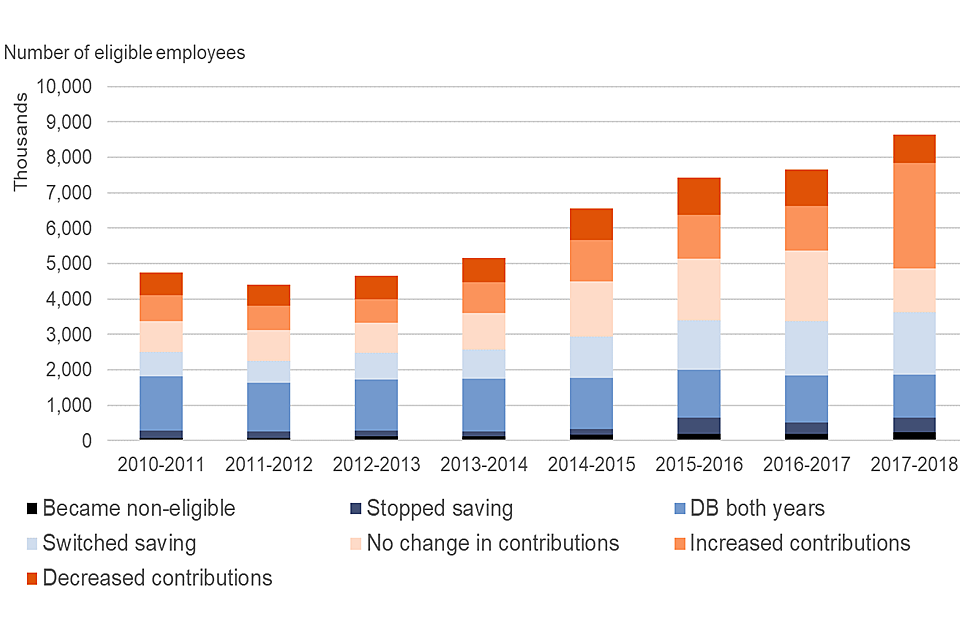
Figure 5.1 - Percentage of self-employed actively saving into a workplace or personal pension, 2006-08 to 2014-16
Source: DWP analysis of Wealth and Assets Survey
Figure 5.2 - Percentage of self-employed actively saving into a workplace or personal pension, or with a retained pension, 2006-08 to 2014-16.
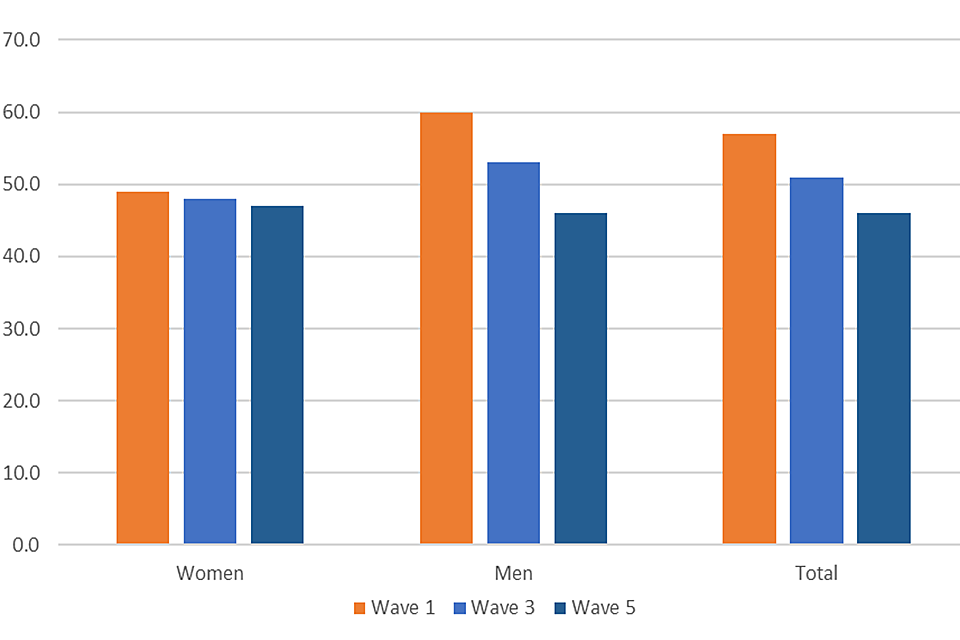
Figure 5.2 - Percentage of self-employed actively saving into a workplace or personal pension, or with a retained pension, 2006-08 to 2014-16
Source: DWP analysis of Wealth and Assets Survey
It is clear from Figures 5.1 and 5.2 that men’s participation has decreased more than women’s on both definitions. The reasons why women’s participation has not changed as much can only be speculative at this stage. We know from existing analysis that self-employed women are currently more likely to be educated to degree level; far fewer women enter self-employment as a first job (as little as five per cent compared with 20 per cent of men); that numbers of women in self-employment have increased more rapidly than for men since the mid-2000s, with roughly equal proportions of women working part-time as full-time[footnote 121]; and that as many as 15 per cent entered self-employment from caring responsibilities (compared with virtually zero for men), with over a third of self-employed women (36 per cent) claiming care benefits when first becoming self-employed[footnote 122].
5.2.6. Mapping and segmentation of the self-employed
As noted in section 5.2.1, there is no single agreed definition of self-employment and therefore the coverage/size of the self-employed population is difficult to estimate[footnote 123].
Notwithstanding issues around definition, there is significant heterogeneity within the self-employed population. This heterogeneity maps across demographic and socio-economic characteristics, attitudes and behaviours and labour market backgrounds and experiences. These have been mapped in recent years by, amongst others, the Resolution Foundation[footnote 124] and Ipsos-MORI, for HMRC[footnote 125].
A further mapping exercise of the self-employed, including ‘vulnerable’ groups, was conducted as part of the quantitative research commissioned by Nest Insight, to inform any future trialling activity[footnote 126]. This found multiple overlaps of groups defined using different definitions of ‘vulnerability’ e.g. those with low incomes, those in ‘vulnerable’ sectors (with unpredictable work, traditional low pay etc.), those without pensions or savings and so on.
The same research looked at various aspects of self-employed people’s characteristics, attitudes and behaviours around planning and saving for retirement and the long-term. In particular, it looked at:
- levels of potential engagement with advice and guidance on saving for retirement
- willingness to save for pensions and retirement: the research suggests the self-employed regard these in a conceptually different way to people in employment
- the range of savings vehicles the self-employed use to save for the long-term. These include savings accounts, ISAs and property, besides pensions; and
- the main online platforms the self-employed use
These are valuable and informative mapping and segmentation analyses. However, they do not in themselves offer obvious routes in to how best to engage the self-employed with regard to long-term saving.
The analyses suggest that trialling and testing of behavioural messages and technologies across the spectrum of the self-employed population would be a sensible next step - with further refinement and targeting of such messages as it becomes clearer ‘what works’/what does not work’ and for whom.
5.2.7. Applying lessons from automatic enrolment
In terms of the development of trialling activity, there are lessons to be learned or transferred from our experience with automatic enrolment. This is on two counts:
- firstly, it is important to acknowledge that there is significant ‘overlap’ between the self-employed and those in employment, both in terms of those who are concurrently in both labour market states and of the majority of self-employed who have at some time previously been employees; and, secondly
- that people’s attitudes and behaviours can be influenced by appropriate, targeted interventions underpinned by the use of behavioural interventions such as the use of default/automatic systems based on inertia, coupled with the framing of messages that have most resonance with people and adapting mechanisms for saving that most closely fit with people’s approaches to financial management
On the first of these, the Pensions Policy Institute (PPI) have estimated that over 400,000 people were concurrently employed and self-employed[footnote 127] in 2012-14, while the majority of the self-employed have been employees at some stage in their working lives. It is quite possible that multiple job-holders will have access to a workplace pension through automatic enrolment although, as part-time workers, they would be less likely to meet the automatic enrolment earnings threshold. Moreover, many self-employed may have employees who are eligible for automatic enrolment.
It is also possible that many self-employed, often working with or alongside employees (but even if not) have been influenced in recent years by the growing acceptance of saving into a pension as a social norm[footnote 128]. The Nest Insight survey[footnote 129], undertaken as part of the research to inform future trialling activity, found that nine in ten (88 per cent) had been employed at some point in their working life.
It is also worth noting that most self-employed people have not made multiple transitions between employment and self-employment – while there is evidence that the self-employed have more jobs (employed/self-employed) on average than employees during their working lives[footnote 130], the majority have made just a single transition from being an employee to self-employment. It is perhaps therefore likely that many people recently moving into self-employed will have been ‘exposed’ to automatic enrolment, either through having previously been enrolled or through an extended period with employers with a workplace pension scheme or in the process of implementing automatic enrolment.
The Nest Insight survey[footnote 131] found that over a quarter (27 per cent) of the sample of 2,000 self-employed people employed at least one other person as an employee. This is a significant proportion of the self-employed, and constitutes a further potential direct overlap with automatic enrolment. As noted above, the DWP econometric analysis (section 5.2.4 above) found a small but positive relationship between having employees and pension participation.
While this overlap with employment and automatic enrolment of the self-employed might at first sight suggest a ‘read across’ of automatic enrolment from employees to the self-employed, and the feasibility of applying similar behaviourally-based policies, potential issues are that:
- firstly, as the PPI have noted, many of the more ‘precarious’ sectors include those who tend to enter self-employment earlier in their working life, while those working in the more ‘privileged’ sectors may often have spent time in conventional employment prior to becoming self-employed. If we are aiming to target the former, there is therefore less likelihood of many older people in those sectors having experienced automatic enrolment and may be less susceptible to automatic enrolment-inspired behavioural measures[footnote 132]
- secondly, the attitudes of the self-employed may be very different from those of employees. Nest Insight conducted qualitative group discussions and interviews with self-employed people, finding that because the self-employed tend to have more variable incomes than the employed, there was a focus on the ‘here and now’, on flexibility and on control[footnote 133]. Thus, engaging with a savings mechanism based on inertia would probably need to be subject to the individual self-employed person setting the parameters for that engagement, such as the regularity of payments and amounts to be saved, and thereby feeling “in control”. This reflects to a large extent the fact that by opting to set up their business, they have also to some extent expressed a preference for greater independence, flexibility and control in their working lives
5.2.8. Enabling the self-employed to save – messaging trials
Nest Insight’s research has informed the development of the field-based messaging trials, under way at the time of publication. The message themes which were found to have the most potential to encourage self-employed people to take action to save for their retirement are being tested in two randomised controlled email trials. The first trial, which began in June 2019, is with members of IPSE (The Association of Independent Professionals and the Self-Employed) who are offered a Group Personal Pension provided by Aegon. This involved 10,000 IPSE members, with IPSE data showing that their members are predominantly in a narrow range of service sector industries (a quarter in the information and communications sector).
The second trial, which began in September 2019, has been with 31,060 Nest members comprising those who signed up as self-employed (9,178 members), lapsed pension members (16,426 who may or may not currently be self-employed) and 5,456 current employer members with single employees (some of whom Nest believed may identify as self-employed).
These samples were selected on grounds of their accessibility, ease of communication with sample members (direct email to existing contacts) and IPSE and Nest’s ability to run a ‘clean’ and coherent randomised trial in which to test the relative impacts of different messages. This does not mean they are necessarily representative of the self-employed population as a whole – and it is worth bearing in mind the heterogeneity of the population - but they do provide a sufficiently large and diverse sample together on which to start testing those messages.
In each case, four different email messages, developed through Nest Insight’s research, are being tested to understand which is most effective in encouraging self-employed members to engage with long-term saving, and whether this will affect their propensity to save:
- palatable Contributions “Could you save £2.50 a day?”: describing contributions as a daily rather than a monthly amount
- Pension Flexibility “Flexible pension options for the self-employed”: emphasising that you can pay “what you can when you can”
- Tax Benefits “A tax-free way to save for your retirement”: explaining tax relief on pension contributions
- Loss Frame “Don’t miss out on pension returns”: in the qualitative research people responded less well to this message, which is framed in terms of what they might lose. However, loss frames have previously performed well in behavioural trials, which suggests there may be a gap in what people say they will respond to in this research, and what they actually will respond to in a real situation
The measurements being captured from the two messaging trials are as follows:
- percentage of email recipients opening the email (i.e. the ‘open’ rate’)
- percentage of recipients opening the email and then clicking on the URL which led to the IPSE or Nest website (i.e. the ‘click-through rate’ or CTR)
- percentage of Nest recipients who make changes to their contribution levels over the subsequent 3 and 6 months or make pensions transfers
5.2.9. Initial findings from the IPSE and NEST messaging trials
Figures 5.3 and 5.4 show the ‘open’ rates and click-through rates (CTRs) for each of the four message types[footnote 134]. Note that these rates include all recipients who opened or clicked through the initial email and/or the reminder email sent one month afterwards[footnote 135].
Figure 5.3 – IPSE trial ‘open’ rates and CTRs.
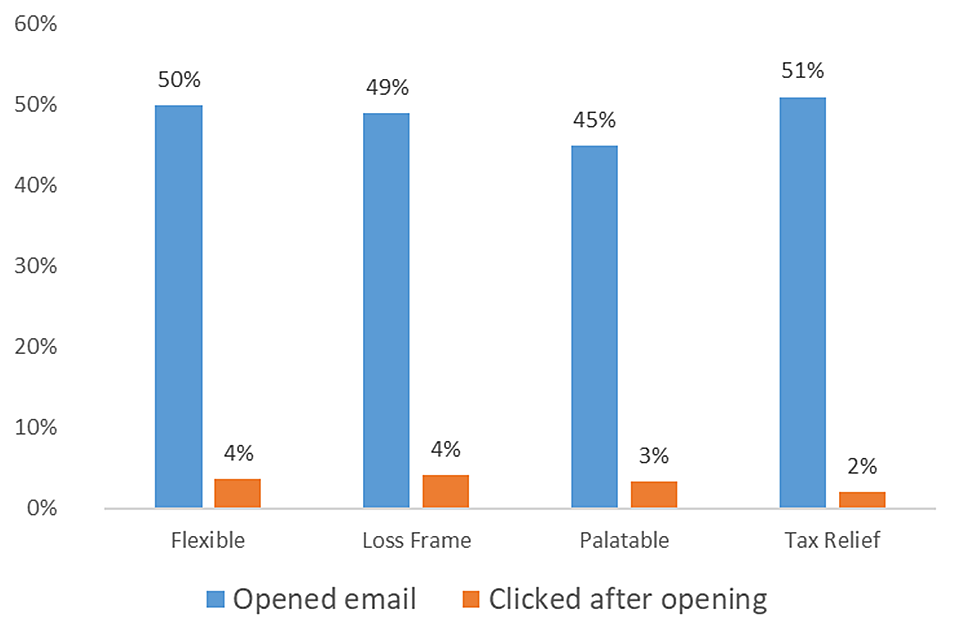
Figure 5.3 – IPSE trial ‘open’ rates and CTRs
Source: Nest Insight.
Figure 5.4 - Nest trial ‘open’ rates and CTRs
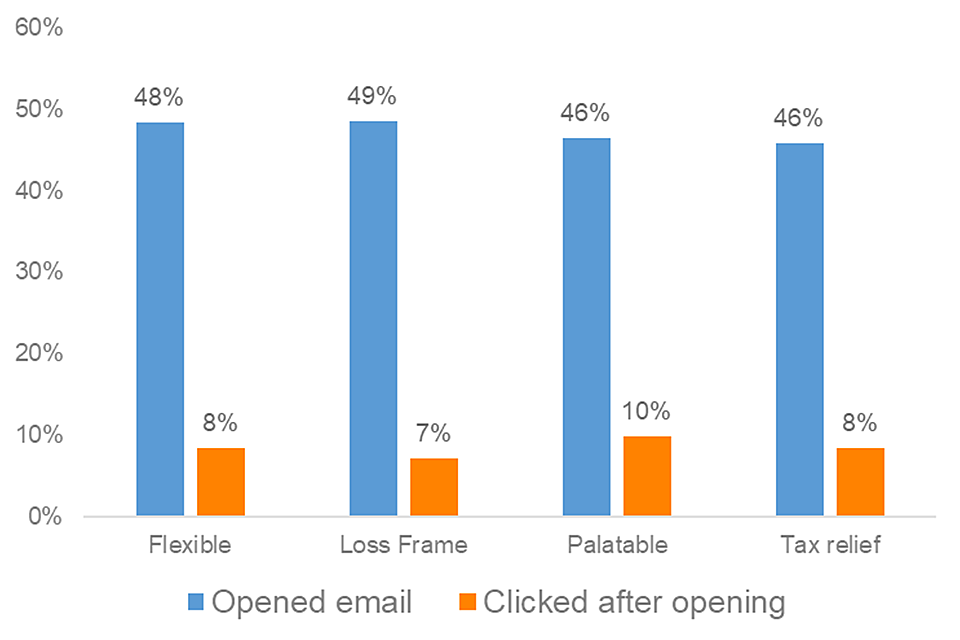
Figure 5.4 - Nest trial ‘open’ rates and CTRs
Source: Nest Insight.
The ‘open’ rates are similar across both trials and relatively high, at least by comparison with those of analogous industry marketing emails. The Nest CTRs are higher than IPSE’s (and higher than typical commercial marketing campaigns) but slightly below expected rates based on Nest’s own previous campaigns[footnote 136].
The initial findings from analysis of the ‘open’ rates and CTRs suggest that:
- for the ‘open’ rates in the IPSE trial, the ‘Tax relief’ email compared favourably to the ‘Palatable’ email
- in the IPSE trial, while the reminder email did result in more, different people opening the emails, roughly equivalent to the percentage opening the initial email, it did not result in any increase in the CTRs. For each of the messages, both emails were opened by more than 20 per cent of recipients[footnote 137]
- however, the reminder email had less impact in the Nest trial
- there were no significant differences between the CTRs for any of the emails after they were opened
It should be noted that these are initial findings, that outcomes from the trials will continue to be observed in the coming months and that there will be more detailed analysis to enable us to consider implications for future work.
5.2.10. Next steps
Further analysis of the messaging trials will be conducted, with Nest Insight planning to publish a full findings report later in 2020. These findings will inform the next stage of trialling, with plans for technology-based trials testing tools and solutions to make it easier for self-employed people to save for the long-term[footnote 138].
6. Conclusion
The second planned increase in minimum contribution rates took place in April 2019, marking the completion of the implementation period for automatic enrolment. This report has collated new and existing evidence from a wide range of sources to provide the most complete view to date of how the workplace pension reforms have been delivered and the effects they have had on individuals, employers and the pensions industry. Almost eight years on from the introduction of automatic enrolment, the evidence presented here suggests that:
- the delivery mechanisms set up to support automatic enrolment in meeting its objectives continue to be effective. More than 10.2 million workers have now been automatically enrolled, and over 1.6 million employers have met their duties. As at the end of March 2019, Nest membership stood at 7.9 million members, with over 720,000 employers
- levels of awareness and understanding of automatic enrolment amongst employers are high and TPR continues to use its powers to ensure that employers comply with their legal obligations
- the number of eligible employees participating in a workplace pension has increased to 18.7 million in 2018, up from 10.7 million in 2012 whilst the annual total amount saved on behalf of eligible employees in the private sector has increased from £36.2 billion to £50.2 billion over the same period
- employers’ experiences of implementing automatic enrolment became increasingly positive as rollout progressed, particularly among small, micro and newborn employers who, when interviewed in 2016 and 2018, generally found the cost and time burden involved to be lower than they had anticipated
- evidence to date from the first and second contribution increases suggests no significant change in savings behaviour following the increases. The rate of savers making an active decision to stop saving shows a very slight rise from the 2018/19 financial year to the first quarter of the 2019/20 financial year (0.72 to 0.76 per cent). The full impact of phasing will continue to be monitored
- the majority of DC members are now in schemes meeting all of TPR’s Key Governance Requirements
- following the 2017 review of automatic enrolment, DWP has started a programme of trialling work with partners to test mechanisms for increasing long-term savings amongst the self-employed population, not covered by automatic enrolment. This report provides an update on early findings and ongoing evidence base development
7. Annexes
7.1. Real Time Information (RTI) Monitoring of Stopping Saving
7.1.1. Her Majesty’s Revenue and Customs (HMRC) RTI Data
RTI is HMRC’s reporting system for income taxed via Pay As You Earn (PAYE). Employers and pension providers are required to report to HMRC payments to employees (or recipients of occupational pensions) on or before each payment date where it is practical to do so. Within RTI, each submission relates to a payment to an employee (or occupational pension recipient) and when they are submitted to HMRC by the PAYE scheme, they are contained within a Full Payment Submission (FPS). RTI includes information about the PAYE scheme, the employee (or occupational pension recipient), and the payment. However:
- if all employments of one employer are paid less than the Lower Earnings Limit (LEL) (£118 a week or £512 a month in 2019/20) a PAYE scheme is not needed, and the employer is not required to submit RTI. However, if any single employee earns more than this, is in receipt of a pension, has another job, or receives expenses or benefits from the employer, the employer is required to report RTI for all employees[footnote 139]
- employers who are exempt from online payroll reporting do not need to submit RTI electronically. This may be due to religious beliefs, where care services must be provided to the employer or a member of their family, or for other reasons[footnote 140]
RTI only holds information on employments and pensions that are reported through the payroll reporting process. RTI does not include information about both Self-Employment and pensions which are not paid via PAYE (e.g. State Pension and income from other sources that is seen as pension income by the individual).
7.1.2. Coverage
As RTI cannot identify pension contributions made via salary sacrifice and information about employer pension contributions is not collected through RTI, it cannot identify all employees saving into a workplace pension (e.g. an employee with employer-only contributions will be indistinguishable from an employee who is not saving into a pension, as both will have no employee pension contributions).
From comparison with the Annual Survey of Hours and Earnings (ASHE), we estimate that RTI covers about 65 per cent of those saving into a workplace pension. ASHE 2018 reports that 35 per cent of employees saving in April 2018 were saving with employer-only contributions or via salary sacrifice.
In April 2018, 12.32 million eligible employees made employee pension contributions on RTI; this represents 65.7 per cent of the 18.74 million eligible employees reported as saving that month in the Workplace Pension Participation and Savings Trends[footnote 141] Report, which is based on ASHE.
7.1.3. Methodology
The aim of the analysis was to identify the number of employments that have stopped paying pension contributions each tax month (tax months run from 6th of the calendar month to the 5th of the following calendar month).
Our methodology has three steps:
- the first step is to identify spells of pension saving
- the second step classifies whether an employee has stopped pension saving in a particular month, and if yes the reason for stopping
- the third step is to break down the analysis with several classification variables. The below section will outline these steps in more detail
It is important to note that this analysis was produced on a five tax month rolling period, which will be referred to as the interest period. To estimate stoppages in a particular month, the interest period covers that month and the four tax months that follow. If we were calculating the number stopping saving for October 2016, the interest period would include the five months from October 2016 to February 2017.
To identify whether someone who was pension saving in the first month of the interest period through a particular employment stopped or continued saving, we would look at all their payment records in the interest period. The payment records in the last four months of the interest period will determine if we identify the employment as stopping pension saving in the first month of the interest period or if they continued to pension save. For example, if an employee who was saving in October did not make any pension contributions on any of their subsequent payments in November to February through that employment, we would classify them as having stopped pension saving into that employment’s pension scheme in October.
The stopping saving rate for each month is calculated using this methodology, looking at the subsequent four months of payment records to identify whether an employee has stopped pension saving into that employment’s pension scheme in that month. As outlined above, it is possible that the employee may still be receiving employer pension contributions.
It is possible that employments may be counted more than once as stopping saving. This would occur if an employment stopped saving in one month, made no employee pension contributions for at least five tax months, started making employee pension contributions after this time period and then stopped making employee pension contributions for a second time.
7.1.4. Identifying spells of pension saving
The first step was to identify employments that had spells of pension saving. This was done by identifying records that had employee pension contributions. If, on any payment date in a tax month, an employment was found to have employee pension contributions greater than £0 exactly, they were classed as paying employee pension contributions.
All records for an employment in the last 17 complete tax months at the point of analysis, including the interest period, were analysed to find spells of pension saving. This then identified tax months when the employment was making employee pension contributions. Of those identified as pension saving, only employments with employee pension contributions in the interest period were included in the analysis.
The volume of employments with employee pension contributions in each tax month of the interest period were calculated. This figure is used to estimate the level of participation in workplace pension saving per month.
Of the most recent spell of pension saving, the last payment with employee pension contributions was identified.
7.1.5. Classifying stoppages of saving
Once the most recent employee pension contribution has been identified, we identify whether an employee has stopped pension saving, and if yes, the reason for stopping pension saving. We consider an employee as having stopped saving in the following three circumstances:
- employment ended – The reason there are no further employee pension contributions is that the employment has ended. This is identified when the employment is not paid in at least the last 90 days of the five month interest period
- become non-eligible – The reason the employee stopped pension saving is due to becoming non-eligible for automatic enrolment. This is identified when, on the next payment after the final pension contribution, the employment was no longer eligible, and there were no subsequent pension contributions. These employments must be eligible at the point of the final employee pension contribution. Becoming non-eligible could be due to changes in either age or earnings
- active decision – The employee made an active decision to stop saving into a pension. This is identified when the employment is still active and eligible, but stops contributing to a workplace pension. It is therefore inferred to be an active decision to stop pension saving
If the employee died within a close proximity to the last pension contribution (up to and including 29 days before or up to and including 59 days after the final employee pension contribution), the stoppage was classed as deceased. These employments are not included in the three categories above.
If the employment was paid in the last 42 days of the interest period and had up to and including 35 days between the last employee pension contribution and the last payment for the employment, the employment was classed as still being active and saving (i.e. it does not fit in any of the three above categories nor has the employee been identified as deceased).
7.1.6. Analysis breakdowns
To provide more insight, the analysis was broken down with several classification variables. Some of these classification variables required matching to other datasets whilst some were derived.
Age classifications were created by joining to date of births held on central HMRC systems using National Insurance numbers. Age was then calculated using this date of birth and payment date for the final employee pension contribution. Ages were then grouped together into age bands.
Gender classifications were created by joining to central HMRC systems using National Insurance numbers.
Annual earnings was derived by calculating the daily earnings rate for the payment period with the final employee pension contributions. This was then converted into earnings bands based on the expected annual earnings. This provides an estimate of annual earnings and may not reflect an employments annual earnings if there is a change in earnings, such as through promotion or a change in hours worked.
7.1.7. Key assumptions and caveats
The caveats used in this analysis were as follows:
- the volumes of employments stopping saving and other figures estimated using HMRC’s RTI data may differ from other estimates (e.g. survey and sampled data) because of differences in counting methodologies etc
- months referred to tax months, e.g. the tax month of April 2019 was 6th April 2019 to 5th May 2019
- payments from pension providers are excluded from the analysis. These were identified using a pensions flag developed jointly by HMRC and DWP, and which may not always distinguish between pensions and pay from employment accurately. This impacts employments which had payments from both pensions and employments
- payments relating to company directors, as defined via data item 84A in the RTI data items guide[footnote 142], are removed from the analysis. This impacts employments which had payments as both a company director and not
- if the employment moved in and out of the population of interest, due to changing from employment to pension or from director to non-director, it would appear that the employment had ended. The classification of stoppage will vary depending on the length of time the employment is not in the population of interest and the length of time before the employment returns to the population of interest
- if an individual has multiple employments, the individual could be represented multiple times in the data
- some information submitted by employers for RTI is Late, Missing or Incorrect. This is common to all administrative data
- in the April 2019 data, some anomalous cases were identified as not genuinely making an active decision to stop saving and were excluded from the analysis during the quality assurance process
- the gender and date of birth used were those held on central HMRC systems. There were a small number of cases where the gender and/or date of birth were not known. These cases were assumed to be age eligible. These were excluded from the corresponding age and gender analysis
- ‘daily earnings’ were calculated by dividing the change in year to date taxable pay on a payment date by the number of days since the previous payment date. It does not take in to account the number of days or hours worked. It is not possible to calculate this for the first payment for an employment
- the ‘daily earnings’ rate was used to calculate earnings eligibility. A value greater than £27.40 would classify the employment as earnings eligible. Values equal to or less than £27.40 or missing values would result in the employment being classed as earnings ineligible
- taxable pay can differ from gross pay for various reasons, including the type of pension contributions and salary sacrifice (an agreement to reduce an employee’s entitlement to cash pay, usually in return for a non-cash benefit)
- whether an employment was paying pension contributions was based on employee pension contributions only, as employer pension contributions are not submitted via RTI
- f the employer paid the entire pension contribution and the employee paid none or the employee makes pension contributions through salary sacrifice, the employment will not be included in the analysis
- if the employment moves from paying employee pension contributions into salary sacrifice or employer-only contributions, it would appear that the employment has stopped pension saving
- pension contributions were calculated by using the change in year-to-date pension contribution variables. If this value was less than £0.001 or was missing, the in-period pension contributions were used
- the population of identified pension savers may include employments that started pension saving before automatic enrolment was introduced as mandatory. These cases usually relate to employers that provided the option of pension saving before automatic enrolment was rolled out
Please note that some very minor differences between the stopping saving rates presented for the time period up to and including June 2018 in section 4.3.4 and the corresponding rates presented in the 2018 Automatic enrolment evaluation report may occur due to a methodological refinement.
7.1.8. Counts of numbers saving into a workplace pension each month on RTI
This section presents the counts of the number of employments who make employee pension contributions each month on RTI. This data is additionally split by gender, age, earnings level and PAYE scheme size.
This count does not include employments saving via salary sacrifice or employer-only contributions.
Earnings level is calculated on a month-on-month basis, meaning that fluctuations in earnings level (e.g. receipt of a bonus in a given month or fluctuating hours worked) will move employments between earnings bands (e.g. as observed in Figure 6.4 for August each year).
The main finding from these graphs is that the numbers saving into a workplace pension peaked in February 2018, at the completion of staging, and have remained at the same level since, across all categories.
Figure 6.4 – Count of the number of employments making employee pension contributions on RTI each month.

Figure 6.4 – Count of the number of employments making employee pension contributions on RTI each month
Figure 6.5 – Count of the number of employments making employee pension contributions on RTI each month, by gender.
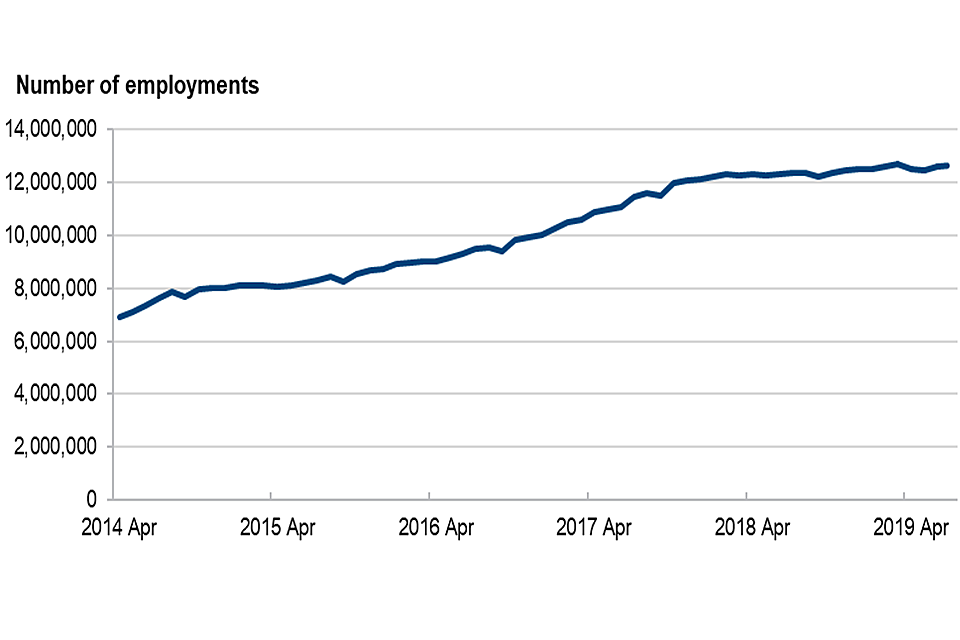
Figure 6.5 – Count of the number of employments making employee pension contributions on RTI each month, by gender
Figure 6.6 – Count of the number of employments making employee pension contributions on RTI each month, by age group.
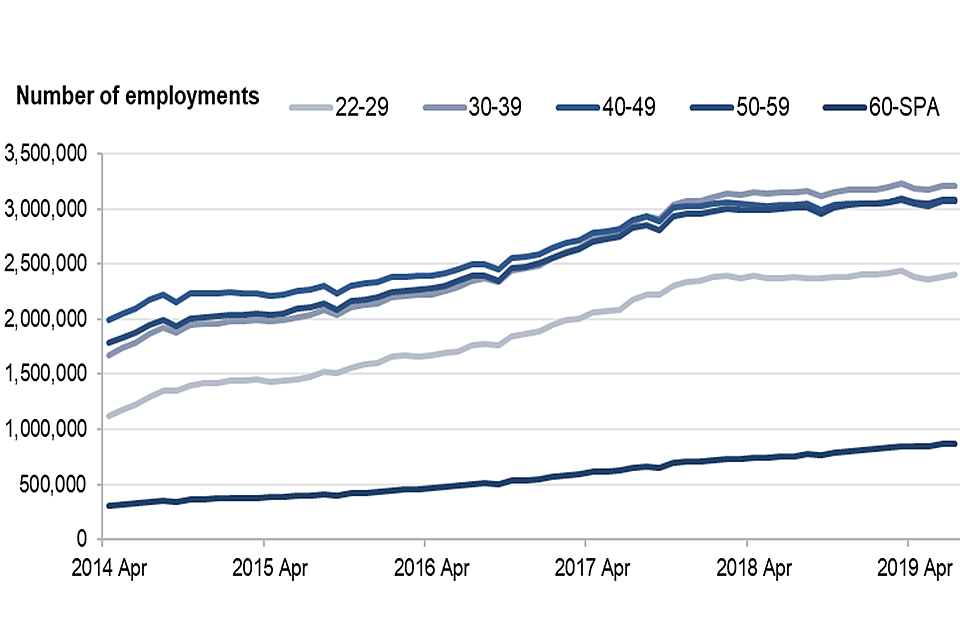
Figure 6.6 – Count of the number of employments making employee pension contributions on RTI each month, by age group
Figure 6.7 – Count of the number of employments making employee pension contributions on RTI each month, by earnings level.
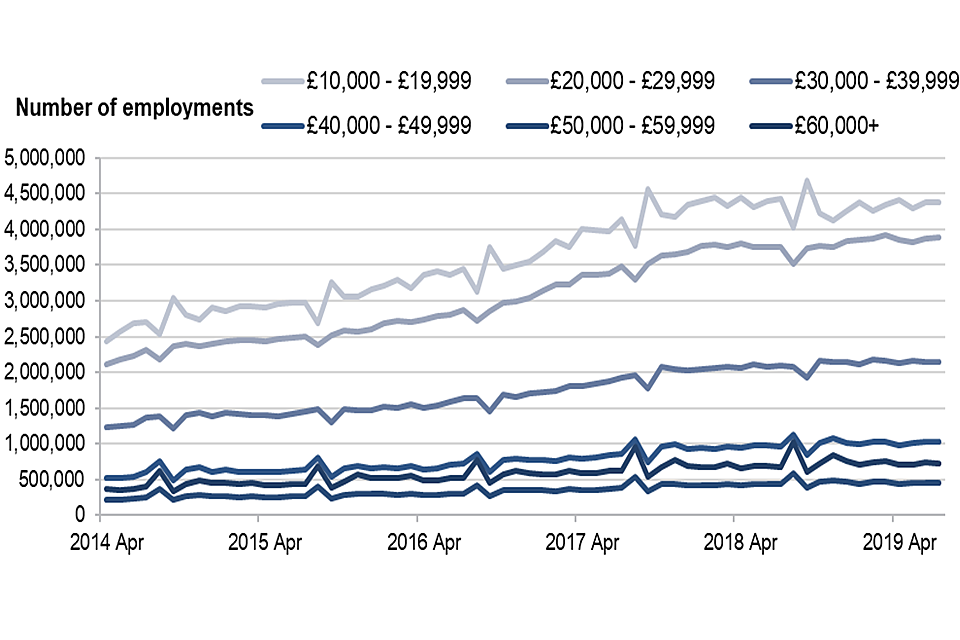
Figure 6.7 – Count of the number of employments making employee pension contributions on RTI each month, by earnings level
Figure 6.8 – Count of the number of employments making employee pension contributions on RTI each month, by PAYE scheme size.
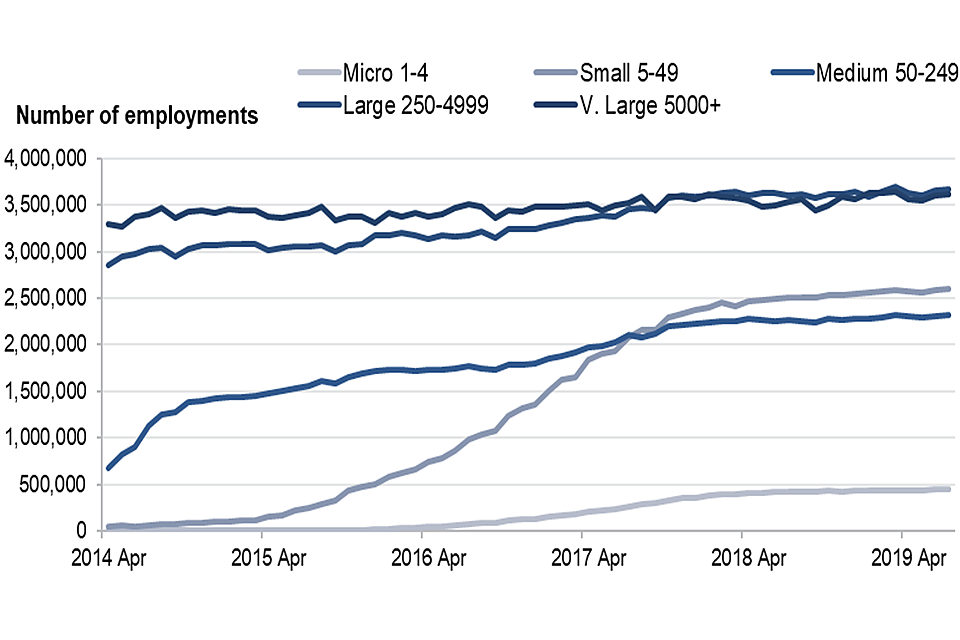
Figure 6.8 – Count of the number of employments making employee pension contributions on RTI each month, by PAYE scheme size
7.1.9. RTI data tables
The following contain the data on which the figures in section 4.3.4 are based. Note, in some tables the sum of the rows may not equal the totals due to rounding.
Table 6.1 – Proportion of those stopping saving, by reason
| Reason | 2014-15 | 2015-16 | 2016-17 | 2017-18 | 2018-19 | Apr 19 - Jun 19 |
|---|---|---|---|---|---|---|
| Stopping saving active decisions | 0.72% | 0.59% | 0.65% | 0.67% | 0.72% | 0.76% |
| Became non-eligible | 0.34% | 0.35% | 0.27% | 0.28% | 0.28% | 0.25% |
| End of employment | 1.46% | 1.54% | 1.73% | 1.82% | 1.93% | 1.74% |
| Total proportion stopping saving | 2.52% | 2.47% | 2.66% | 2.77% | 2.93% | 2.75% |
Notes:
See sections 4.3.3 and 7.1.7 for the methodology and caveats for these figures. Each figure represents the proportion of the employments who stopped saving in that period (e.g. stopping saving active decision).
Table 6.2 – Stopping saving: the proportion of workplace pension savers who make an active decision to stop pension saving each month, by financial year
| Row Labels | April | May | June | July | August | September | October | November | December | January | February | March |
|---|---|---|---|---|---|---|---|---|---|---|---|---|
| 2014-15 | 0.66% | 0.83% | 0.74% | 1.07% | 0.68% | 0.59% | 0.62% | 0.43% | 0.48% | 0.47% | 0.52% | 1.59% |
| 2015-16 | 0.47% | 0.53% | 0.48% | 0.43% | 0.54% | 0.72% | 0.59% | 0.57% | 0.56% | 0.54% | 0.48% | 1.11% |
| 2016-17 | 0.58% | 0.60% | 0.75% | 0.64% | 0.65% | 0.77% | 0.73% | 0.62% | 0.45% | 0.63% | 0.64% | 0.75% |
| 2017-18 | 0.62% | 0.59% | 0.50% | 0.59% | 0.65% | 0.46% | 0.67% | 0.48% | 0.47% | 0.52% | 0.53% | 1.95% |
| 2018-19 | 0.60% | 0.79% | 0.61% | 0.75% | 0.67% | 0.65% | 0.79% | 0.54% | 0.52% | 0.56% | 0.47% | 1.70% |
| Apr 19 - Jun 19 | 0.86% | 0.67% | 0.75% |
Notes:
See sections 4.3.3 and 7.1.7 for the methodology and caveats behind these figures. Each figure represents the monthly proportion of the employments who made an active stopping saving decision in that period.
Table 6.3 – Proportion of those enrolled each period making an active stopping saving decision, by gender
| Gender | 2014-15 | 2015-16 | 2016-17 | 2017-18 | 2018-19 | Apr 19 - Jun 19 |
|---|---|---|---|---|---|---|
| Female | 0.64% | 0.51% | 0.59% | 0.56% | 0.63% | 0.70% |
| Male | 0.82% | 0.66% | 0.71% | 0.78% | 0.81% | 0.82% |
Notes:
See sections 4.3.3 and 7.1.7 for the methodology and caveats behind these figures. Each figure represents the average proportion of the employments who made an active stopping saving decision in every financial year.
Table 6.4 – Proportion of those enrolled each period making an active stopping saving decision, by age group
| Age group | 2014-15 | 2015-16 | 2016-17 | 2017-18 | 2018-19 | Apr 19 - Jun 19 |
|---|---|---|---|---|---|---|
| 22-29 | 1.00% | 0.82% | 0.82% | 0.77% | 0.94% | 1.00% |
| 30-39 | 0.78% | 0.60% | 0.65% | 0.66% | 0.76% | 0.81% |
| 40-49 | 0.62% | 0.49% | 0.55% | 0.60% | 0.62% | 0.63% |
| 50-59 | 0.57% | 0.49% | 0.59% | 0.63% | 0.61% | 0.62% |
| 60-SPA | 0.89% | 0.69% | 0.85% | 0.80% | 0.72% | 0.88% |
Notes:
See sections 4.3.3 and 7.1.7 for the methodology and caveats behind these figures. Each figure represents the average proportion of the employments who made an active stopping saving decision in every financial year.
Table 6.5 – Proportion of those enrolled each period making an active stopping saving decision, by earnings level
| Earnings | 2014-15 | 2015-16 | 2016-17 | 2017-18 | 2018-19 | Apr 19 - Jun 19 |
|---|---|---|---|---|---|---|
| £10,000 - £19,999 | 0.77% | 0.62% | 0.74% | 0.68% | 0.73% | 0.86% |
| £20,000 - £29,999 | 0.71% | 0.53% | 0.60% | 0.70% | 0.68% | 0.77% |
| £30,000 - £39,999 | 0.66% | 0.51% | 0.55% | 0.59% | 0.63% | 0.64% |
| £40,000 - £49,999 | 0.66% | 0.56% | 0.56% | 0.60% | 0.69% | 0.61% |
| £50,000 - £59,999 | 0.73% | 0.66% | 0.64% | 0.64% | 0.82% | 0.60% |
| £60,000+ | 0.87% | 0.89% | 0.81% | 0.83% | 1.13% | 0.76% |
Notes:
See sections 4.3.3 and 7.1.7 for the methodology and caveats behind these figures. See Annex 7.1.7 for information on how earnings are calculated.
Each figure represents the average proportion of the employments who made an active stopping saving decision in every financial year.
Table 6.5 – Proportion of those enrolled each period making an active stopping saving decision, by PAYE scheme size
| PAYE | 2014-15 | 2015-16 | 2016-17 | 2017-18 | 2018-19 | Apr 19 - Jun 19 |
|---|---|---|---|---|---|---|
| Micro 1 - 4 | 0.76% | 1.20% | 1.59% | 0.82% | 0.55% | 0.78% |
| Small 5 - 49 | 1.04% | 0.87% | 0.68% | 0.42% | 0.44% | 0.59% |
| Medium 50 - 249 | 1.01% | 0.45% | 0.34% | 0.51% | 0.59% | 0.62% |
| Large 250 - 4999 | 0.73% | 0.58% | 0.66% | 0.63% | 0.78% | 0.76% |
| Very Large 5000+ | 0.63% | 0.62% | 0.77% | 0.96% | 0.96% | 0.97% |
Notes:
See sections 4.3.3 and 7.1.7 for the methodology and caveats behind these figures. Each figure represents the average proportion of the employments who made an active stopping saving decision in every financial year.
7.2. Eligible employees with workplace pensions, in the private sector, by banded rate of employee contribution
Section 4.4.5 includes figures showing the percentage and number of eligible employees with workplace pensions, in the private sector, by banded rate of employee contribution (size of the contribution as a proportion of pensionable pay reported in ASHE). The following contain the data on which the figures in section 4.4.5 are based.
Table 7.12 – Percentage of eligible employees with workplace pensions: by banded rate of employee contribution in the private sector, 2011 to 2018, Great Britain
Figures are for Great Britain and data in percentages
| Year | 2011 | 2012 | 2013 | 2014 | 2015 | 2016 | 2017 | 2018 |
|---|---|---|---|---|---|---|---|---|
| Banded contribution rate: Participating in a pension of which contributing: |
42% | 42% | 47% | 63% | 70% | 72% | 81% | 85% |
| Zero | 17.9% | 17.9% | 12.6% | 9.2% | 7.1% | 7.7% | 5.8% | 4.9% |
| 0-<2% | 5.1% | 4.7% | 9.5% | 29.7% | 37.1% | 38.8% | 44.0% | 15.4% |
| 2-<3% | 10.0% | 10.2% | 10.4% | 9.0% | 8.8% | 8.7% | 8.2% | 33.3% |
| 3-<4% | 12.4% | 11.8% | 11.7% | 10.1% | 9.1% | 9.3% | 8.9% | 14.5% |
| 4-<5% | 12.2% | 12.2% | 11.8% | 9.6% | 8.8% | 8.7% | 8.1% | 7.8% |
| 5-<6% | 12.8% | 12.7% | 13.0% | 9.8% | 9.2% | 8.2% | 8.2% | 7.6% |
| 6-<7% | 16.0% | 11.1% | 10.1% | 7.2% | 6.4% | 5.3% | 4.6% | 4.3% |
| 7 and over | 13.6% | 19.5% | 20.8% | 15.4% | 13.4% | 13.4% | 12.3% | 12.1% |
Source: DWP estimates derived from the ONS ASHE, GB, 2011–2018.
Note:
1. Percentages may not sum to 100 per cent due to rounding. 2. Estimates refer to April of each year 3. An employee contribution may be zero if the employer is choosing to cover the full contribution required under automatic enrolment.
Table 7.13 – Number of eligible employees with workplace pensions: by banded rate of employee contribution in the private sector, 2011 to 2018, Great Britain
Figures are for Great Britain and number of employees in thousands
| Year | 2011 | 2012 | 2013 | 2014 | 2015 | 2016 | 2017 | 2018 |
|---|---|---|---|---|---|---|---|---|
| Banded contribution rate: Participating in a pension of which contributing: |
42% | 42% | 47% | 63% | 70% | 72% | 81% | 85% |
| Zero | 980 | 998 | 786 | 798 | 712 | 803 | 695 | 635 |
| 0-<2% | 277 | 265 | 590 | 2565 | 3719 | 4029 | 5303 | 1993 |
| 2-<3% | 548 | 572 | 652 | 780 | 884 | 909 | 984 | 4302 |
| 3-<4% | 678 | 657 | 730 | 876 | 917 | 963 | 1067 | 1876 |
| 4-<5% | 670 | 682 | 736 | 830 | 882 | 901 | 972 | 1002 |
| 5-<6% | 699 | 710 | 814 | 844 | 927 | 850 | 983 | 981 |
| 6-<7% | 878 | 618 | 633 | 621 | 645 | 549 | 557 | 556 |
| 7 and over | 744 | 1089 | 1300 | 1332 | 1349 | 1389 | 1488 | 1559 |
Source: DWP estimates derived from the ONS ASHE, GB, 2011–2018.
7.3. Eligible employees with workplace pensions, in the private sector, by banded rate of reported employer contribution
Section 4.6.1 includes figures showing the percentage and number of eligible employees with workplace pensions, in the private sector, by banded rate of employer contribution (size of the contribution as a proportion of pensionable pay reported in ASHE). The following contain the data on which the figures in section 4.6.1 are based.
Table 7.14 – Percentage of eligible employees with workplace pensions: by banded rate of employer contribution in the private sector, 2011 to 2018, Great Britain
Figures are for Great Britain and data in percentages
| Year | 2011 | 2012 | 2013 | 2014 | 2015 | 2016 | 2017 | 2018 |
|---|---|---|---|---|---|---|---|---|
| Banded contribution rate: Participating in a pension of which contributing: |
42% | 42% | 47% | 63% | 70% | 72% | 81% | 85% |
| Zero | 3.8% | 3.5% | 3.3% | 2.3% | 1.8% | 1.6% | 1.2% | 1.2% |
| 0-<2% | 2.7% | 2.6% | 6.7% | 26.4% | 33.3% | 34.9% | 40.4% | 25.9% |
| 2-<4% | 10.9% | 11.2% | 11.8% | 12.0% | 12.3% | 12.9% | 12.7% | 28.0% |
| 4-<6% | 16.0% | 15.5% | 15.6% | 13.0% | 12.0% | 12.5% | 11.7% | 12.5% |
| 6-<8% | 11.6% | 11.6% | 12.0% | 9.4% | 8.4% | 8.5% | 7.9% | 7.8% |
| 8-<10% | 9.4% | 10.5% | 9.5% | 7.2% | 6.3% | 6.0% | 5.6% | 5.3% |
| 10-<15% | 23.1% | 23.9% | 21.4% | 15.9% | 14.5% | 10.6% | 9.0% | 9.0% |
| 15 and over | 22.5% | 21.2% | 19.6% | 13.9% | 11.4% | 13.2% | 11.5% | 10.3% |
Source: DWP estimates derived from the ONS ASHE, GB, 2011–2018.
Note:
1. Percentages may not sum to 100 per cent due to rounding. 2. Figures refer to April of each year.
Table 7.15 – Number of eligible employees with workplace pensions: by banded rate of employer contribution in the private sector, 2011 to 2018, Great Britain
Figures are for Great Britain and number of employees in thousands
| Year | 2011 | 2012 | 2013 | 2014 | 2015 | 2016 | 2017 | 2018 |
|---|---|---|---|---|---|---|---|---|
| Banded contribution rate: Participating in a pension of which contributing: |
42% | 42% | 47% | 63% | 70% | 72% | 81% | 85% |
| Zero | 206 | 196 | 205 | 198 | 182 | 164 | 140 | 156 |
| 0-<2% | 148 | 147 | 418 | 2281 | 3338 | 3626 | 4868 | 3338 |
| 2-<4% | 598 | 627 | 739 | 1033 | 1233 | 1338 | 1532 | 3616 |
| 4-<6% | 877 | 869 | 975 | 1120 | 1202 | 1299 | 1409 | 1611 |
| 6-<8% | 635 | 646 | 749 | 817 | 848 | 880 | 951 | 1009 |
| 8-<10% | 514 | 585 | 590 | 618 | 635 | 619 | 676 | 687 |
| 10-<15% | 1265 | 1338 | 1336 | 1371 | 1459 | 1099 | 1088 | 1160 |
| 15 and over | 1228 | 1183 | 1226 | 1205 | 1141 | 1367 | 1388 | 1323 |
Source: DWP estimates derived from the ONS ASHE, GB, 2011–2018.
7.4. Voluntary statement of compliance with the Code of Practice for Statistics
The following statement outlines how we have complied with the Code of Practice for Statistics on a voluntary basis, for the analysis of HMRC Real Time Information (RTI), Annual Survey of Hours and Earnings (ASHE), Wealth and Assets survey (WAS) and British Social Attitudes (BSA) survey data published within the report.
The Code of Practice for Statistics (the Code)[footnote 143] is built around three main concepts, or pillars: Trustworthiness, Quality and Value.
- trustworthiness – is about having confidence in the people and organisations that publish statistics.
- quality – is about using data and methods that produce assured statistics.
- value – is about publishing statistics that support society’s needs for information
The following explains how we have applied the pillars of the Code in a proportionate way.
7.4.1. Trustworthiness
- the findings presented have been scrutinised by DWP analysts. These analysts have also provided challenge to ensure the figures are an accurate representation of the data available and are impartial. Where figures are based on HMRC administrative information, these have also been reviewed by HMRC analysts
- detailed methodology has been published alongside the findings and additional detailed breakdowns are available in annexes
7.4.2. Quality
- t he administrative data presented are derived from HMRC’s RTI. This is the reporting system for income taxed via Pay As You Earn (PAYE). Data from HMRC central systems were also included in the analysis
- other data presented are derived from surveys conducted by the ONS (Office for National Statistics) and the National Centre for Social Research (NatCen)
- to ensure accuracy, estimates have been compared to findings from other sources, where possible, including those published by DWP and from publicly available data.
- the process to produce the findings and the figures provided is led by professional analysts taking account of the latest data and applying methods using their professional judgement. The findings and figures have been quality assured by analysts within DWP, HMRC and the ONS
- for the analysis of HMRC RTI data, DWP and HMRC have jointly developed a robust and auditable quality assurance process as part of producing the publication
7.4.3. Value
- the HMRC RTI data provide an overview of pension saving behaviour, in particular around employees that stop pension saving. It is used to monitor whether there has been a change over time in the number of employees that stop pension saving
- these figures are complementary to other sources as they are able to provide insights on each tax month and different characteristics, which would be difficult to do with other sources
- the survey data presented provide new evidence in a number of key areas including: levels of employee and employer pension contributions; characteristics and savings behaviours of the self-employed; and public attitudes to workplace pensions
- these data sources provide important new evidence for ministers, policy makers and external stakeholders on how the automatic enrolment policy is working and to build an evidence base on the self-employed to inform future policy development
7.5. Evaluation Questions
EQ1: Do established delivery mechanisms support automatic enrolment objectives?
EQ1.1. Does NEST accept all employers who choose the scheme, while offering low costs to members and remaining financially viable?
EQ1.2. How has The Pensions Regulator helped to maximise employer compliance with their automatic enrolment duties?
EQ1.3. How do automatic enrolment communications support the objectives of automatic enrolment?
EQ2: Do employers know about, understand and comply with their employer duties?
EQ2.1. To what extent are employers aware of their duties and know how to discharge them?
EQ2.2. How many employees are treated in a ‘compliant way’ by their employer?
EQ2.3. To what extent do employers have arrangements with a qualifying scheme?
EQ2.4. To what extent is employer behaviour influenced by their attitudes, awareness and levels of understanding of the reforms?
EQ2.5. To what extent are employers aware of the enforcement powers available to deal with non-compliance and the approach The Pensions Regulator takes?
EQ2.6. To what extent do detection and enforcement activities result in non-compliant employers becoming compliant and do they support a broader culture of compliance?
EQ2.7. To what extent do employers go beyond their minimum duties, for example by paying above minimum contribution rates? Which employers do this, and why?
EQ3: Has automatic enrolment increased the number of individuals saving in workplace pensions, and if so, how?
EQ3.1. To what extent are individuals saving persistently in a workplace pension?
EQ3.2. How many individuals that were automatically enrolled or re-enrolled have opted out of a qualifying scheme?
EQ3.3. How many individuals that were automatically enrolled or re-enrolled have ceased saving in a qualifying scheme?
EQ3.4. Why do individuals opt out or cease saving in a qualifying scheme, and how does this relate to their characteristics and circumstances?
EQ3.5. How many individuals who are not eligible for automatic enrolment have been automatically enrolled, and why?
EQ3.6. To what extent do individuals accept the need, and/or recognise the benefits of, saving into a workplace pension?
EQ3.7. To what extent do individuals perceive workplace pension saving as normal, both for employees in general and for employees like themselves?
EQ3.8. To what extent can individuals access information on automatic enrolment and workplace pension saving?
EQ3.9. To what extent can individuals understand information they are given on automatic enrolment and workplace pension saving?
EQ3.10. Which individuals are contributing more than the minimum employee contributions, and why?
EQ4: Has automatic enrolment increased the amount being saved in workplace pensions, and if so, how?
EQ4.1. How has automatic enrolment changed how much employers contribute to workplace pensions?
EQ4.2. How has automatic enrolment changed how much employees contribute to workplace pensions?
EQ4.3. Do contributions to pension saving impact on other forms of household saving or spending, and if so, how?
EQ5: To what extent is delivery of automatic enrolment achieved with a minimal burden on employers?
EQ5.1. What are the contribution costs for employers of complying with their duty?
EQ5.2. What are the administrative costs for employers of complying with their duty?
EQ5.3. How do employers respond to the costs incurred as a result of the employer duty?
EQ5.4. How do employers make decisions around which qualifying scheme to enrol members into, and how much to contribute?
EQ5.5. What are the views and attitudes of employers to the level of burden resulting from the reforms?
EQ6: How has the pensions industry reacted to automatic enrolment?
EQ6.1. What is the industry doing to protect the interests of employers, and employees and their savings?
EQ6.2. What challenges have providers faced in providing pensions for automatically enrolled employees?
EQ6.3. To what extent do providers follow The Pensions Regulator’s guidance on the reforms?
EQ6.4. Do intermediaries have the knowledge to be able to support the delivery of automatic enrolment to new employers?
EQ7: What are the wider impacts of automatic enrolment?
EQ7.1. What are the wider impacts of automatic enrolment on individuals, including any benefits and unintended consequences?
EQ7.2. What are the wider impacts of automatic enrolment on employers, including any benefits and unintended consequences?
EQ7.3. What are the wider impacts of automatic enrolment on industry, including any benefits and unintended consequences?
EQ7.4. What are the wider impacts of automatic enrolment on Government, including any benefits and unintended consequences?
-
DWP. (2017). Automatic Enrolment Evaluation Strategy 2017 ↩
-
TRP. (2019). [Automatic enrolment declaration of compliance report July 2012 – December 2019](https://www.thepensionsregulator.gov.uk/en/document-library/research-and-analysis/automatic-enrolment-declaration-of-compliance-report] ↩
-
TPR. (2019). Ongoing Duties Survey - Winter 2019 ↩
-
DWP. (2019). Automatic enrolment: qualitative research with newborn employers, Interim report ↩
-
DWP. (2017). Automatic enrolment: qualitative research with small and micro employers ↩
-
DWP. (2019). Official statistics on workplace pension participation and saving trends for eligible employees ↩
-
This is the percentage of all private sector employers, including those who did not provide a workplace pension for their staff at the time of the survey. ↩
-
DWP. (2017). Automatic Enrolment Evaluation Strategy 2017 ↩
-
Please note that all findings from the 2019 EPP survey are subject to finalisation. Full survey findings are due for publication later in 2020. ↩
-
In April 2019, minimum employer contributions increased from 2 per cent to 3, and for employees increased from 3 per cent to 5 per cent. ↩
-
TPR. (2019). Ongoing Duties Survey - Winter 2019 ↩
-
TPR. (2019). Adviser Engagement with Automatic Enrolment Survey 2019 ↩
-
TRP. (2019). Automatic enrolment declaration of compliance report July 2012 – December 2019 ↩
-
TRP. (2019). Automatic enrolment: Commentary and analysis: April 2018 – March 2019 ↩
-
TPR. (2016). Compliance and enforcement strategy for employers subject to automatic enrolment duties ↩
-
TPR. (2016). Compliance and enforcement policy for employers subject to automatic enrolment duties ↩
-
TPR. (2019). Compliance and enforcement: Quarterly bulletin July to September 2019 ↩
-
TPR. (2019). Compliance and enforcement: Quarterly bulletin April to June 2019 ↩
-
TRP. (2019). Automatic enrolment: Commentary and analysis: April 2018 – March 2019 ↩
-
TRP. (2019). Automatic enrolment: Commentary and analysis: April 2018 – March 2019 ↩
-
DWP. (2020). Workplace Pension: research into saving for retirement ↩
-
Nest Corporation. (2019) Annual Report and Accounts 2018/2019 ↩
-
Nest Corporation. (2019) Annual Report and Accounts 2018/2019 ↩
-
DWP. (2019). Automatic enrolment: qualitative research with newborn employers, Interim report ↩
-
TPR. (2019). Ongoing Duties Survey – Winter 2019 ↩
-
Interviews for TPR’s Ongoing Duties Survey – Winter 2019 were completed between January and February 2019. ↩
-
TPR. (2018). Ongoing Duties Survey – Summer 2018 ↩
-
DWP. (2018). Employers’ Pension Provision Survey 2017 ↩
-
DWP. (2018). Employers’ Pension Provision Survey 2017 ↩
-
DWP. (2018). Automatic Enrolment: Quantitative Research with Small and Micro Employers ↩
-
DWP. (2019). Automatic enrolment: qualitative research with newborn employers, Interim report ↩
-
DWP. (2017). Automatic enrolment: qualitative research with small and micro employers ↩
-
DWP. (2013). Automatic enrolment: Qualitative research with large employers ↩
-
DWP. (2015). Automatic enrolment: qualitative research with employers staging in 2014 ↩
-
DWP. (2018). Automatic Enrolment: Quantitative Research with Small and Micro Employers ↩
-
TPR. (2019). Ongoing Duties Survey – Winter 2019 ↩
-
DWP. (2018). Employers’ Pension Provision Survey 2017 ↩
-
DWP. (2018). Automatic Enrolment: Quantitative Research with Small and Micro Employers ↩
-
DWP. (2013). Automatic enrolment: Qualitative research with large employers ↩
-
DWP. (2015). Automatic enrolment: qualitative research with employers staging in 2014 ↩
-
DWP. (2017). Automatic enrolment: qualitative research with small and micro employers ↩
-
DWP. (2019). Automatic enrolment: qualitative research with newborn employers, Interim report ↩
-
This is the percentage of all private sector employers, including those who did not provide a workplace pension for their staff at the time of the survey. ↩
-
DWP. (2013). Automatic enrolment: Qualitative research with large employers ↩
-
DWP. (2015). Automatic enrolment: qualitative research with employers staging in 2014 ↩
-
DWP. (2017). Automatic enrolment: qualitative research with small and micro employers ↩
-
DWP. (2019). Automatic enrolment: qualitative research with newborn employers, Interim report ↩
-
TPR. (2019). Ongoing Duties Survey – Winter 2019 ↩
-
Throughout this report eligible employees are defined as employees who meet the automatic enrolment age (currently 22 to SPA) and earnings criteria (currently over £10,000 p.a.), and includes employees already a member of a workplace pension scheme. ↩
-
ASHE collects information from employers on employee jobs, although they are referred to as ‘employees.’ ↩
-
For additional breakdowns consult DWP. (2019). Official statistics on workplace pension participation and saving trends for eligible employees ↩
-
See FRS data for 2017/18 was collected between April 2017 and March 2018 and published 28 March 2019](https://www.gov.uk/government/statistics/family-resources-survey-financial-year-201718) ↩
-
See Statistical bulletin: 2018 Annual Survey of Hours and Earnings: Summary of Pensions Results published on 25 October 2018 ↩
-
By April 2017 540,919 employers had declared compliance, and 7,787,000 eligible employees had been automatically enrolled. By November 2018 a further 877,761 employers had declared compliance and an additional 2,171,000 eligible employees had been enrolled. ↩
-
This difference is driven by the higher share of women in the public sector where participation rates are higher than in the private sector, as demonstrated in Figure 4.1. ↩
-
We do not know whether this is a true reduction in propensity to save amongst the self-employed or compositional effects, given the growth in self-employed population over the same time period. Chapter 5.2 presents evidence on the drivers of the recent decline in pension saving among the self-employed. ↩
-
Government has published a delivery plan setting out how it will trial a number of savings interventions aimed at the self-employed. An update of DWP’s wider work around the self-employed and pension participation is provided in Chapter 5.2. ↩
-
To see a breakdown of persistency of saving by sector, consult DWP. (2019). Official statistics on workplace pension participation and saving trends for eligible employees. At: https://www.gov.uk/government/statistics/workplace-pension-participation-and-saving-trends-2008-to-2018 ↩
-
ONS. (2019). Occupational Pension Schemes Survey, UK: 2018 ↩
-
However, the OPSS does not include state pensions or personal pensions, the latter being based on individuals entering into a contract with a pension provider. OPSS does not cover group personal pension (GPP) arrangements, such as stakeholder and group self-invested personal pensions (GSIPP), where the contract is facilitated by the employer(s). Based on TPR’s 2019 ‘Automatic enrolment: commentary and analysis’ report, 10 per cent of pension schemes with less than 30 members used for automatic enrolment are contract-based (personal pensions); for pension schemes with 30 or more members, this proportion is 34 per cent. ↩
-
Growth in the number of eligible jobholders automatically enrolled into an automatic enrolment pension scheme has slowed in 2018 and 2019: https://www.thepensionsregulator.gov.uk/en/document-library/research-and-analysis/automatic-enrolment-declaration-of-compliance-report ↩
-
DWP. (2018). Employers’ Pension Provision Survey 2017 ↩
-
Direct comparisons with earlier surveys in the EPP series are not possible due to changes in question wording. ↩
-
DWP. (2018). Employers’ Pension Provision Survey 2017 ↩
-
HMRC. (2019). UK Real Time Information, Experimental Statistics ↩
-
A salary sacrifice arrangement is an agreement to reduce an employee’s entitlement to cash pay, usually in return for a non-cash benefit – in this case, employer pension contributions. ↩
-
There is currently no evidence to suggest that savings behaviour differs for employees saving via salary sacrifice arrangements. ↩
-
An employment is defined as eligible at the point of a particular payment if they are aged between 22 and State Pension age and their earnings rate is equivalent to £10,000 or higher annually. Annex 7.1 has more detail on how earnings variables are calculated. ↩
-
The RTI analysis presented is based on tax months and tax years. Tax months run from the 6th of a given calendar month to the 5th of the following calendar month. The tax year runs from the 6th of April to the 5th of April. ↩
-
An employee is defined as stopping saving in the month of their final pension contribution. ↩
-
Details on the categories definition can be found in Annex 7.1 ↩
-
An employee is inferred to have made an active decision to stop saving when their employment is still active and eligible, but they stop contributing to a workplace pension. ↩
-
In the April 2019 data, some anomalous cases were excluded from the analysis. Further details can be found in Annex 7.1 ↩
-
DWP. (2019). Official statistics on workplace pension participation and saving trends for eligible employees ↩
-
TPR advise employers to use the third anniversary of their staging date as their re-enrolment date but employers can choose any date within a six-month timeframe if they wish. ↩
-
DWP. (2018). Employers’ Pension Provision Survey 2017 ↩
-
Workers earning above the Lower Earnings Limit (LEL) are entitled to a mandatory employer contribution should they choose to opt-in. ↩
-
DWP. (2018). Employers’ Pension Provision Survey 2017 ↩
-
Estimates from BSA may differ to those from the DWP communications tracker due to differences in the timing and sample design of the surveys. Fieldwork for the 2018 BSA survey was carried out between July and November 2018 and the base for estimates reported here included all employees (1,167 respondents). The DWP communications tracker survey took place in April 2019 and the base for reported estimates included all employees aged over 22 earning over £9,500 (635 respondents). ↩
-
DWP. (2020). Workplace Pension: research into saving for retirement ↩
-
See NatCen Social Research. (2017). British Social Attitudes Survey, 2016. [data collection]. UK Data Service. SN: 8252 ↩
-
DWP. (2020). Workplace Pension: research into saving for retirement ↩
-
DWP. (2020). Workplace Pension: research into saving for retirement ↩
-
This is a general finding across BSA questions on self-reported knowledge – in responses to the survey, men tend to be more likely to say they know something than women. ↩
-
Data tables for Figures 4.20 and 4.21 are presented in annex 7.2. ↩
-
Earnings between the lower earnings limit and the upper earnings limit. ↩
-
There are no eligible employees earning under £10,000 once the automatic enrolment earnings trigger is raised to £10,000. ↩
-
Data tables for Figures 4.22 and 4.23 are presented in annex 7.3. ↩
-
Earnings between the lower earnings limit and the upper earnings limit. ↩
-
In the 2017-2018 period Year 1 refers to 2017 and Year 2 to 2018. ↩
-
TPR (2019). Master Trust market post authorisation: final facts and figures ↩
-
See Code 13 governance and administration of occupational trust based schemes providing money purchase ↩
-
TPR. (2019). Defined Contribution trust-based pension schemes research ↩
-
The other KGRs are KGR 2 (value for members assessment) and KGR 3 (core scheme financial transactions). ↩
-
Micro schemes are defined as schemes with 2-11 members, small schemes with 12-99 members, medium schemes with 100-999 members, and large schemes with 1,000+ members. These are groupings of single-employer schemes only. Schemes with multiple-employers are defined as master trusts in the TPR Defined Contribution trust-based pension schemes research report regardless of membership size. ↩
-
TPR. (2019). Adviser Engagement with Automatic Enrolment Survey 2019 ↩
-
Instant pensions duties means that when an employer takes on their first employee, the duties start date is the first day of employment of that employee. ↩
-
See Automatic Enrolment Review 2017:Maintaining the Momentum (DWP, 2017) ↩
-
See Enabling retirement savings for the self-employed (DWP, 2018) ↩
-
At the same time as the trialling activity and further analysis and research, discussions with third-party software providers are also taking place around engaging self-employed saving through routes based on or utilising the tax system, in line with the Making Tax Digital (MTD) initiative. ↩
-
From ONS analysis of Labour Force Survey (LFS) data whereby the ‘self-employed’ are those people who self-report as self-employed, that is, who in their main employment work on their own account, whether or not they have employees. More generally, there is no single agreed definition of self-employment, with the three main approaches using definitions of employment law, tax law and self-definition. ↩
-
See Employment in the UK (ONS, 2019) ↩
-
There are various definitions of ‘gig worker’ but one more commonly used in surveys is people who trade their time and skills through the Internet and online platforms, providing a service to a third party as a form of paid employment ↩
-
See Workplace pension participation and savings trends of eligible employees (DWP, 2019) See also, Pension participation at a record high (ONS, 2018) ↩
-
Although estimated pension participation rates tend to differ from survey to survey – the rates quoted here are derived from the Family Resources Survey (FRS) - the rate of decline in participation rates of the self-employed is similar in all. According to the Wealth and Assets Survey (WAS), the rate declined from an estimated 48 percent in 2006-08 (wave 1) to 28 per cent in 2014-16 (wave 5). The quantitative survey of self-employed people undertaken as part of the programme of pre-trials research commissioned by Nest Insight found that only 24 per cent were currently saving into a pension. ↩
-
Analysis was of people who gave responses at all five waves of WAS and who were defined as self-employed and ‘currently working’ in at least one. ↩
-
WAS data suggest the number of people aged 50 plus in self-employment increased by around a third between waves 1 and 5, with this group now comprising 45 per cent of all self-employed. ↩
-
See Figure 3.1 of Enabling retirement savings for the self-employed (DWP, 2018) ↩
-
ONS data suggest that pensions and retirement income constitutes around a third of the total income of self-employed men working part-time (see Figure 10 of Trends in self-employment in the UK (ONS, 2018)) ↩
-
Of interest here is the recent FCA review of the market for non-workplace pensions. The FCA highlighted a number of issues including weak consumer engagement and complexity of products. They acknowledge the potential growth in numbers of self-employed people wishing to access this market, so as it stands, there may well be considerable structural and behavioural barriers to ongoing and future pension participation on the part of self-employed people. Effective competition in non-workplace pensions (FCA, 2019) ↩
-
See Supporting self-employed people to save for retirement (Nest Insight, 2019). ↩
-
The self-employed population was defined as those who reported themselves to be actively ‘self-employed’ (i.e. self-employed and not economically inactive or unemployed) in WAS 2014 - 2016. The pension saving variable included people in self-employment who self-report as contributing into a personal pension scheme, DB scheme or DC scheme at the time they were interviewed. ↩
-
A technique that estimates the relative strength of association between a binary variable (such as whether someone contributes to a pension or not) and a set of independent variables, such as age, gender and income. ↩
-
This shows the change in percentage points in the probability of pensions saving following a discrete change or unit increase in the variables. ↩
-
For discrete variables, the reference category is ‘yes’ in all cases except ‘gender’ where it is ‘male’. Thus being male is associated with higher pensions participation, while being a migrant is associated with lower levels. ↩
-
It was not clear whether migrants were planning to retire in the UK or whether working in the UK is a temporary measure. ↩
-
According to ONS data, numbers of women in self-employment increased by around 50 per cent over the period covered by the WAS analysis, compared with an equivalent increase of only 15 per cent for men. Trends in self-employment in the UK (ONS, 2018). Over four in five self-employed men were full-time in 2019 Employment in the UK (ONS, 2019). ↩
-
Based on analysis of DWP data. See Figures 3.5 and A2 of Enabling retirement savings for the self-employed (DWP, 2018) ↩
-
The Government’s Good Work Plan, published in December 2018, set out the vision for the future of the labour market and its plans for implementing the recommendations arising from the Taylor Review of Modern Working Practices. The Government has committed to legislate to improve clarity of employment status, reflecting the reality of modern working practices and DWP is working with BEIS to ensure any changes are also considered in relation to who is eligible for automatic enrolment. ↩
-
See A tough gig? The nature of self-employment in 21st century Britain (Resolution Foundation, 2017) ↩
-
See The drivers of saving behaviour for retirement aming the self-employed (HMRC, 2018) ↩
-
See Supporting self-employed people to save for retirement (Nest Insight, 2019) ↩
-
PPI analysis of WAS wave 4 (2012-14) found 86,000 self-employed people with second jobs as employees and 350,000 employees with second jobs as self-employed, equivalent in total to around 10 per cent of the self-employed population. See chart 1.5 of Policies for increasing long-term saving of the self-employed (PPI, 2017). ↩
-
Evidence of this is scant at this stage. The concept of a ‘workplace pension’ may well have little resonance for self-employed people. Moreover, the fall in the overall pension participation rate over the same period as the implementation of automatic enrolment has been taking place seems to contradict this assertion. Nevertheless, the Nest Insight research found that three-quarters of the sample (74 per cent) thought it was important to put money aside for retirement, so there is an acknowledgement of the more general concept of ‘long-term saving’. ↩
-
See Supporting self-employed people to save for retirement (Nest Insight, 2019) ↩
-
See Figure 3.6 of Enabling retirement savings for the self-employed (DWP, 2018) ↩
-
See Supporting self-employed people to save for retirement (Nest Insight, 2019) ↩
-
Analysis of data from the Lloyds survey reveals that, within the ‘precarious’ sectors, in Construction 45 per cent of self-employed people were aged 50 plus, 45 per cent in Sales were aged 50 plus, while 27 per cent were aged 50 plus in Caring and Leisure (including Hairdressing). ↩
-
See Supporting self-employed people to save for retirement (Nest Insight, 2019) ↩
-
‘Open’ and CTRs were monitored during the period up to one week after receipt of the email message. ↩
-
Those who opened both the initial and the reminder emails are counted just once. ↩
-
From previous email campaigns sent to its broader population, NEST would expect an open rate ranging from 44% to 52% and a 10% to 17% click through rate. ↩
-
It is difficult to say whether this was a pure ‘reminder’ effect (whereby people see but ignore the initial email but then open the reminder), as sending the emails a month apart meant they may have been treated as separate emails, rather than a reminder email ↩
-
See further information on the plans for technology-based trials ↩
-
Please see PAYE for employers for further details. ↩
-
Please see Find out which employers are exempt from online payroll reporting for further details. ↩
-
DWP. (2019). Official statistics on workplace pension participation and saving trends for eligible employees ↩
-
See UK Statistics Authority. (2019). Code of Practice for Statistics. ↩