Summer 2021 student-level equalities analysis - GCSE and A level
Updated 20 August 2021
Applies to England

© Crown copyright 2021
This publication is licensed under the terms of the Open Government Licence v3.0 except where otherwise stated. To view this licence, visit nationalarchives.gov.uk/doc/open-government-licence/version/3 or write to the Information Policy Team, The National Archives, Kew, London TW9 4DU, or email: psi@nationalarchives.gov.uk.
Where we have identified any third party copyright information you will need to obtain permission from the copyright holders concerned.
This publication is available at https://www.gov.uk/government/publications/analysis-of-results-a-levels-and-gcses-summer-2021/summer-2021-student-level-equalities-analysis-gcse-and-a-level
Author
- Ming Wei Lee
Executive Summary
For 2 years running, the summer exam series did not take place because of the disruption to students’ education caused by the COVID-19 (coronavirus) pandemic. In 2020, students were awarded grades largely based on centre assessment grades, which represent the level of learning achieved by a student up to March 2020, projected forward as a prediction of the grade that they would have achieved had the summer exams gone ahead. In 2021, the grades awarded are teacher assessed grades (TAGs), which represent the learning achieved by a student from the content taught to them in the period running up to summer 2021.
This paper presents an analysis of how differences in results between groups in summer 2021 compare to those in results of summer 2018 to 2020. The grouping variables included in our analysis were gender, ethnicity, major language, special educational needs and disabilities (SEND), free school meal (FSM) eligibility, deprivation, prior attainment, centre type and region. We analysed 3 results measures: mean numeric grade, probability of grade A or 7 and above, and probability of grade C or 4 and above.
We used multilevel regression modelling to estimate ‘conditional results gaps’, that is, results gaps for subgroups of students defined by various variables, relative to their respective comparator group (which is the largest group under the respective variable), after controlling for other variables, including prior attainment.
Conditional results gaps in 2018 and 2019 tell us that differences in exam results existed in pre-pandemic times and that conditional results gaps can vary from year to year even in normal times. By comparing changes in conditional results gaps between 2021 and 2019 and those between 2021 and 2020 against changes in conditional results gaps between 2019 and 2018, we identified the ‘notable’ changes between 2020 and 2021 and those between 2019 and 2021. (In this paper, the use of the word ‘notable’ is specific to our method of evaluating between-year changes in group differences. It does not convey any judgement of the importance or not of the change in question.)
We found that, of the many between-group comparisons examined in our modelling, the majority showed no notable change from 2020 to 2021 or from 2019 to 2021.
For A level, the analyses show increases in outcomes for many groups and general stability in the differences in outcomes for students with different protected characteristics compared to 2020 and 2019. There are some small changes in overall outcomes. Between 2020 and 2021, the only notable change found on all 3 results measures is the decrease in outcomes (a small change of 0.11 grade on mean numeric grade) for candidates in tertiary colleges relative to prior-attainment-matched candidates of the comparator group, namely, academies.
Some groups showed notable changes from 2019 to 2021 on all 3 results measures. Male candidates, candidates with SEND, candidates in secondary selective schools, sixth form and tertiary colleges, have seen, from 2019 to 2021, a small decrease in outcomes (small changes not exceeding 0.2 grade) relative to prior-attainment-matched candidates of their respective comparator group, namely, female candidates, candidates without SEND, candidates in academies respectively.
Candidates in ‘other’ centre types (a category which incorporates institutions such as tutorial colleges, language schools, special schools, pupil referral units and training centres), have seen, from 2019 to 2021, an increase in outcomes (a change of 0.33 grade) relative to prior-attainment-matched candidates of the comparator group, namely, academies.
Candidates in independent schools have seen, from 2019 to 2021, an increase in outcomes on the mean numeric grade (a small change of 0.11 grade) and probability-of-grade-A-and-above measures, but a decrease on the grade-C-and-above measure, relative to prior-attainment-matched candidates of the comparator group, namely, academies.
For GCSE, the analyses show increases in outcomes for many groups and general stability in the differences in outcomes for students with different protected characteristics compared to 2020 and 2019. There are some small changes in overall outcomes. Between 2020 and 2021, the only notable change found on all 3 results measures is the increase in outcomes (a small change of 0.2 grade on mean numeric grade) for candidates in tertiary colleges relative to prior-attainment-matched candidates of the comparator group, namely, academies.
Some groups showed notable changes from 2019 to 2021 on all 3 measures. Candidates eligible for FSMs, Gypsy and Roma candidates, and candidates in secondary selective schools, have seen, from 2019 to 2021, a decrease in outcomes (small changes not exceeding 0.18 grade) relative to prior-attainment-matched candidates of their respective comparator group, namely, candidates not eligible for FSMs, White British candidates, and candidates in academies respectively.
Candidates with unknown ethnicity, candidates with unknown FSM status, and candidates in tertiary colleges, have seen, from 2019 to 2021, an increase in outcomes (changes not exceeding 0.5 grade) relative to prior-attainment-matched candidates of their respective comparator group, namely, White British candidates, candidates not eligible for FSMs, and candidates in academies respectively. Candidates in independent schools have seen, from 2019 to 2021, an increase in outcomes on the numeric grade (a change of 0.22 grade) and grade-7-and-above measures, but a decrease on the grade-4-and-above measure, relative to prior-attainment-matched candidates of the comparator group, namely, academies.
Candidates in ‘other’ centre types have seen, from 2019 to 2021, an increase in outcomes on the numeric grade (a change of 0.22 grade) and grade-4-and-above measures, but a decrease on the grade-7-and-above measure, relative to prior-attainment-matched candidates of the comparator group, namely, academies.
Amidst no change on most gaps, the few changes noted – both widening and narrowing of gaps – could be understood as the impact of the pandemic on students’ education and the impact of the change in assessment arrangements. The 2 sources of impact are impossible to disentangle.
Introduction
In response to the coronavirus (COVID-19) pandemic, the summer 2020 exam series was cancelled. The grades eventually awarded to GCSE, AS, and A level candidates were based on centre assessment grades (CAGs) – either the original centre estimate or a statistically moderated grade, whichever was higher. The grades of summer 2020 represent the level of learning achieved by a student in the period running up to March 2020, projected forward as a prediction of the grade that they would have achieved had the summer exams gone ahead.
In January 2021, the government announced that the summer 2021 exam series would not go ahead as planned as it considered it no longer fair for exams to go ahead due to the COVID-19 pandemic. The grades to be awarded in summer 2021 would be based on teacher assessment on the content students had been taught, which, because of the disruption to teaching and learning caused by the pandemic, may be less than the entire syllabus. Centres were given flexibility to decide how to assess their students’ performance. The teacher assessed grades (TAGs) of summer 2021 represent the learning achieved by a student during their course which ran up to summer 2021.
Ofqual analysed how results gaps in relation to protected characteristics and socioeconomic status in summer 2020 compared to results gaps that were present in exam results of previous years. This report contains a similar analysis of the summer 2021 results. Because the grades of summer 2020 represent learning achieved before the pandemic, the 2020 analysis can be interpreted as an assessment of the equality impact of the exceptional CAG-based awarding process of summer 2020.
In 2021, not only is the TAG-based awarding process exceptional compared to the exam-based process in pre-pandemic years, the student learning that TAGs represent is also exceptional in that it has been achieved amidst the disruption to teaching and learning caused by the pandemic. Unlike in 2020 when the COVID-19 related disruption came at the same time for the whole cohort, towards the end of the course of study, in 2021 students experienced varying levels of disruption. To take account of this disruption to learning, the TAG arrangements only assessed students on what they had been taught. This ‘content coverage concession’ was intended to address differential impacts between schools (where the primary concern was differential coverage of qualification content). It was not intended to tackle differential engagement with education, such as different home learning environments and different abilities to adapt to home or independent learning, and therefore the assessment arrangements this year did not fully address the impact of differential learning loss.
It follows that it is more difficult this year to determine whether any changes in results for particular groups of students, have arisen as a result of the impact of the pandemic on students’ education or the impact of the change in assessment arrangements. Given that it is impossible to disentangle the impact of the TAG-based awarding process and the impact of the pandemic-induced disruption to education, the 2021 analysis provides an assessment of the combined equality impact of the 2.
To assess any differential impact of the combined effect of the TAG-based process and the pandemic-related disruption to education on candidates with particular characteristics, we examined the extent to which the relationships between A level and GCSE grade outcomes and candidate background variables in 2021 differed from those in grade outcomes of pre COVID-19 years, 2018 and 2019. We also examined whether those relationships have changed between 2020 and 2021. Separate analyses were carried out for A level and GCSE.
Data
To ensure like-with-like comparisons, we built an equalities dataset for each qualification level consisting of data on: (i) subjects examined under the same specifications in 2018 to 2021 [footnote 1]; (ii) centres with entries in these subjects in each of the years 2018, 2019, 2020 and 2021; (iii) centres that had the same centre type designation in 2018 to 2021; and (iv) candidates who by 31 August of the respective year was, or would be, at the target age of the qualification level of their entries (16 for GCSE, 18 for A level).[footnote 2] These restrictions ensured that our analyses were carried out on as stable successive cohorts as possible, which was necessary for a meaningful equalities analysis as it minimised between-year changes in group differences being caused by between-year cohort changes.
Tables 1 and 2 show the number of entries by target-age candidates, centres and subjects in the resultant equalities dataset for A level and GCSE, respectively.
Table 1. Number of entries, centres and subjects in A level equalities dataset
| Year | Entries | Centres | Subjects |
|---|---|---|---|
| 2018 | 419,984 | 2,358 | 30 |
| 2019 | 437,496 | 2,358 | 30 |
| 2020 | 435,349 | 2,358 | 30 |
| 2021 | 461,433 | 2,358 | 30 |
Table 2. Number of entries, centres and subjects in GCSE equalities dataset
| Year | Entries | Centres | Subjects |
|---|---|---|---|
| 2018 | 3,529,292 | 4,439 | 29 |
| 2019 | 3,634,989 | 4,439 | 29 |
| 2020 | 3,727,896 | 4,439 | 29 |
| 2021 | 3,806,744 | 4,439 | 29 |
Awarding data
Exam boards supplied to Ofqual awarding data as well as data on the following variables used in our analysis:
- Gender: each entry was classed as belonging to a male or female candidate. A very small number of entries had neither male nor female as gender. They were grouped with entries with missing gender information in a third category of the gender variable, ‘Unknown/Neither’.[footnote 3]
- Prior attainment for A level entries: a normalised mean GCSE score, which can range from 0 to 100 was used as the prior attainment measure. Entries by candidates with unknown mean GCSE score and entries with any out-of-range scores were marked as missing prior attainment data. Entries with non-missing prior attainment data were classed as belonging to a candidate with a very high, high, medium, low or very low level of prior attainment. To classify candidates based on their prior attainment, we identified for each year all unique candidates with non-missing prior attainment data, and then set the 4 boundary marks on the normalised mean GCSE score scale that would divide the candidates into 5 groups of roughly equal size defined by very high, high, medium, low and very low prior attainment. The boundary marks used for classifying each year’s candidates were specific to that year, but they did not vary much from year to year.
- Prior attainment for GCSE entries: a normalised mean Key Stage 2 (KS2) score, which can range from 0 to 100 was used as the prior attainment measure. Entries by candidates with unknown mean KS2 score and entries with any out-of-range scores were marked as missing prior attainment data. Entries with non-missing prior attainment data were classed as belonging to a candidate with a very high, high, medium, low or very low level of prior attainment. To classify candidates based on their prior attainment, we identified for each year all unique candidates with non-missing prior attainment data, and then set the 4 boundary marks on the normalised mean KS2 score scale that would divide the candidates into 5groups of roughly equal size defined by very high, high, medium, low and very low prior attainment. The boundary marks used for classifying each year’s candidates were specific to that year, but they did not vary much from year to year.
- Centre type: exam entries were made by centres. Centres were classified into ten types: Acad (academy), Free (free school), FurE (further education establishment), Indp (independent school [including city training college]), SecComp (secondary comprehensive or middle school), SecMod (secondary modern or high school), SecSel (secondary selective school), Sixth (sixth form college), Tert (tertiary college), Other (covering college of higher education, university department, tutorial college, language school, special school, pupil referral unit, HM Young Offender Institute, HM Prison, training centre).
- Region: centres were grouped by geographical region. The nine regions are: EM (East Midlands), EA (East of England), LD (London), NE (North East), NW (North West), SE (South East), SW (South West), WM (West Midlands), Y&H (Yorkshire and the Humber).
Data on background variables
Data on the following background variables were obtained by matching the equalities datasets to extracts of the National Pupil Database (NPD) using candidates’ first name, last name, date of birth and gender as the match key and retaining only the unique matches. Entries by candidates who could not be uniquely matched or who could be uniquely matched but who had no relevant information in the NPD were marked as missing data on the relevant variable.
- Ethnicity: the EthnicGroupMajor and EthnicGroupMinor variables in the NPD provided the ethnicity groupings in our analyses. Under EthnicGroupMajor, the major ethnic groups are: AOEG (Any Other Ethnic Group), ASIA (Asian), BLAC (Black), CHIN (Chinese), MIXD (Mixed Background), WHIT (White); in this year’s analysis, UNCL (Unclassified) was grouped with missing as unknown. Under EthnicGroupMinor, the categories are ABAN (Asian Bangladeshi), AIND (Asian Indian), AOTH (Any Other Asian Background), APKN (Asian Pakistani), BAFR (Black African), BCRB (Black Caribbean), BOTH (Any Other Black Background), CHNE (Chinese), MOTH (Any Other Mixed Background), MWAS (Mixed White and Asian), MWBA (Mixed White and Black African), MWBC (Mixed White and Black Caribbean), OOTH (Any Other Ethnic Group), WBRI (White British), WIRI (White Irish), WIRT (White Traveller of Irish Heritage), WOTH (Any Other White Background), WROM (White Gypsy and Roma); for the purpose of our analysis, NOBT (Information Not Yet Obtained) and REFU (Refused) were grouped with missing as unknown. Note that the minor categories with acronyms starting with A are grouped as major category ASIA, those with acronyms starting with B are grouped as BLAC, those with acronyms starting with M are grouped as MIXD, those with acronyms starting with W are grouped as WHIT, minor categories CHNE and OOTH correspond to major categories CHIN and AOEG.
- Major language: the LanguageGroupMajor variable in the NPD provided the major language grouping used in our analyses. The major language categories are ENG (English) and OTH (other than English); in this year’s analysis, UNCL (Unclassified) was grouped with missing as unknown.
- Special educational needs and disabilities (SEND): the SENProvisionMajor variable in the NPD provided the SEND provision grouping used in our analyses. The SNS (SEND without Statement) and SS (SEND with Statement) categories were combined to form a SEND category, contrasted with NON (no SEND) category. In this year’s analysis, UNCL (Unclassified) was grouped with missing as unknown.
- Free school meal (FSM) eligibility: the FSMeligible variable in the NPD provided the FSM eligibility grouping used in our analyses. The 2categories are: YES (eligible), NO (not eligible). FSM eligibility is widely used in educational research as an indicator of family income. [footnote 4]
- Deprivation: the income deprivation grouping used in our analyses was based on the IDACIScore variable in the NPD (IDACIScore_15 for the 2018 and 2019 candidates, IDACIScore_19 for the 2020 and 2021 candidates). To classify candidates in each dataset into deprivation groups, we identified for each year all unique candidates with non-missing IDACI scores, and then set the 4 boundary scores on the IDACI score scale that would divide the candidates into 5 groups of roughly equal size defined by very high, high, medium, low and very low level of deprivation. The boundary scores used for classifying each year’s candidates were specific to that year, but they did not vary much from year to year. IDACI stands for Income Deprivation Affecting Children Index. Unlike the other variables which are individual based, IDACI is an area-based index.
Missing data
Data on prior attainment and the background variables are missing to varying degrees and not at random. Table 3a shows the missing rate for prior attainment data for the different centre types. It is clear that the missing rate varies by centre type. Alternatively, Tables 3b and 3c show the distributions, across centre types, of all entries, entries with known prior attainment data and entries with missing prior attainment data, in the GCSE and A level equalities datasets. The 3distributions should be very similar if the missing data pattern is unrelated to centre type. As can be observed in Tables 3b and 3c, academies and secondary comprehensives are under-represented while independent schools are over-represented among the entries with no prior attainment data, which again suggests that prior attainment data is not missing at random and that the prior attainment data missing rate varies by centre type. Tables 4a and 4b tell a similar story about the pattern of missing data on the ethnicity variable.
Table 3a. Breakdown, by centre type, of percentage of entries with missing prior attainment data
| Centre type | GCSE 2018 | GCSE 2019 | GCSE 2020 | GCSE 2021 | A level 2018 | A level 2019 | A level 2020 | A level 2021 |
|---|---|---|---|---|---|---|---|---|
| Acad | 11.1 | 10.7 | 9.9 | 9.4 | 2.4 | 2.2 | 2.0 | 2.1 |
| Free | 17.6 | 15.5 | 13.8 | 12.7 | 6.1 | 6.1 | 5.9 | 6.0 |
| FurE | 18.4 | 19.6 | 20.1 | 22.7 | 7.3 | 7.2 | 6.0 | 19.1 |
| Indp | 57.5 | 56.4 | 56.8 | 56.4 | 29.4 | 30.0 | 27.6 | 26.5 |
| Other | 23.3 | 21.0 | 21.6 | 21.0 | 9.1 | 13.6 | 11.9 | 18.9 |
| SecComp | 12.2 | 11.6 | 10.7 | 10.2 | 2.6 | 2.4 | 2.4 | 1.8 |
| SecMod | 10.9 | 10.9 | 10.3 | 9.6 | 1.1 | 1.6 | 1.4 | 1.2 |
| SecSel | 11.2 | 10.9 | 10.9 | 10.0 | 4.9 | 3.7 | 2.7 | 2.3 |
| Sixth | 19.2 | 15.6 | 14.5 | 11.9 | 5.0 | 5.3 | 4.9 | 8.4 |
| Tert | 23.2 | 23.9 | 25.5 | 28.0 | 4.8 | 4.8 | 4.9 | 24.7 |
| Total | 100 | 100 | 100 | 100 | 100 | 100 | 100 | 100 |
Table 3b. Distribution (in %) of all entries, entries with prior attainment (PA) data, and entries without PA data across centre types in the GCSE equalities dataset
| Centre type | 2018 All | 2018 With PA | 2018 No PA | 2019 All | 2019 With PA | 2019 No PA | 2020 All | 2020 With PA | 2020 No PA | 2021 All | 2021 With PA | 2021 No PA |
|---|---|---|---|---|---|---|---|---|---|---|---|---|
| Acad | 56.55 | 58.31 | 45.53 | 56.54 | 58.25 | 45.37 | 56.51 | 58.23 | 44.59 | 56.45 | 58.15 | 44.06 |
| Free | 1.05 | 1.01 | 1.34 | 1.13 | 1.10 | 1.31 | 1.14 | 1.12 | 1.25 | 1.15 | 1.14 | 1.22 |
| FurE | 0.11 | 0.10 | 0.14 | 0.12 | 0.11 | 0.17 | 0.13 | 0.12 | 0.21 | 0.13 | 0.12 | 0.25 |
| Indp | 4.60 | 2.27 | 19.14 | 4.67 | 2.35 | 19.79 | 4.66 | 2.30 | 21.06 | 4.62 | 2.29 | 21.69 |
| Other | 1.02 | 0.91 | 1.73 | 1.05 | 0.96 | 1.65 | 1.07 | 0.96 | 1.83 | 1.00 | 0.89 | 1.73 |
| SecComp | 32.66 | 33.28 | 28.85 | 32.56 | 33.19 | 28.42 | 32.57 | 33.27 | 27.67 | 32.67 | 33.35 | 27.72 |
| SecMod | 1.61 | 1.66 | 1.27 | 1.57 | 1.61 | 1.28 | 1.57 | 1.61 | 1.28 | 1.56 | 1.60 | 1.24 |
| SecSel | 2.30 | 2.37 | 1.86 | 2.28 | 2.34 | 1.87 | 2.25 | 2.30 | 1.95 | 2.32 | 2.37 | 1.93 |
| Sixth | 0.06 | 0.05 | 0.08 | 0.05 | 0.05 | 0.06 | 0.05 | 0.05 | 0.05 | 0.06 | 0.06 | 0.05 |
| Tert | 0.04 | 0.04 | 0.07 | 0.04 | 0.04 | 0.08 | 0.06 | 0.05 | 0.11 | 0.05 | 0.04 | 0.11 |
| Total | 100 | 100 | 100 | 100 | 100 | 100 | 100 | 100 | 100 | 100 | 100 | 100 |
Table 3c. Distribution (in %) of all entries, entries with prior attainment (PA) data, and entries without PA data across centre types in A level equalities dataset
| Centre type | 2018 All | 2018 With PA | 2018 No PA | 2019 All | 2019 With PA | 2019 No PA | 2020 All | 2020 With PA | 2020 No PA | 2021 All | 2021 With PA | 2021 No PA |
|---|---|---|---|---|---|---|---|---|---|---|---|---|
| Acad | 41.2 | 43.2 | 14.2 | 41.6 | 43.7 | 13.6 | 41.5 | 43.4 | 13.4 | 41.7 | 44.1 | 11.5 |
| Free | 0.7 | 0.7 | 0.6 | 0.8 | 0.8 | 0.7 | 0.8 | 0.8 | 0.8 | 0.8 | 0.8 | 0.7 |
| FurE | 2.1 | 2.1 | 2.2 | 2.2 | 2.2 | 2.3 | 2.3 | 2.3 | 2.3 | 2.5 | 2.2 | 6.4 |
| Indp | 13.6 | 10.3 | 57.9 | 13.2 | 9.9 | 58.4 | 13.0 | 10.0 | 57.8 | 12.7 | 10.1 | 45.0 |
| Other | 0.4 | 0.4 | 0.6 | 0.4 | 0.4 | 0.9 | 0.4 | 0.4 | 0.8 | 0.5 | 0.4 | 1.2 |
| SecComp | 16.2 | 16.9 | 6.1 | 16.3 | 17.0 | 5.7 | 16.1 | 16.7 | 6.2 | 16.3 | 17.3 | 3.9 |
| SecMod | 0.4 | 0.5 | 0.1 | 0.4 | 0.5 | 0.1 | 0.4 | 0.5 | 0.1 | 0.4 | 0.5 | 0.1 |
| SecSel | 4.7 | 4.8 | 3.3 | 4.6 | 4.7 | 2.5 | 4.6 | 4.8 | 2.0 | 4.4 | 4.7 | 1.4 |
| Sixth | 17.9 | 18.3 | 13.0 | 17.6 | 17.9 | 13.8 | 18.0 | 18.2 | 14.3 | 17.7 | 17.5 | 20.0 |
| Tert | 2.9 | 2.9 | 2.0 | 2.8 | 2.9 | 2.0 | 2.9 | 2.9 | 2.3 | 3.0 | 2.5 | 10.0 |
| Total | 100 | 100 | 100 | 100 | 100 | 100 | 100 | 100 | 100 | 100 | 100 | 100 |
Table 4a. Distribution (in %) of all entries, entries with ethnicity (ETH) data, and entries without ethnicity data across centre types in GCSE equalities dataset
| Centre type | 2018 All | 2018 With ETH | 2018 No ETH | 2019 All | 2019 With ETH | 2019 No ETH | 2020 All | 2020 With ETH | 2020 No ETH | 2021 All | 2021 With ETH | 2021 No ETH |
|---|---|---|---|---|---|---|---|---|---|---|---|---|
| Acad | 56.55 | 59.25 | 18.57 | 56.54 | 59.30 | 18.18 | 56.51 | 59.27 | 16.33 | 56.45 | 59.17 | 18.54 |
| Free | 1.05 | 1.07 | 0.85 | 1.13 | 1.14 | 0.99 | 1.14 | 1.16 | 0.91 | 1.15 | 1.16 | 1.04 |
| FurE | 0.11 | 0.02 | 1.28 | 0.12 | 0.03 | 1.34 | 0.13 | 0.02 | 1.69 | 0.13 | 0.03 | 1.55 |
| Indp | 4.60 | 0.35 | 64.29 | 4.67 | 0.36 | 64.44 | 4.66 | 0.37 | 67.09 | 4.62 | 0.38 | 63.71 |
| Other | 1.02 | 0.95 | 2.11 | 1.05 | 0.96 | 2.25 | 1.07 | 0.99 | 2.15 | 1.00 | 0.92 | 2.00 |
| SecComp | 32.66 | 34.17 | 11.48 | 32.56 | 34.08 | 11.43 | 32.57 | 34.11 | 10.19 | 32.67 | 34.20 | 11.41 |
| SecMod | 1.61 | 1.69 | 0.47 | 1.57 | 1.65 | 0.46 | 1.57 | 1.63 | 0.64 | 1.56 | 1.63 | 0.51 |
| SecSel | 2.30 | 2.42 | 0.54 | 2.28 | 2.41 | 0.48 | 2.25 | 2.37 | 0.55 | 2.32 | 2.43 | 0.73 |
| Sixth | 0.06 | 0.05 | 0.21 | 0.05 | 0.04 | 0.16 | 0.05 | 0.04 | 0.15 | 0.06 | 0.05 | 0.20 |
| Tert | 0.04 | 0.03 | 0.20 | 0.04 | 0.03 | 0.27 | 0.06 | 0.04 | 0.29 | 0.05 | 0.03 | 0.33 |
| Total | 100 | 100 | 100 | 100 | 100 | 100 | 100 | 100 | 100 | 100 | 100 | 100 |
Table 4b. Distribution (in %) of all entries, entries with ethnicity (ETH) data, and entries without ethnicity data across centre types in A level equalities dataset
| Centre type | 2018 All | 2018 With ETH | 2018 No ETH | 2019 All | 2019 With ETH | 2019 No ETH | 2020 All | 2020 With ETH | 2020 No ETH | 2021 All | 2021 With ETH | 2021 No ETH |
|---|---|---|---|---|---|---|---|---|---|---|---|---|
| Acad | 41.2 | 63.3 | 5.5 | 41.6 | 63.4 | 6.0 | 41.5 | 63.2 | 6.2 | 41.7 | 63.3 | 6.5 |
| Free | 0.7 | 1.1 | 0.1 | 0.8 | 1.2 | 0.1 | 0.8 | 1.2 | 0.1 | 0.8 | 1.3 | 0.1 |
| FurE | 2.1 | 0.1 | 5.3 | 2.2 | 0.1 | 5.6 | 2.3 | 0.1 | 6.0 | 2.5 | 0.1 | 6.4 |
| Indp | 13.6 | 0.4 | 34.7 | 13.2 | 0.4 | 34.3 | 13.0 | 0.4 | 33.4 | 12.7 | 0.5 | 32.6 |
| Other | 0.4 | 0.4 | 0.5 | 0.4 | 0.4 | 0.5 | 0.4 | 0.4 | 0.5 | 0.5 | 0.4 | 0.6 |
| SecComp | 16.2 | 25.7 | 0.8 | 16.3 | 25.6 | 1.0 | 16.1 | 25.4 | 1.0 | 16.3 | 25.6 | 1.1 |
| SecMod | 0.4 | 0.7 | 0.0 | 0.4 | 0.7 | 0.0 | 0.4 | 0.7 | 0.0 | 0.4 | 0.7 | 0.0 |
| SecSel | 4.7 | 7.5 | 0.2 | 4.6 | 7.2 | 0.2 | 4.6 | 7.3 | 0.2 | 4.4 | 7.0 | 0.2 |
| Sixth | 17.9 | 0.8 | 45.4 | 17.6 | 1.0 | 44.9 | 18.0 | 1.2 | 45.2 | 17.7 | 1.2 | 44.6 |
| Tert | 2.9 | 0.0 | 7.5 | 2.8 | 0.0 | 7.5 | 2.9 | 0.0 | 7.6 | 3.0 | 0.0 | 7.9 |
| Total | 100 | 100 | 100 | 100 | 100 | 100 | 100 | 100 | 100 | 100 | 100 | 100 |
Missing data on the background variables is most likely the result of schools and colleges not returning the census. Missing data on KS2 prior attainment most likely reflects the fact that some candidates did not sit the KS2 tests for a variety of reasons, including candidates being absent from school at the time of the tests; candidates attending independent school at KS2; candidates attending school outside of England at the time of the tests, etc. Missing data on GCSE prior attainment has a similar cause: some candidates did not take GCSEs at 16. As with any analysis involving the merging of datasets, missing data can also be caused by data matching problems.
Missing data can be problematic, particularly where it is systematic rather than at random. It raises questions about whether the findings from the main models on the known categories applied to the whole candidate population and whether the unknown categories could effectively be treated as proxies for some centre type(s). Nonetheless, the comparisons of interest here concern not so much the between-group differences within each year, but rather any changes in between-group differences in 2021 compared with previous years. As is evident from comparing the 4 No PA columns in Table 3b and 3c (or the 4 No ETH columns in Table 4a and 4b, or the 4 2018 to 2021 columns in Table 3a), the missing data rates and patterns are comparable across the 4 years, so we can reasonably assume the subgroups are comparable. That is to say, whilst we might interpret between-group differences within each year cautiously, any change to those differences over time can be interpreted as a change in outcomes for different subgroups.
Outline of analyses
Descriptive statistics
To compare different subgroups of candidates, we examined 3 performance measures: (i) the mean of numeric grades awarded for entries in the relevant group; (ii) the percentage/probability of entries in the relevant group awarded A level grade A and above / GCSE grade 7 and above; (iii) the percentage/probability of entries in the relevant group awarded A level grade C and above / GCSE grade 4 and above. For our numeric grade analyses, GCSE 9-to-1 grades are already numeric; A level letter grades are not numeric and they were converted into numbers: A*=6, A=5, …, E=1. For both qualifications, entries awarded U were counted and U was converted into 0. Breakdowns of results on these measures by student background variables will be presented in bar graphs below. The exact numbers behind the graphs, as well as further information about each subgroup’s number of entries, variability of grades, proportion of entries by candidates with known prior attainment data, and median, mean and standard deviation of the known prior attainment scores in each can be found in the Appendix (Tables A1.1-4 for A level, Tables A2.1-4 for GCSE).
Modelling
From the basic descriptive statistics, one can calculate results gaps between any 2 subgroups of candidates. These ‘raw’ results gaps can be misleading in some cases, and we therefore used multivariate analyses to study ‘conditional’ results gaps. Multivariate analyses allow the effect of a variable to be examined while holding other variables constant. For example, the descriptive statistics may show that females outperform males, and that candidates with high prior attainment outperform candidates with low prior attainment. A multivariate analysis allows us to hold prior attainment constant while estimating the gender difference in results, and vice versa. If the gender difference seen in descriptive statistics disappears in the multivariate analysis, we would conclude that the females in our sample had higher prior attainment indicating higher ability than the males and that it was this difference in ability that led to their higher performance, not their being female per se.
Alternatively, the gender difference seen in descriptive statistics may remain and increase or decrease in size, or may reverse in direction, in the multivariate analysis, which would lead to different conclusions about what difference, if any, being female vs. male per se made to results. By taking correlations between background variables into account, multivariate analyses allow us to estimate conditional results gaps between subgroups of candidates defined by a background variable, which provide a purer assessment of the effect of the variable on results than the corresponding raw results gaps.
Because our prior attainment measure was based on KS2 or GCSE performance and there were correlations between most variables in the model and prior attainment, the effects of many variables on GCSE or A level outcome were likely to be wrapped up in their effects on KS2 or GCSE attainment. As the model quantifies the effect of each variable after controlling for prior attainment, among other variables, the effects relate to the differences that the variables would have made between candidates taking their KS2 or GCSEs and their GCSEs or A levels, rather than the differences that the variables may introduce across an entire school career.
To illustrate, suppose our analysis of A level results of 2019 finds that female candidates outperformed prior-attainment-matched male candidates. What this effect quantifies is the difference that being male or female in the academic years 2017 to 2018 and 2018 to 2019 (that is, the time between candidates taking their GCSEs in 2017 and their A levels in 2019) made to A level results, not the difference that being male or female for 18 years made.
We carried out linear mixed effects modelling (also known as multilevel modelling) on 3 performance measures: (i) mean numeric grade, (ii) probability of attaining A level grade A and above or GCSE grade 7 and above, (iii) probability of attaining A level grade C and above or GCSE grade 4 and above. Each analysis took exam entry as the unit of analysis and aimed to model the relationship, in a particular year, between an entry’s numeric grade or probability of attaining a key grade or higher, on the one hand, and background information about the entry and the candidate that the entry belonged to, on the other. All analyses included candidates and centres as random effects, to take account of candidates taking multiple subjects and candidates clustering within centres. The fixed effects of the main models to be reported below were the same as those in our 2020 analysis: (please refer to ‘Data on background variables’ section above for keys to the acronyms and abbreviations)
- Gender: male, female (reference category), unknown/neither
- Ethnicity: AOEG, ASIA, BLAC, CHIN, MIXD, WHIT (reference category), unknown
- Major language: English (reference category), NotEnglish, unknown
- SEND status: NoSEND (reference category), SEND, unknown
- FSM eligibility: NoFSM (reference category), FSM, unknown
- Deprivation: very low, low, medium (reference category), high, very high, unknown
- Prior attainment: very low, low, medium (reference category), high, very high, unknown
- Subject: for A level: Art & Design: 3D Studies, Art & Design: Art, Craft and Design, Art & Design: Critical and Contextual Studies, Art & Design: Fine Art, Art & Design: Graphics, Art & Design: Photography, Art & Design: Textiles, Biology, Business Studies, Chemistry, Classical Greek, Computing, Dance, Drama & Theatre Studies, Economics, English Language, English Language & Literature, English Literature, French, Geography, German, History, Latin, Music, Physical Education, Physics, Psychology (reference category), Religious Studies, Sociology, Spanish; for GCSE: Art & Design: 3D Studies, Art & Design: Art, Craft and Design, Art & Design: Critical and Contextual Studies, Art & Design: Fine Art, Art & Design: Graphics, Art & Design: Photography, Art & Design: Textiles, Biology, Chemistry, Citizenship Studies, Classical Greek, Combined Science, Computing, Dance, Drama, English Language, English Literature, Food Prep and Nutrition, French, Geography, German, History, Latin, Mathematics (reference category), Music, Physical Education, Physics, Religious Studies, Spanish
Apart from the main models, we ran 2 additional sets of models to examine other results gaps. One set included centre type and region alongside prior attainment and subject as fixed effects, which estimated conditional results gaps in relation to centre type and region. Because of the uneven distribution of centre types across the nation, analysing region with control for centre type provides a purer assessment of regional differences. The centre type and region variables had the following categories: (please refer to ‘Data on background variables’ section above for keys to the acronyms and abbreviations)
- Centre type: Acad (reference category), Free, FurE, Indp, Other, SecComp, SecMod, SecSel, Sixth, Tert
- Region: EM, EA, LD, NE, NW, SE (reference category), SW, WM, Y&H
Another set of models included minor grouping of ethnicity alongside prior attainment and subject as fixed effects, which estimated conditional results gaps in relation to more narrowly defined ethnic groups, supplementing the findings from the main models on the broadly defined ethnic groups. The minor grouping was: (please refer to ‘Data on background variables’ section above for keys to the acronyms and abbreviations)
- Ethnicity (minor grouping): ABAN, AIND, AOTH, APKN, BAFR, BCRB, BOTH, CHNE, MOTH, MWAS, MWBA, MWBC, OOTH, WBRI (reference category), WIRI, WIRT, WOTH, WROM, unknown
All models fitted can be expressed mathematically as:
yijk = α + β xijk + ui + uj + eijk
where:
yijk = [ in numeric grade analysis ] numeric grade awarded for exam entry by candidate i in centre j in subject k; [ in grade probability analysis ] exam entry by candidate i in centre j in subject k being awarded the target grade or not (1 or 0);
xijk = a set of background variables about the candidate taking the exam entry and the subject of the exam entry;
ui = random intercept of candidate i;
uj = random intercept of centre j;
eijk = entry level residual.
The α coefficient of a fitted model was interpreted as the estimate of the result for an ‘average’ entry, that is, an entry in the reference subject by a candidate who was in the reference category of every one of the background variables. In numeric grade analyses, α represents the grade an average entry would receive; in grade probability analyses, α represents the probability that an average entry would be awarded the key grade in question.
The β coefficients of a fitted model were interpreted as estimates of the magnitude of the conditional results gap between a particular group and the reference group on a background variable. For example, in the analysis about grade A and above in A level in 2021, on the gender variable, a β of -0.0194 for male means that the conditional results gap between males and females (who were the reference group on the gender variable in the model) was -0.0194, indicating that after controlling for other background variables in the model, including prior attainment, males had on average 1.94% lower probability of being awarded A or above than prior-attainment-matched females in 2021. Variation of the βs for a particular subgroup from the 4 years’ models tells us how that subgroup’s conditional results gap (relative to the relevant reference group) has changed across the 4 years.
All β coefficients had associated standard errors (SEs), which quantified how precisely β coefficients had been estimated. The SEs were used to compute the 95% confidence intervals (CIs) of the β coefficients, using the formula: 95% CI = β ± 1.96*SE. βs (taken as estimates of conditional results gaps) and their 95% confidence intervals will be presented in bar graphs below. Looking closely the change across the years in conditional results gap in different subgroups of candidates would help one gauge the pattern of any differential change.
Detailed output of all models reported in this paper can be found in the Appendix (Tables A3.1 to A3.9 for A level).
Evaluating changes between years in group differences
To more formally identify differential change, one has to consider several statistical and practical issues: (i) the relative weight to give to statistical significance and effect size when interpreting analyses of large-N (near) population data, (ii) how to factor between-year changes in normal times into consideration, (iii) what is the smallest practically significant change. We used a multi-step method for evaluating changes in conditional results gap between 2020 and 2021:
Step 1: identify subgroups whose results gap was not significantly different from zero (at 5% level of significance) in any year and exclude them from further consideration – this step picks out the subgroups that genuinely never showed any results gap relative to the reference group and those whose estimates consistently had large standard errors and confidential intervals, suggesting they were too small in size and/or had much variability within the subgroup, making it hard for their results gap to be estimated reasonably precisely.
Step 2: from the subgroups not excluded in Step 1, identify those whose 2020-to-2021 change in conditional results gap in absolute value was larger than their 2018-to-2019 change in absolute value – this step gives consideration to how much conditional results gaps can change between 2 normal years, namely, 2018 and 2019, and picks out between-year changes that exceed normal between-year changes in magnitude.
Step 3: from the subgroups identified in Step 2, flag as ‘notable’ the subgroups whose 2020-to-2021 change exceeded an effect size criterion, which we set at 0.1 grade for the numeric grade measure and 1ppt for the % of key grade and above measures.
In the rest of this paper, the word ‘notable’ will be used to describe any between-year change that gets flagged using our method of evaluating between-year changes. It does not convey any judgement of the importance or not of the change in question.
To appreciate what a change in conditional results gap of 0.1 grade means, let’s suppose 2 groups of 100 students each categorised by handedness, and that the 2 groups are otherwise perfectly matched in background and all take one A level subject in one year. If all 100 right-handed students receive grade B (converted to 4 out of 6, in our analysis), and of the left-handed students, 50 get grade B and 50 grade A (converted to 5 out of 6, in our analysis), the mean numeric grades for the right-handed and left-handed group are 100 *4 /100=4 grades and (50 * 4 + 50 * 5) / 100 = 4.5 grades respectively. The conditional results gap in terms of mean numeric grade for the left-handed group relative to the right-handed group is 4.5 - 4 = + 0.5 grade. Then in the following year, let’s suppose that there are the exact same number of left- and right-handed students who are otherwise perfectly matched in background and that the right-handed students again all get grade B. If the conditional results gap for the left-handed group relative to the right-handed group has changed by -0.1 grade between the 2 years, the gap has gone from +0.5 grade to +0.4 grade. Given that the right-handed students have all got grade B (like their counterparts in the previous year), the right-handed group’s mean numeric grade has remained at 4 grades, and the change in the gap means that the left-handed group’s mean numeric grade has gone down by 0.1 grade (from 4.5 in the previous year) to 4.4 grades. There are a myriad of combinations of individual grades that can give rise to a group’s mean numeric grade of 4.4 grades. One possibility is that in the second year, of the 100 left-handed students, 60 get B and 40 get A (compared to 50 Bs and 50 As in the previous year).
The number of 2020-to-2021 changes found to be not notable, as well as the nature of the notable ones, will be reported below. We also applied the multi-step method to assess changes in conditional results gap between 2019 and 2021, the results of which will also be reported below.
Results
A level
Main model (gender, ethnicity, major language, SEND, FSM eligibility, deprivation, prior attainment, subject)
Mean numeric grade
Figures 1.1 to 1.7 show breakdowns of 2018 to 2021 A level results (on the numeric grade measure) by the variables included in the main model, and the modelled conditional results gaps between the groups defined under each of those variables and their respective reference group. Table 5 presents the main models’ results gap estimates for 2018 to 2021.
From the top graphs, all groups see an increase in their mean grade in 2021, compared to 2020 as well as 2019.
The top row of Table 5 shows the grade awarded to an ‘average’ entry in 2018 to 2021. The 2020-to-2021 increase of 0.28 and the 2019-to-2021 increase of 0.88 grade and grade are notable.
From the bottom graphs as well as Table 5, using the multi-step method described above, we found:
- all 22 between-group comparisons (on gender, ethnicity, language, SEND, FSM, deprivation, prior attainment) showed no notable change from 2020 to 2021
- 19 of the 22 between-group comparisons (on ethnicity, language, FSM, deprivation) showed no notable change from 2019 to 2021
The notable 2019-to-2021 changes are:
- the gap between males and females and the gap between SEND candidates and non-SEND candidates, have shifted from positive to negative, indicating that in 2019, male candidates and SEND candidates had higher outcomes than prior-attainment-matched female candidates and non-SEND candidates respectively, but in 2021, the direction of the difference reversed. The shifts represent small changes of 0.2 grade on the gender variable and 0.11 grade on the SEND variable.
- the longstanding gap indicating higher outcomes of candidates with unknown prior attainment relative to candidates with a medium prior attainment, has narrowed by 0.12 grade
Figure 1.1 2018 to 2021 A level results (numeric grade) and modelled conditional results gaps by gender
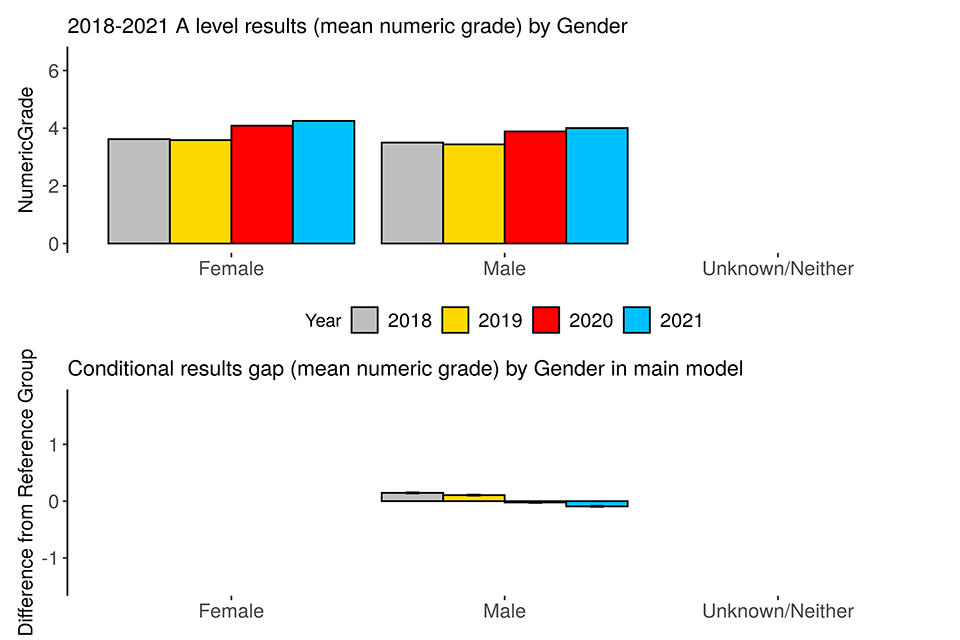
Note: The unknown/neither group’s result is not presented out of concern for disclosure, and it was not included in the modelling because of its extremely small size.
Figure 1.2 2018 to 2021 A level results (numeric grade) and modelled conditional results gaps by ethnicity
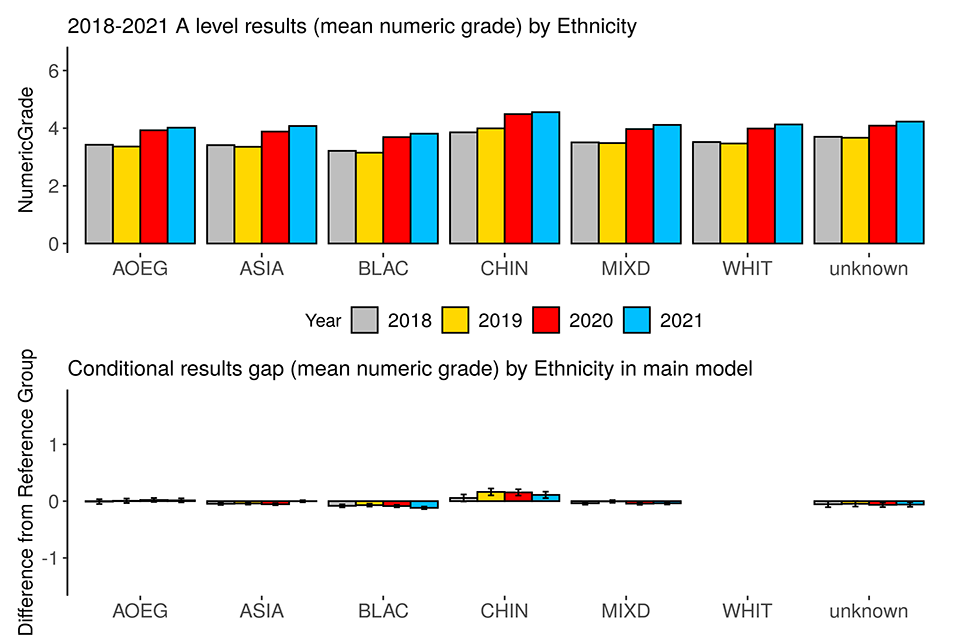
Figure 1.3 2018 to 2021 A level results (numeric grade) and modelled conditional results gaps by major language
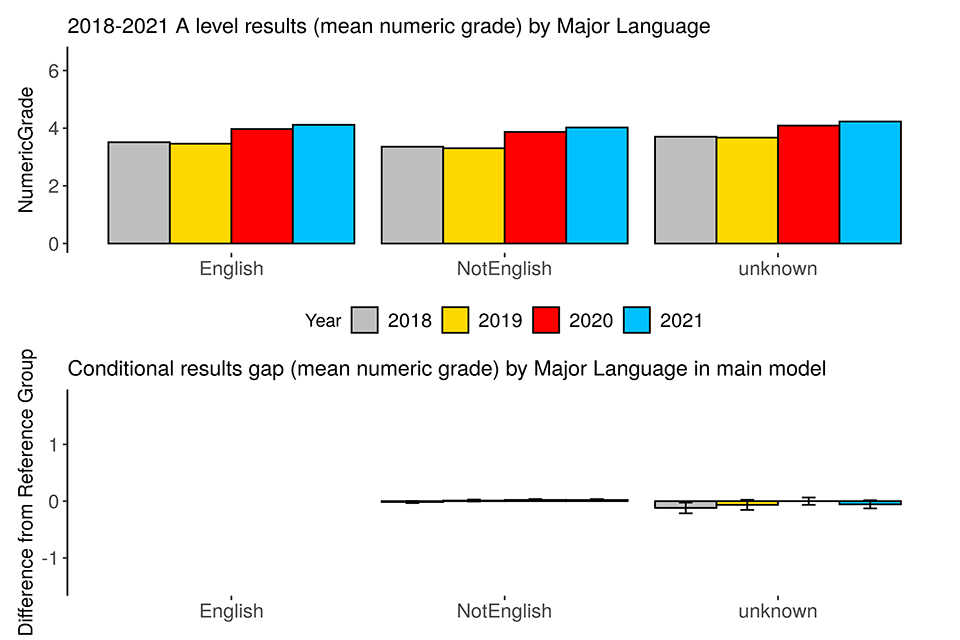
Figure 1.4 2018 to 2021 A level results (numeric grade) and modelled conditional results gaps by SEND status
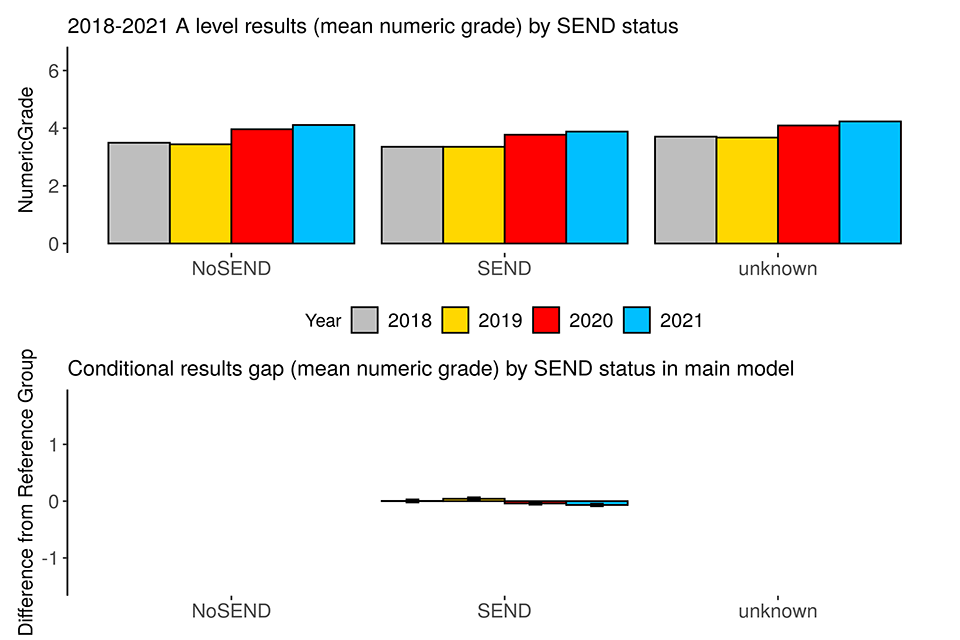
Note: There was no conditional results gap estimate for the unknown SEND status group because of perfect collinearity between unknown SEND and unknown FSM.
Figure 1.5 2018 to 2021 A level results (numeric grade) and modelled conditional results gaps by FSM eligibility
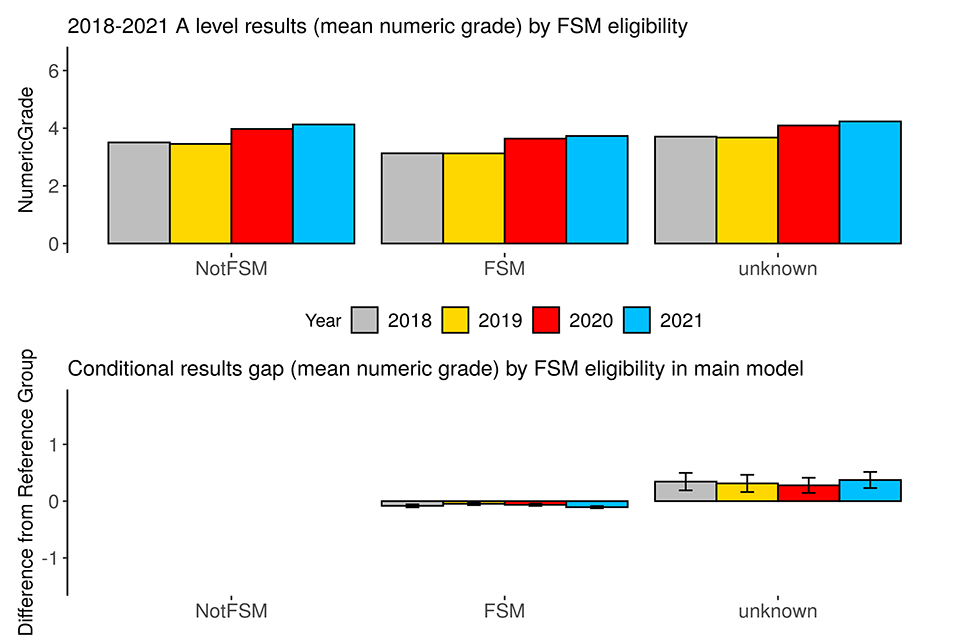
Figure 1.6 2018 to 2021 A level results (numeric grade) and modelled conditional results gaps by deprivation
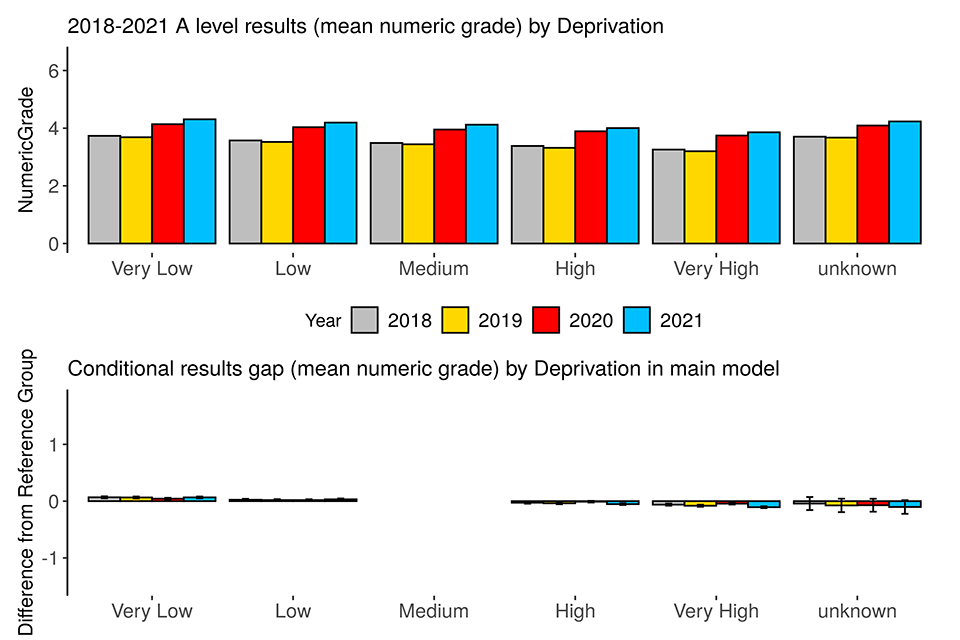
Figure 1.7 2018 to 2021 A level results (numeric grade) and modelled conditional results gap by prior attainment
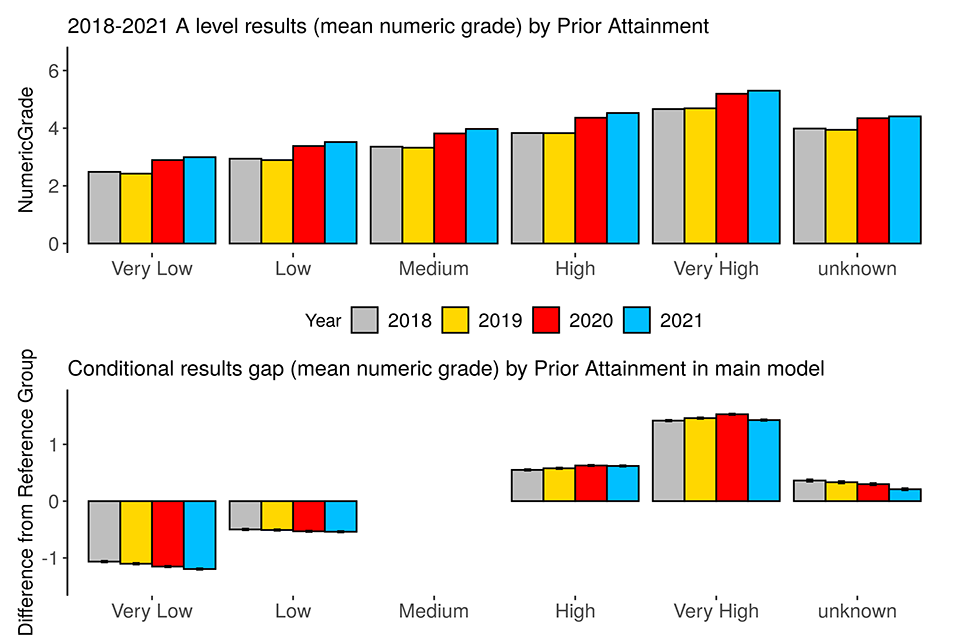
Table 5. Summary of modelled results gaps in 2018 to 2021 A level results (mean numeric grade)
| Comparison | 2018 | 2019 | 2020 | 2021 |
|---|---|---|---|---|
| Average entry | 3.3 | 3.3 | 3.9 | 4.2 |
| Ethnicity: AOEG v WHIT | 0.0 | 0.0 | 0.0 | 0.0 |
| Ethnicity: ASIA v WHIT | 0.0 | 0.0 | -0.1 | 0.0 |
| Ethnicity: BLAC v WHIT | -0.1 | -0.1 | -0.1 | -0.1 |
| Ethnicity: CHIN v WHIT | 0.1 | 0.2 | 0.2 | 0.1 |
| Ethnicity: MIXD v WHIT | 0.0 | 0.0 | 0.0 | 0.0 |
| Ethnicity: Unknown v WHIT | -0.1 | 0.0 | -0.1 | -0.1 |
| FSM: FSM v NotFSM | -0.1 | 0.0 | -0.1 | -0.1 |
| FSM: Unknown v NotFSM | 0.3 | 0.3 | 0.3 | 0.4 |
| Gender: Male v Female | 0.1 | 0.1 | 0.0 | -0.1 |
| Deprivation: Very low v Medium | 0.1 | 0.1 | 0.0 | 0.1 |
| Deprivation: Low v Medium | 0.0 | 0.0 | 0.0 | 0.0 |
| Deprivation: High v Medium | 0.0 | 0.0 | 0.0 | -0.1 |
| Deprivation: Very high v Medium | -0.1 | -0.1 | 0.0 | -0.1 |
| Deprivation: Unknown v Medium | 0.0 | -0.1 | -0.1 | -0.1 |
| Major language: NotEnglish v English | 0.0 | 0.0 | 0.0 | 0.0 |
| Major language: Unknown v English | -0.1 | -0.1 | 0.0 | -0.1 |
| Prior attainment: Very low v Medium | -1.1 | -1.1 | -1.2 | -1.2 |
| Prior attainment: Low v Medium | -0.5 | -0.5 | -0.5 | -0.5 |
| Prior attainment: High v Medium | 0.6 | 0.6 | 0.6 | 0.6 |
| Prior attainment: Very high v Medium | 1.4 | 1.5 | 1.5 | 1.4 |
| Prior attainment: Unknown v Medium | 0.4 | 0.3 | 0.3 | 0.2 |
| SEND: SEND v NoSEND | 0.0 | 0.0 | 0.0 | -0.1 |
Probability of grade A and above
Figures 2.1 to 2.7 show breakdowns of 2018 to 2021 A level results (on the probability-of-grade-A-and-above measure) by the variables included in the main model, and the modelled conditional results gaps between the groups defined under each of those variables and their respective reference group. Table 6 presents the main models’ results gap estimates for 2018 to 2021.
From the top graphs, all groups see an increase in 2021, compared to 2020 as well as 2019.
The top row of Table 6 shows the grade awarded to an ‘average’ entry in 2018 to 2021. The 2020-to-2021 increase of 11 percentage points and the 2019-to-2021 increase of 26 percentage points are notable.
From the bottom graphs as well as Table 6, using the multi-step method described above, we found:
- all 22 between-group comparisons (on gender, ethnicity, language, SEND, FSM, deprivation, prior attainment) showed no notable change from 2020 to 2021
- 19 of the 22 between-group comparisons (on ethnicity, language, FSM, deprivation) showed no notable change from 2019 to 2021
The notable 2020-to-2021 changes identified are:
- the gaps in relation to prior attainment indicate a stronger relationship between prior attainment and results for candidates with lower prior attainment, but a weaker relationship for candidates with higher prior attainment in 2021 than in 2020
- the gap indicating lower outcomes in 2020 of candidates with a very high level of deprivation relative to prior-attainment-matched candidates with a medium level of deprivation has widened by 1.85 percentage points in 2021
- the gap indicating lower outcomes in 2020 of Asian candidates relative to prior-attainment-matched White candidates has narrowed by 1.69 percentage points in 2021
- the gap indicating higher outcomes in 2020 of candidates with unknown FSM eligibility status relative to prior-attainment-matched non-FSM candidates has widened by 4.11 percentage points
- the gap indicating higher outcomes in 2020 of Chinese candidates relative to prior-attainment-matched White candidates has narrowed by 2.48 percentage points in 2021
- a gap between males and females has emerged, indicating equal performance for prior-attainment-matched male and female candidates in 2020 and higher outcomes for females in 2021. The shift represents a change of 1.87 percentage points
The notable 2019-to-2021 changes are:
- the gaps in relation to prior attainment indicate a stronger relationship between prior attainment and results in 2021 than in 2019
- the longstanding gaps indicating lower outcomes of Black candidates, FSM candidates, and candidates with a very high level of deprivation relative to their respective reference group, have widened by 1.43, 1.42 and 1.39 percentage points respectively
- the longstanding gap indicating lower outcomes of Asian candidates relative to white candidates has narrowed by 1.73 percentage points
- the longstanding gap indicating higher outcomes of candidates with unknown FSM eligibility status relative to prior-attainment-matched non-FSM candidates has widened by 2.89 percentage points
- the gap between males and females and the gap between SEND candidates and non-SEND candidates, have shifted from positive to negative, indicating that in 2019, male candidates and SEND candidates had higher outcomes than prior-attainment-matched female candidates and non-SEND candidates respectively, but in 2021, the direction of the difference reversed. The shifts represent changes of 4.36 percentage points on the gender variable and 2.07 percentage points on the SEND variable
Figure 2.1 2018 to 2021 A level results (probability of grade A and above) and modelled conditional results gaps by gender
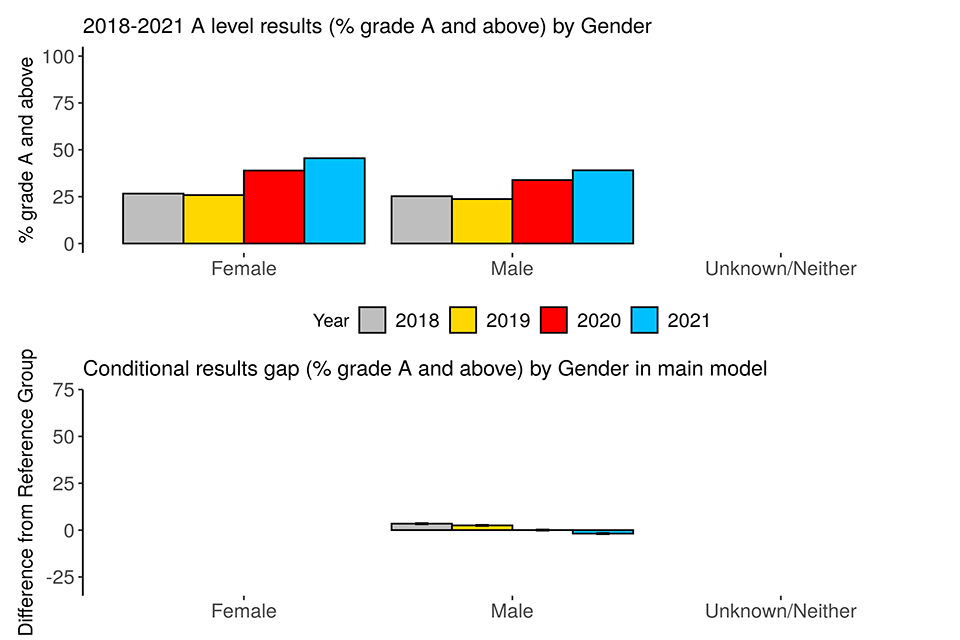
Note: The unknown/neither group’s result is not presented out of concern for disclosure, and it was not included in the modelling because of its extremely small size.
Figure 2.2 2018 to 2021 A level results (probability of grade A and above) and modelled conditional results gaps by ethnicity
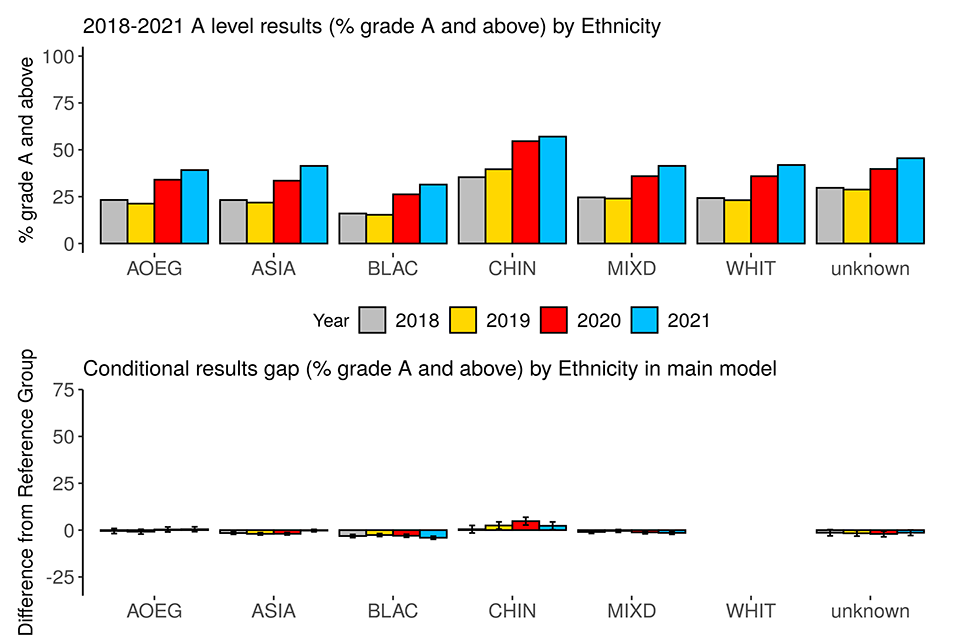
Figure 2.3 2018 to 2021 A level results (probability of grade A and above) and modelled conditional results gaps by major language
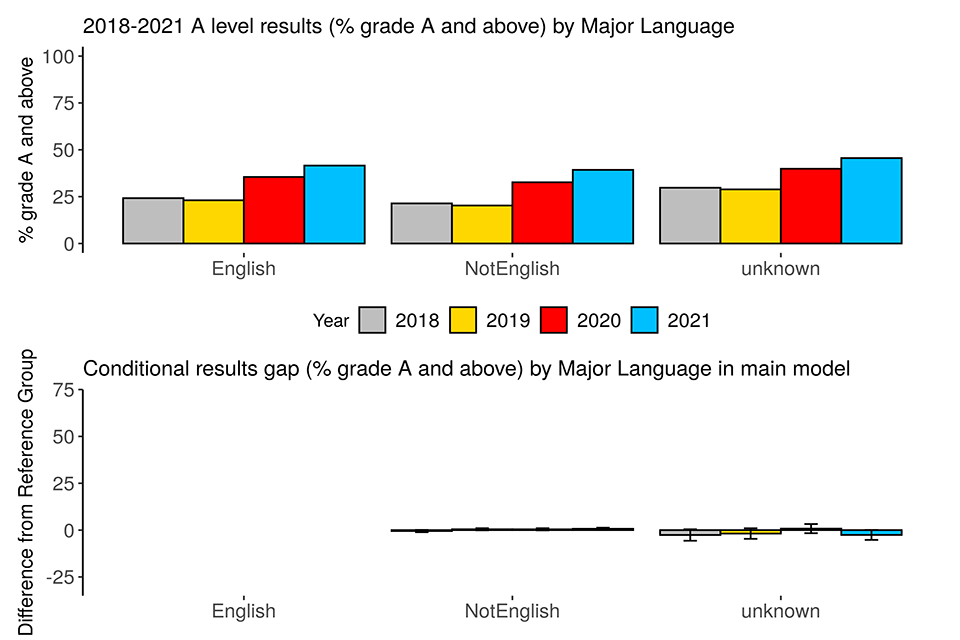
Figure 2.4 2018 to 2021 A level results (probability of grade A and above) and modelled conditional results gaps by SEND status
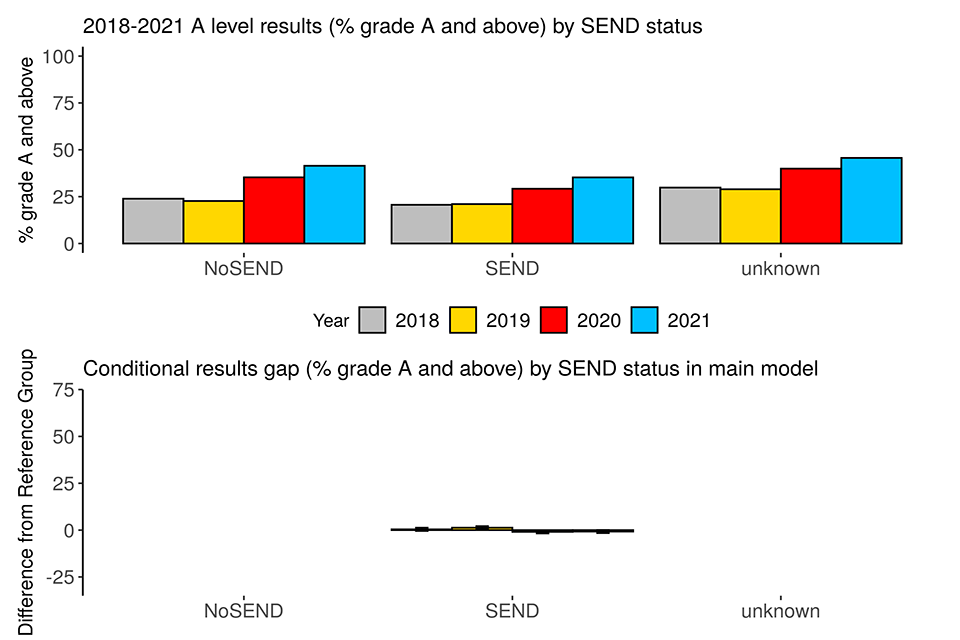
Note: There was no conditional results gap estimate for the unknown SEND status group because of perfect collinearity between unknown SEND and unknown FSM.
Figure 2.5 2018 to 2021 A level results (probability of grade A and above) and modelled conditional results gaps by FSM eligibility
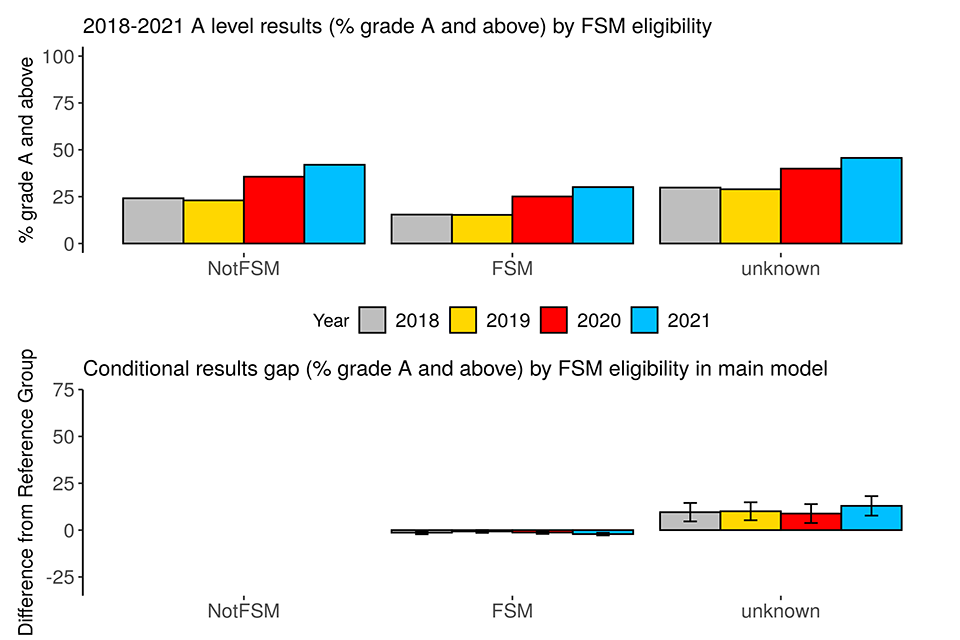
Figure 2.6 2018 to 2021 A level results (probability of grade A and above) and modelled conditional results gaps by deprivation
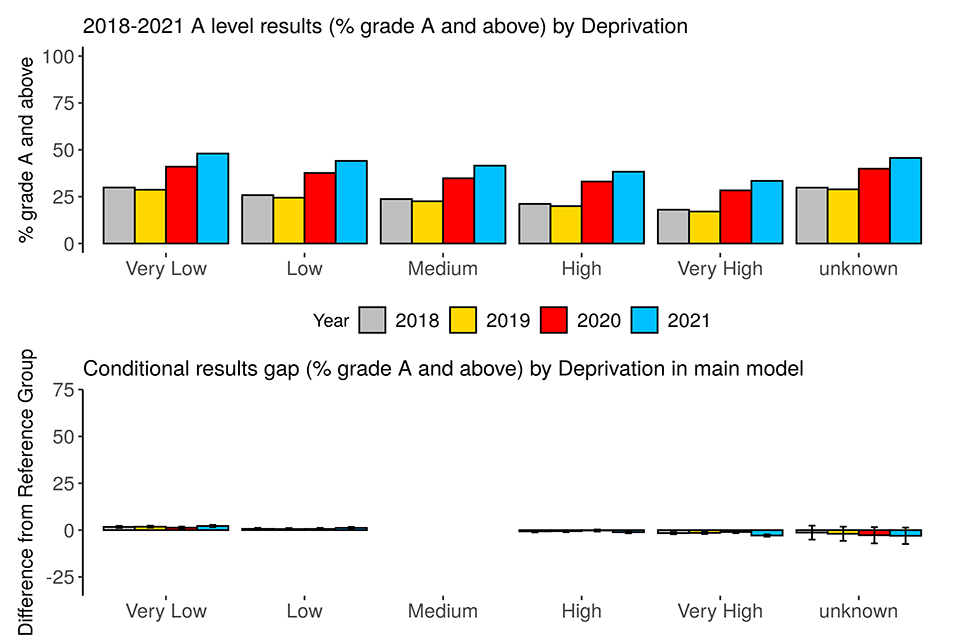
Figure 2.7 2018 to 2021 A level results (probability of grade A and above) and modelled conditional results gaps by prior attainment
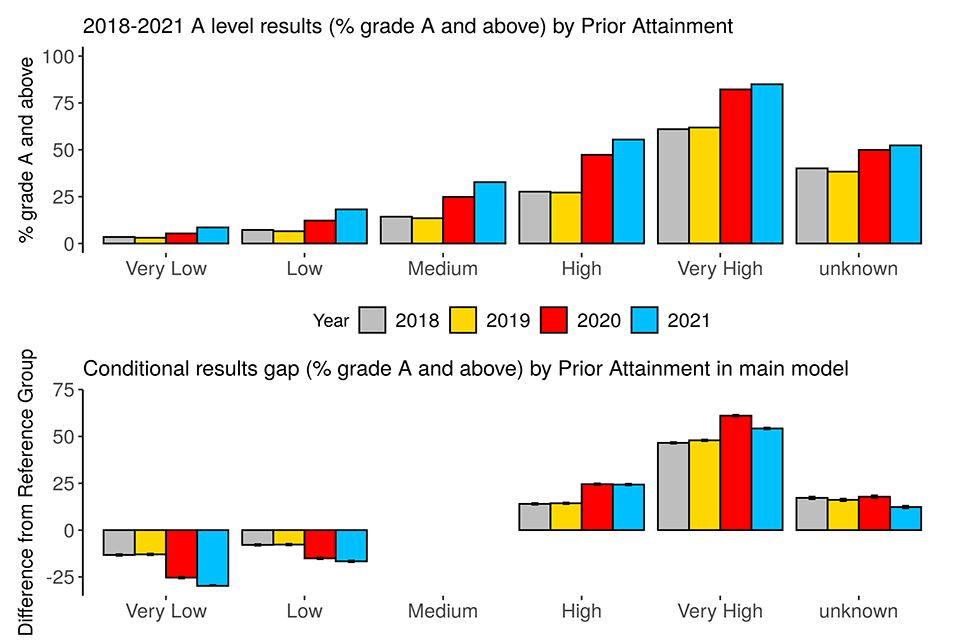
Table 6. Summary of modelled results gaps in 2018 to 2021 A level results (probability of grade A and above)
| Comparison | 2018 | 2019 | 2020 | 2021 |
|---|---|---|---|---|
| Average entry | 14% | 13% | 28% | 39% |
| Ethnicity: AOEG v WHIT | 0% | -1% | 0% | 0% |
| Ethnicity: ASIA v WHIT | -2% | -2% | -2% | 0% |
| Ethnicity: BLAC v WHIT | -3% | -3% | -3% | -4% |
| Ethnicity: CHIN v WHIT | 0% | 2% | 5% | 2% |
| Ethnicity: MIXD v WHIT | -1% | 0% | -1% | -1% |
| Ethnicity: Unknown v WHIT | -1% | -2% | -2% | -1% |
| FSM: FSM v NotFSM | -1% | -1% | -1% | -2% |
| FSM: Unknown v NotFSM | 10% | 10% | 9% | 13% |
| Gender: Male v Female | 3% | 3% | 0% | -2% |
| Deprivation: Very low v Medium | 2% | 2% | 1% | 2% |
| Deprivation: Low v Medium | 1% | 1% | 1% | 1% |
| Deprivation: High v Medium | -1% | -1% | 0% | -1% |
| Deprivation: Very high v Medium | -2% | -1% | -1% | -3% |
| Deprivation: Unknown v Medium | -1% | -2% | -3% | -3% |
| Major language: NotEnglish v English | -1% | 0% | 0% | 1% |
| Major language: Unknown v English | -3% | -2% | 1% | -3% |
| Prior attainment: Very low v Medium | -13% | -13% | -25% | -30% |
| Prior attainment: Low v Medium | -8% | -8% | -15% | -17% |
| Prior attainment: High v Medium | 14% | 14% | 25% | 24% |
| Prior attainment: Very high v Medium | 47% | 48% | 61% | 54% |
| Prior attainment: Unknown v Medium | 17% | 16% | 18% | 12% |
| SEND: SEND v NoSEND | 0% | 1% | -1% | -1% |
Probability of grade C and above
Figures 3.1 to 3.7 show breakdowns of 2018 to 2021 A level results (on the probability-of-grade-C-and-above measure) by the variables included in the main model, and the modelled conditional results gaps between the groups defined under each of those variables and their respective reference group. Table 7 presents the main models’ results gap estimates for 2018 to 2021.
From the top graphs, all groups see little change in outcomes from 2020, and an increase compared to 2019.
The top row of Table 7 shows the grade awarded to an ‘average’ entry in 2018 to 2021. The 2020-to-2021 increase of 2 percentage points and the 2019-to-2021 increase of 16 percentage points are notable. From the bottom graphs as well as Table 7, using the multi-step method described above, we found:
- 20 of the 22 between-group comparisons (including all those on gender, ethnicity, language, SEND and deprivation) showed no notable change from 2020 to 2021
- 13 of the 22 between-group comparisons (including all those on language and deprivation) showed no notable change from 2019 to 2021
The notable 2020-to-2021 changes are:
- the gap indicating FSM candidates’ lower outcomes in 2020 relative to non-FSM candidates has widened by 1.14 percentage points in 2021
- the gap indicating lower outcomes in 2020 of candidates with very low prior attainment relative to candidates with medium prior attainment has narrowed by 1.85 percentage points in 2021, indicating little change in the relationship between prior attainment and results between 2020 and 2021, except for candidates with very low prior attainment
The notable 2019-to-2021 changes are:
- the gaps in relation to prior attainment indicate a weaker relationship between prior attainment and results in 2021 than in 2019
- the longstanding gap indicating lower outcomes of FSM candidates relative to prior-attainment-matched non-FSM candidates has widened by 1.03 percentage points
- the longstanding gap indicating higher outcomes of Chinese candidates relative to White candidates, has narrowed by 2.15 percentage points
- the gaps between males and females, between SEND and non-SEND candidates, and between candidates with unknown prior attainment and candidates with medium prior attainment, have shifted from positive to negative, indicating that in 2019, male candidates, SEND candidates, and candidates with unknown prior attainment had higher outcomes than prior-attainment-matched female candidates, non-SEND candidates and candidates with medium prior attainment respectively, but in 2021, the direction of the difference reversed. The shifts represent changes of 4.77 percentage points on the gender variable, 2.55 percentage points on the SEND variable, and 3.51 percentage points on the prior attainment variable
Figure 3.1 2018 to 2021 A level results (probability of grade C and above) and modelled conditional results gaps by gender
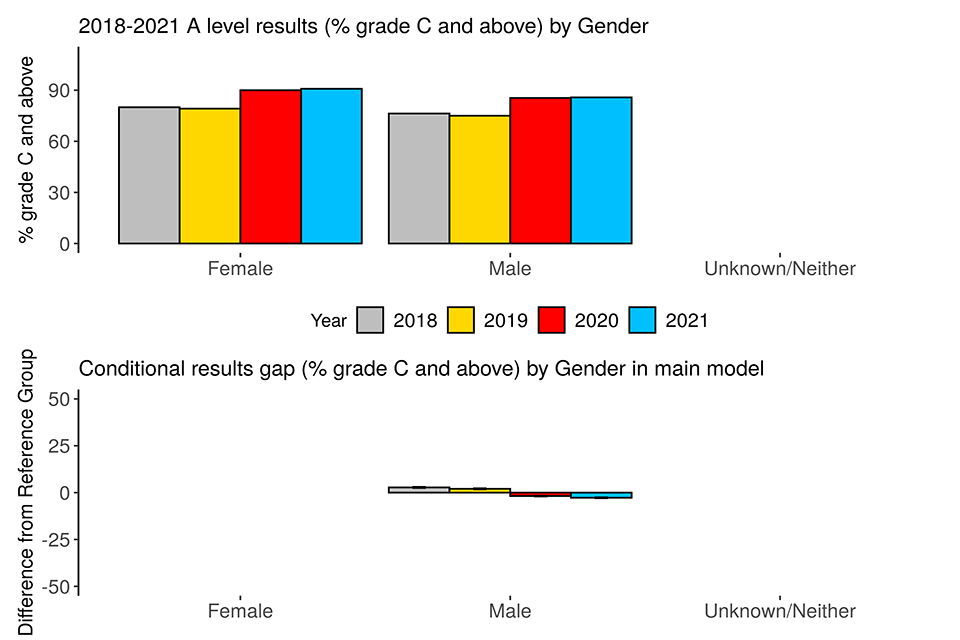
Note: The unknown/neither group’s result is not presented out of concern for disclosure, and it was not included in the modelling because of its extremely small size.
Figure 3.2 2018 to 2021 A level results (probability of grade C and above) and modelled conditional results gaps by ethnicity
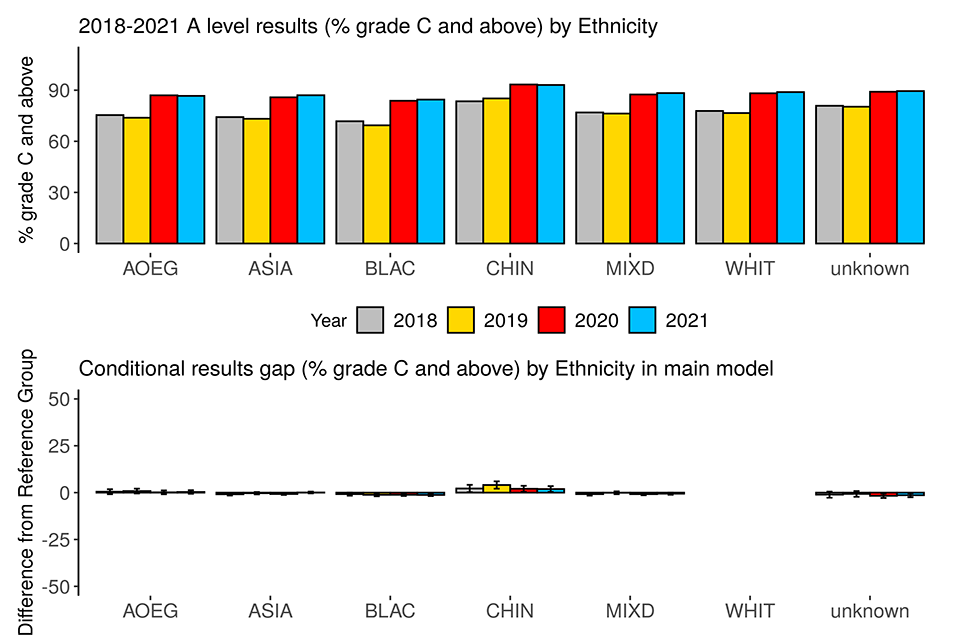
Figure 3.3 2018 to 2021 A level results (probability of grade C and above) and modelled conditional results gaps by major language
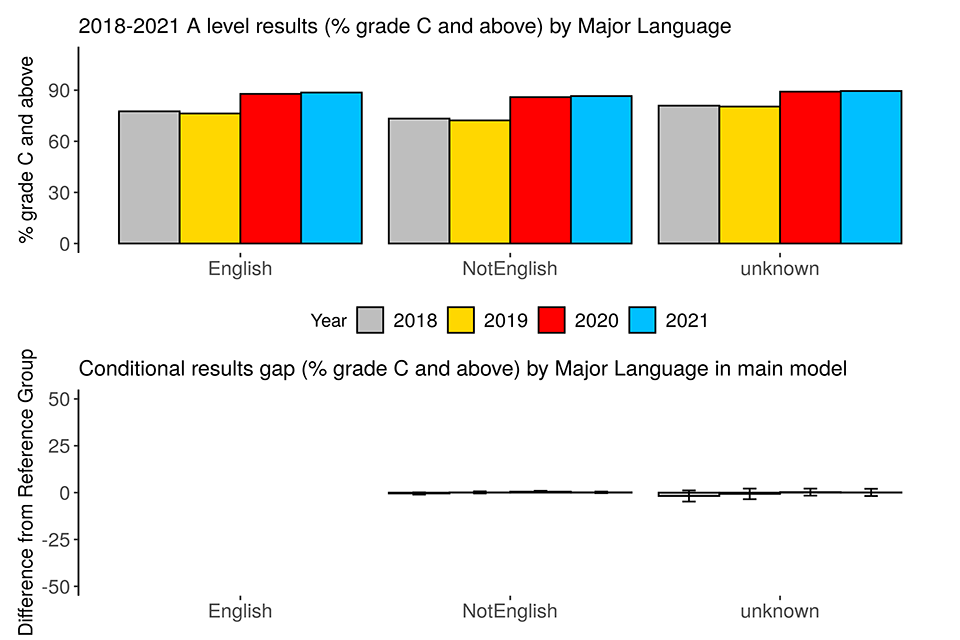
Figure 3.4 2018 to 2021 A level results (probability of grade C and above) and modelled conditional results gaps by SEND status
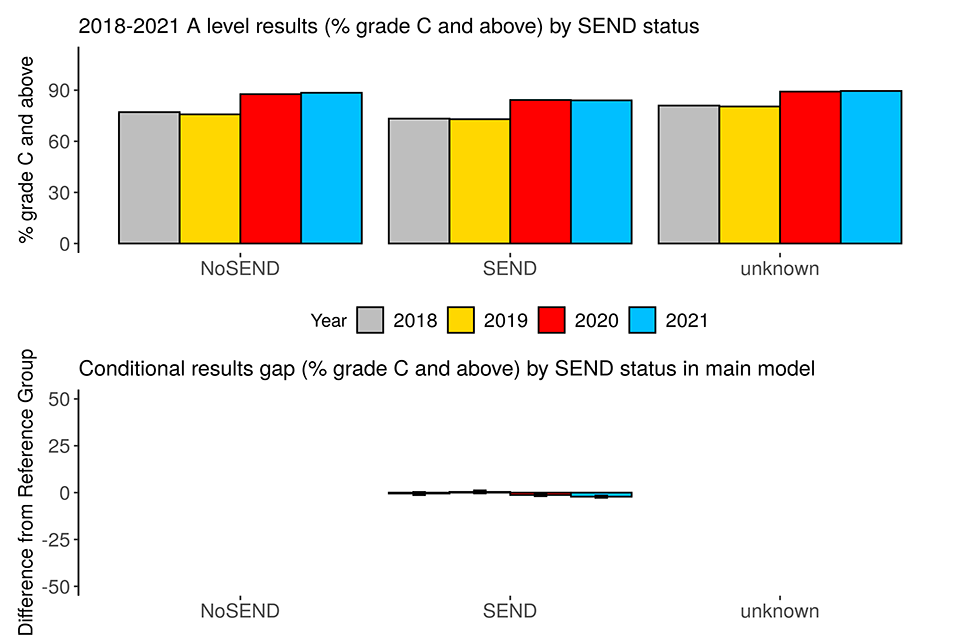
Note: *There was no conditional results gap estimate for the unknown SEND status group because of perfect collinearity between unknown SEND and unknown FSM.
Figure 3.5 2018 to 2021 A level results (probability of grade C and above) and modelled conditional results gaps by FSM eligibility
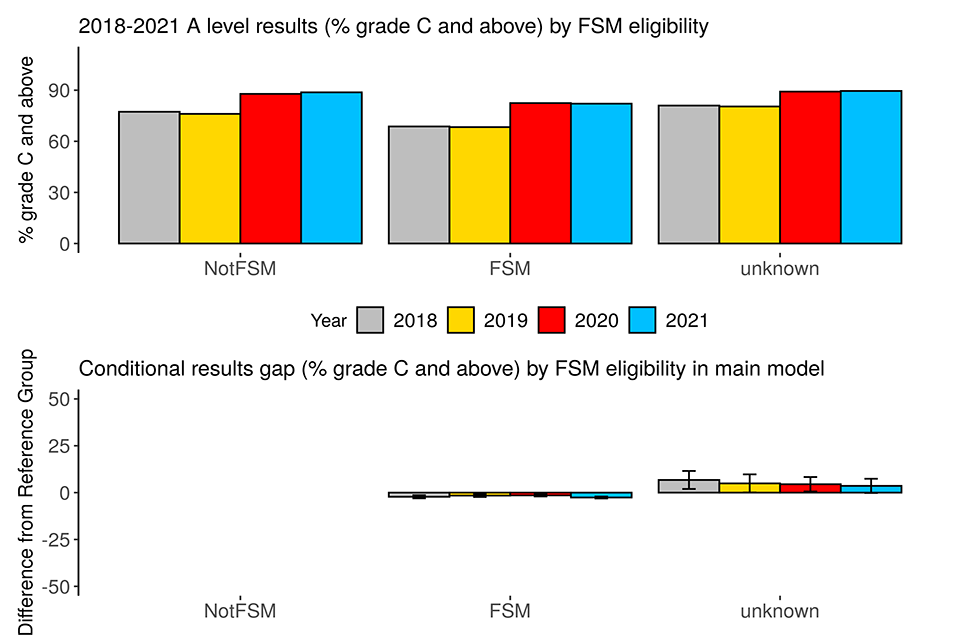
Figure 3.6 2018 to 2021 A level results (probability of grade C and above) and modelled conditional results gaps by deprivation
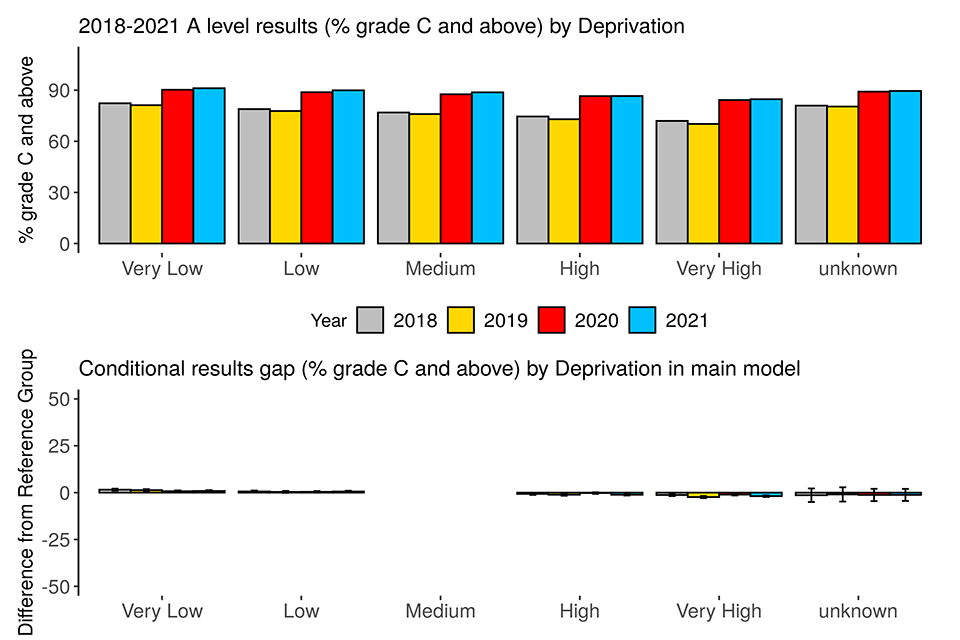
Figure 3.7 2018 to 2021 A level results (probability of grade C and above) and modelled conditional results gaps by prior attainment
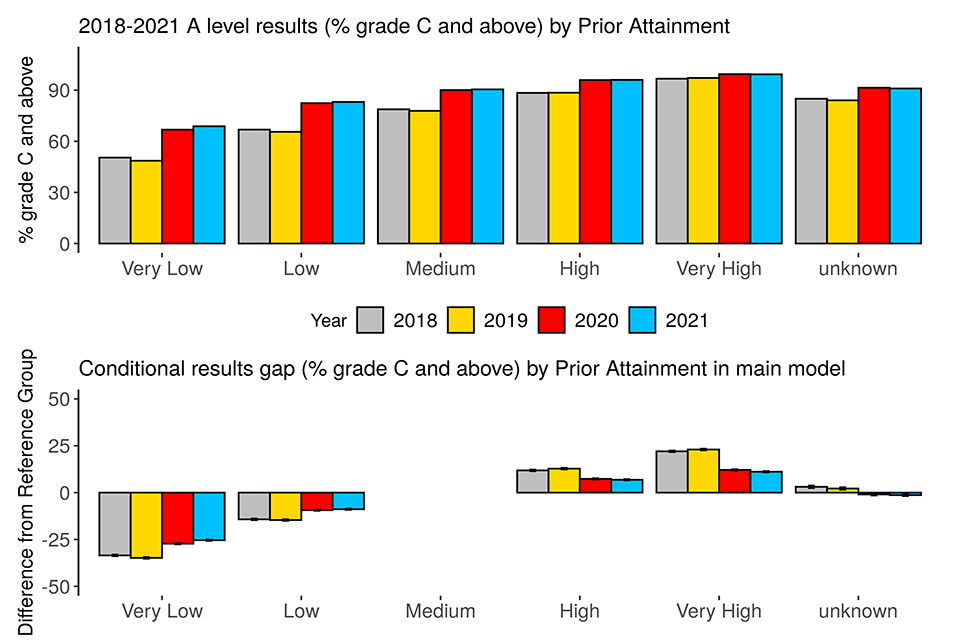
Table 7. Summary of modelled results gaps in 2018 to 2021 A level results (probability of grade C and above)
| Comparison | 2018 | 2019 | 2020 | 2021 |
|---|---|---|---|---|
| Average entry | 77% | 77% | 90% | 92% |
| Ethnicity: AOEG v WHIT | 0% | 1% | 0% | 0% |
| Ethnicity: ASIA v WHIT | -1% | 0% | -1% | 0% |
| Ethnicity: BLAC v WHIT | -1% | -1% | -1% | -1% |
| Ethnicity: CHIN v WHIT | 2% | 4% | 2% | 2% |
| Ethnicity: MIXD v WHIT | -1% | 0% | -1% | -1% |
| Ethnicity: Unknown v WHIT | -1% | -1% | -2% | -1% |
| FSM: FSM v NotFSM | -2% | -2% | -1% | -3% |
| FSM: Unknown v NotFSM | 7% | 5% | 4% | 4% |
| Gender: Male v Female | 3% | 2% | -2% | -3% |
| Deprivation: Very low v Medium | 2% | 1% | 1% | 1% |
| Deprivation: Low v Medium | 1% | 0% | 0% | 1% |
| Deprivation: High v Medium | -1% | -1% | 0% | -1% |
| Deprivation: Very high v Medium | -1% | -2% | -1% | -2% |
| Deprivation: Unknown v Medium | -1% | -1% | -1% | -1% |
| Major language: NotEnglish v English | 0% | 0% | 1% | 0% |
| Major language: Unknown v English | -2% | -1% | 0% | 0% |
| Prior attainment: Very low v Medium | -33% | -35% | -27% | -25% |
| Prior attainment: Low v Medium | -14% | -15% | -9% | -9% |
| Prior attainment: High v Medium | 12% | 13% | 7% | 7% |
| Prior attainment: Very high v Medium | 22% | 23% | 12% | 11% |
| Prior attainment: Unknown v Medium | 3% | 2% | -1% | -1% |
| SEND: SEND v NoSEND | 0% | 0% | -1% | -2% |
Additional model 1 (centre type, region, prior attainment, subject)
An additional set of models were run to examine results gaps by centre type and region, conditional on prior attainment and subject, which are presented in this section. The prior attainment effects and the α coefficients produced by these models are similar to those produced by the main models and therefore not repeated here.
Mean numeric grade
Figures 4.1 to 4.2 show breakdowns of 2018 to 2021 A level results (on the numeric grade measure) by centre type and region, and the modelled conditional results gaps between the groups defined under each of those variables and their respective reference group. Table 8 presents the additional models’ results gap estimates for 2018 to 2021.
From the top graphs, all groups see an increase in outcomes in 2021 compared to 2020 and 2019.
From the bottom graphs as well as Table 8, using the multi-step method described above, we found:
- all 8 regional comparisons showed no notable change from 2020 to 2021
- 7 of the 9 centre type comparisons (between academies and free schools, further education establishments, secondary comprehensives, secondary modern schools, secondary selective schools, sixth form colleges, ‘other’ centre types) showed no notable change from 2020 to 2021
- all 8 regional comparisons showed no notable change from 2019 to 2021
- 3 of the 9 centre type comparisons (between academies and free schools, further education establishments, secondary comprehensives) showed no notable change from 2019 to 2021
The notable 2020-to-2021 changes in relation to centre type are:
- the gap indicating higher outcomes in 2020 of candidates in independent schools relative to prior-attainment-matched candidates in academies have widened slightly by 0.14 grade in 2021
- the gap indicating lower outcomes in 2020 of candidates in tertiary colleges relative to prior-attainment-matched candidates in academies has widened slightly by 0.11 grade in 2021
The notable 2019-to-2021 changes in relation to centre type are:
- the longstanding gap indicating higher outcomes of candidates in independent schools relative to prior-attainment-matched candidates in academies has widened slightly by 0.11 grade
- the gaps indicating lower outcomes of candidates in sixth form and tertiary colleges relative to prior-attainment-matched candidates in academies have widened slightly by 0.13 and 0.16 grade respectively
- the gap indicating lower outcomes of candidates in secondary modern/high schools relative to prior-attainment-matched candidates in academies, has narrowed slightly by 0.14 grade
- the gap between ‘other’ centre types and academies has shifted from negative to positive, indicating that in 2021, candidates in other centre types had higher outcomes than prior-attainment-matched candidates in academies, while in 2019, the direction of the difference reversed. The shift represents a change of 0.33 grade
- the gap between secondary selective schools and academies has shifted from positive to negative, indicating that in 2019, candidates in secondary selective schools had higher outcomes than prior-attainment-matched candidates in academies, but in 2021, the direction of the difference reversed. The shift represents a small change of 0.18 grade
Figure 4.1 2018 to 2021 A level results (numeric grade) and modelled conditional results gaps by centre type controlled for region, prior attainment and subject
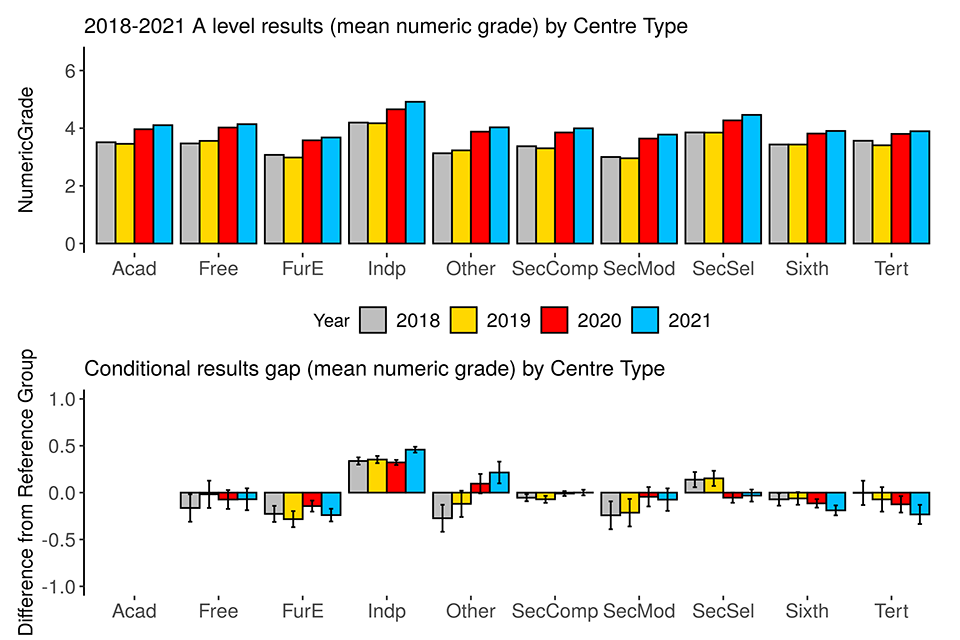
Figure 4.2 2018 to 2021 A level results (numeric grade) and modelled conditional results gaps by region controlled for centre type, prior attainment and subject

Table 8. Summary of modelled results gaps in 2018 to 2021 A level results (mean numeric grade) from additional model on centre type and region
| Comparison | 2018 | 2019 | 2020 | 2021 |
|---|---|---|---|---|
| Centre Type: Free v Acad | -0.2 | 0.0 | -0.1 | -0.1 |
| Centre Type: FurE v Acad | -0.2 | -0.3 | -0.1 | -0.2 |
| Centre Type: Indp v Acad | 0.3 | 0.4 | 0.3 | 0.5 |
| Centre Type: Other v Acad | -0.3 | -0.1 | 0.1 | 0.2 |
| Centre Type: SecComp v Acad | -0.1 | -0.1 | 0.0 | 0.0 |
| Centre Type: SecMod v Acad | -0.2 | -0.2 | 0.0 | -0.1 |
| Centre Type: SecSel v Acad | 0.1 | 0.2 | -0.1 | 0.0 |
| Centre Type: Sixth v Acad | -0.1 | -0.1 | -0.1 | -0.2 |
| Centre Type: Tert v Acad | 0.0 | -0.1 | -0.1 | -0.2 |
| Region: East Midlands v South East | 0.0 | 0.0 | -0.1 | 0.0 |
| Region: East of England v South East | 0.0 | 0.0 | 0.0 | 0.0 |
| Region: London v South East | 0.1 | 0.1 | 0.0 | 0.0 |
| Region: North East v South East | 0.0 | 0.0 | 0.0 | 0.0 |
| Region: North West v South East | 0.0 | 0.0 | 0.0 | 0.0 |
| Region: South West v South East | 0.0 | 0.0 | 0.0 | -0.1 |
| Region: West Midlands v South East | -0.1 | -0.1 | -0.1 | -0.1 |
| Region: Yorkshire and the Humber v South East | 0.0 | 0.0 | -0.1 | -0.1 |
Probability of grade A and above
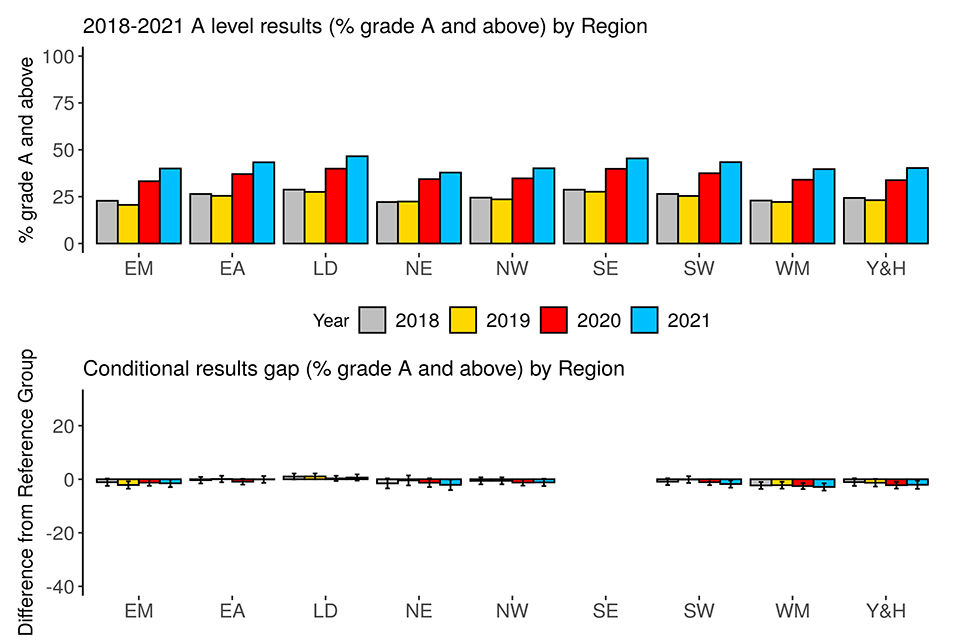
Figures 5.1 to 5.2 show breakdowns of 2018-to-2021 A level results (on the probability-of-grade-A-and-above measure) by centre type and region, and the modelled conditional results gaps between the groups defined under each of those variables and their respective reference group. Table 9 presents the additional models’ results gap estimates for 2018 to 2021.
From the top graphs, all groups see an increase in outcomes in 2021 compared to both 2020 and 2019.
From the bottom graphs as well as Table 9, using the multi-step method described above, we found:
- all 8 regional comparisons showed no notable change from 2020 to 2021
- 3 of the 9 centre type comparisons (between academies and free schools, secondary comprehensives, secondary modern schools) showed no notable change from 2020 to 2021
- 6 of the 8 regional comparisons showed no notable change from 2019 to 2021
- 3 of the 9 centre type comparisons (between academies and free schools, secondary comprehensives, further education establishments) showed no notable change from 2019 to 2021
The notable 2020-to-2021 changes in relation to centre type are:
- the gaps indicating higher outcomes in 2020 of candidates in independent schools and ‘other’ centre types relative to prior-attainment-matched candidates in academies have widened by 4.58 and 3.96 percentage points in 2021
- the gaps indicating lower outcomes in 2020 of candidates in sixth form and tertiary colleges and further education establishments relative to prior-attainment-matched candidates in academies have widened by 2.47, 2.93 and 2.99 percentage points respectively in 2021
- the gap indicating lower outcomes in 2020 of candidates in secondary selective schools relative to prior-attainment-matched candidates in academies has narrowed by 1.22 percentage points in 2021
The notable 2019-to-2021 changes in relation to centre type are:
- the gaps indicating higher outcomes of candidates in independent schools and ‘other’ centre types relative to prior-attainment-matched candidates in academies have widened by 5.14 and 6.62 percentage points respectively
- the gaps indicating lower outcomes of candidates in sixth form and tertiary colleges relative to prior-attainment-matched candidates in academies have widened by 4.61 and 4.69 percentage points respectively
- the gap between secondary comprehensive schools and academies has shifted from negative to positive, indicating that in 2021, candidates in secondary comprehensive schools had higher outcomes than prior-attainment-matched candidates in academies, while in 2019, the direction of the difference reversed. The shift represents a change of 1.67 percentage points
- the gap between secondary selective schools and academies has shifted from positive to negative, indicating that in 2019, candidates in secondary selective schools had higher outcomes than prior-attainment-matched candidates in academies, but in 2021, the direction of the difference reversed. The shift represents a change of 3.98 percentage points
The notable 2019-to-2021 changes in relation to region are:
- the gaps indicating lower outcomes of candidates in centres in the North East and the South West relative to prior-attainment-matched candidates in centres in the South East have widened by 1.65 and 1.67 percentage points respectively
Figure 5.1 2018 to 2021 A level results (probability of grade A and above) and modelled conditional results gaps by centre type controlled for region, prior attainment and subject

Figure 5.2 2018 to 2021 A level results (probability of grade A and above) and modelled conditional results gaps by region controlled for centre type, prior attainment and subject
| Comparison | 2018 | 2019 | 2020 | 2021 |
|---|---|---|---|---|
| Centre Type: Free v Acad | 1% | 2% | 0% | -1% |
| Centre Type: FurE v Acad | -5% | -6% | -3% | -6% |
| Centre Type: Indp v Acad | 9% | 10% | 10% | 15% |
| Centre Type: Other v Acad | -2% | 1% | 3% | 7% |
| Centre Type: SecComp v Acad | -1% | -1% | 0% | 0% |
| Centre Type: SecMod v Acad | -3% | -1% | 0% | -1% |
| Centre Type: SecSel v Acad | 3% | 3% | -2% | -1% |
| Centre Type: Sixth v Acad | -2% | -1% | -3% | -6% |
| Centre Type: Tert v Acad | 0% | -2% | -4% | -7% |
| Region: East Midlands v South East | -1% | -2% | -1% | -2% |
| Region: East of England v South East | 0% | 0% | -1% | 0% |
| Region: London v South East | 1% | 1% | 0% | 1% |
| Region: North East v South East | -2% | 0% | -1% | -2% |
| Region: North West v South East | -1% | -1% | -1% | -1% |
| Region: South West v South East | -1% | 0% | -1% | -2% |
| Region: West Midlands v South East | -2% | -2% | -3% | -3% |
| Region: Yorkshire and the Humber v South East | -1% | -1% | -2% | -2% |
Probability of grade C and above
Figures 6.1 to 6.2 show breakdowns of 2018 to 2021 A level results (on the probability-of-grade-C-and-above measure) by centre type and region, and the modelled conditional results gaps between the groups defined under each of those variables and their respective reference group. Table 10 presents the additional models’ results gap estimates for 2018 to 2021.
From the top graphs, all groups see little change in outcomes compared to 2020, and an increase compared to 2019.
From the bottom graphs as well as Table 10, using the multi-step method described above, we found:
- all 8 regional comparisons showed no notable change from 2020 to 2021
- 8 of the 9 centre type comparisons (between academies and free schools, further education establishments, independent schools, secondary comprehensives, secondary modern schools, secondary selective schools, sixth form colleges, ‘other’ centre types) showed no notable change from 2020 to 2021
- 7 of the 8 regional comparisons showed no notable change from 2019 to 2021
- one of the 9 centre type comparisons (between academies and free schools) showed no notable change from 2019 to 2021
The only notable 2020-to-2021 change in relation to centre type is:
- The gap indicating lower outcomes in 2020 of candidates in tertiary colleges relative to prior-attainment-matched candidates in academies have widened by 1.53 percentage points in 2021 The only notable 2019-to-2021 change in relation to region is:
- the gap indicating higher outcomes of candidates in centres in London relative to prior-attainment-matched candidates in centres in the South East has narrowed by 1.07 percentage points
The notable 2019-to-2021 changes in relation to centre type are:
- the gaps indicating lower outcomes of candidates in sixth form and tertiary colleges relative to prior-attainment-matched candidates in academies have widened by 1.46 and 2.97 percentage points
- the gaps indicating lower outcomes of candidates in secondary comprehensive schools, secondary modern schools and further education establishments relative to prior-attainment-matched candidates in academies have narrowed by 1.55, 6.07 and 3.46 percentage points respectively
- the gap indicating higher outcomes of candidates in independent schools relative to prior-attainment-matched candidates in academies has narrowed by 1.98 percentage points
- the gap between ‘other’ centre types and academies has shifted from negative to positive, indicating that in 2021, candidates in other centre types had higher outcomes than prior-attainment-matched candidates in academies, while in 2019, the direction of the difference reversed. The shift represents a change of 5.64 percentage points.
- the gap between secondary selective schools and academies has shifted from positive to negative, indicating that in 2019, candidates in secondary selective schools had higher outcomes than prior-attainment-matched candidates in academies, but in 2021, the direction of the difference reversed. The shift represents a change of 3.85 percentage points.
Figure 6.1 2018 to 2021 A level results (probability of grade C and above) and modelled conditional results gaps by centre type controlled for region, prior attainment and subject
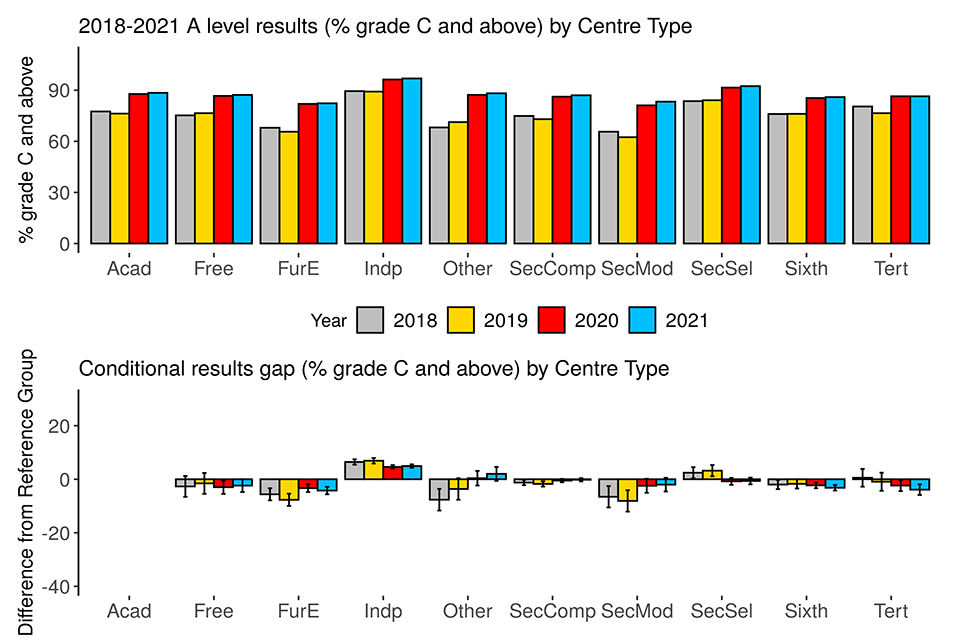
Figure 6.2 2018 to 2021 A level results (probability of grade C and above) and modelled conditional results gaps by region controlled for centre type, prior attainment and subject
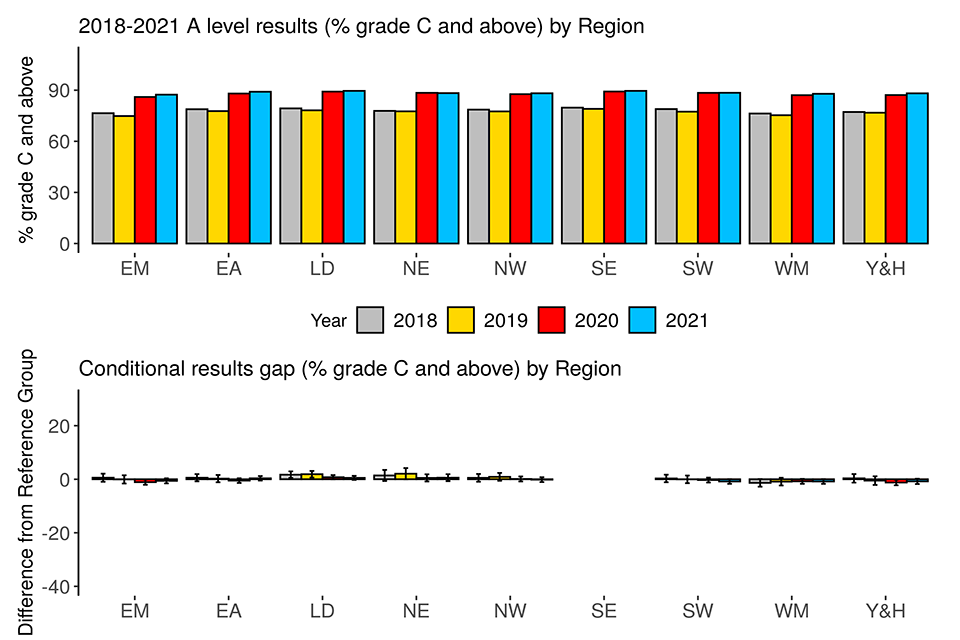
Table 10. Summary of modelled results gaps in 2018 to 2021 A level results (probability of grade C and above) from additional model on centre type and region
| Comparison | 2018 | 2019 | 2020 | 2021 |
|---|---|---|---|---|
| Centre Type: Free v Acad | -3% | -2% | -3% | -2% |
| Centre Type: FurE v Acad | -6% | -8% | -3% | -4% |
| Centre Type: Indp v Acad | 6% | 7% | 5% | 5% |
| Centre Type: Other v Acad | -8% | -4% | 0% | 2% |
| Centre Type: SecComp v Acad | -1% | -2% | 0% | 0% |
| Centre Type: SecMod v Acad | -7% | -8% | -2% | -2% |
| Centre Type: SecSel v Acad | 2% | 3% | -1% | -1% |
| Centre Type: Sixth v Acad | -2% | -2% | -2% | -3% |
| Centre Type: Tert v Acad | 1% | -1% | -2% | -4% |
| Region: East Midlands v South East | 1% | 0% | -1% | -1% |
| Region: East of England v South East | 1% | 0% | -1% | 0% |
| Region: London v South East | 2% | 2% | 1% | 1% |
| Region: North East v South East | 1% | 2% | 0% | 1% |
| Region: North West v South East | 1% | 1% | 0% | 0% |
| Region: South West v South East | 0% | 0% | 0% | -1% |
| Region: West Midlands v South East | -1% | -1% | -1% | -1% |
| Region: Yorkshire and the Humber v South East | 0% | -1% | -1% | -1% |
Additional model 2 (minor grouping of ethnicity, prior attainment, subject)
A second additional set of models were run to examine results gaps by minor grouping of ethnicity, conditional on prior attainment and subject, which are presented in this section. The prior attainment effects and the α coefficients produced by these models are similar to those produced by the main models and therefore not repeated here.
Mean numeric grade
Figure 7 shows a breakdown of 2018 to 2021 A level results (on the numeric grade measure) by narrow grouping of ethnicity, and the modelled conditional results gaps between the groups defined under the variable and the reference group. Table 11 presents the additional models’ results gap estimates for 2018 to 2021.
From the top graphs, all groups see an increase in outcomes in 2021 compared to 2020 as well as 2019.
From the bottom graphs as well as Table 11, using the multi-step method described above, we found:
- all 16 between-group comparisons showed no notable change from 2020 to 2021
- all 16 between-group comparisons showed no notable change from 2019 to 2021
Figure 7. 2018-2021 A level results (numeric grade) and modelled conditional results gaps by ethnicity (minor grouping) controlled for prior attainment and subject
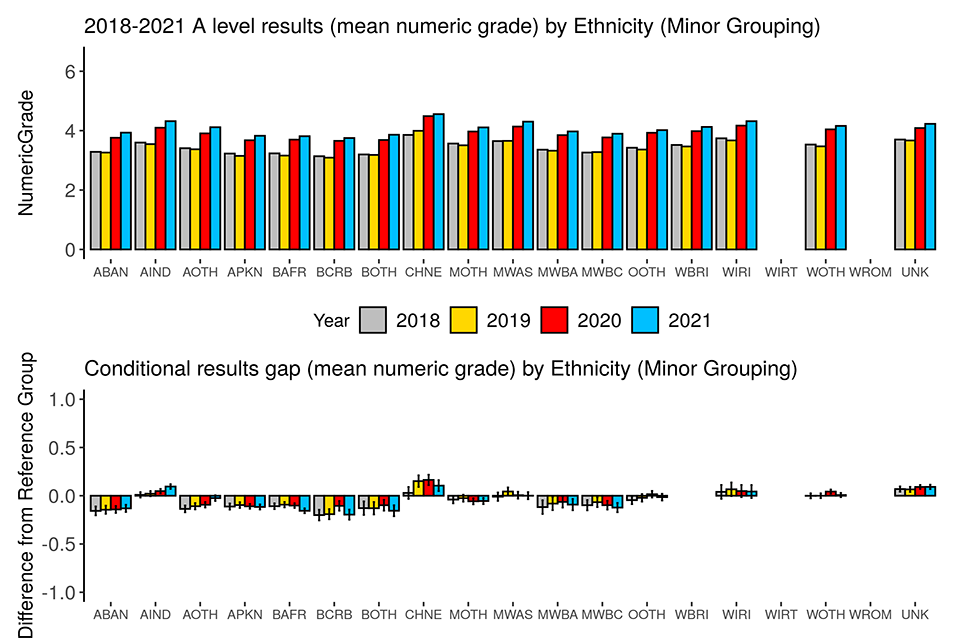
Note: Results for the very small groups WIRT and WROM withheld out of concern for disclosure.
Table 11. Summary of modelled results gaps in 2018 to 2021 A level results (mean numeric grade) from additional model on narrow grouping of ethnicity
| Comparison | 2018 | 2019 | 2020 | 2021 |
|---|---|---|---|---|
| Ethnicity: ABAN v WBRI | -0.2 | -0.1 | -0.1 | -0.1 |
| Ethnicity: AIND v WBRI | 0.0 | 0.0 | 0.0 | 0.1 |
| Ethnicity: AOTH v WBRI | -0.1 | -0.1 | -0.1 | 0.0 |
| Ethnicity: APKN v WBRI | -0.1 | -0.1 | -0.1 | -0.1 |
| Ethnicity: BAFR v WBRI | -0.1 | -0.1 | -0.1 | -0.2 |
| Ethnicity: BCRB v WBRI | -0.2 | -0.2 | -0.1 | -0.2 |
| Ethnicity: BOTH v WBRI | -0.1 | -0.1 | -0.1 | -0.2 |
| Ethnicity: CHNE v WBRI | 0.0 | 0.2 | 0.2 | 0.1 |
| Ethnicity: MOTH v WBRI | 0.0 | 0.0 | -0.1 | -0.1 |
| Ethnicity: MWAS v WBRI | 0.0 | 0.0 | 0.0 | 0.0 |
| Ethnicity: MWBA v WBRI | -0.1 | -0.1 | -0.1 | -0.1 |
| Ethnicity: MWBC v WBRI | -0.1 | -0.1 | -0.1 | -0.1 |
| Ethnicity: OOTH v WBRI | 0.0 | 0.0 | 0.0 | 0.0 |
| Ethnicity: WIRI v WBRI | 0.0 | 0.1 | 0.0 | 0.0 |
| Ethnicity: WIRT v WBRI | * | * | * | * |
| Ethnicity: WOTH v WBRI | 0.0 | 0.0 | 0.0 | 0.0 |
| Ethnicity: WROM v WBRI | * | * | * | * |
| Ethnicity: Unknown v WBRI | 0.1 | 0.1 | 0.1 | 0.1 |
Note: * Results withheld out of concern for disclosure. Rerun of the models without the 2 small groups did not change estimates for the other groups.
Probability of grade A and above
Figure 8 shows a breakdown of 2018 to 2021 A level results (on the probability-of-grade-A-and-above measure) by narrow grouping of ethnicity, and the modelled conditional results gaps between the groups defined under the variable and the reference group. Table 12 presents the additional models’ results gap estimates for 2018 to 2021.
From the top graph, all groups see an increase in outcomes in 2021 compared to both 2020 and 2019.
From the bottom graphs as well as Table 12, using the multi-step method described above, we found:
- 9 of the 16 between-group comparisons (between White British and Asian Bangladeshi, Asian Pakistani, Black Other, Mixed Other, Mixed White and Asian, Mixed White and Black African, Any Other Ethnic Group, White Irish, and ‘unknown ethnicity’) showed no notable change from 2020 to 2021
- a slightly different set of 9 of the 16 between-group comparisons (between White British and Asian Bangladeshi, Asian Pakistani, Black Other, Chinese, Mixed White and Asian, Mixed White and Black African, White Irish, White Other and ‘unknown ethnicity’) showed no notable change from 2019 to 2021
The notable 2020-to-2021 changes in relation to minor grouping of ethnicity are:
- the gaps indicating lower outcomes in 2020 of Black African, Black Caribbean, Mixed White and Black Caribbean candidates relative to prior-attainment-matched White British candidates, have widened by between 1.85 and 2.97 percentage points in 2021
- the gap indicating lower outcomes in 2020 of Asian Other candidates relative to prior-attainment-matched White British candidates, has narrowed by 2.22 percentage points in 2021
- the gap indicating higher outcomes in 2020 of Asian Indian candidates relative to prior-attainment-matched White British candidates, has widened by 1.67 percentage points in 2021
- the gap indicating higher outcomes in 2020 of Chinese and White Other candidates relative to prior-attainment-matched White British candidates, has narrowed by 2.74 and 1.02 percentage points respectively in 2021
The notable 2019-to-2021 changes in relation to minor grouping of ethnicity are:
- the longstanding gaps indicating lower outcomes of Black African, Black Caribbean, Mixed White and Black Caribbean, and Mixed Other candidates relative to prior-attainment-matched White British candidates have widened by between 1.88 and 2.04 percentage points
- the gaps indicating lower outcomes of Asian Other and Any Other Ethnic Group candidates relative to prior-attainment-matched White British candidates has narrowed by 2.74 percentage points
- the gap between Asian Indian and White British candidates has shifted from negative to positive, indicating that in 2021, Asian Indian candidates had higher outcomes than prior-attainment-matched White British candidates, while in 2019, the direction of the difference reversed. The shift represents a change of 2.85 percentage points
Figure 8 2018 to 2021 A level results (probability of grade A and above) and modelled conditional results gaps by ethnicity (minor grouping) controlled for prior attainment and subject
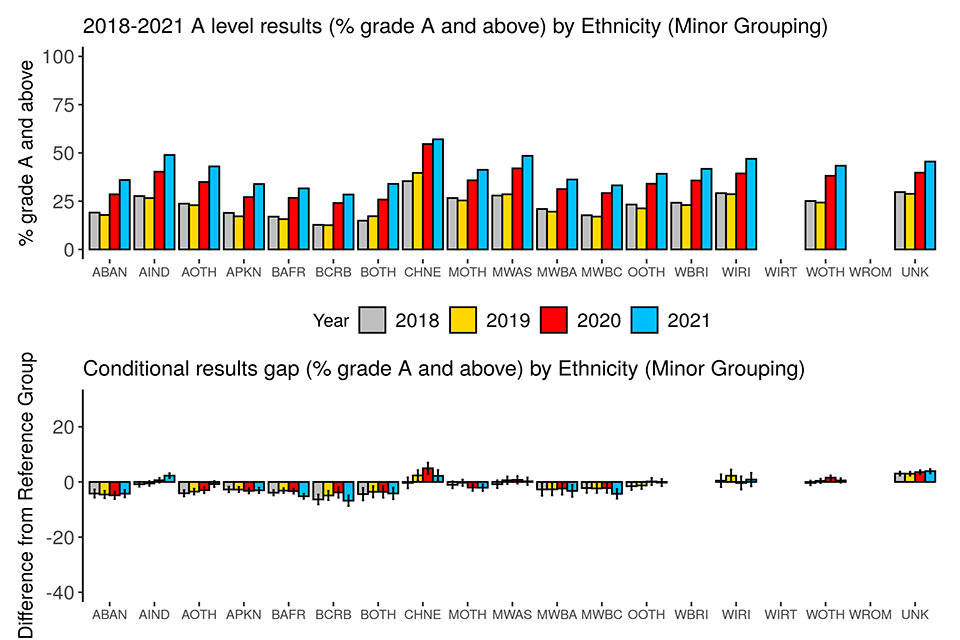
Note: Results for the very small groups WIRT and WROM withheld out of concern for disclosure.
Table 12. Summary of modelled results gaps in 2018 to 2021 A level results (% grade A and above) from additional model on narrow grouping of ethnicity
| Comparison | 2018 | 2019 | 2020 | 2021 |
|---|---|---|---|---|
| Ethnicity: ABAN v WBRI | -4% | -5% | -5% | -4% |
| Ethnicity: AIND v WBRI | -1% | -1% | 1% | 2% |
| Ethnicity: AOTH v WBRI | -4% | -4% | -3% | -1% |
| Ethnicity: APKN v WBRI | -3% | -3% | -3% | -3% |
| Ethnicity: BAFR v WBRI | -4% | -3% | -3% | -5% |
| Ethnicity: BCRB v WBRI | -6% | -5% | -4% | -7% |
| Ethnicity: BOTH v WBRI | -4% | -4% | -4% | -4% |
| Ethnicity: CHNE v WBRI | 0% | 2% | 5% | 2% |
| Ethnicity: MOTH v WBRI | -1% | 0% | -2% | -2% |
| Ethnicity: MWAS v WBRI | -1% | 1% | 1% | 0% |
| Ethnicity: MWBA v WBRI | -3% | -3% | -2% | -3% |
| Ethnicity: MWBC v WBRI | -2% | -2% | -2% | -4% |
| Ethnicity: OOTH v WBRI | -2% | -1% | 0% | 0% |
| Ethnicity: WIRI v WBRI | 0% | 2% | 0% | 1% |
| Ethnicity: WIRT v WBRI | * | * | * | * |
| Ethnicity: WOTH v WBRI | 0% | 0% | 2% | 1% |
| Ethnicity: WROM v WBRI | * | * | * | * |
| Ethnicity: Unknown v WBRI | 3% | 3% | 4% | 4% |
Note: * Results withheld out of concern for disclosure. Rerun of the models without the 2 small groups did not change estimates for the other groups.
Probability of grade C and above
Figure 9 shows a breakdown of 2018 to 2021 A level results (on the probability-of-grade-C-and-above measure) by narrow grouping of ethnicity, and the modelled conditional results gaps between the groups defined under the variable and the reference group. Table 13 presents the additional models’ results gap estimates for 2018 to 2021.
From the top graph, all groups see little change in outcomes in 2021 compared to 2020, and an increase in outcomes compared to 2019.
From the bottom graphs as well as Table 13, using the multi-step method described above, we found:
- all 16 between-group comparisons showed no notable change from 2020 to 2021
- 13 of the 16 between-group comparisons (between White British and Asian Bangladeshi, Asian Pakistani, Black African, Black Other, Chinese, Mixed Other, Mixed White and Asian, Mixed White and Black African, Mixed White and Black Caribbean, White Irish, White Other, Any Other Ethnic Group, ‘unknown ethnicity’) showed no notable change from 2019 to 2021
The notable 2019-to-2021 changes in relation to minor grouping of ethnicity are:
- the longstanding gaps indicating lower outcomes of Black Caribbean and Asian Other candidates relative to prior-attainment-matched White British candidates have narrowed by 1.92 and 1.16 percentage points respectively
- the gap indicating higher outcomes of Asian Indian candidates relative to prior-attainment-matched White British candidates has widened by 1.2 percentage points
Figure 9 2018 to 2021 A level results (probability of grade C and above) and modelled conditional results gaps by ethnicity (minor grouping) controlled for prior attainment and subject
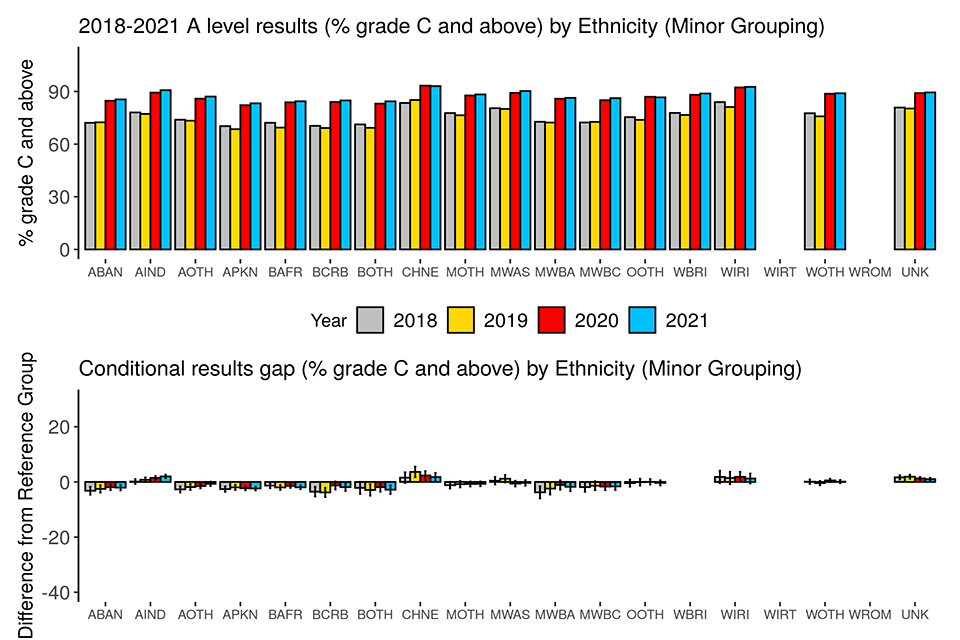
Note: Results for the very small groups WIRT and WROM withheld out of concern for disclosure.
Table 13. Summary of modelled results gaps in 2018 to 2021 A level results (% grade C and above) from additional model on narrow grouping of ethnicity
| Comparison | 2018 | 2019 | 2020 | 2021 |
|---|---|---|---|---|
| Ethnicity: ABAN v WBRI | -3% | -3% | -2% | -2% |
| Ethnicity: AIND v WBRI | 0% | 1% | 1% | 2% |
| Ethnicity: AOTH v WBRI | -3% | -2% | -1% | -1% |
| Ethnicity: APKN v WBRI | -3% | -2% | -2% | -2% |
| Ethnicity: BAFR v WBRI | -1% | -2% | -1% | -2% |
| Ethnicity: BCRB v WBRI | -4% | -4% | -1% | -2% |
| Ethnicity: BOTH v WBRI | -2% | -3% | -2% | -3% |
| Ethnicity: CHNE v WBRI | 2% | 4% | 2% | 2% |
| Ethnicity: MOTH v WBRI | -1% | -1% | -1% | -1% |
| Ethnicity: MWAS v WBRI | 0% | 1% | -1% | 0% |
| Ethnicity: MWBA v WBRI | -4% | -2% | -1% | -2% |
| Ethnicity: MWBC v WBRI | -2% | -1% | -2% | -2% |
| Ethnicity: OOTH v WBRI | 0% | 0% | 0% | 0% |
| Ethnicity: WIRI v WBRI | 2% | 1% | 2% | 1% |
| Ethnicity: WIRT v WBRI | * | * | * | * |
| Ethnicity: WOTH v WBRI | 0% | 0% | 1% | 0% |
| Ethnicity: WROM v WBRI | * | * | * | * |
| Ethnicity: Unknown v WBRI | 2% | 2% | 1% | 1% |
Note: * Results withheld out of concern for disclosure. Rerun of the models without the 2 small groups did not change estimates for the other groups.
To sum up for A level, we found that, of the many between-group comparisons examined in our modelling, the majority showed no notable change from 2020 to 2021 or from 2019 to 2021. Between 2020 and 2021, only candidates in tertiary colleges showed notable changes on all 3performance measures. Some groups showed notable changes from 2019 to 2021 on all 3 performance measures. Male candidates, SEND candidates, candidates in secondary selective schools, sixth form and tertiary colleges, have seen, from 2019 to 2021, a decrease in outcomes relative to prior-attainment-matched candidates of their respective reference group. Candidates in ‘other’ centre types, have seen, in the same period, an increase in outcomes relative to prior-attainment-matched candidates in academies. Candidates in independent schools have seen, from 2019 to 2021, an increase in outcomes on the numeric grade and grade-A-and-above measures, but a decrease on the grade-C-and-above measure, relative to prior-attainment-matched candidates in academies.
GCSE
For GCSE, all breakdowns of results were based on all data in the GCSE equalities dataset. To ensure that all models would converge in a reasonable amount of time, we carried out all modelling for GCSE on a random selection of one-sixth of the data in the GCSE equalities dataset.
Main model (gender, ethnicity, major language, SEND, FSM eligibility, deprivation, prior attainment, subject)
Mean numeric grade
Figures 10.1-10.7 show breakdowns of 2018-2021 GCSE results (on the numeric grade measure) by the variables included in the main model, and the modelled conditional results gaps between the groups defined under each of those variables and their respective reference group. Table 14 presents the main models’ results gap estimates for 2018 to 2021.
From the top graphs, all groups see an increase in their mean grade in 2021 compared to 2020 as well as 2019.
The top row of Table 14 shows the grade awarded to an ‘average’ entry in 2018 to 2021. The 2020-to-2021 increase of 0.08 grade is not notable, but the 2019-to-2021 increase of 0.45 grade is.
From the bottom graphs as well as Table 14, using the multi-step method described above, we found:
- 21 of the 22 between-group comparisons (including those on gender, ethnicity, language, SEND, deprivation, prior attainment) showed no notable change from 2020 to 2021
- 19 of the 22 between-group comparisons (including those on gender, ethnicity, SEND, deprivation, prior attainment) showed no notable change from 2019 to 2021
The notable 2020-to-2021 change is:
- the gap indicating higher outcomes of candidates with unknown FSM status relative to prior-attainment-matched non-FSM candidates has narrowed slightly by 0.15 grade
The notable 2019-to-2021 changes are:
- the longstanding gap indicating lower outcomes of FSM candidates relative to prior-attainment-matched non-FSM candidates has widened slightly by 0.12 grade
- the gap indicating higher outcomes of candidates with unknown FSM status relative to prior-attainment-matched non-FSM candidates has widened by 0.48 grade
- the gap between candidates with unknown major language and candidates with English as major language have shifted from positive to negative, indicating that in 2019, candidates with unknown major language had higher outcomes than prior-attainment-matched candidates with English as major language, but in 2021, the director of the difference reversed. The shift represents a small change of 0.16 grade
Figure 10.1. 2018-2021 GCSE results (numeric grade) and modelled conditional results gaps by gender
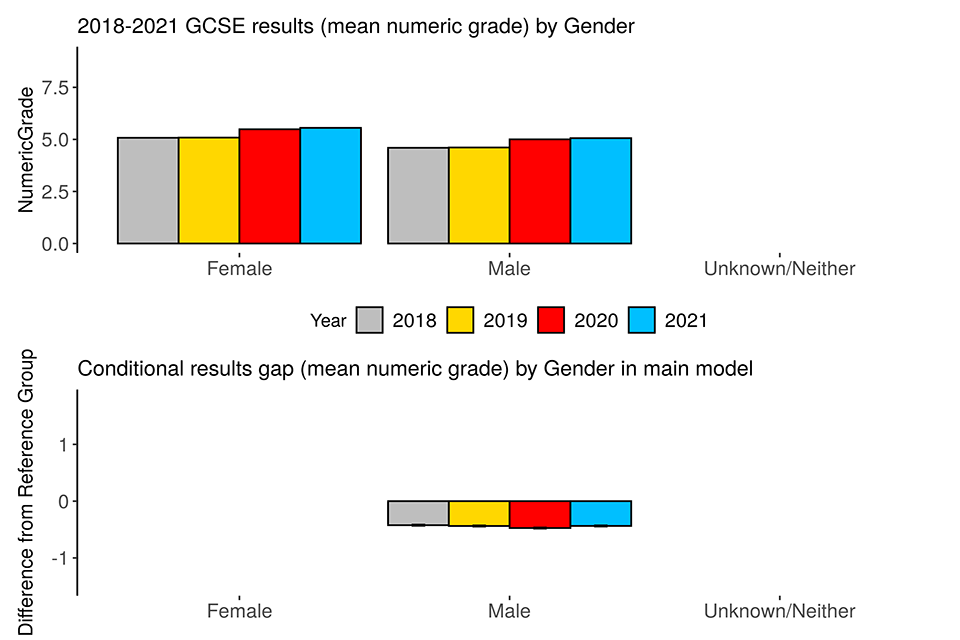
The unknown/neither group’s result is not presented out of concern for disclosure, and it was not included in the modelling because of its extremely small size.
Figure 10.2. 2018-2021 GCSE results (numeric grade) and modelled conditional results gaps by ethnicity
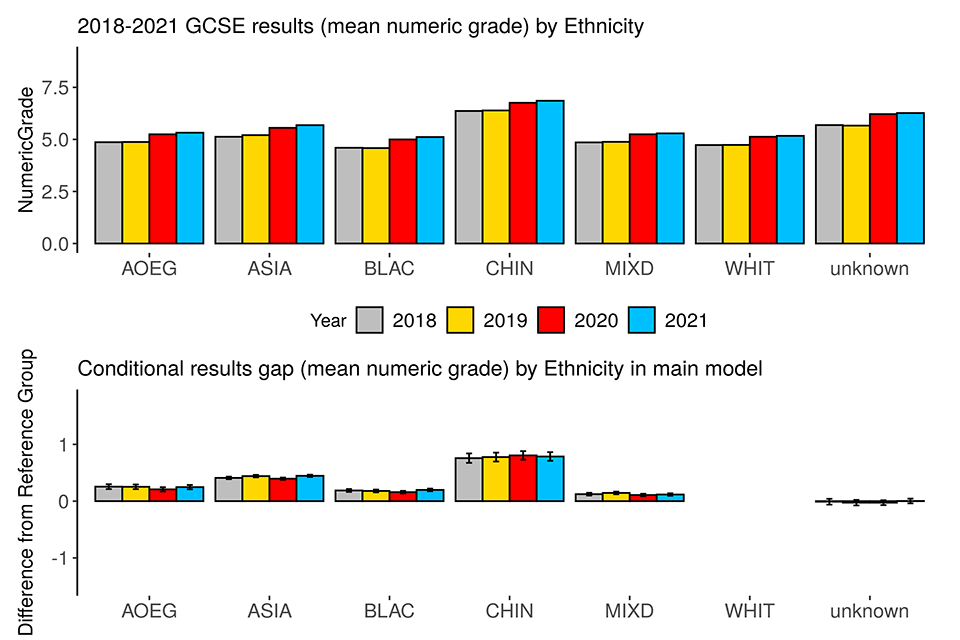
Figure 10.3. 2018-2021 GCSE results (numeric grade) and modelled conditional results gaps by major language
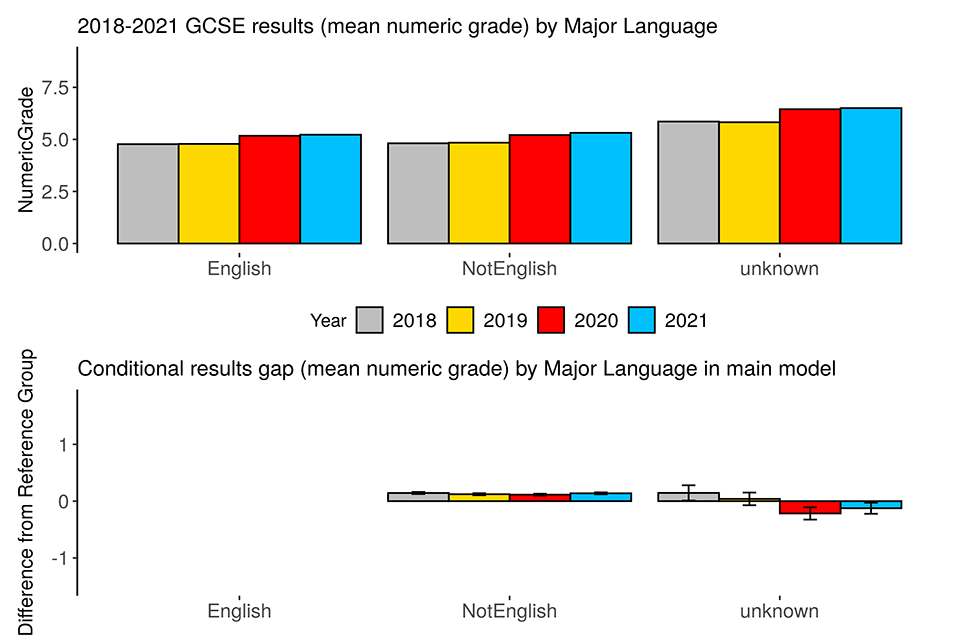
Figure 10.4. 2018-2021 GCSE results (numeric grade) and modelled conditional results gaps by SEND status
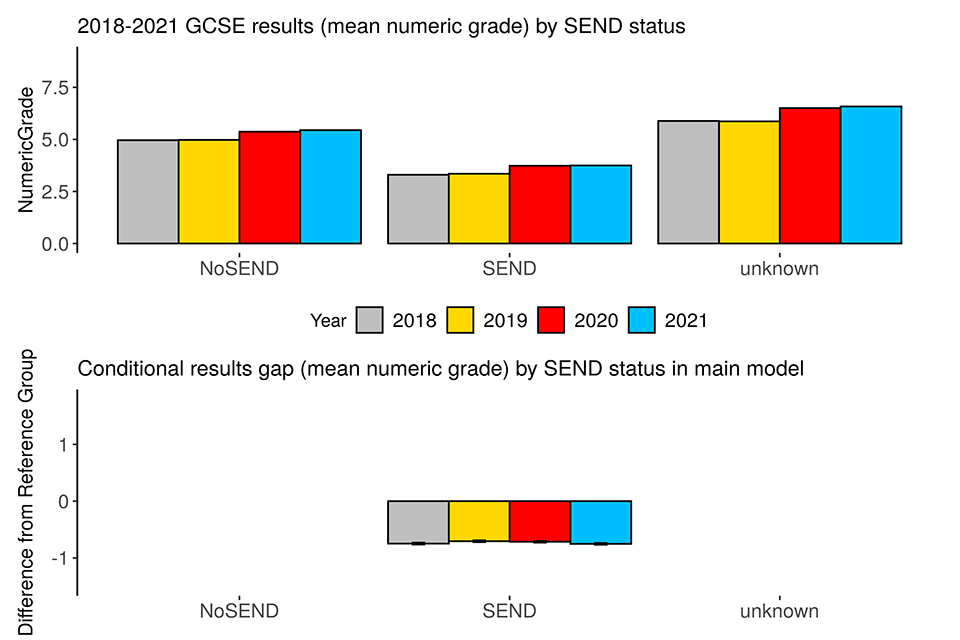
There was no conditional results gap estimate for the unknown SEND status group because of perfect collinearity between unknown SEND and unknown FSM.
Figure 10.5. 2018-2021 GCSE results (numeric grade) and modelled conditional results gaps by FSM eligibility

Figure 10.6. 2018-2021 GCSE results (numeric grade) and modelled conditional results gaps by deprivation
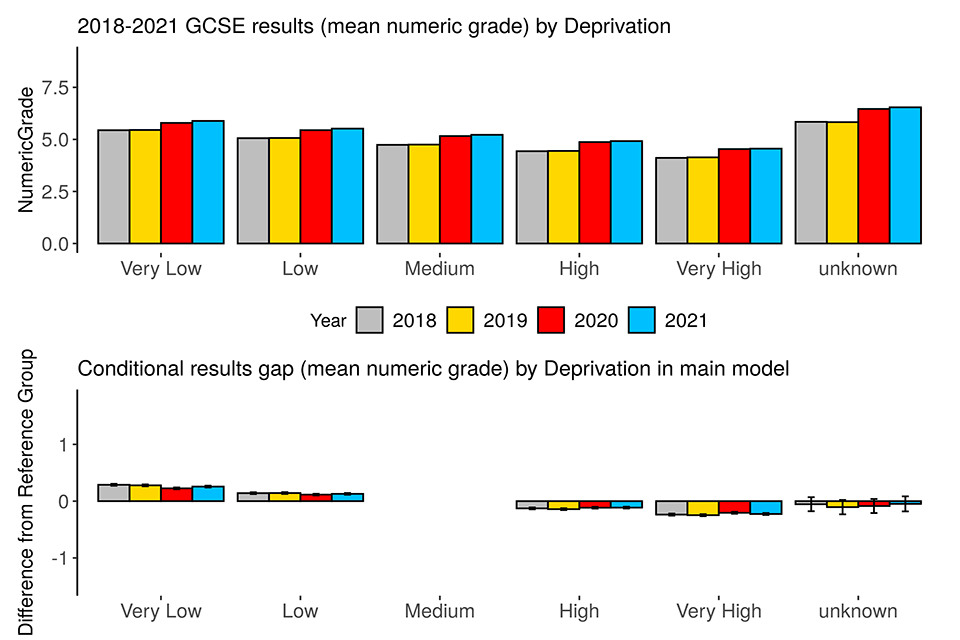
Figure 10.7. 2018-2021 GCSE results (numeric grade) and modelled conditional results gaps by prior attainment
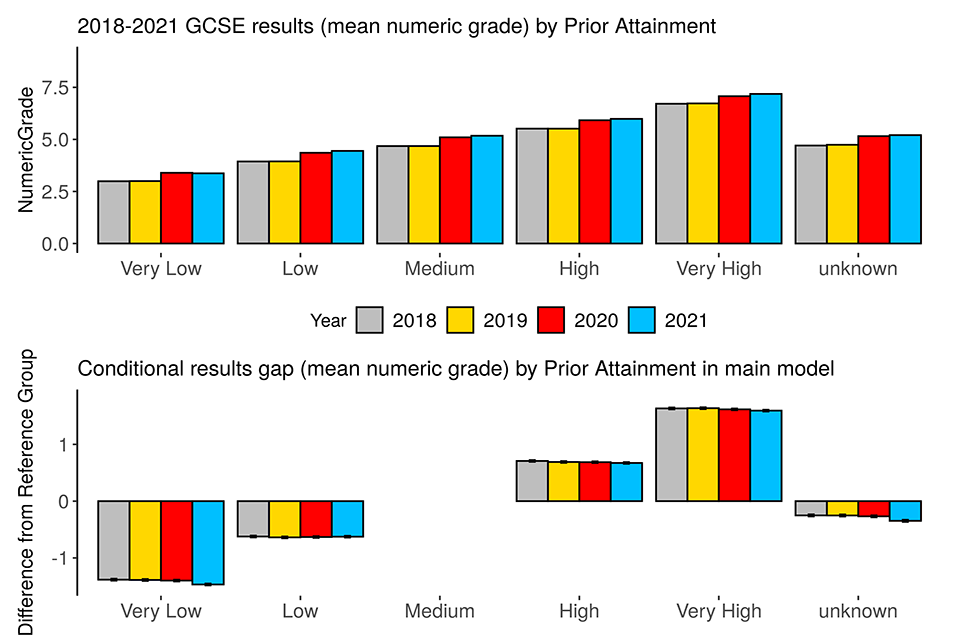
Table 14. Summary of modelled results gaps in 2018-2021 GCSE results (mean numeric grade)
| Comparison | 2018 | 2019 | 2020 | 2021 |
|---|---|---|---|---|
| Average entry | 5.0 | 5.0 | 5.4 | 5.4 |
| Ethnicity: AOEG v WHIT | 0.3 | 0.3 | 0.2 | 0.2 |
| Ethnicity: ASIA v WHIT | 0.4 | 0.4 | 0.4 | 0.4 |
| Ethnicity: BLAC v WHIT | 0.2 | 0.2 | 0.2 | 0.2 |
| Ethnicity: CHIN v WHIT | 0.8 | 0.8 | 0.8 | 0.8 |
| Ethnicity: MIXD v WHIT | 0.1 | 0.1 | 0.1 | 0.1 |
| Ethnicity: Unknown v WHIT | 0.0 | 0.0 | 0.0 | 0.0 |
| FSM: FSM v NotFSM | -0.4 | -0.4 | -0.4 | -0.5 |
| FSM: Unknown v NotFSM | 0.0 | 0.1 | 0.8 | 0.6 |
| Gender: Male v Female | -0.4 | -0.4 | -0.5 | -0.4 |
| Deprivation: Very low v Medium | 0.3 | 0.3 | 0.2 | 0.3 |
| Deprivation: Low v Medium | 0.1 | 0.1 | 0.1 | 0.1 |
| Deprivation: High v Medium | -0.1 | -0.1 | -0.1 | -0.1 |
| Deprivation: Very high v Medium | -0.2 | -0.2 | -0.2 | -0.2 |
| Deprivation: Unknown v Medium | -0.1 | -0.1 | -0.1 | 0.0 |
| Major language: NotEnglish v English | 0.1 | 0.1 | 0.1 | 0.1 |
| Major language: Unknown v English | 0.1 | 0.0 | -0.2 | -0.1 |
| Prior attainment: Very low v Medium | -1.4 | -1.4 | -1.4 | -1.5 |
| Prior attainment: Low v Medium | -0.6 | -0.6 | -0.6 | -0.6 |
| Prior attainment: High v Medium | 0.7 | 0.7 | 0.7 | 0.7 |
| Prior attainment: Very high v Medium | 1.6 | 1.6 | 1.6 | 1.6 |
| Prior attainment: Unknown v Medium | -0.3 | -0.3 | -0.3 | -0.3 |
| SEND: SEND v NoSEND | -0.7 | -0.7 | -0.7 | -0.8 |
Probability of grade 7 and above
Figures 11.1-11.7 show breakdowns of 2018-2021 GCSE results (on the probability-of-grade-7-and-above measure) by the variables included in the main model, and the modelled conditional results gaps between the groups defined under each of those variables and their respective reference group. Table 15 presents the main models’ results gap estimates for 2018 to 2021.
From the top graphs, all groups see an increase in outcomes compared to both 2020 and 2019. The top row of Table 15 shows the grade awarded to an ‘average’ entry in 2018 to 2021. The 2020-to-2021 increase of 2.38 percentage points and the 2019-to-2021 increase of 6.98 percentage points are notable.
From the bottom graphs as well as Table 15, using the multi-step method described above, we found:
- 20 of the 22 between-group comparisons (including all those on gender, language, SEND, deprivation) showed no notable change from 2020 to 2021
- 13 of the 22 between-group comparisons (including all those on language and deprivation) showed no notable change from 2019 to 2021
The notable 2020-to-2021 changes are:
- the gap indicating lower outcomes in 2020 of candidates with very low prior attainment relative to candidates with medium prior attainment has narrowed by 1.6 percentage points in 2021, indicating little change in the relationship between prior attainment and results from 2020 to 2021, except for candidates with very low prior attainment
- the gaps indicating underperformance in 2020 of FSM candidates and candidates with an unknown level of deprivation relative to their respective reference group, have widened by 1.05 and 3.18 percentage points respectively in 2021
- the gap indicating higher outcomes in 2020 of Asian candidates relative to White candidates has widened by 1.44 percentage points in 2021
The notable 2019-to-2021 changes are:
- changes on the gaps in relation to prior attainment indicate a stronger relationship between prior attainment and results in 2021 than in 2019
- the longstanding gaps indicating lower outcomes of FSM candidates, SEND candidates and male candidates relative to prior-attainment-matched candidates of their respective reference group, have widened by 2.27, 2.00 and 2.13 percentage points respectively
- the gaps indicating higher outcomes of candidates with unknown FSM eligibility status, and Asian candidates relative to prior-attainment matched candidates of their respective reference group, have widened by 11.42 and 1.33 percentage points respectively
Figure 11.1. 2018-2021 GCSE results (probability of grade 7 and above) and modelled conditional results gaps by gender

The unknown/neither group’s result is not presented out of concern for disclosure, and it was not included in the modelling because of its extremely small size.
Figure 11.2. 2018-2021 GCSE results (probability of grade 7 and above) and modelled conditional results gaps by ethnicity
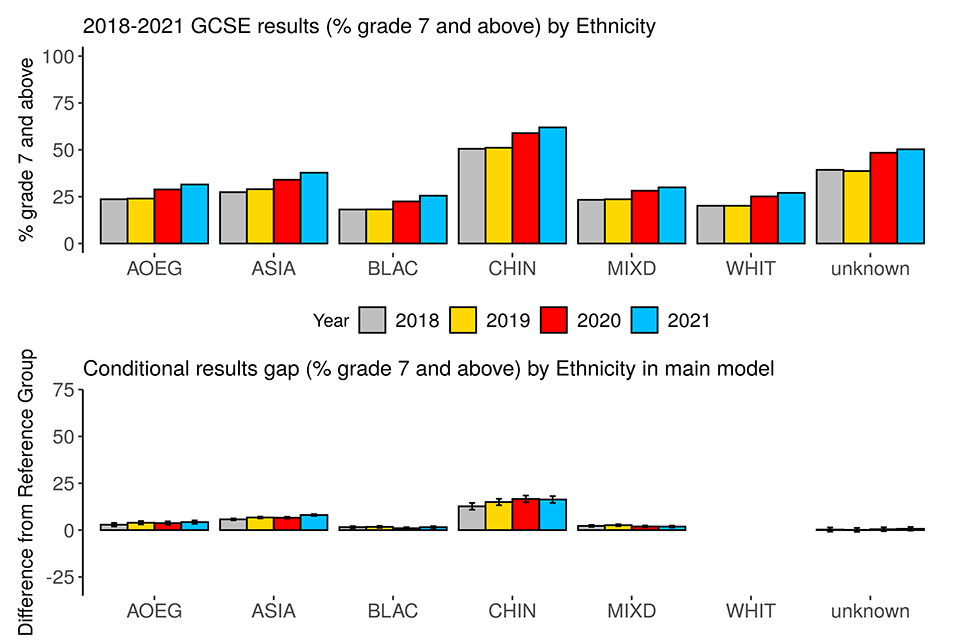
Figure 11.3. 2018-2021 GCSE results (probability of grade 7 and above) and modelled conditional results gaps by major language
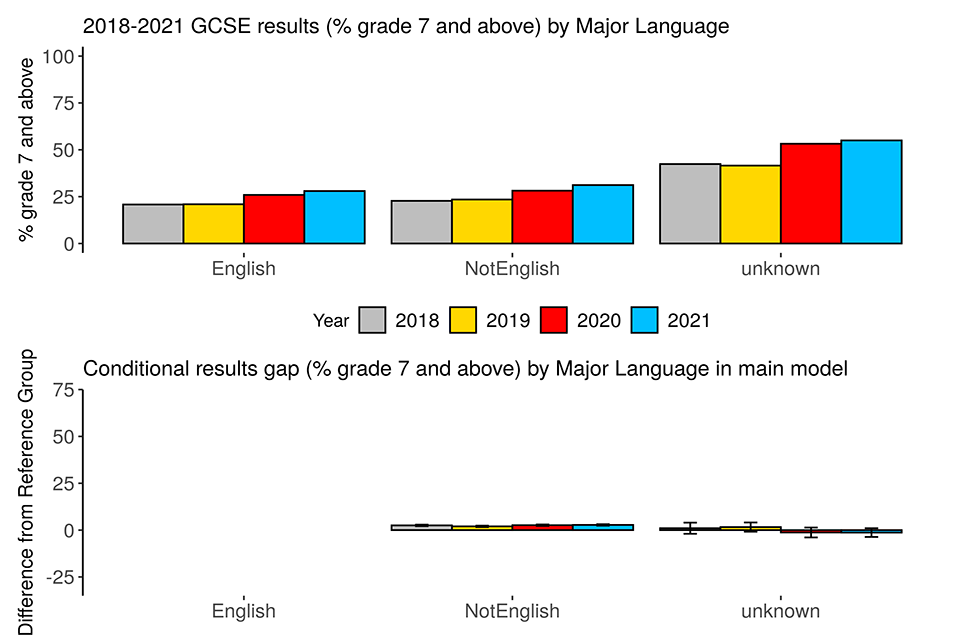
Figure 11.4. 2018-2021 GCSE results (probability of grade 7 and above) and modelled conditional results gaps by SEND status
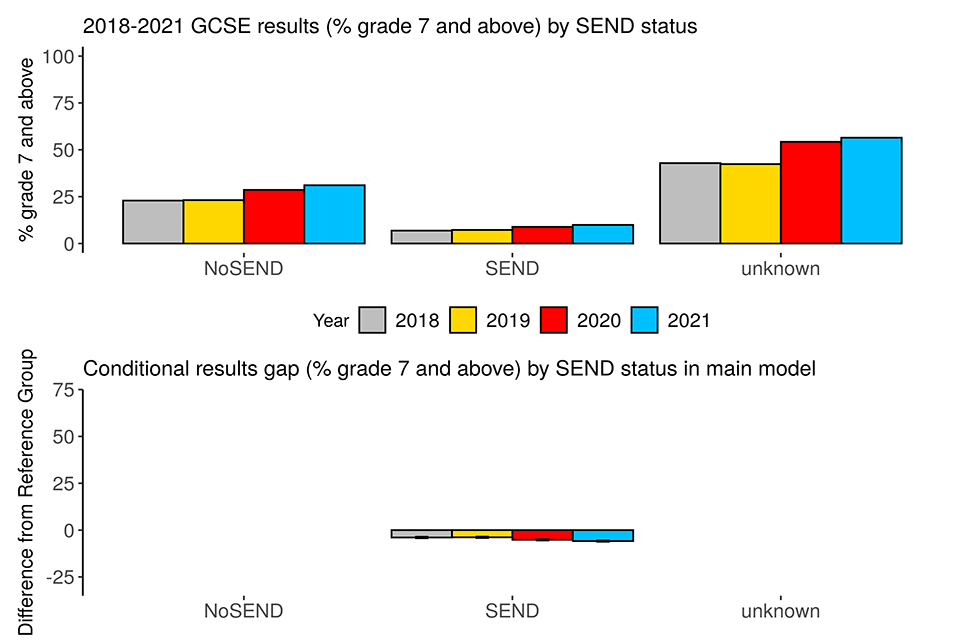
There was no conditional results gap estimate for the unknown SEND status group because of perfect collinearity between unknown SEND and unknown FSM.
Figure 11.5. 2018-2021 GCSE results (probability of grade 7 and above) and modelled conditional results gaps by FSM eligibility
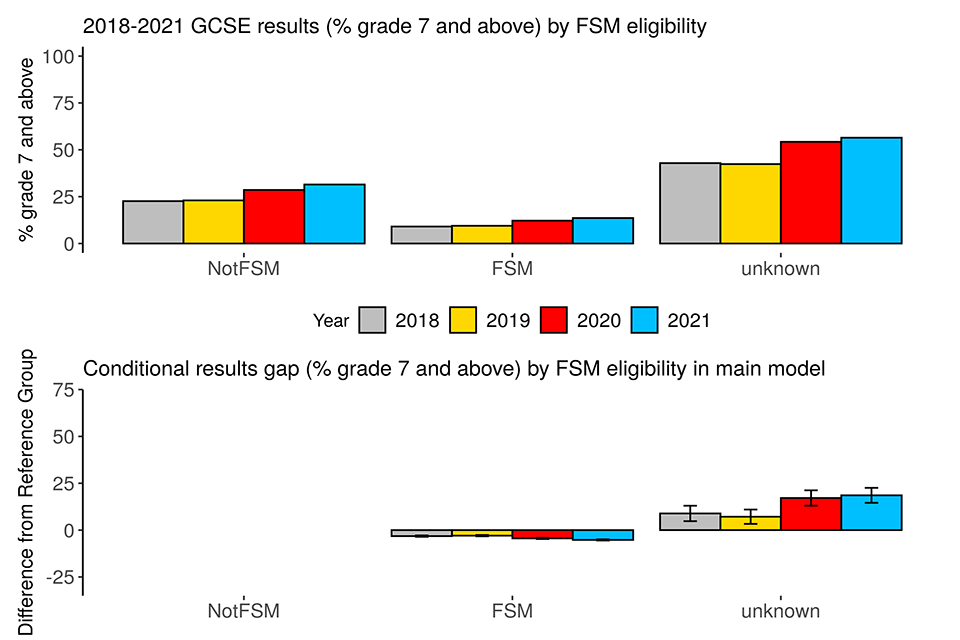
Figure 11.6. 2018-2021 GCSE results (probability of grade 7 and above) and modelled conditional results gaps by deprivation
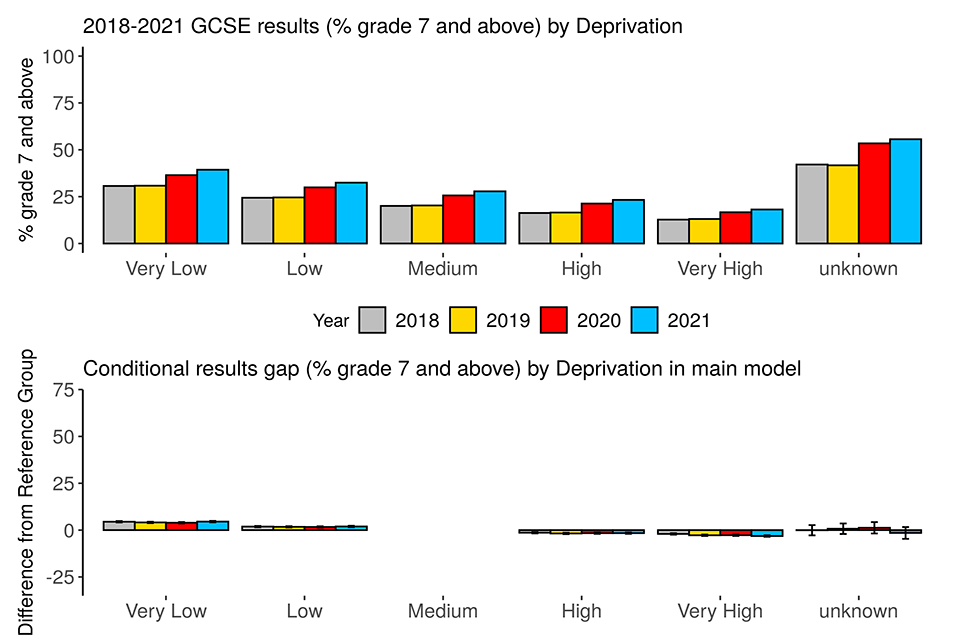
Figure 11.7. 2018-2021 GCSE results (probability of grade 7 and above) and modelled conditional results gaps by prior attainment
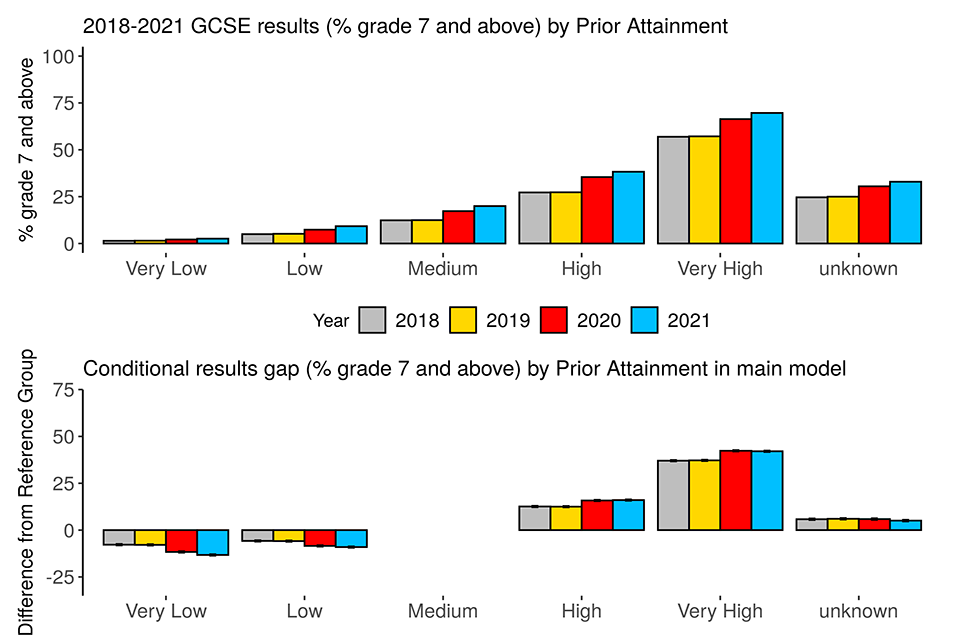
Table 15. Summary of modelled results gaps in 2018-2021 GCSE results (probability of grade 7 and above)
| Comparison | 2018 | 2019 | 2020 | 2021 |
|---|---|---|---|---|
| Average entry | 16% | 17% | 21% | 24% |
| Ethnicity: AOEG v WHIT | 3% | 4% | 4% | 4% |
| Ethnicity: ASIA v WHIT | 6% | 7% | 7% | 8% |
| Ethnicity: BLAC v WHIT | 2% | 2% | 1% | 2% |
| Ethnicity: CHIN v WHIT | 13% | 15% | 17% | 16% |
| Ethnicity: MIXD v WHIT | 2% | 3% | 2% | 2% |
| Ethnicity: Unknown v WHIT | 0% | 0% | 0% | 1% |
| FSM: FSM v NotFSM | -3% | -3% | -4% | -5% |
| FSM: Unknown v NotFSM | 9% | 7% | 17% | 19% |
| Gender: Male v Female | -6% | -6% | -8% | -8% |
| Deprivation: Very low v Medium | 4% | 4% | 4% | 5% |
| Deprivation: Low v Medium | 2% | 2% | 2% | 2% |
| Deprivation: High v Medium | -1% | -2% | -2% | -2% |
| Deprivation: Very high v Medium | -2% | -3% | -3% | -3% |
| Deprivation: Unknown v Medium | 0% | 1% | 1% | -2% |
| Major language: NotEnglish v English | 3% | 2% | 3% | 3% |
| Major language: Unknown v English | 1% | 2% | -1% | -1% |
| Prior attainment: Very low v Medium | -8% | -8% | -12% | -13% |
| Prior attainment: Low v Medium | -6% | -6% | -8% | -9% |
| Prior attainment: High v Medium | 13% | 13% | 16% | 16% |
| Prior attainment: Very high v Medium | 37% | 37% | 42% | 42% |
| Prior attainment: Unknown v Medium | 6% | 6% | 6% | 5% |
| SEND: SEND v NoSEND | -4% | -4% | -5% | -6% |
Probability of grade 4 and above
Figures 12.1-12.7 show breakdowns of 2018 to 2021 GCSE results (on the probability-of-grade-4-and-above measure) by the variables included in the main model, and the modelled conditional results gaps between the groups defined under each of those variables and their respective reference group. Table 16 presents the main models’ results gap estimates for 2018 to 2021.
From the top graphs, all groups see little change in outcomes from 2020 and an increase from 2019.
The top row of Table 16 shows the grade awarded to an ‘average’ entry in 2018-2021. There is no change between 2020 and 2021. The 2019-to-2021 increase of 6.45 percentage points is notable.
From the bottom graphs as well as Table 16, using the multi-step method described above, we found:
- 16 of the 22 between-group comparisons (including all those on language, SEND, FSM and deprivation) showed no notable change from 2020 to 2021
- 9 of the 22 between-group comparisons (including all those on language and SEND) showed no notable change from 2019 to 2021
The notable 2020-to-2021 changes are:
- changes on some gaps in relation to prior attainment indicate little change in the relationship between prior attainment and results from 2020 to 2021
- the gaps indicating higher outcomes in 2020 of Chinese candidates and candidates with unknown FSM status, relative to prior-attainment-matched White candidates and non-FSM candidates respectively, have widened by 1.49 and 6.14 percentage points respectively in 2021
- the gap indicating lower outcomes in 2020 of male candidates relative to prior-attainment-matched female candidates has narrowed by 1.65 percentage points in 2021
The notable 2019-to-2021 changes are:
- changes on the gaps in relation to prior attainment indicate a less strong relationship between prior attainment and results in 2021 than in 2019
- the longstanding gap indicating lower outcomes of FSM candidates relative to prior-attainment-matched non-FSM candidates has widened by 1.31 percentage points
- the gap indicating higher outcomes of candidates with unknown FSM eligibility status relative to prior-attainment-matched non-FSM candidates has widened by 5.9 percentage points
- the longstanding gaps indicating higher outcomes of Asian, Chinese and Any Other Ethnic Group candidates and candidates with a very low level of deprivation, relative to prior-attainment-matched White candidates and candidates with a medium level of deprivation respectively, have narrowed by 1.62, 1.45, 1.09 and 1.34 percentage points respectively
- the longstanding gap indicating lower outcomes of male candidates relative to prior-attainment-matched female candidates, has narrowed by 2.6 percentage points
- the gap between candidates with unknown level of deprivation and candidates with a medium level of deprivation, has shifted from negative to positive, indicating that in 2019, candidates with unknown level of deprivation had lower outcomes than prior-attainment-matched candidates with a medium level of deprivation, but in 2021, the direction of the difference reversed. The shift represents a change of 2.5 percentage points
Figure 12.1. 2018-2021 GCSE results (probability of grade 4 and above) and modelled conditional results gaps by gender
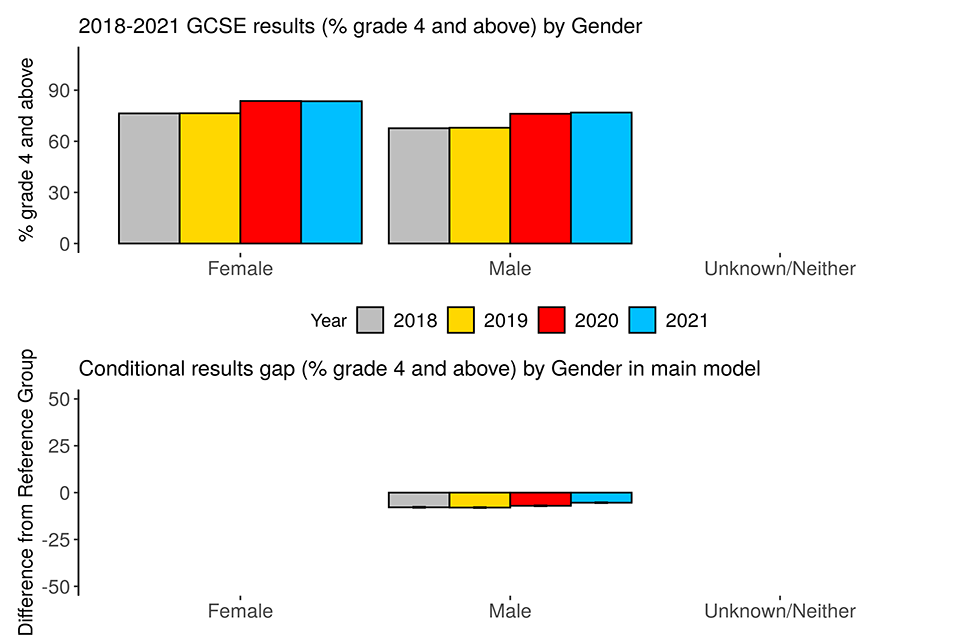
The unknown/neither group’s result is not presented out of concern for disclosure, and it was not included in the modelling because of its extremely small size.
Figure 12.2. 2018-2021 GCSE results (probability of grade 4 and above) and modelled conditional results gaps by ethnicity
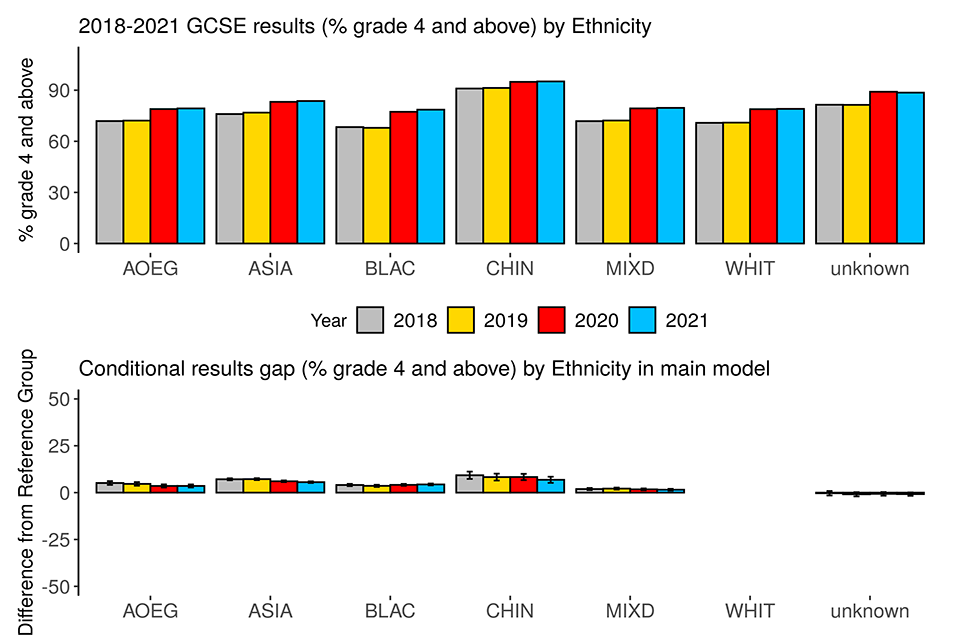
Figure 12.3. 2018-2021 GCSE results (probability of grade 4 and above) and modelled conditional results gaps by major language
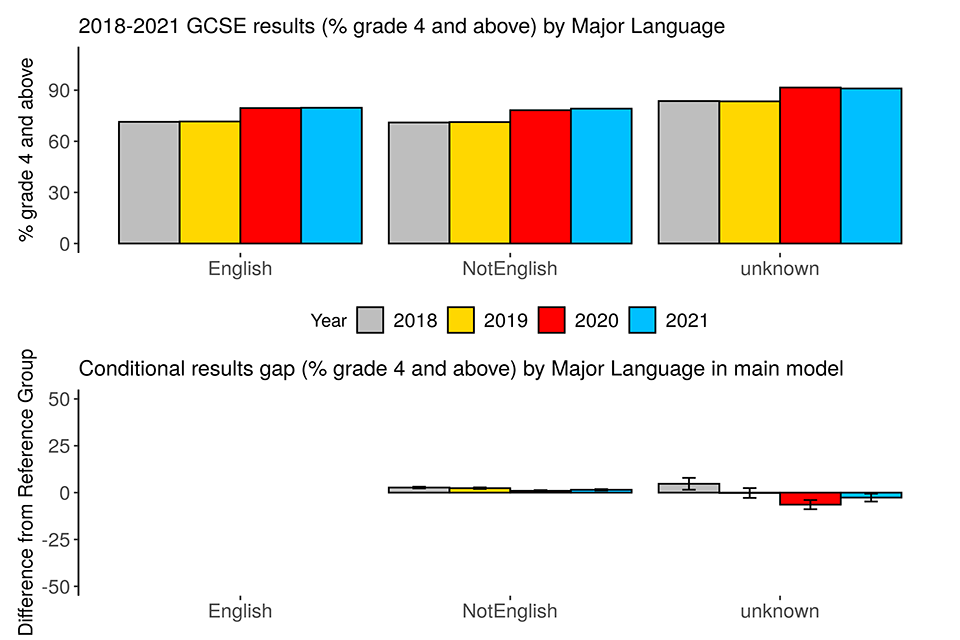
Figure 12.4. 2018-2021 GCSE results (probability of grade 4 and above) and modelled conditional results gaps by SEND status
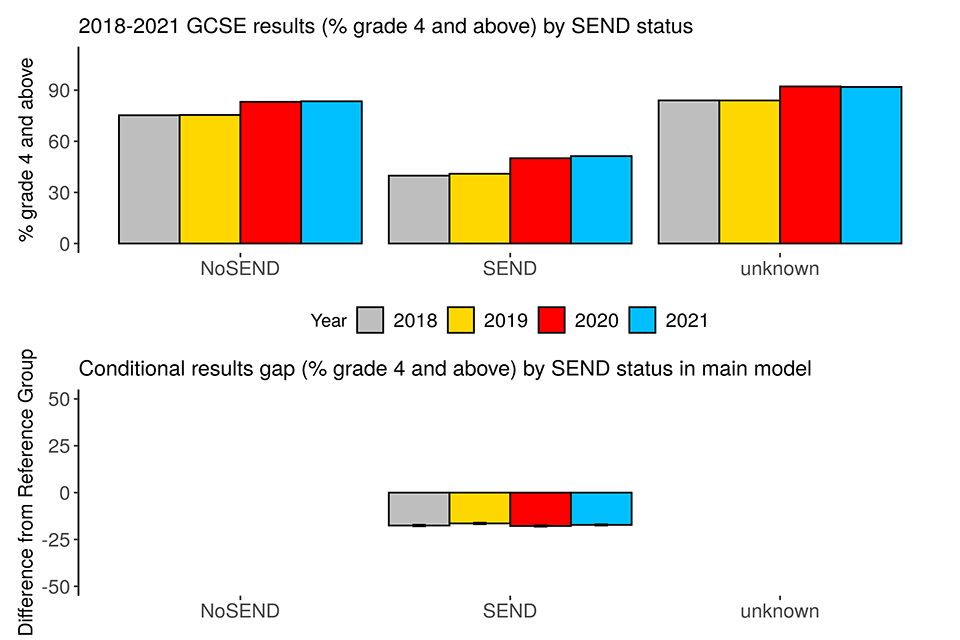
There was no conditional results gap estimate for the unknown SEND status group because of perfect collinearity between unknown SEND and unknown FSM.
Figure 12.5. 2018-2021 GCSE results (probability of grade 4 and above) and modelled conditional results gaps by FSM eligibility
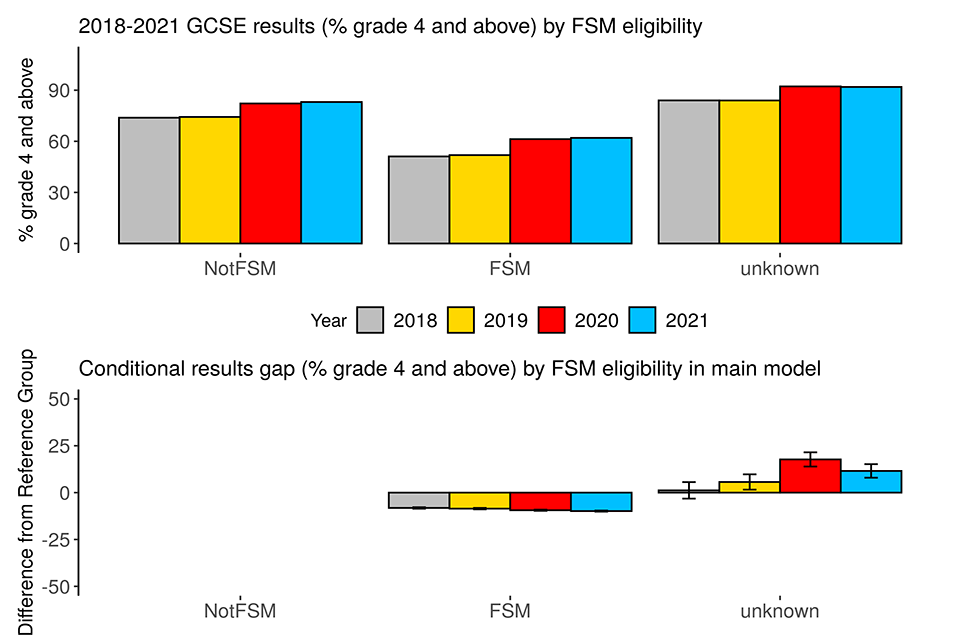
Figure 12.6. 2018-2021 GCSE results (probability of grade 4 and above) and modelled conditional results gaps by deprivation
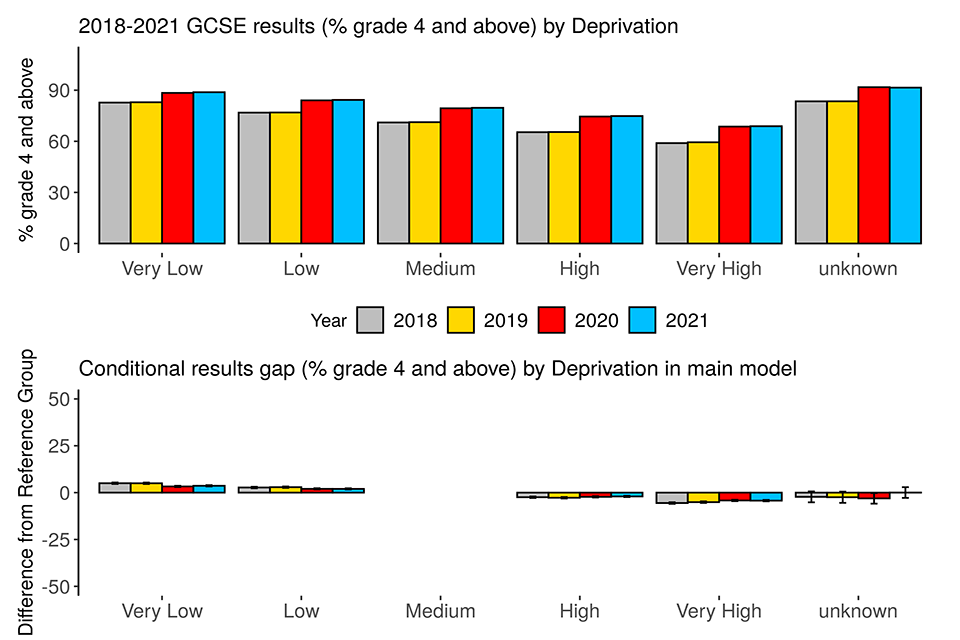
Figure 12.7. 2018-2021 GCSE results (probability of grade 4 and above) and modelled conditional results gaps by prior attainment
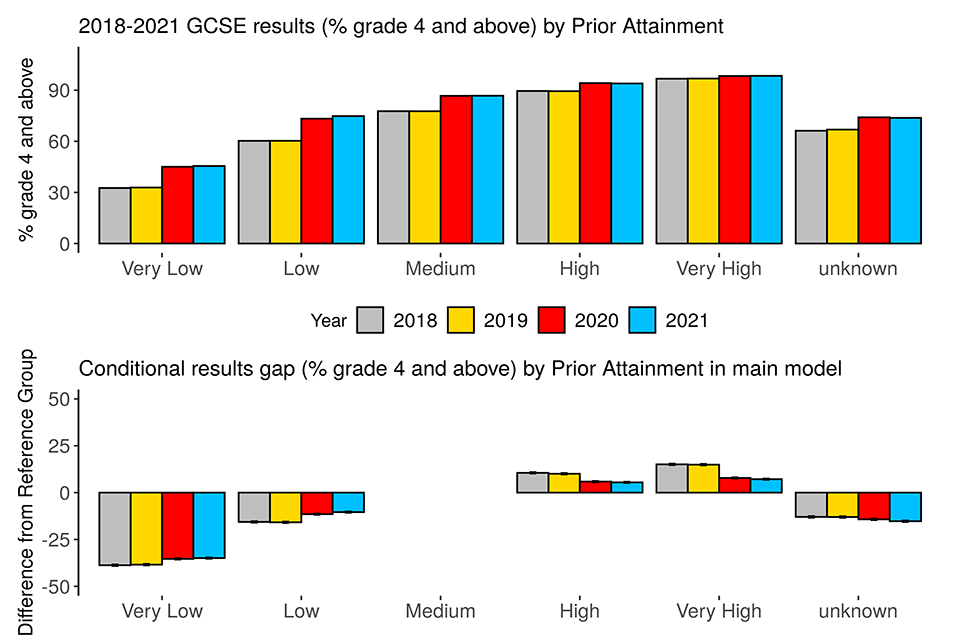
Table 16. Summary of modelled results gaps in 2018-2021 GCSE results (probability of grade 4 and above)
| Comparison | 2018 | 2019 | 2020 | 2021 |
|---|---|---|---|---|
| Average entry | 84% | 85% | 91% | 91% |
| Ethnicity: AOEG v WHIT | 5% | 5% | 4% | 4% |
| Ethnicity: ASIA v WHIT | 7% | 7% | 6% | 6% |
| Ethnicity: BLAC v WHIT | 4% | 4% | 4% | 4% |
| Ethnicity: CHIN v WHIT | 9% | 8% | 8% | 7% |
| Ethnicity: MIXD v WHIT | 2% | 2% | 2% | 2% |
| Ethnicity: Unknown v WHIT | 0% | -1% | -1% | -1% |
| FSM: FSM v NotFSM | -8% | -9% | -9% | -10% |
| FSM: Unknown v NotFSM | 1% | 6% | 18% | 12% |
| Gender: Male v Female | -8% | -8% | -7% | -5% |
| Deprivation: Very low v Medium | 5% | 5% | 3% | 4% |
| Deprivation: Low v Medium | 3% | 3% | 2% | 2% |
| Deprivation: High v Medium | -2% | -3% | -2% | -2% |
| Deprivation: Very high v Medium | -6% | -5% | -4% | -4% |
| Deprivation: Unknown v Medium | -2% | -2% | -3% | 0% |
| Major language: NotEnglish v English | 3% | 2% | 1% | 2% |
| Major language: Unknown v English | 5% | 0% | -6% | -3% |
| Prior attainment: Very low v Medium | -39% | -38% | -35% | -35% |
| Prior attainment: Low v Medium | -16% | -16% | -11% | -10% |
| Prior attainment: High v Medium | 11% | 10% | 6% | 5% |
| Prior attainment: Very high v Medium | 15% | 15% | 8% | 7% |
| Prior attainment: Unknown v Medium | -13% | -13% | -14% | -15% |
| SEND: SEND v NoSEND | -18% | -16% | -18% | -17% |
Additional model 1 (centre type, region, prior attainment, subject)
An additional set of models were run to examine results gaps by centre type and region, conditional on prior attainment and subject, which are presented in this section. The prior attainment effects and the α coefficients produced by these models are similar to those produced by the main models and therefore not repeated here.
Mean numeric grade
Figures 13.1-13.2 show breakdowns of 2018 to 2021 GCSE results (on the numeric grade measure) by centre type and region, and the modelled conditional results gaps between the groups defined under each of those variables and their respective reference group. Table 17 presents the additional models’ results gap estimates for 2018 to 2021.
From the top graphs, all but 2 groups see an increase in outcomes in 2021 compared to 2020. Compared to 2019, all groups see an increase in outcomes in 2021.
From the bottom graphs as well as Table 17, using the multi-step method described above, we found:
- all 8 regional comparisons showed no notable change from 2020 to 2021
- 7 of the 9 centre type comparisons (between academies and free schools, further education establishments, secondary comprehensives, secondary modern schools, secondary selective schools, sixth form colleges, ‘other’ centre types) showed no notable change from 2020 to 2021
- all 8 regional comparisons showed no notable change from 2019 to 2021
- 3 of the 9 centre type comparisons (between academies and secondary comprehensives, secondary modern schools, sixth form colleges) showed no notable change from 2019 to 2021
The notable 2020-to-2021 changes in relation to centre type are:
- the longstanding gap indicating higher outcomes in 2020 of candidates in independent schools relative to prior-attainment-matched candidates in academies has widened slightly by 0.11 grade in 2021
- the gap indicating lower outcomes in 2020 of candidates in tertiary colleges relative to prior-attainment-matched candidates in academies has narrowed slightly by 0.2 grade in 2021
The notable 2019-to-2021 changes in relation to centre type are:
- the longstanding gap indicating higher outcomes of candidates in independent schools relative to prior-attainment-matched candidates in academies has widened by 0.22 grade
- the longstanding gap indicating higher outcomes of candidates in secondary selective schools relative to prior-attainment-matched candidates in academies has narrowed slightly by 0.17 grade • the gaps indicating lower outcomes of candidates in free schools, further education establishments, tertiary colleges and ‘other’ centre types, relative to prior-attainment-matched candidates in academies have narrowed by 0.1, 0.36, 0.37 and 0.22 grade respectively
Figure 13.1. 2018-2021 GCSE results (numeric grade) and modelled conditional results gaps by centre type controlled for region, prior attainment and subject
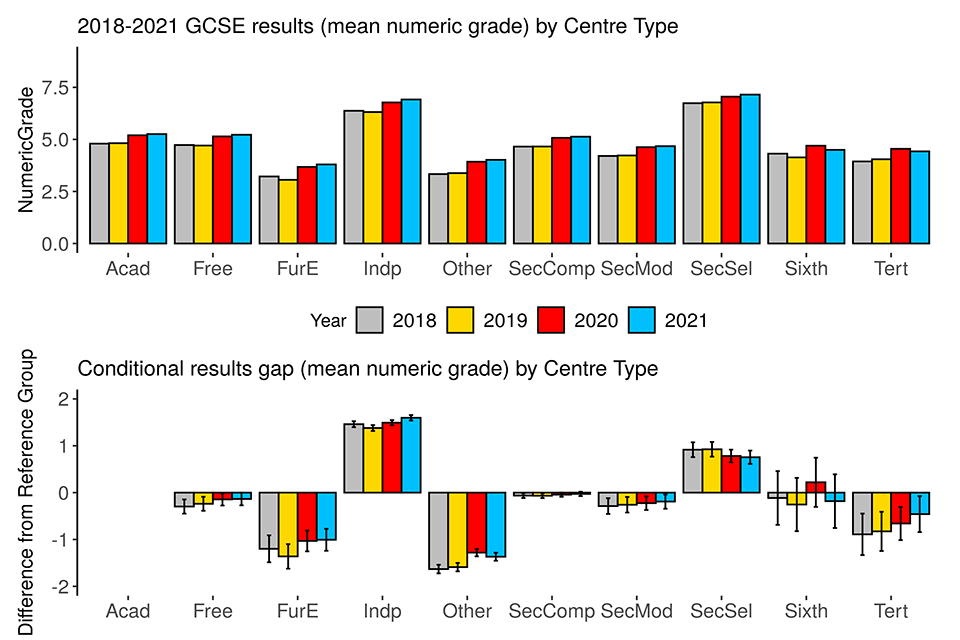
Figure 13.2 2018-2021 GCSE results (numeric grade) and modelled conditional results gaps by region controlled for centre type, prior attainment and subject
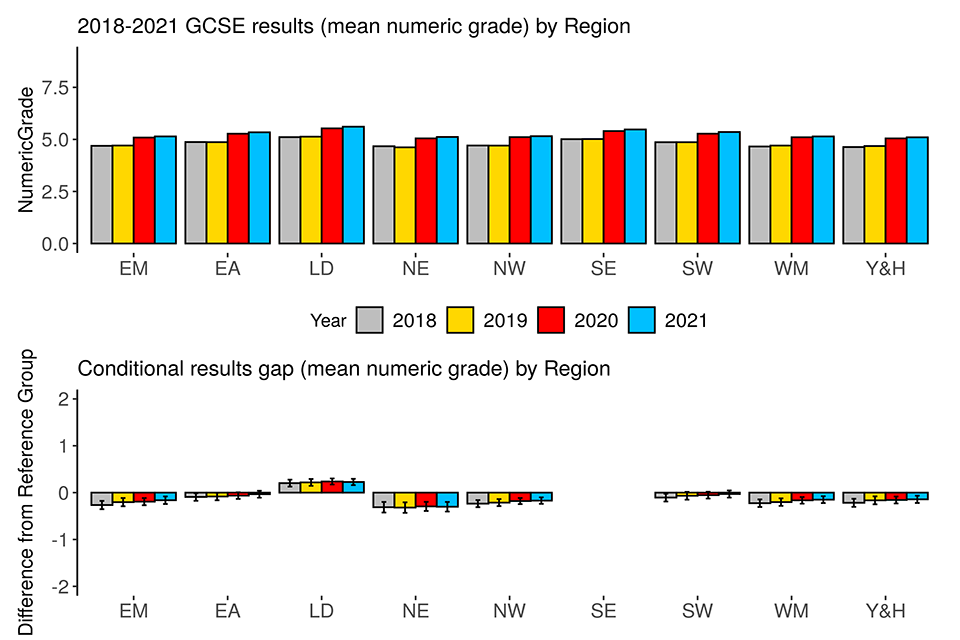
Table 17. Summary of modelled results gaps in 2018-2021 GCSE results (mean numeric grade) from additional model on centre type and region
| Comparison | 2018 | 2019 | 2020 | 2021 |
|---|---|---|---|---|
| Centre Type: Free v Acad | -0.3 | -0.2 | -0.1 | -0.1 |
| Centre Type: FurE v Acad | -1.2 | -1.4 | -1.0 | -1.0 |
| Centre Type: Indp v Acad | 1.5 | 1.4 | 1.5 | 1.6 |
| Centre Type: Other v Acad | -1.6 | -1.6 | -1.3 | -1.4 |
| Centre Type: SecComp v Acad | -0.1 | -0.1 | 0.0 | 0.0 |
| Centre Type: SecMod v Acad | -0.3 | -0.3 | -0.2 | -0.2 |
| Centre Type: SecSel v Acad | 0.9 | 0.9 | 0.8 | 0.8 |
| Centre Type: Sixth v Acad | -0.1 | -0.3 | 0.2 | -0.2 |
| Centre Type: Tert v Acad | -0.9 | -0.8 | -0.7 | -0.5 |
| Region: East Midlands v South East | -0.3 | -0.2 | -0.2 | -0.2 |
| Region: East of England v South East | -0.1 | -0.1 | -0.1 | 0.0 |
| Region: London v South East | 0.2 | 0.2 | 0.2 | 0.2 |
| Region: North East v South East | -0.3 | -0.3 | -0.3 | -0.3 |
| Region: North West v South East | -0.2 | -0.2 | -0.2 | -0.2 |
| Region: South West v South East | -0.1 | -0.1 | -0.1 | 0.0 |
| Region: West Midlands v South East | -0.2 | -0.2 | -0.2 | -0.1 |
| Region: Yorkshire and the Humber v South East | -0.2 | -0.2 | -0.2 | -0.1 |
Probability of grade 7 and above
Figures 14.1-14.2 show breakdowns of 2018 to 2021 GCSE results (on the probability-of-grade-7-and-above measure) by centre type and region, and the modelled conditional results gaps between the groups defined under each of those variables and their respective reference group. Table 18 presents the additional models’ results gap estimates for 2018 to 2021.
From the top graphs, all groups see an increase in outcomes in 2021 compared to both 2019 and 2020.
From the bottom graphs as well as Table 18, using the multi-step method described above, we found:
- all 8 regional comparisons showed no notable change from 2020 to 2021
- 7 of the 9 centre type comparisons (between academies and free schools, further education establishments, secondary comprehensives, secondary modern schools, secondary selective schools, sixth form colleges, ‘other’ centre types) showed no notable change from 2020 to 2021
- all 8 regional comparisons showed no notable change from 2019 to 2021.
- 5 of the 9 centre type comparisons (between academies and free schools, further education establishments, secondary comprehensives, secondary modern schools, sixth form colleges) showed no notable change from 2019 to 2021
The notable 2020-to-2021 changes in relation to centre type is:
- the gap indicating higher outcomes in 2020 of candidates in independent schools relative to prior-attainment-matched candidates in academies has widened by 1.57 percentage points in 2021
- the gap indicating lower outcomes in 2020 of candidates in tertiary colleges relative to prior-attainment-matched candidates in academies has narrowed by 2.35 percentage points in 2021
The notable 2019-to-2021 changes in relation to centre type are:
- the longstanding gap indicating higher outcomes of candidates in independent schools relative to prior-attainment-matched candidates in academies has widened by 6.79 percentage points
- the longstanding gap indicating higher outcomes of candidates in secondary selective schools relative to prior-attainment-matched candidates in academies has narrowed by 3.14 percentage points
- the gap indicating lower outcomes of candidates in tertiary colleges relative to prior-attainment-matched candidates in academies has narrowed by 1.17 percentage points
- the gap indicating lower outcomes of candidates in ‘other’ centre types relative to prior-attainment-matched candidates in academies has widened by 1.24 percentage points
Figure 14.1. 2018-2021 GCSE results (probability of grade 7 and above) and modelled conditional results gaps by centre type controlled for region, prior attainment and subject
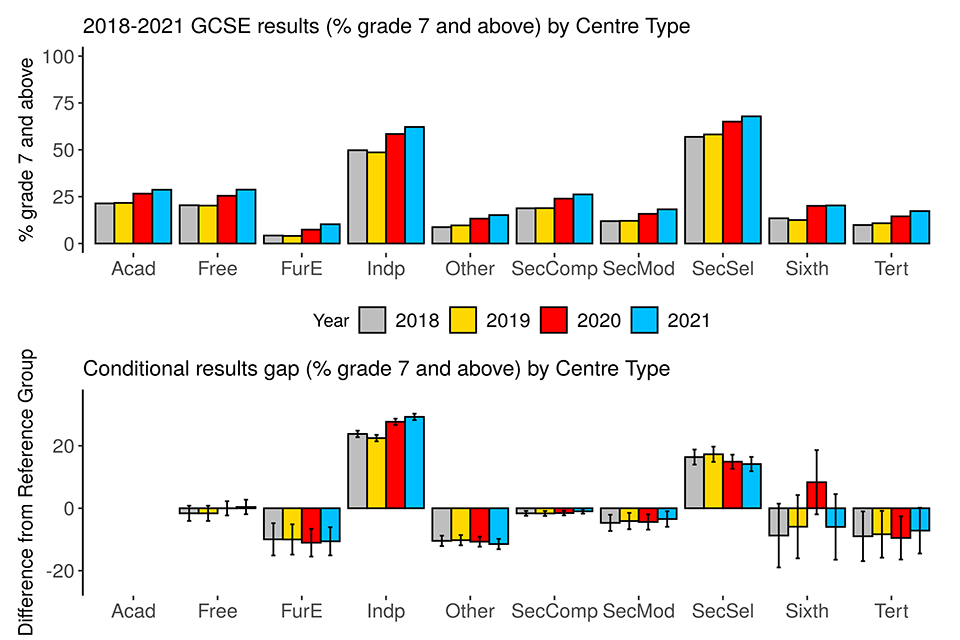
Figure 14.2. 2018-2021 GCSE results (probability of grade 7 and above) and modelled conditional results gaps by region controlled for centre type, prior attainment and subject
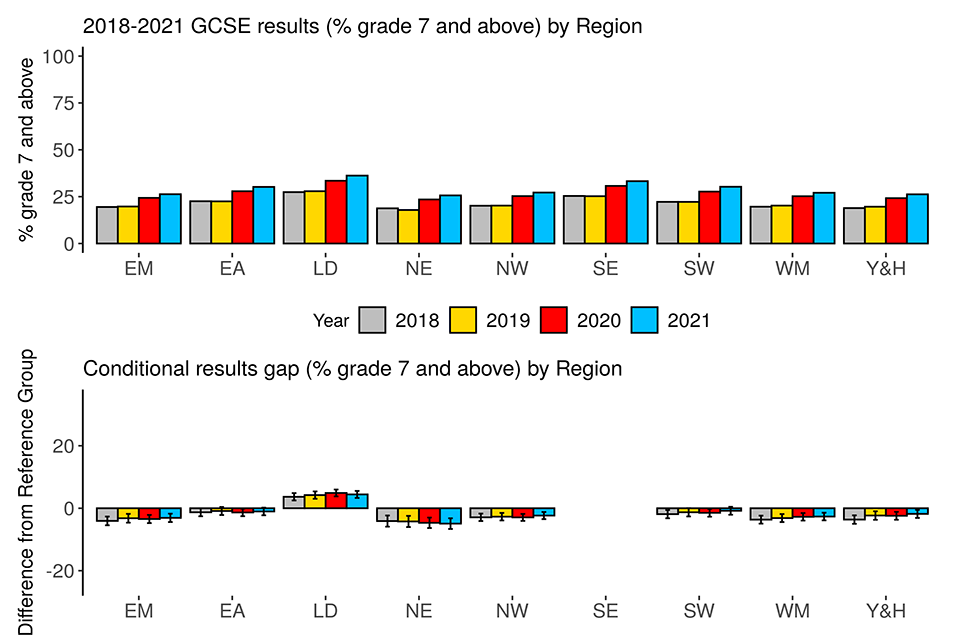
Table 18. Summary of modelled results gaps in 2018-2021 GCSE results (probability of grade A and above) from additional model on centre type and region
| Comparison | 2018 | 2019 | 2020 | 2021 |
|---|---|---|---|---|
| Centre Type: Free v Acad | -2% | -2% | 0% | 0% |
| Centre Type: FurE v Acad | -10% | -10% | -11% | -11% |
| Centre Type: Indp v Acad | 24% | 22% | 28% | 29% |
| Centre Type: Other v Acad | -10% | -10% | -11% | -11% |
| Centre Type: SecComp v Acad | -2% | -2% | -2% | -1% |
| Centre Type: SecMod v Acad | -5% | -4% | -4% | -3% |
| Centre Type: SecSel v Acad | 16% | 17% | 15% | 14% |
| Centre Type: Sixth v Acad | -9% | -6% | 8% | -6% |
| Centre Type: Tert v Acad | -9% | -8% | -10% | -7% |
| Region: East Midlands v South East | -4% | -3% | -3% | -3% |
| Region: East of England v South East | -1% | -1% | -1% | -1% |
| Region: London v South East | 4% | 4% | 5% | 4% |
| Region: North East v South East | -4% | -4% | -5% | -5% |
| Region: North West v South East | -3% | -3% | -3% | -2% |
| Region: South West v South East | -2% | -1% | -1% | -1% |
| Region: West Midlands v South East | -4% | -3% | -3% | -3% |
| Region: Yorkshire and the Humber v South East | -4% | -2% | -2% | -2% |
Probability of grade 4 and above
Figures 15.1-15.2 show breakdowns of 2018-2021 GCSE results (on the probability-of-grade-4-and-above measure) by centre type and region, and the modelled conditional results gaps between the groups defined under each of those variables and their respective reference group. Table 19 presents the additional models’ results gap estimates for 2018-2021.
From the top graphs, all but 2 groups see little change in outcomes in 2021, compared to 2020. Compared to 2019, all groups see an increase in outcomes in 2021.
From the bottom graphs as well as Table 19, using the multi-step method described above, we found:
- all 8 regional comparisons showed no notable change from 2020 to 2021
- 7 of the 9 centre type comparisons (between academies and free schools, further education establishments, independent schools, secondary comprehensives, secondary modern schools, secondary selective schools, ‘other’ centre types) showed no notable change from 2020 to 2021
- 6 of the 8 regional comparisons showed no notable change from 2019 to 2021.
- 3 of the 9 centre type comparisons (between academies and secondary comprehensives, secondary modern schools, sixth form colleges) showed no notable change from 2019 to 2021
The notable 2020-to-2021 changes in relation to centre type are:
- the gaps indicating lower outcomes in 2020 of candidates in further education establishments and tertiary colleges, relative to prior-attainment-matched candidates in academies, have narrowed by 3.49 and 2.89 percentage points respectively in 2021 The notable 2019-to-2021 changes in relation to region are:
- the gaps indicating lower outcomes of candidates in centres in the North East and West Midlands, relative to prior-attainment-matched candidates in centres in the South East, have narrowed by 1.76 and 1.02 percentage points respectively
The notable 2019-to-2021 changes in relation to centre type are:
- the longstanding gaps indicating higher outcomes of candidates in independent schools and secondary selective schools relative to prior-attainment-matched candidates in academies have narrowed by 2.35 and 3.03 percentage points respectively
- the gaps indicating lower outcomes of candidates in free schools, further education establishments, tertiary colleges and ‘other’ centre types, relative to prior-attainment-matched candidates in academies, have narrowed by 1.44, 10.99, 7.87 and 6.79 percentage points respectively
Figure 15.1. 2018-2021 GCSE results (probability of grade 4 and above) and modelled conditional results gaps by centre type controlled for region, prior attainment and subject
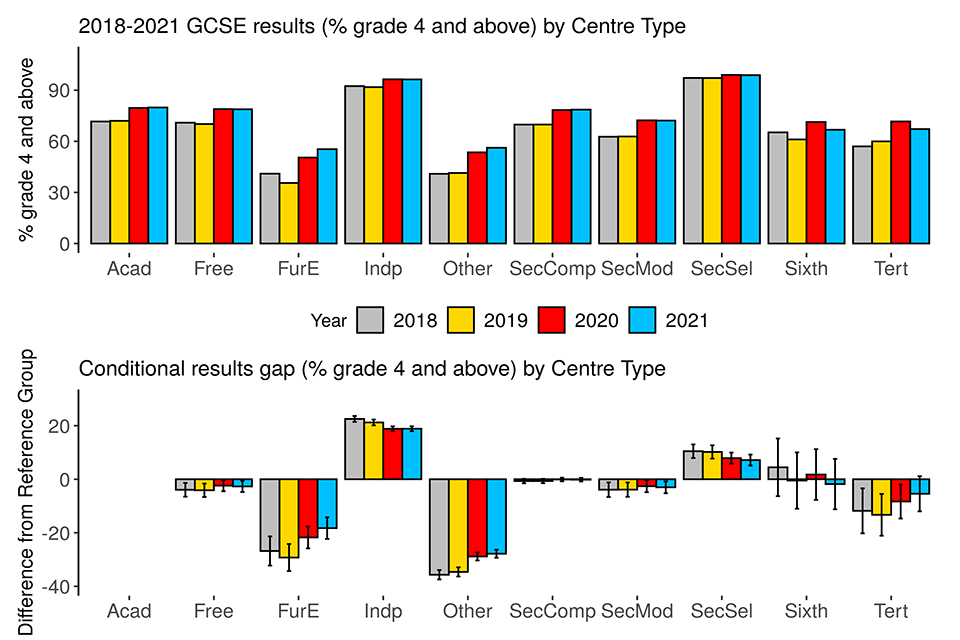
Figure 15.2. 2018-2021 GCSE results (probability of grade 4 and above) and modelled conditional results gaps by region controlled for centre type, prior attainment and subject
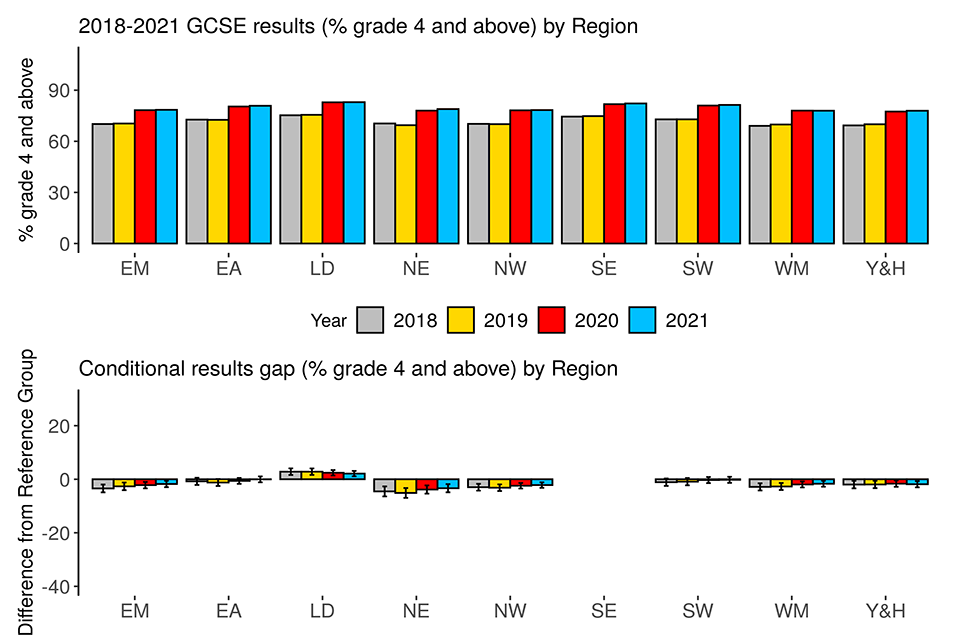
Table 19. Summary of modelled results gaps in 2018-2021 GCSE results (probability of grade C and above) from additional model on centre type and region
| Comparison | 2018 | 2019 | 2020 | 2021 |
|---|---|---|---|---|
| Centre Type: Free v Acad | -4% | -4% | -2% | -3% |
| Centre Type: FurE v Acad | -27% | -29% | -22% | -18% |
| Centre Type: Indp v Acad | 23% | 21% | 19% | 19% |
| Centre Type: Other v Acad | -36% | -35% | -29% | -28% |
| Centre Type: SecComp v Acad | -1% | -1% | 0% | 0% |
| Centre Type: SecMod v Acad | -4% | -4% | -3% | -3% |
| Centre Type: SecSel v Acad | 10% | 10% | 8% | 7% |
| Centre Type: Sixth v Acad | 4% | 0% | 2% | -2% |
| Centre Type: Tert v Acad | -12% | -13% | -8% | -5% |
| Region: East Midlands v South East | -3% | -3% | -2% | -2% |
| Region: East of England v South East | -1% | -1% | -1% | 0% |
| Region: London v South East | 3% | 3% | 2% | 2% |
| Region: North East v South East | -5% | -5% | -4% | -3% |
| Region: North West v South East | -3% | -3% | -2% | -2% |
| Region: South West v South East | -1% | -1% | 0% | 0% |
| Region: West Midlands v South East | -3% | -3% | -2% | -2% |
| Region: Yorkshire and the Humber v South East | -2% | -2% | -2% | -2% |
Additional model 2 (minor grouping of ethnicity, prior attainment, subject)
A second additional set of models were run to examine results gaps by minor grouping of ethnicity, conditional on prior attainment and subject, which are presented in this section. The prior attainment effects and the α coefficients produced by these models are similar to those produced by the main models and therefore not repeated here.
Mean numeric grade
Figure 16 shows a breakdown of 2018 to 2021 A level results (on the numeric grade measure) by narrow grouping of ethnicity, and the modelled conditional results gaps between the groups defined under the variable and the reference group (White British). Table 20 presents the additional models’ results gap estimates for 2018 to 2021.
From the top graphs, most groups see an increase in outcomes compared to 2020. Compared to 2019, all groups see an increase.
From the bottom graphs as well as Table 20, using the multi-step method described above, we found:
- 17 of the 18 between-group comparisons (between White British and Asian Bangladeshi, Asian Indian, Asian Pakistani, Black African, Black Caribbean, Black Other, Chinese, Mixed White and Asian, Mixed White and Black African, Mixed White and Black Caribbean, Mixed Other, White Irish, White Other, Travellers of Irish Heritage, Gypsy and Roma, Any Other Ethnic Group, ‘unknown ethnicity’) showed no notable change from 2020 to 2021
- 16 of the 18 between-group comparisons (between White British and Asian Bangladeshi, Asian Indian, Asian Pakistani, Asian Other, Black African, Black Caribbean, Black Other, Chinese, Mixed White and Asian, Mixed White and Black African, Mixed White and Black Caribbean, Mixed Other, White Irish, White Other, Travellers of Irish Heritage, Any Other Ethnic Group) showed no notable change from 2019 to 2021
The notable 2020-to-2021 change in relation to minor grouping of ethnicity is:
- the gap indicating higher outcomes in 2020 of Asian Other candidates relative to prior-attainment-matched White British candidates has widened slightly by 0.12 grade in 2021
The notable 2019-to-2021 changes in relation to minor grouping ethnicity are:
- the gap indicating lower outcomes of Gypsy and Roma candidates relative to prior-attainment-matched White British candidates has widened slightly by 0.17 grade
- the gap indicating higher outcomes of candidates with unknown ethnicity relative to prior-attainment-matched White British candidates has widened slightly by 0.19 grade
Figure 16. 2018-2021 GCSE results (numeric grade) and modelled conditional results gaps by ethnicity (minor grouping) controlled for prior attainment and subject
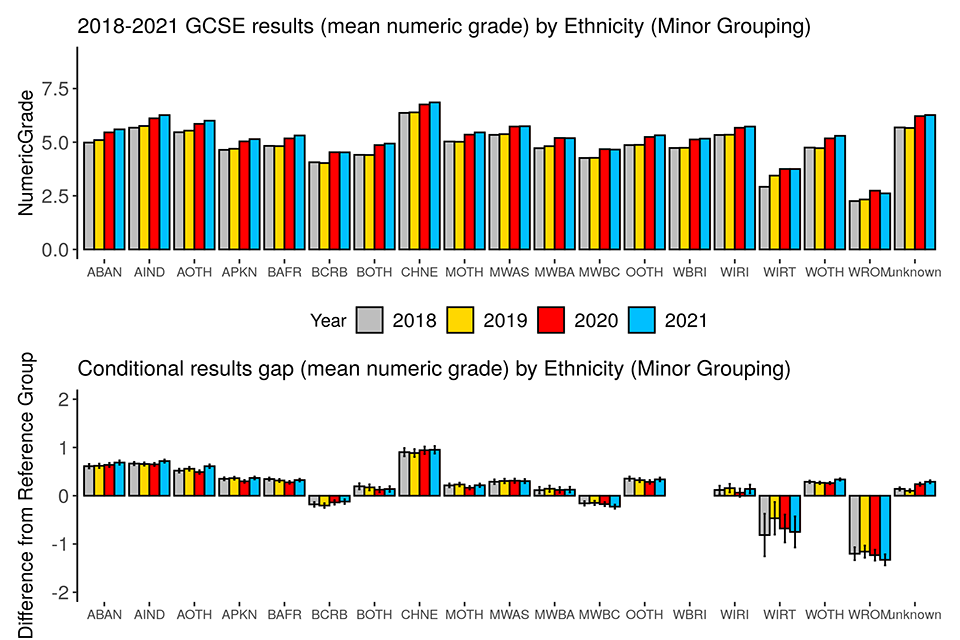
Table 20. Summary of modelled results gaps in 2018-2021 GCSE results (mean numeric grade) from additional model on narrow grouping of ethnicity
| Comparison | 2018 | 2019 | 2020 | 2021 |
|---|---|---|---|---|
| Ethnicity: ABAN v WBRI | 0.6 | 0.6 | 0.6 | 0.7 |
| Ethnicity: AIND v WBRI | 0.7 | 0.7 | 0.7 | 0.7 |
| Ethnicity: AOTH v WBRI | 0.5 | 0.6 | 0.5 | 0.6 |
| Ethnicity: APKN v WBRI | 0.4 | 0.4 | 0.3 | 0.4 |
| Ethnicity: BAFR v WBRI | 0.3 | 0.3 | 0.3 | 0.3 |
| Ethnicity: BCRB v WBRI | -0.2 | -0.2 | -0.1 | -0.1 |
| Ethnicity: BOTH v WBRI | 0.2 | 0.2 | 0.1 | 0.1 |
| Ethnicity: CHNE v WBRI | 0.9 | 0.9 | 0.9 | 1.0 |
| Ethnicity: MOTH v WBRI | 0.2 | 0.2 | 0.2 | 0.2 |
| Ethnicity: MWAS v WBRI | 0.3 | 0.3 | 0.3 | 0.3 |
| Ethnicity: MWBA v WBRI | 0.1 | 0.1 | 0.1 | 0.1 |
| Ethnicity: MWBC v WBRI | -0.2 | -0.1 | -0.2 | -0.2 |
| Ethnicity: OOTH v WBRI | 0.4 | 0.3 | 0.3 | 0.3 |
| Ethnicity: WIRI v WBRI | 0.1 | 0.2 | 0.1 | 0.1 |
| Ethnicity: WIRT v WBRI | -0.8 | -0.5 | -0.7 | -0.8 |
| Ethnicity: WOTH v WBRI | 0.3 | 0.3 | 0.3 | 0.3 |
| Ethnicity: WROM v WBRI | -1.2 | -1.2 | -1.2 | -1.3 |
| Ethnicity: Unknown v WBRI | 0.1 | 0.1 | 0.2 | 0.3 |
Probability of grade 7 and above
Figure 17 shows a breakdown of 2018-2021 GCSE results (on the probability-of-grade-7-and-above measure) by narrow grouping of ethnicity, and the modelled conditional results gaps between the groups defined under the variable and the reference group (White British). Table 21 presents the additional models’ results gap estimates for 2018-2021.
From the top graphs, all groups see an increase in outcomes in 2021 compared to both 2020 and 2019.
From the bottom graphs as well as Table 21, using the multi-step method described above, we found:
- 12 of the 18 between-group comparisons (between White British and Asian Bangladeshi, Black African, Black Other, Chinese, Mixed White and Asian, Mixed White and Black Caribbean, Mixed Other, White Irish, Travellers of Irish Heritage, Gypsy and Roma, Any Other Ethnic Group, ‘unknown ethnicity’) showed no notable change from 2020 to 2021
- 9 of the 18 between-group comparisons (between White British and Asian Pakistani, Black African, Black Caribbean, Black Other, Mixed White and Asian, Mixed Other, White Irish, Travellers of Irish Heritage, Any Other Ethnic Group) showed no notable change from 2019 to 2021
The notable 2020-to-2021 changes in relation to minor grouping of ethnicity are:
- the gaps indicating higher outcomes in 2020 of Asian Indian, Asian Other, Asian Pakistani and White Other candidates, relative to prior-attainment-matched White British candidates, have widened by 1.7, 3.03, 1.54 and 1.11 percentage points respectively in 2021
- the gap indicating higher outcomes in 2020 of Mixed White and Black African candidates relative to prior-attainment-matched White British candidates has narrowed by 1.15 percentage points in 2021
- the gap indicating lower outcomes in 2020 of Black Caribbean candidates relative to prior-attainment-matched White British candidates, has narrowed by 1.09 percentage points in 2021
The notable 2019-to-2021 changes in relation to minor grouping ethnicity are:
- the gaps indicating higher outcomes of Asian Bangladeshi, Asian Indian, Asian Other, Chinese, White Other and ‘unknown ethnicity’ candidates, relative to prior-attainment-matched White British candidates, have widened by 2, 2.83, 3.07, 2.38, 1.66 and 3.17 percentage points respectively
- the gap indicating higher outcomes of Mixed White and Black African candidates relative to prior-attainment-matched White British candidates has narrowed by 1.28 percentage points
- the gaps indicating lower outcomes of Mixed White and Black Caribbean candidates and Gypsy and Roma candidates, relative to prior-attainment-matched White British candidates, have widened by 2.13 and 2.29 percentage points
Figure 17. 2018-2021 GCSE results (probability of grade 7 and above) and modelled conditional results gaps by ethnicity (minor grouping) controlled for prior attainment and subject
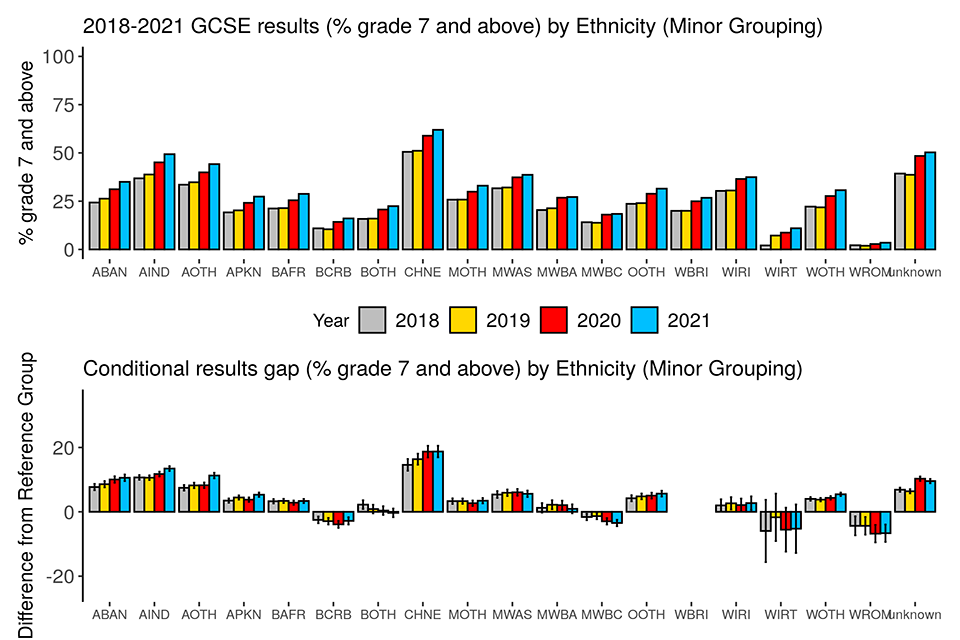
Table 21. Summary of modelled results gaps in 2018-2021 GCSE results (% grade 7 and above) from additional model on narrow grouping of ethnicity
| Comparison | 2018 | 2019 | 2020 | 2021 |
|---|---|---|---|---|
| Ethnicity: ABAN v WBRI | 8% | 9% | 10% | 11% |
| Ethnicity: AIND v WBRI | 11% | 11% | 12% | 13% |
| Ethnicity: AOTH v WBRI | 7% | 8% | 8% | 11% |
| Ethnicity: APKN v WBRI | 3% | 4% | 4% | 5% |
| Ethnicity: BAFR v WBRI | 3% | 3% | 3% | 3% |
| Ethnicity: BCRB v WBRI | -3% | -3% | -4% | -3% |
| Ethnicity: BOTH v WBRI | 2% | 1% | 0% | 0% |
| Ethnicity: CHNE v WBRI | 15% | 16% | 19% | 19% |
| Ethnicity: MOTH v WBRI | 3% | 3% | 3% | 3% |
| Ethnicity: MWAS v WBRI | 5% | 6% | 6% | 6% |
| Ethnicity: MWBA v WBRI | 1% | 2% | 2% | 1% |
| Ethnicity: MWBC v WBRI | -2% | -1% | -3% | -3% |
| Ethnicity: OOTH v WBRI | 4% | 5% | 5% | 6% |
| Ethnicity: WIRI v WBRI | 2% | 3% | 2% | 3% |
| Ethnicity: WIRT v WBRI | -6% | -2% | -6% | -5% |
| Ethnicity: WOTH v WBRI | 4% | 4% | 4% | 5% |
| Ethnicity: WROM v WBRI | -4% | -4% | -7% | -7% |
| Ethnicity: Unknown v WBRI | 7% | 6% | 10% | 10% |
Probability of grade 4 and above
Figure 18 shows a breakdown of 2018-2021 GCSE results (on the probability-of-grade-4-and-above measure) by narrow grouping of ethnicity, and the modelled conditional results gaps between the groups defined under the variable and the reference group (White British). Table 22 presents the additional models’ results gap estimates for 2018 to 2021.
From the top graphs, all groups see an increase in outcomes in 2021 compared to 2019. Compared to 2020, most groups see little change.
From the bottom graphs as well as Table 22, using the multi-step method described above, we found:
- 15 of the 18 between-group comparisons (between White British and Asian Bangladeshi, Asian Indian, Asian Pakistani, Asian Other, Black African, Black Caribbean, Black Other, Chinese, Mixed White and Asian, Mixed White and Black African, Mixed White and Black Caribbean, Mixed Other, Travellers of Irish Heritage, Any Other Ethnic Group, ‘unknown ethnicity’) showed no notable change from 2020 to 2021
- 7 of the 18 between-group comparisons (between White British and Asian Bangladeshi, Black African, Black Other, Chinese, Mixed White and Black African, Mixed White and Black Caribbean, White Other) showed no notable change from 2019 to 2021
The notable 2020-to-2021 changes in relation to minor grouping of ethnicity are:
- a gap between White Irish and White British candidates has emerged, indicating equal performance for prior-attainment-matched candidates of the 2 groups in 2020 and higher outcomes for White Irish candidates in 2021. The shift represents a change of 2.07 percentage points
- the gap indicating higher outcomes in 2020 of White Other candidates relative to prior-attainment-matched White British candidates, has widened by 1.06 percentage points in 2021
- the gap indicating lower outcomes in 2020 of Gypsy and Roma candidates relative to prior-attainment-matched White British candidates, has widened by 1.73 percentage points in 2021
The notable 2019-to-2021 changes in relation to minor grouping ethnicity are:
- the gaps indicating higher outcomes of Asian Indian, Asian Other, Asian Pakistani, Mixed White and Asian, Mixed Other, White Irish and Any Other Ethnic Group candidates, relative to prior-attainment-matched White British candidates, have narrowed by 2.12, 1.43, 1.52, 1.23, 1.00, 2.06 and 1.34 percentage points respectively
- the gap indicating lower outcomes of Black Caribbean candidates relative to prior-attainment-matched White British candidates has narrowed by 2.04 percentage points
- the gaps indicating lower outcomes of Gypsy and Roma candidates and Travellers of Irish Heritage candidates, relative to prior-attainment-matched White British candidates, have widened by 6.25 and 9.29 percentage points respectively
- the gap indicating higher outcomes of candidates with unknown ethnicity relative to prior-attainment-matched White British candidates has widened by 3.85 percentage points
Figure 18. 2018-2021 GCSE results (probability of grade 4 and above) and modelled conditional results gaps by ethnicity (minor grouping) controlled for prior attainment and subject
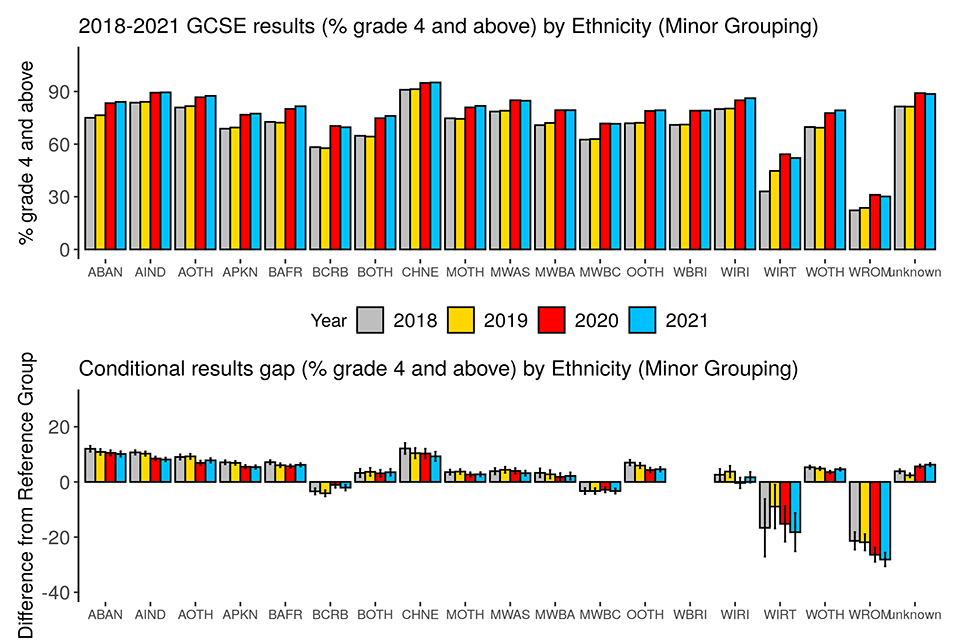
Table 22. Summary of modelled results gaps in 2018-2021 GCSE results (% grade 4 and above) from additional model on narrow grouping of ethnicity
| Comparison | 2018 | 2019 | 2020 | 2021 |
|---|---|---|---|---|
| Ethnicity: ABAN v WBRI | 12% | 11% | 11% | 10% |
| Ethnicity: AIND v WBRI | 11% | 10% | 8% | 8% |
| Ethnicity: AOTH v WBRI | 9% | 9% | 7% | 8% |
| Ethnicity: APKN v WBRI | 7% | 7% | 6% | 5% |
| Ethnicity: BAFR v WBRI | 7% | 6% | 6% | 6% |
| Ethnicity: BCRB v WBRI | -3% | -4% | -1% | -2% |
| Ethnicity: BOTH v WBRI | 3% | 4% | 3% | 4% |
| Ethnicity: CHNE v WBRI | 12% | 10% | 10% | 9% |
| Ethnicity: MOTH v WBRI | 4% | 4% | 3% | 3% |
| Ethnicity: MWAS v WBRI | 4% | 4% | 4% | 3% |
| Ethnicity: MWBA v WBRI | 3% | 3% | 2% | 2% |
| Ethnicity: MWBC v WBRI | -3% | -3% | -3% | -3% |
| Ethnicity: OOTH v WBRI | 7% | 6% | 4% | 5% |
| Ethnicity: WIRI v WBRI | 3% | 4% | 0% | 2% |
| Ethnicity: WIRT v WBRI | -17% | -9% | -15% | -18% |
| Ethnicity: WOTH v WBRI | 5% | 5% | 4% | 5% |
| Ethnicity: WROM v WBRI | -21% | -22% | -26% | -28% |
| Ethnicity: Unknown v WBRI | 4% | 2% | 6% | 6% |
To sum up for GCSE, we found that, of the many between-group comparisons examined in our modelling, the majority showed no notable change from 2021 to 2021, or from 2019 to 2021. Between 2020 and 2021, the only notable change found on all 3 results measures is the increase in outcomes for candidates in tertiary colleges relative to prior-attainment-matched candidates in academies.
Some groups showed notable changes from 2019 to 2021 on all 3 measures. FSM candidates, Gypsy and Roma candidates and candidates in secondary selective schools, have seen, from 2019 to 2021, a decrease in outcomes relative to prior-attainment-matched candidates of their respective reference group.
Candidates with unknown ethnicity, candidates with unknown FSM status, and candidates in tertiary colleges, have seen, in the same period, an increase in outcomes relative to prior-attainment-matched candidates of their respective reference group.
Candidates in independent schools have seen, from 2019 to 2021, an increase in outcomes on the numeric grade and grade-7-and-above measures, but a decrease on the grade-4-and-above measure, relative to prior-attainment-matched candidates in academies.
Candidates in ‘other’ centre types have seen, from 2019 to 2021, an increase in outcomes on the numeric grade and grade-4-and-above measures, but a decrease on the grade-7-and-above measure, relative to prior-attainment-matched candidates in academies.
Conclusion
This paper presents an analysis of the relationships between GCSE and A level results of summer 2018 to 2021 on the one hand, and protected characteristics and other student background variables, on the other. We analysed 3 results measures: mean numeric grade, probability of grade A or 7 and above, and probability of grade C or 4 and above. We used multilevel regression modelling to estimate ‘conditional results gaps’, that is, results gaps for subgroups of students defined by various variables, relative to their respective comparator group (which was the largest group under the respective variable), after controlling for other variables, including prior attainment. Conditional results gaps in 2018 and 2019 tell us that differences in exam results existed in pre-pandemic times and that conditional results gaps can vary from year to year even in normal times. By comparing changes in conditional results gaps between 2021 and 2020 and those between 2021 and 2019 against changes in conditional results gaps between 2019 and 2018, we identified the notable changes between 2020 and 2021 and those between 2019 and 2021. (In this paper, the use of the word ‘notable’ is specific to our method of evaluating between-year changes in group differences. It does not convey any judgement of the importance or not of the change in question.)
For A level, the majority of between-group comparisons examined in our modelling did not show notable changes from 2020 to 2021 or from 2019 to 2021. Between 2020 and 2021, the only notable change found on all 3 results measures relates to candidates in tertiary colleges. The groups that showed notable changes from 2019 to 2021 on all three results measures, relative to their respective comparator group, are male candidates, candidates with SEND, and candidates in independent schools, secondary selective schools, sixth form and tertiary colleges and ‘other’ centre types.
For GCSE, the majority of between-group comparisons examined in our modelling did not show notable changes from 2020 to 2021 or from 2019 to 2021. Between 2020 and 2021, the only notable change found on all 3 results measures relates to candidates in tertiary colleges. The groups that show notable changes from 2019 to 2021 on all 3 results measures are candidates eligible for FSMs, Gypsy and Roma candidates, candidates with unknown ethnicity, candidates with unknown FSM status, and candidates in independent schools, secondary selective schools, tertiary colleges and ‘other’ centre types.
There are some limitations to this analysis. First, because of time constraints, this report provides a basic equalities analysis. Further examination of the data may investigate interactions between variables that various equalities groups are interested in, for example, ethnicity by deprivation, SEND by gender, prior attainment by FSM eligibility, gender by ethnicity, etc.
Second, as noted earlier, data on the student background variables was clearly not missing at random, and missing rate was related to centre type. For the purposes of evaluating the equality impact on the summer 2021 results, the changes in between-group differences across years are most relevant, rather than the absolute between-group differences within a given year. As such, it was important that the pattern of missing data was stable across the 4 years we analysed. This was the case, so we can be confident that any changes in the effect of the background variables on results was not caused by a change in the completeness of that data from year to year. The questions remain of whether the findings from the main models applied only to one, albeit very large, section of the candidate population and whether the unknown categories could effectively be treated as proxies for some centre type(s). The new, additional analysis on centre type goes some way towards addressing the latter question by directly assessing changes in conditional results gaps in relation to centre type.
Third, the multi-step method we used to identify ‘notable’ changes embodied decisions on some statistical and practical questions to which there is no straight right or wrong answer. It is possible to devise alternative methods which put more weight on statistical significance than our method did, and/or which set a higher or lower effect size criterion than our method did. Such alternative methods may well mark more or fewer changes as ‘notable’. Using our method for evaluating changes between years and focusing on the results measures used in our analyses, we conclude that, of the many conditional results gaps examined in our modelling, the overwhelming majority showed no notable change from 2020 to 2021, and the majority showed no notable change from 2019 to 2021. Amidst no change on most gaps, the few changes noted could be understood as the impact of the pandemic on students’ education and the impact of the change in assessment arrangements. The 2 sources of impact are impossible to disentangle.
-
Criterion (i) means that only phase 1 and phase 2 reformed subjects (that is, subjects/specifications that were first assessed in 2017 and 2018 respectively) were included in the analysis. Note that A level mathematics, as a phase 3 reformed subject, was excluded from the equalities dataset for A level. Also, in this year’s analysis, we did not include GCSE short courses. ↩
-
Centre exclusion was carried out on a subject-by-subject basis. For example, suppose for A Level French, a centre has both 18-year-old and 19-year-old candidates in each of 2018 to 2021, and for A Level German, it has both 18-year-old and 19-year-old candidates in 2018, 2019 and 2020 but only 19-year-old candidates in 2021. Following criterion (iii), data on all 4 years’ 19-year-old candidates in both languages was excluded, and following criterion (ii), data on all 4years’ 18-year-old candidates in French was included and data on the preceding 3years’ 18-year-old candidates in German was excluded. ↩
-
It could be a candidate’s choice not to say, not to define themselves as male or female, or an administrative error. ↩
-
It has come to our attention that information on FSM eligibility is not collected post-16, and that it should be assumed that the FSM eligibility data on A level candidates reflects their FSM eligibility at Key Stage 4. ↩