Analysing data: CIPFA statistics and the future of England's libraries
Published 16 August 2018

© Crown copyright 2018
This publication is licensed under the terms of the Open Government Licence v3.0 except where otherwise stated. To view this licence, visit nationalarchives.gov.uk/doc/open-government-licence/version/3 or write to the Information Policy Team, The National Archives, Kew, London TW9 4DU, or email: psi@nationalarchives.gov.uk.
Where we have identified any third party copyright information you will need to obtain permission from the copyright holders concerned.
This publication is available at https://www.gov.uk/government/publications/analysing-data-cipfa-statistics-and-the-future-of-englands-libraries/analysing-data-cipfa-statistics-and-the-future-of-englands-libraries
1. About
This report was written by Joan O’Bryan with the help of the Libraries Taskforce, especially Sheila Bennett and Charlotte Lane. Additional support was generously provided by Julia Chandler, Ben Lee, Colin Gibson, Simon Richardson, and Sophie Lancaster.
A special thank you to the following interviewees: Carol Boswarthack, Diana Edmonds, Jacob Fredrickson, Beverly Hawkins, Jan Holden, Praveen Manghani, Joe Shaw, Samantha Sanford, and Hugh Waters.
The Libraries Taskforce provides leadership and assistance in reinvigorating the public library sector in England. The Taskforce is jointly sponsored by the Department for Digital, Culture, Media and Sport (DCMS) and the Local Government Association (LGA).
Joan O’Bryan is an MPhil Candidate in Public Policy at the University of Cambridge.
2. Executive summary
This report investigates one of the most referenced sources of data on British public libraries: the CIPFA Public Libraries statistics. This data, collected by the Chartered Institute of Public Finance and Accounting (CIPFA), is the primary source of information regarding long-term trends for libraries across the United Kingdom.
CIPFA data has been used by stakeholders and activists to support and debate the role of public libraries in England. However, the data is problematic in a number of respects, and as a result these public discussions may lack important insights into the current state of libraries across the country.
This report does 2 things: it analyses what we can learn from CIPFA data and discusses what we cannot.
First, using standardised CIPFA data, the report updates previously reported trends on behalf of the Libraries Taskforce. It also analyses the data to find other potentially useful correlations and trends beyond those traditionally discussed.
Second, the report describes the more problematic elements of CIPFA’s data collection. These include:
- discrepancies in data collection and reporting
- problems with the structure and accessibility of the resulting dataset
- ways in which the data collected fails to fully reflect the changing role of public libraries in the twenty-first century
Finally, this report makes recommendations for future data collection and analysis, with the Libraries Taskforce’s Core Dataset specifically in mind. By doing so, this report seeks to further the work of the Libraries Taskforce in accomplishing the vision set out in ‘Libraries Deliver: Ambition for public libraries in England 2016-2021.’
This report reaches the following conclusions:
-
Overall, the CIPFA data shows a continuing decline in public library use (both in visits and book issues) in England. But: a. The downward trend may be slowing b. The overall trend masks significant variations across and within library services
-
Over one quarter of all library services are trendbuckers, meaning they have shown an increase in use (visits or issues) over the past year and/or the past decade.
-
The report considers 7 arguments - including cuts, the digital shift, and the failure to modernise - posited as explanations for the overall trend of decline in use of libraries, using data to analyse them when possible. No one argument was found to be sufficient as an explanation for decline on its own.
-
Analysis of the arguments pointed at underlying (unmeasured) variables which distinguish the “high-performers” from the rest, namely forward-thinking leadership alongside the political support and purchasing flexibility needed to innovate in response to structural changes.
-
The second half of the report comments on the limitations of the data collected by CIPFA. The CIPFA statistics sheets were not designed to be a dataset, and have only been used as such due to the lack of any alternative national figures. The statistics sheets have significant flaws that undermine their ability to be used as a definitive and authoritative source of data on trends in public library usage over time. The flaws fit into 5 broad categories: issues with structure, consistency, accuracy, standardisation, and variable selection and measurement.
-
The flaws in the data impair our ability to understand trends at the national level in a comprehensive way. It may be possible to remedy this if all library services contribute in the future to a consistent and comprehensive open dataset, along the lines of the work currently being led by the Taskforce Team on implementing the collation and publication of the Core Dataset previously agreed by the sector.
3. Context
3.1 Statutory duties
The Public Libraries and Museums Act 1964 created a statutory duty for local authorities ‘to provide a comprehensive and efficient library service for all persons desiring to make use thereof.’ In doing so, library services must:
- Have regard to the desirability of encouraging both adults and children to make full use of the library service (section 7(2)(b)); and
- lend books and other printed material free of charge for those who live, work or study in the area (section 8(3)(b)).
Local authorities determine through consultation what local needs are, and work to deliver an efficient library service that meets the requirements of their communities within the available resources.
There are 4 types of local authorities in England who have responsibility for library services: county councils, unitary authorities, metropolitan districts, and London boroughs. In 2017, there were 151 local authorities responsible for library services.
Authorities choose to fulfil their statutory duties through a variety of organisational approaches. There are also libraries which are available to the public to use (some supported by a local authority) which are not included in a local authority’s statutory public library service under the 1964 Act. The Libraries Taskforce has created the following 4 categories to describe the different varieties of libraries in England:
- authority-run libraries
- commissioned libraries
- community-run libraries
- independent community libraries
Most common is the local authority-run library, in which the service point is funded, run, and managed by local authority staff. Some local authority run service points are funded and managed by the authority, but are unstaffed (for example book drops).
In the last decade, authorities have experimented with other approaches.
A commissioned library is part of the statutory service and funded by the local authority, but the running of the service has been transferred to a separate trust or organisation, such as a social or commercial enterprise.
A community-run library has some level of ongoing support from the local authority, but staff are volunteers and work is according to a joint agreement. Community-run libraries may or may not be counted as part of the statutory service.
Finally, an independent community library is managed by a non-local authority body and is outside the local authority statutory network.
In recent years, there has been a trend from authority-run libraries to a range of different delivery models. Examples of commissioned library services are the Bromley, Greenwich, Dudley, Wandsworth and Lincolnshire library services, which are run by Greenwich Leisure Limited, and the Torbay and Devon library services, run by Libraries Unlimited. Community-run libraries can be found in over 35 local authorities, including Bradford, Leicestershire, North Yorkshire, and many others.
3.2 The Libraries Taskforce
The Libraries Taskforce was initiated at the recommendation of the Independent Library Report for England (2014).
The report was the result of a seven-month investigation led by William Sieghart, and noted 2 themes: 1) the failure of previous reports to bring about meaningful change; and 2) the lack of understanding on the part of national and local leadership regarding the value of public libraries in England. Sieghart emphasised the need for national level strategy and collaboration: “A library’s great strength - its localism - must not be allowed to become its weakness.”
The Libraries Taskforce was created to be “the advocate for public libraries in England, including branding, promotion and the over-arching vision and narrative for the service.” To that end, the Taskforce released the strategy document, Libraries Deliver: Ambition for Public Libraries in England 2016 to 2021.
In the document, the Taskforce outlined its vision for the sector. In particular, it focuses on libraries as community hubs “bringing people together, and giving them access to the services and support they need to help them live better.” To achieve its vision, the Taskforce outlined 9 critical components of library development. This report contributes to the sixth component, ‘Helping libraries use better evidence to support decision-making’.
4. This report
The dominant narrative surrounding English public libraries is one of decline. Issues are down, visits are down, and libraries are closing, cutting hours, and replacing staff with volunteers. People have posited a number of root causes for the decline: cuts due to austerity, supposed mismanagement or apathy, the shift to digital and the general collapse of reading across the national.
But the question is: is it true?
We lack good data on how libraries are used and the changes they’ve been undergoing. Data at the national level is often incomplete, bolstered by estimations, or missing critical variables. Until the creation of the Basic Dataset by the Libraries Taskforce in 2017, there didn’t even exist a definitive list of all public libraries in England.
This report seeks to analyse the current state of public libraries in England through a closer inspection of authority-level data. By examining more closely the data we do have, we may find insights into which of the above claims are true, which are exaggerated, and which aspects have been underplayed or not analysed in depth before. In addition, this report looks at what the data can show us regarding common explanations for the perceived decline.
The data analysis also illuminates a path forward for public libraries in England. “Trend-bucking” library services, which have been identified as high-performing, are analysed to provide insight into the variables that most impact their success. In addition, selected library services are featured in case studies which explore some of the strategies that improving and successful branches have used to engage with their community. In follow-up to this report, the Taskforce should continue to interview and learn from the most successful libraries identified by this report in order to further good practices across the sector. The Libraries Taskforce blog provides a rich repository of good practice work thus far.
Finally, it is important to understand not only what the data tells us, but also what it does not. The available data has particular flaws and shortfalls which are highlighted in the second half of the report. However, lessons learned from this analysis will further research done on how best to measure the impact of social sectors such as libraries, and will assist the Libraries Taskforce as it builds a dataset of its own: the Core Dataset.
Libraries remain an important facet of life in England. In the financial year 2016 to 2017, libraries in England received more than 205 million physical visits, more than visits to Premier League football games, A&E services, and the cinema combined. Libraries are also omnipresent: there are more library service points in England than Costa Coffee restaurants or Boots pharmacies[footnote 1].
An honest, accurate, and detailed discussion about their future is critical to public life in England. This report both grounds and continues the conversation.
5. Methodology
5.1 The data
There are 5 sources of data about multi-year trends for public libraries in England.
The Department for Digital, Culture, Media and Sport (DCMS)
DCMS commissions, in partnership with Arts Council England, Sport England, and Historic England, the yearly Taking Part Survey to measure participation by adults and children in culture and sport, and uses subjective reporting by a representative sample of individuals to understand the national attitude towards the use of libraries. The data and findings on adult engagement are published every 6 months and a child report is published each year. Both are available on the Taking Part website.
The Library and Information Statistics Unit (LISU)
LISU at Loughborough University collects and compiles data on various subsets of libraries services, including fines, loans, and internet access. Additionally, LISU’s discontinued statistical series covered national trends, and relied heavily on CIPFA data (see below). Reports are available for purchase from their website.
The Public Lending Right Media Centre
It collects data from a sample of library authorities on the most popular authors and books issued annually in UK public libraries, coinciding with payment services to registered authors for each issue.
The Chartered Institute of Public Finance and Accounting (CIPFA)
CIPFA is a professional accountancy body dedicated to public finances, amongst other things, collects annually from subscribing local authorities across the UK data relating to public libraries. The data provides financial and non-financial information, and is collected at the local authority level. DCMS has provided funding for 6 consecutive years to enable public access to CIPFA’s comparative profile analyses of local authority library data in England. The statistics sheets are available for purchase on the CIPFA statistics website.
Nielsen BookData Online
Nielsen BookData Online is a proprietary service offered by Nielsen Holdings, a global information and measurement company. Originally, Nielsen measured book sales, but has recently moved into library services. Access is available for purchase on their website.
These datasets tend to focus on nationally aggregated data, with granularity often no finer than the level of the local authority. A national dataset at the library level does not yet exist. However, the Libraries Taskforce is working on a future source of such information: the Core Dataset, envisaged as a collection of data sourced from an aggregation of self-reporting, automatic pulls from Library Management Services (LMS), and website scraping. The Core Dataset orients its data collection on impact (centred on 7 desired outcomes outlined in the Libraries Deliver strategy document, such as improved digital literacy and greater prosperity) and would collect either at the library or local authority level, depending on data accessibility. The Core Dataset is part of a government-wide move towards open data, further elucidated in the Government Transformation Strategy of 2017.
The CIPFA statistics sheets are currently the most prominent dataset for understanding and furthering the national conversation around public libraries in England. CIPFA is regularly cited by activists, stakeholders, and journalists. This report analyses CIPFA at both the national and local authority levels.
5.2 Methodology
A note on CIPFA data
The figures collected by CIPFA are treated as data for the purposes of libraries research, though in fact, the CIPFA data wasn’t originally designed as a dataset, but rather as a public accountancy statistics sheet. However it is the only detailed source of longitudinal data available.
Quality problems afflict nearly all datasets, especially sizeable ones. The process of collecting a decade’s worth of information on over 170 different variables across 151 diverse local authorities (over 250,000 individual data points) is a massive undertaking, requiring painstaking time, attention, and effort. The criticisms in this report should therefore not be read as impugning the work of CIPFA, but rather as feedback for further improvements in data concerning public libraries in England.
Trends
All figures in this report are drawn from CIPFA’s yearly datasets, unless otherwise stated. CIPFA figures have been standardised for all trends, both across years and within years. To standardise figures across years, all library services have been sorted using their respective ENumber, a tax identification categorisation, in order to avoid inconsistencies in authority names. Authorities which have merged or separated in the past 10 years have been excluded. The City of London (E5010) has also been excluded from all statistics, due to a change in how its population served has been measured. To avoid the inaccuracies that come with estimation, authorities who decline or fail to report data in a given variable are also excluded from analysis regarding that variable.
As a result, this report uses proportions whenever possible. Raw numbers will reflect only the reporting sub-set of local authorities, and will not be nationally representative.
The rationale for this standardisation is that the trends here attempt to compare “like with like” and avoid the inaccuracies that occur when estimation is required to replace missing or faulty data.
The disadvantage to this strategy is that it may fail to account for the various reasons that local authorities do not report data, such as particularly low figures in one year. There is also a possible bias towards services with more resources, as they are the ones most likely to have the staff to pursue the relevant figures. However, this problem remains for CIPFA’s estimated figures as well, and is further discussed in the data analysis sections.
Because the data has been aggregated in such a way as to avoid estimations or blank spaces (from unreported or corrupted data), whenever possible graphs are displayed as “percent of” or “percent change from”. The focus is to report on trends and correlations; as a result, raw numbers may be misleading. For example, only 100 of 151 library services have reported visit and issue data across all 10 years. As a result, total visits are hundreds of thousands below the aggregate numbers reported by CIPFA. However, the trend line demonstrated is more likely to be accurate, as it measures directly like against like.
Issues with the data
To analyse discrepancies, possible inaccuracies, and missing elements of the dataset, this report relies on a variety of methods, including interviews with library authorities and researchers, analysis of CIPFA’s own commentary on its data, and the collating of the data against local authority websites.
6. Trends
6.1 Visits and issues
The most recent CIPFA figures confirm a continued trend of declining library use. For the 100 library services reporting across all 10 years, total issues (including books, audio-visual and other) and total visits have declined by 38% and 28% respectively. It is important to note that despite the standardisation of figures across years, discrepancies in figure collection remain (see Inconsistencies).
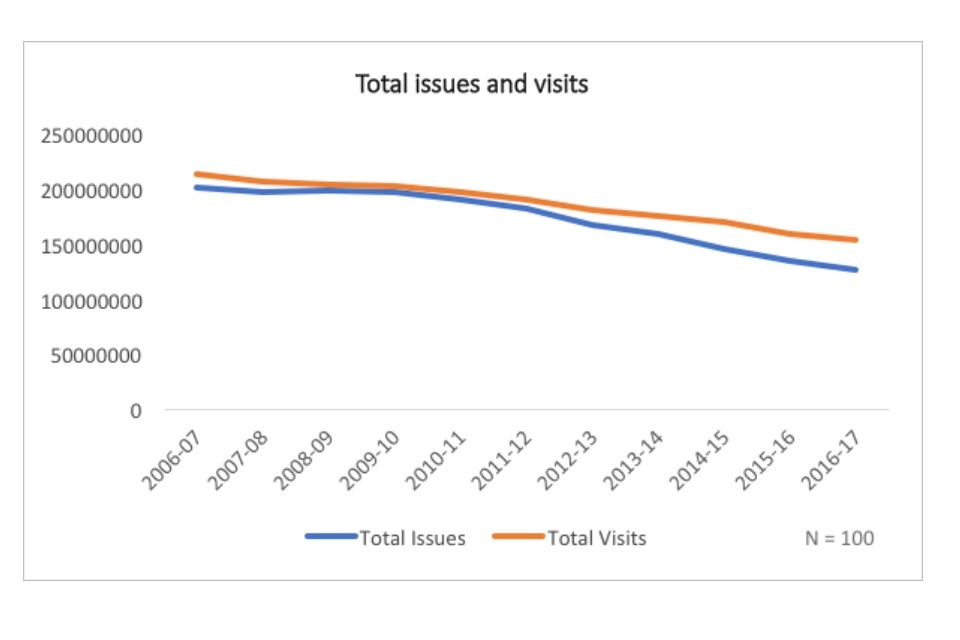
Graph showing total visits and issues for libraries
Although the trend is downward, the narrative is not entirely negative. Issues and visits are still declining, but are doing so less rapidly, and declines may continue to slow in future years. In 2016-2017, issues and visits declined by 4% and 3%, relative to 2006-2007 figures, compared to all-time maximum decreases of 8% and 4% respectively.
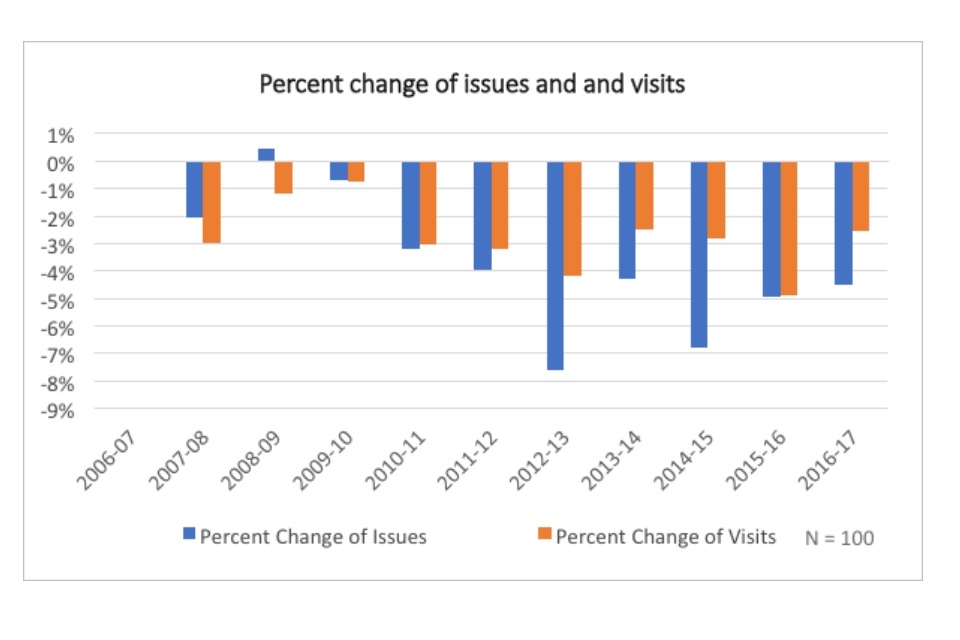
Bar chart showing percent change of issue and visits
In addition, the overall trends mask variations among individual library services.
In assigning library services to quintiles, based on their percent change in 2016-2017 data from 2006-2007, one can see that the top quintile in both visits and book issues outperforms the others significantly[footnote 2]. There is a 60-point distinction between the top and bottom quintiles by visits, and a 38-point distinction between the top and bottom quintiles by book issues.
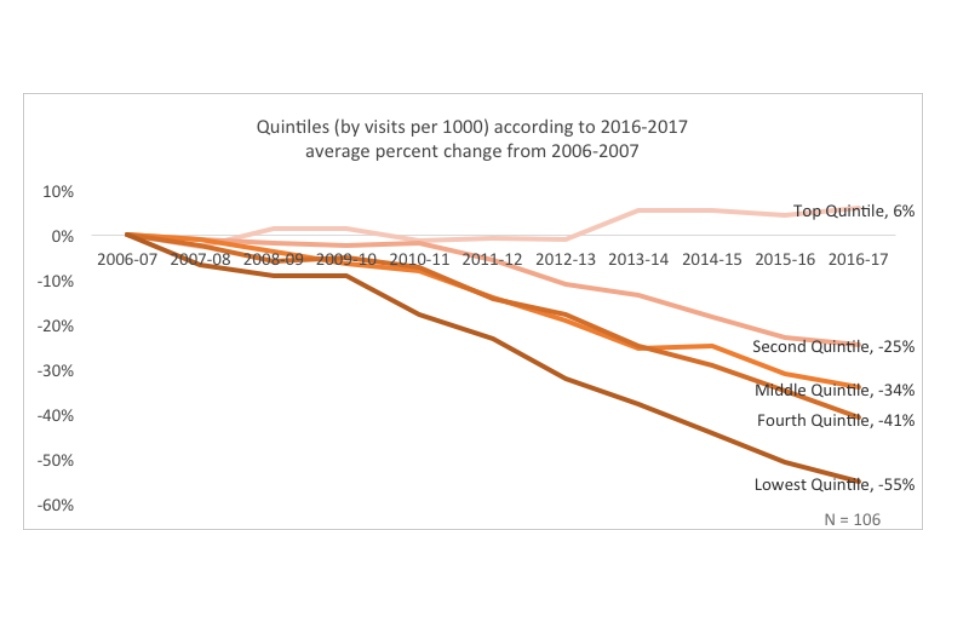
Line graph showing quintiles (by visits per 1000) according to 2016-2017 average percent change from 2006-2007
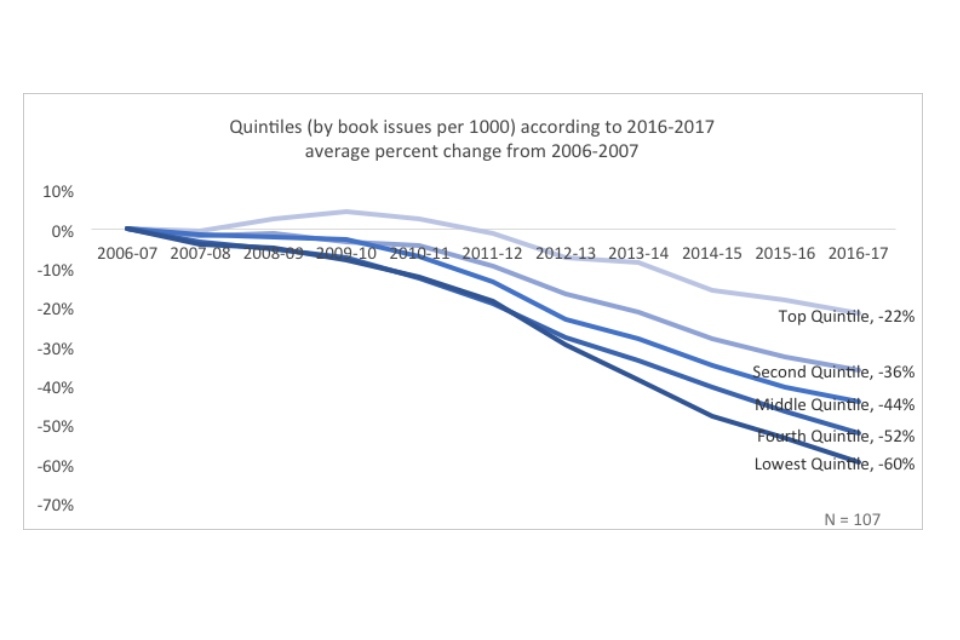
Line graph showing quintiles (by issues per 1000) according to 2016-2017 average percent change from 2006-2007
Within the context of the overall dramatic declines in both visits and book issues, the existence of well-performing quintiles indicate that in some cases library services have found ways to buck the national trends. Especially notable is the existence of a positive trend for the top quintile in visits. When this is compared to the fact that the best performing quintile in book issues have only decreased the trend of decline (22% versus 38% overall), rather than reversing it, the graphs may indicate that there has been a significant shift in the way people use their library services.
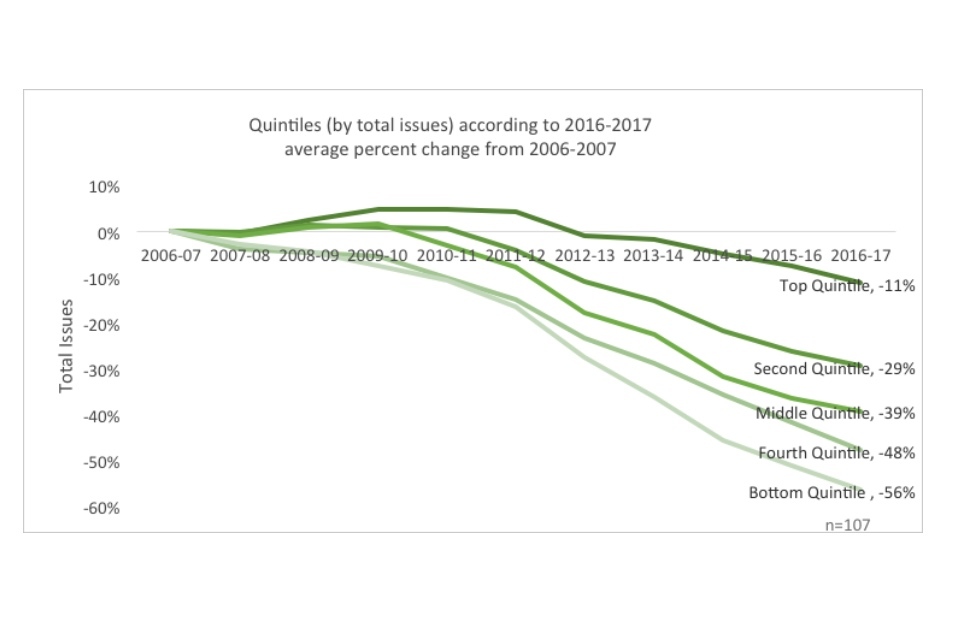
Line graph showing quintiles quintiles (by total issues) according to 2016-2017 average percent change from 2006-2007
Finally, although this report focuses on the issue of books (unless otherwise noted) [footnote 3], it is important to see that when all issues are taking into account (including audio, visual, electronic, and other), the decline in issues is also tempered. For instance, the increasing issues of e-books (graphed below) offsets part of the decline in book issues.
Some types of issues, especially digital, have increased, although the data is too patchy to create quintiles on the basis of average percent change. For instance, many library services only began reporting e-book issues in the last 3 years, making it difficult to calculate percent change over a reasonable time range. It also makes it difficult to know when a nil value indicates that a library service does not offer e-books or simply hasn’t reported e-book data. Therefore, to indicate the change in e-book issues, the following graph uses raw numbers beginning in 2011-2012.
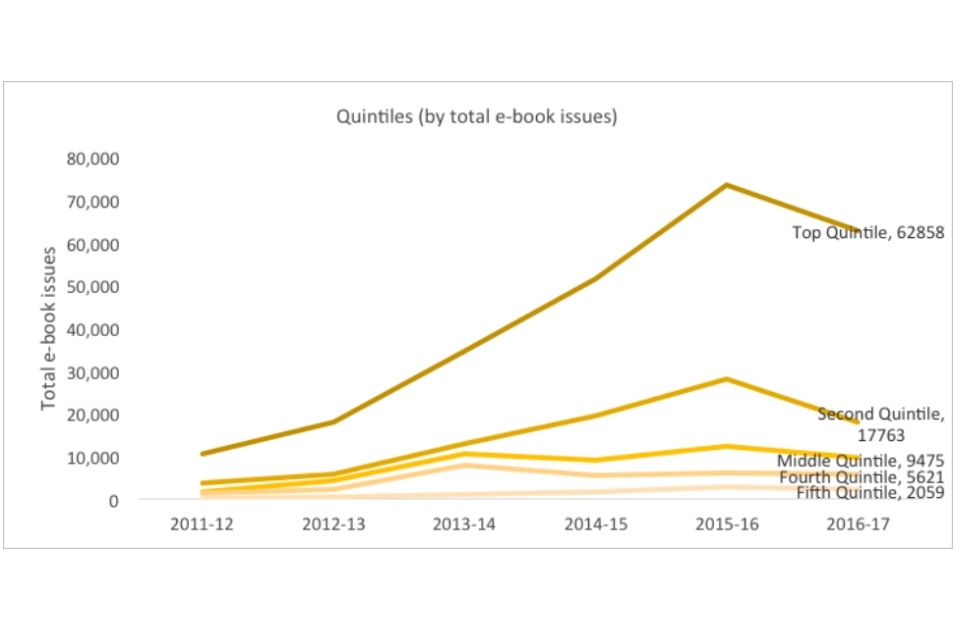
Graph showing quintiles (by total e-book issues)
For the 117 library services with data available in the years 2006-2007, 2015-2016, and 2016-2017, there are:
- 10 library services with an increase in visits per 1000 population over the last 10 years (Fig. 7)
- 1 library service with an increase in book issues per 1000 population over the last 10 years (Fig. 8)
- 32 library services with an increase in visits per 1000 population over 1 year (Fig. 9)
- 10 library services with an increase in book issues per 1000 population over 1 year (Fig. 10)
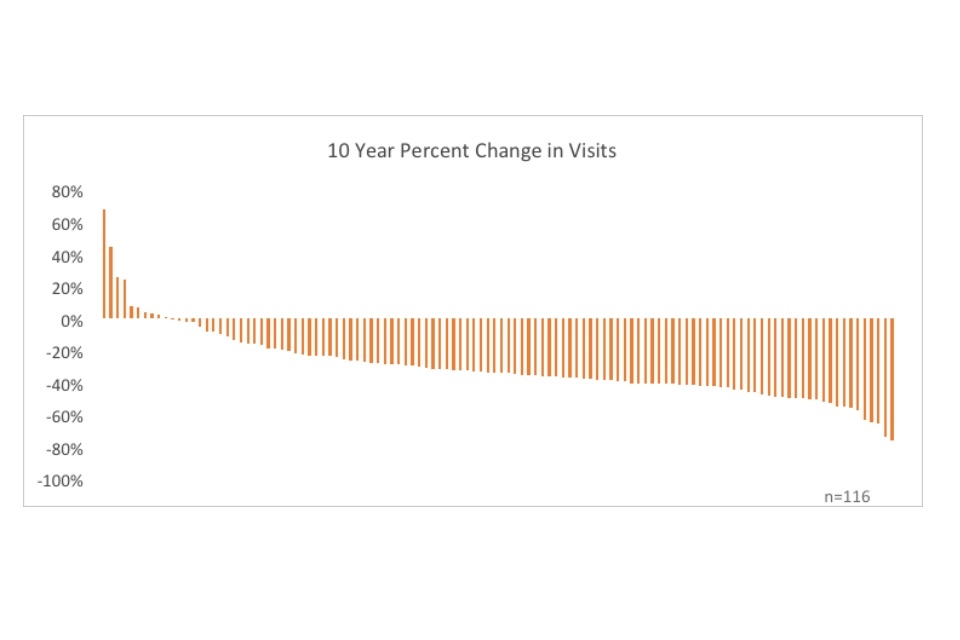
Graph showing 10 year percent change in visits
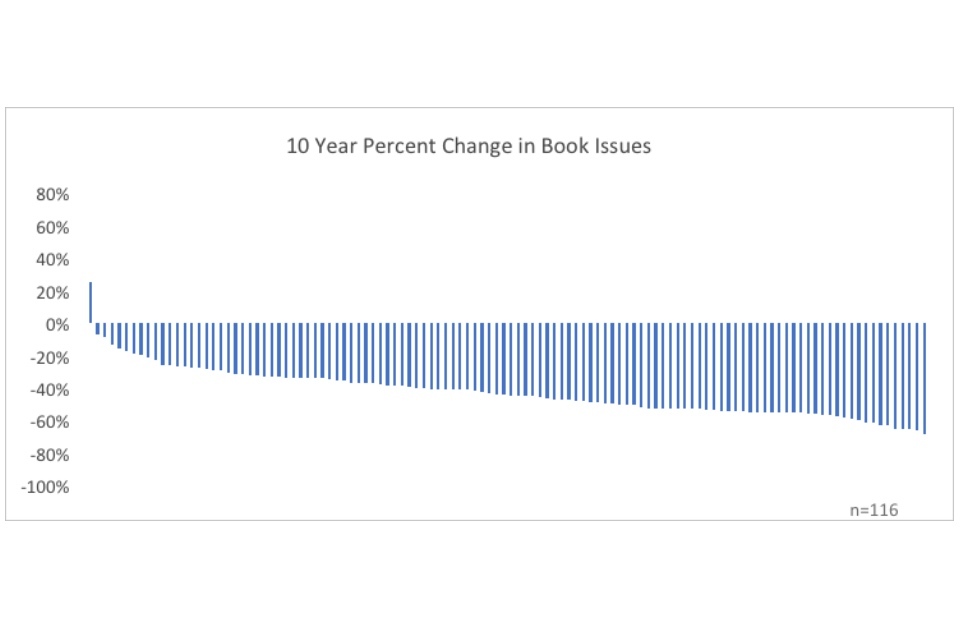
Graph showing 10 year percent change in book issues
These library services with positive growth in visits and book issues are known as “trendbuckers.”
Supporting the visits and issues data, these graphs show that there is far greater downward pressure on book issues than visits, as more individual library services were able to increase their visits than their issues over the ten-year time frame.
Over a fifth of library services have shown a percent increase from the year before in visits, but only one fifteenth have demonstrated growth in issues from the year before (a three to one ratio).
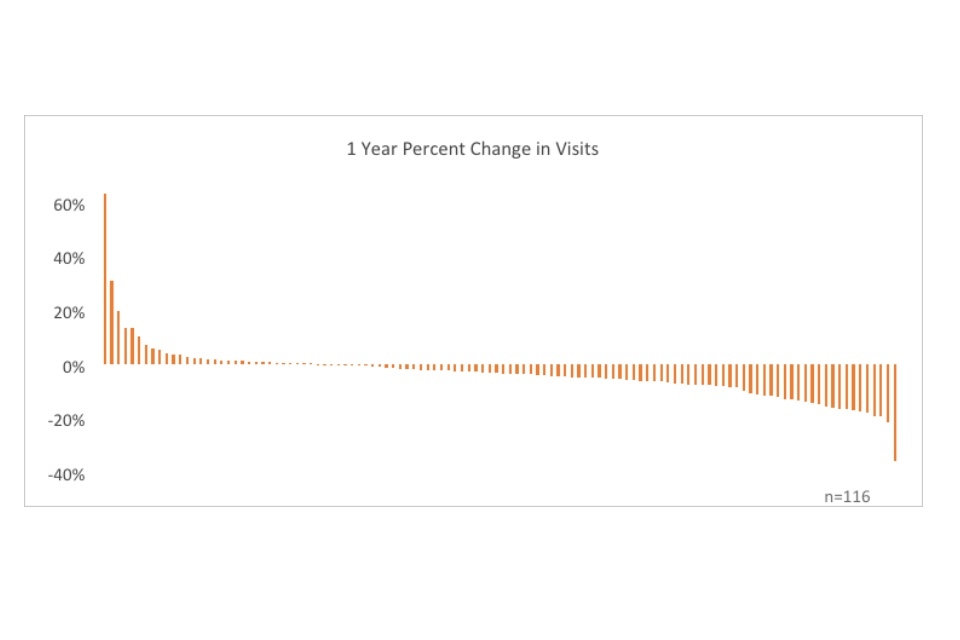
Graph showing 1 year percent change in visits
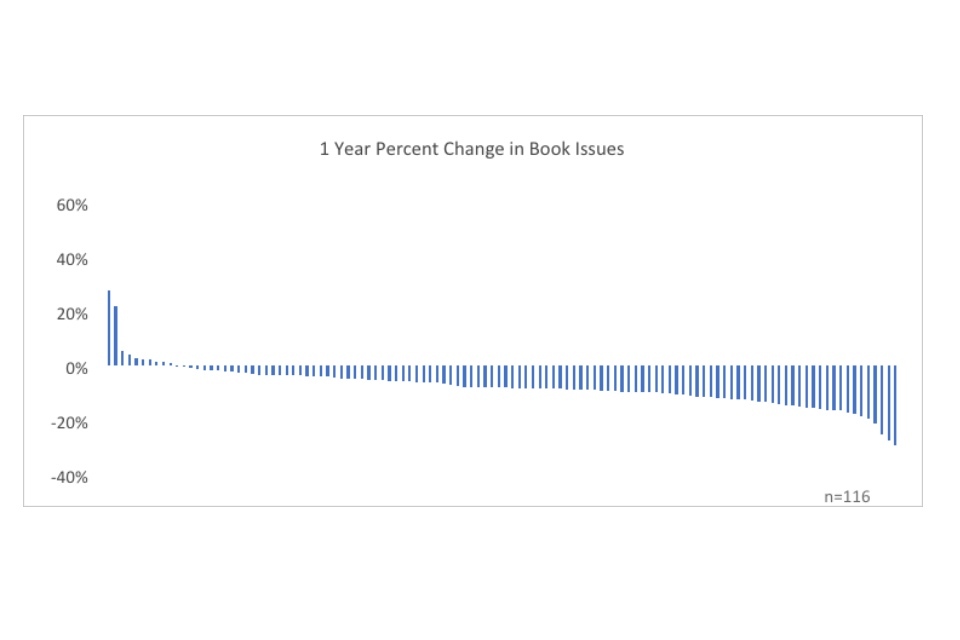
Graph showing 1 year percent change in book issues
More library services have improved their visits and issues statistics over the past year (between 2015-16 and 2016-17) than over the past decade (between 2006-07 and 2016-17). This may indicate that the ability to improve is growing, as more library services alter their services in response to changing use patterns. For reasons why these trends might be changing, see What do successful libraries have in common?.
Additionally, rates of use vary not only between library services, but also between the libraries in each service. CIPFA records for each year the names and figures of the best-performing individual libraries within each library service. Examining these “most popular” libraries can show which trends reflect the actions of the library services themselves, as opposed to trends which reflect the changing nature of society (and may be therefore less controllable).
For instance, the decline in visits for the most popular libraries is sometimes half as much as for the nation as a whole. This indicates that individual libraries are able to push back against the downward trend.
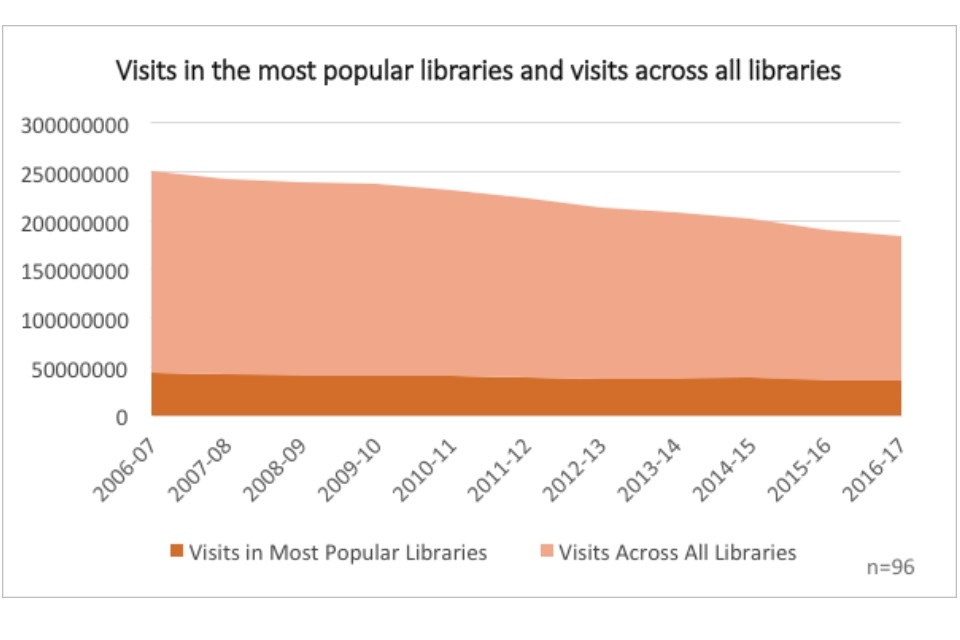
Graph showing visits to the most popular libraries and visits across all libraries
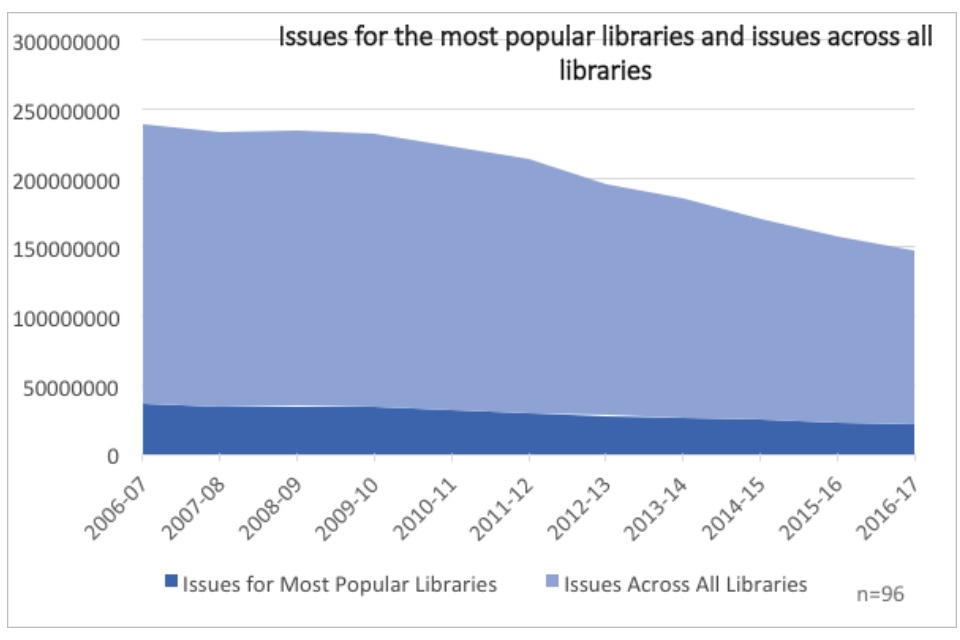
Graph showing issues for the most popular libraries and issues across all libraries
| 10-year change | 5-year change | 1-year change | |
| Visits for most popular libraries | -19% | -10% | -3% |
| Visits across all libraries | -28% | -20% | -3% |
| 10-year change | 5-year change | 1-year change | |
| Issues for most popular libraries | -42% | -29% | -5% |
| Issues across all libraries | -38% | -31% | -7% |
Especially interesting to note is that although most popular libraries outperform public libraries in England as a whole in visits, this is not the case for issues. Over 10 years, the most popular libraries (so the libraries with the most total issues out of all libraries in each service) actually underperform slightly when compared to all libraries. This may indicate that success or failure in issues depends on the library service as a whole, rather than on any one library. It might be that because libraries share materials across the service, libraries cannot become successful individually, as they depend on the resources of the service as a whole. (As opposed to visit-popular libraries, where refurbishment of one library can substantially impact its performance, without requiring the refurbishment of the other libraries).
The existence of trendbuckers, as well as the evidence of variation within library services, is evidence of a national library service with the capacity for resilience.
6.2 What can we learn from the data?
There are 7 arguments commonly posited to explain the decline in visits and issues for England’s libraries.
- The ‘cuts’ argument: declining investment makes for lower quality product, resulting in declining repeat use.
- The ‘failure to modernise’ argument: library leaders have failed to innovate in response to changes in service demand, which prevents the acquisition of new users and hinders repeat use.
- The ‘time poor’ argument: usage has declined because libraries face increased competition with a wider range of leisure-time options and work commitments
- The ‘digital shift’ argument: changes in consumer behaviour, and particularly channel shift away from print and towards digital, have left the ‘physical library’ obsolete.
- The ‘changing use’ argument: the way people use libraries is changing, but current metrics are failing to pick up these patterns of altered use.
- The ‘failure to market’ argument: library leaders have neglected targeted marketing to engage traditional non-users and new customers.
- The ‘fragmentation’ argument: devolution by the national government has made it difficult to manage and strategise across English libraries (as one would a national retail chain).
Some of these arguments may share underlying variables, such as library leadership, political or other authority decision-making priorities, and demographics. These underlying variables may explain why some library services have been vulnerable to structural factors, such as cuts or the digital shift, whereas other library services have been able to buck the trends.
The most prominent trend that emerges across the arguments is the distinction between the “early bird” and the “Johnny-come-lately” – the more successful libraries tend to be early adopters, meaning that they recognise and respond to shifts in customer desire. To be a successful early adopter could require the following components: support from outside decision makers, ability to budget over the long term, and a library leadership open to innovation and risk-taking. These variables are as of yet unmeasured by the CIPFA statistics sheets, but there are some proxy variables which are further examined in What do successful libraries have in common?.
The data collected by CIPFA cannot definitely prove or disprove any of the arguments above. However, it can provide some insight into their relative merits. Overall, this report finds that no single argument alone can account for the overall trends seen in public libraries in England.
The ‘cuts’ argument: declining investment makes for lower quality product, resulting in declining repeat use
There is some correlation between declining expenditures and declining visits and issues. Visits and issues were in decline before expenditure cuts began, but after 2011-12 when expenditures began falling consistently, declines in visits and issues nearly correlated declines in expenditure. Notably, declines in book issues always outpaced declines in expenditures, whereas declines in visits were occasionally below declines in expenditures. This once again indicates a stronger downward pressure on book issues than visits.
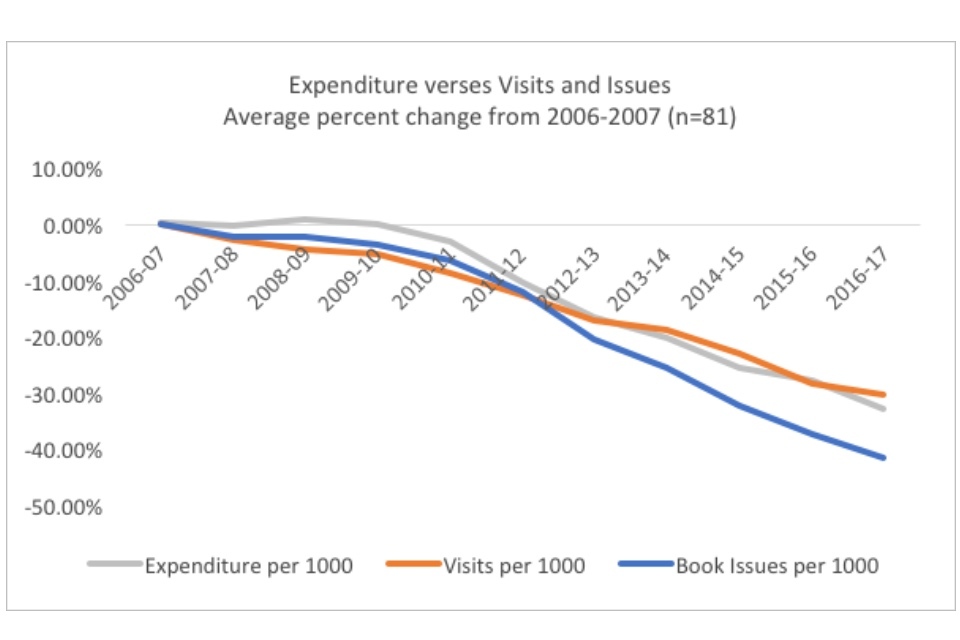
Graph showing expenditure verses visits and issues: average percent change from 2006-2007
Once again, the overarching trend masks variation between individual library services. The following graphs use quintiles to demonstrate trends at a more granular level. Each quintile was determined by looking at the percent change between 2006-2007 and 2016-2017 and sorting the data according to the best and worst performers in the relevant variable.
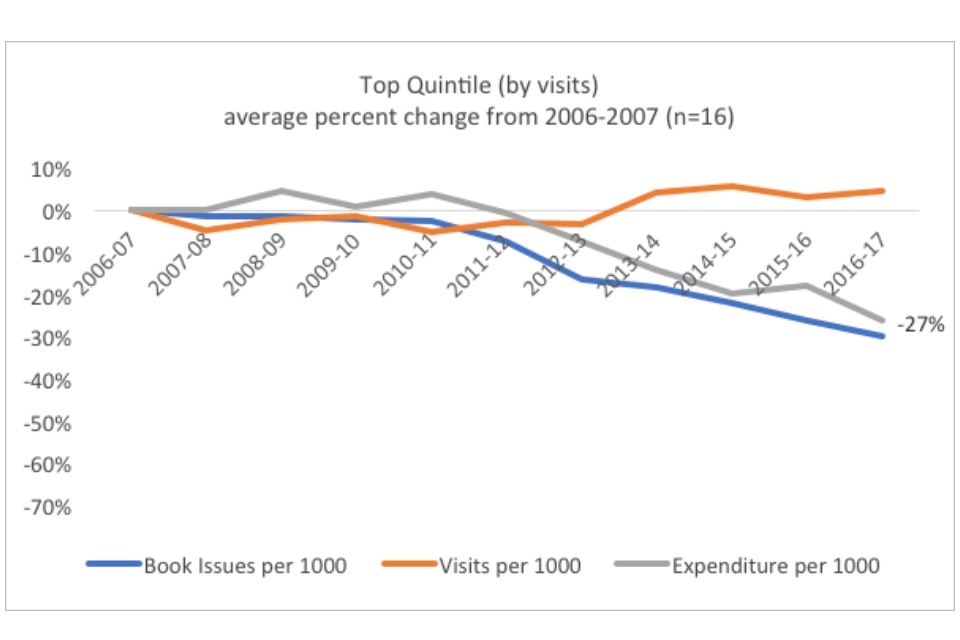
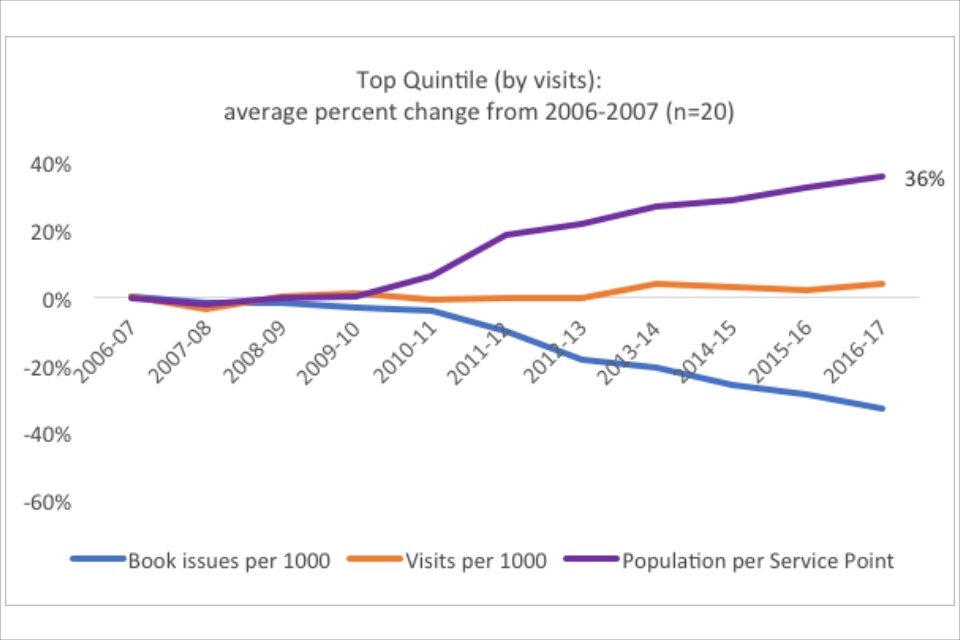
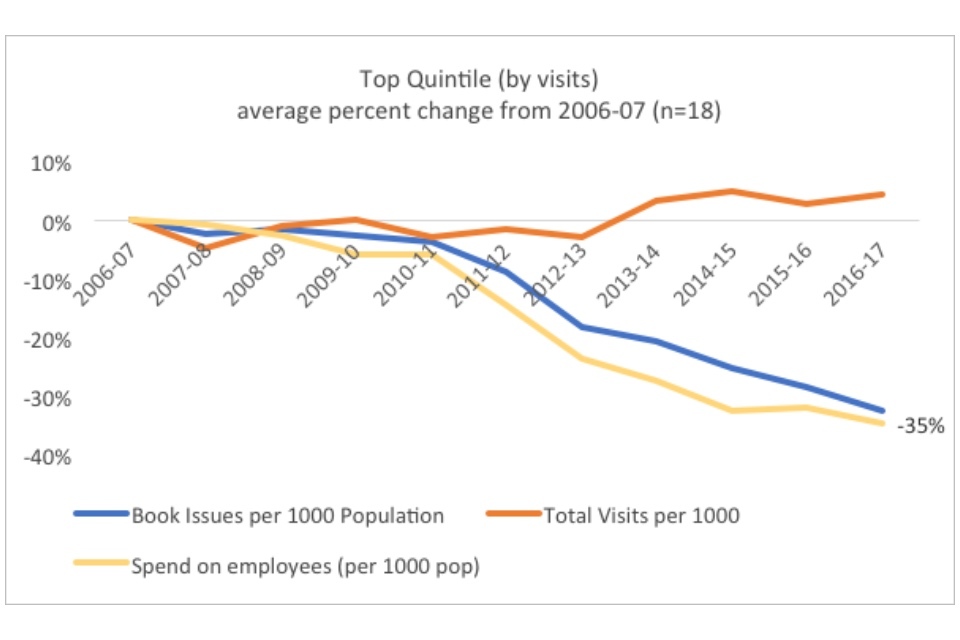
Graph showing the top quintile (by visits): average percent change from 2006-07
The top quintile in visits had a somewhat better average percent change in expenditure per 1000 residents than the bottom quintile (-27% versus -36%), a difference of 9 points, but their average percent change in visits per 1000 residents (5% versus -56%) was much higher, resulting in an over 60-point difference.
In the top quintile, visits and expenditures were fairly consistent from 2006-2012, although slightly higher spending did not result in higher visits. However, when expenditure began to decrease (roughly around the year 2012), visits actually began to increase.
One reason for this might be the government’s 2012 “digital by default” strategy, which encouraged users to apply for services online. As a result, people may have increased their visits to use wifi or library computers. However, visits in the bottom quintile did not see an equivalent jump in 2012. In part, this could be explained by the difference in wifi provision (by 2013-2014, over 80% of service points in the top quintile had wifi, as opposed to just over 50% of service points in the bottom quintile). The top performers would therefore have been better positioned to take advantage of the change in government policy.
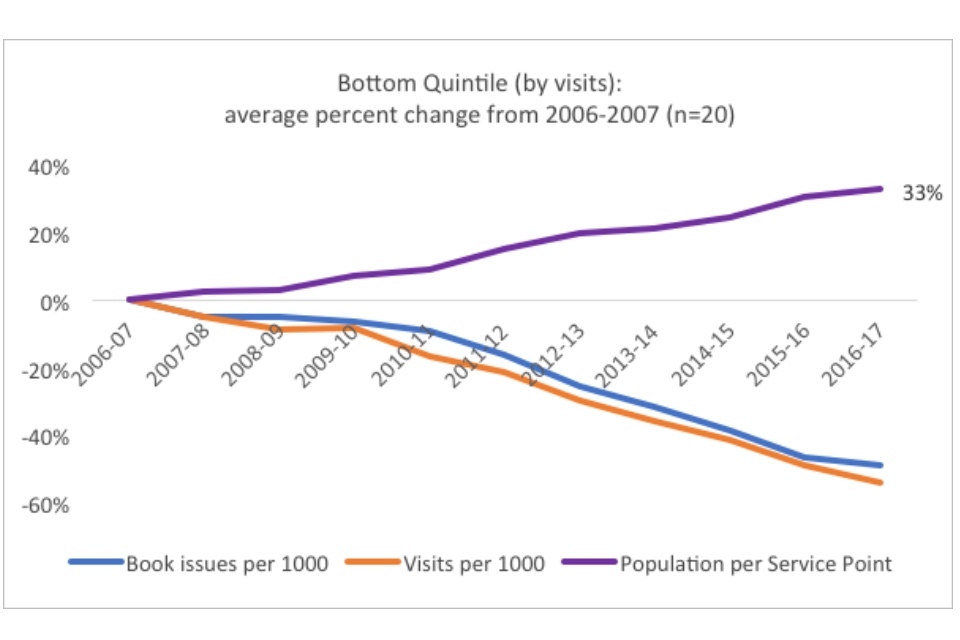
A breakdown of correlations of other possible explanatory variables (wifi, book acquisitions and hours open) can be found further below.
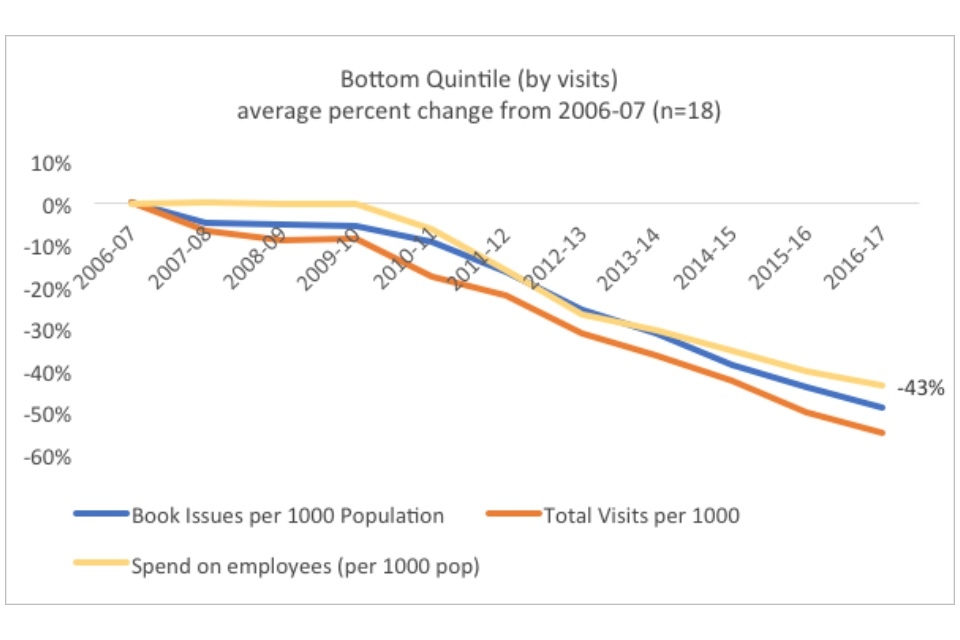
The bottom quintile by visits was more likely to be affected by budget cuts, as evidenced by the earlier and steeper decline of expenditure. Consistent expenditure across the years 2006 to 2010 was still associated with a fairly continuous decrease in visits, implying that these services struggled to attract visitors before budget cuts began. After expenditure began to decline, visits decreased precipitously and declined at a faster rate than expenditure. For instance, in 2010-2011, expenditure declined by 6% of 2006-07 figures, while visits declined by 19%. Five years later, those figures were 30% and 52% respectively.
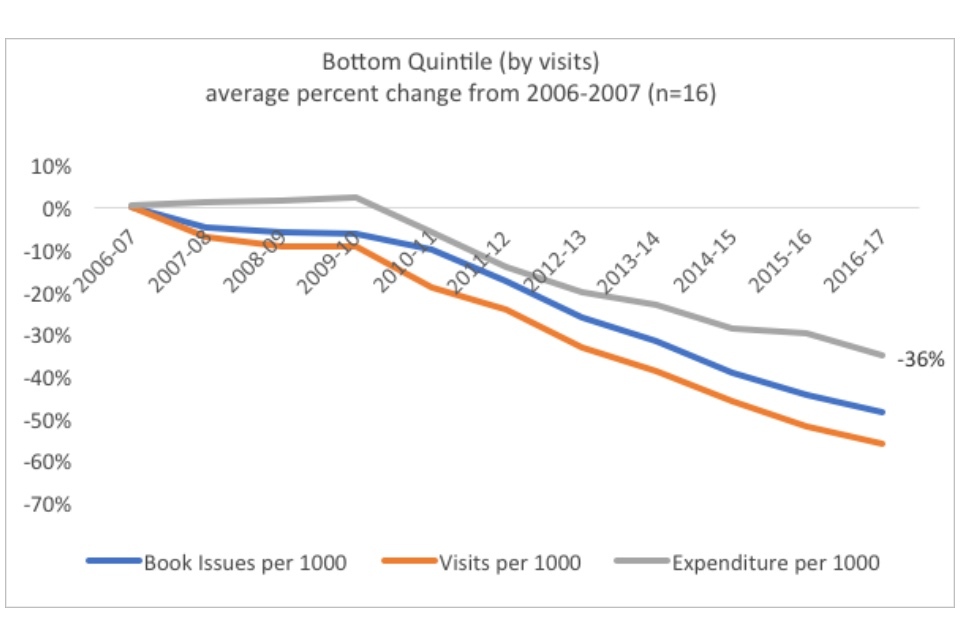
Graph showing the bottom quintile (by visits): average percent change from 2006-07
In terms of visits, then, the cuts argument does not hold. Decreasing expenditure can exacerbate already existing trends of decline but does not necessarily result in fewer visits across the board.
For libraries with the strongest issue records, the evidence is more mixed. In the top quintile by book issues, an increase in expenditure before 2010-11 does have a small association with an increase in lending. However, when expenditure began to decline in 2010-2011, issues declined at a lower rate than expenditures. For the bottom quintile, there is no point at which book issues held constant or increased. Even when expenditure held constant, issues declined. As expenditure declined, issues declined still further.
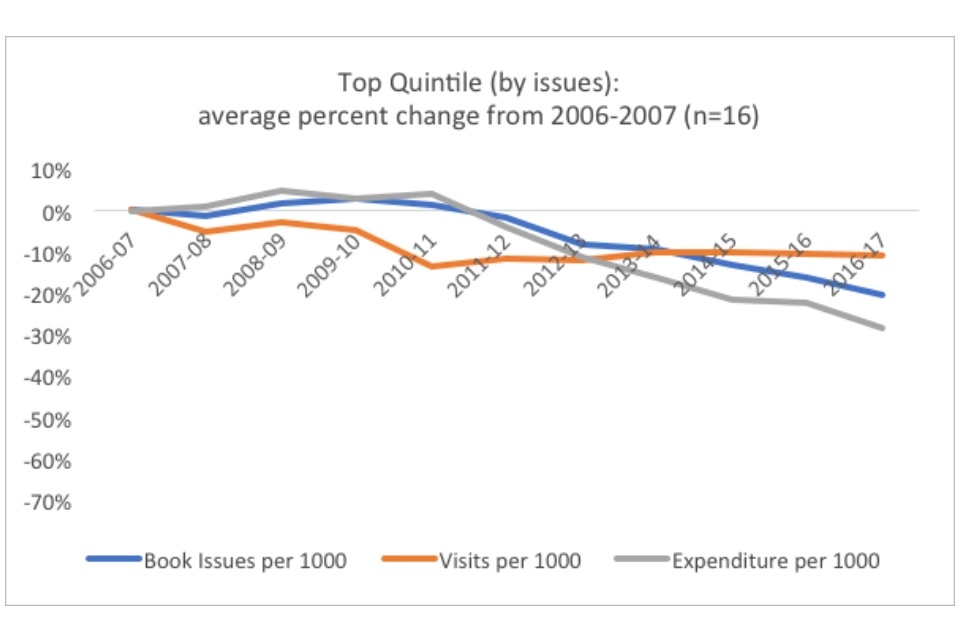
Graph showing the top quintile (by issues): average percent change from 2006-2007
Once again, it seems as though expenditure decreases can exacerbate other trends but are not alone sufficient to account for the overall decline in issues. Other factors, further investigated below, seem to enable some library services to outperform budget cuts.
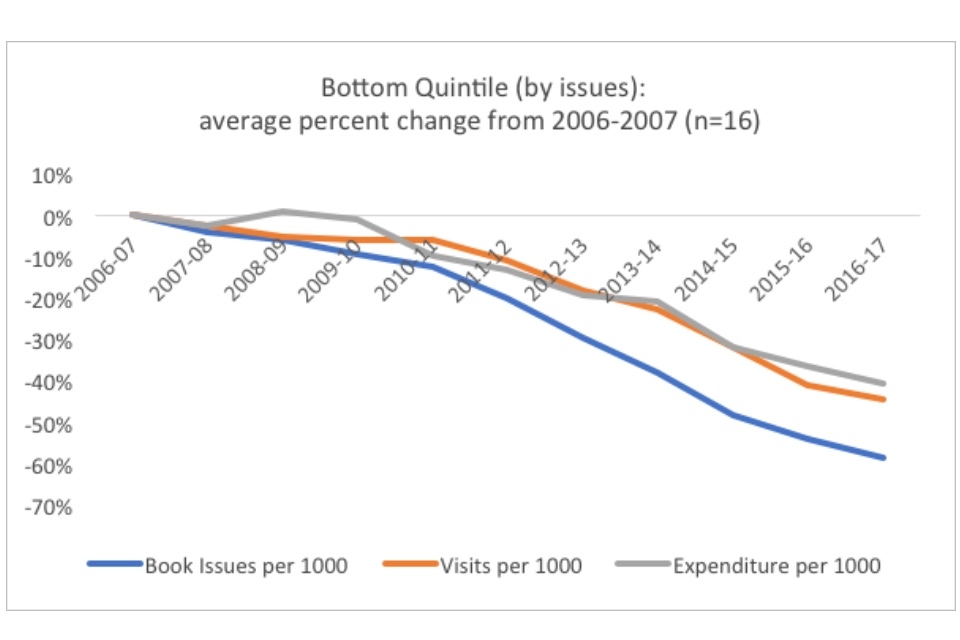
Graph showing the bottom quintile (by issues): average percent change from 2006-2007
These graphs do highlight the fact that better performing libraries often have maintained expenditures for longer periods of time. For instance, in the top quintile by book issues, expenditure did not begin declining until 2011-12, whereas in the bottom quintile by book issues expenditure began declining in 2009-10. This may reflect the influence of a third (unmeasured) variable regarding library success: prioritisation by local political actors. Earlier expenditure cuts may reflect that the library services in the bottom quintile are valued by political decision-makers less than library services in the top quintile are by their respective decision-makers, and it is the political support that makes the difference for resilience in the face of cuts. However, political support is not measured by CIPFA data, and further research is required.
Another factor that has been affected by cuts to service budgets is library accessibility. Some services have closed libraries, whereas others have decreased hours. Lowered accessibility may be responsible for the decline in use. However, one counterargument has been the “fewer but better” thesis: fewer libraries that are each better resourced can provide more desirable services than more libraries splitting the same amount of resources.
Case study: Brent libraries
The “fewer but better” approach has undergirded Brent’s Libraries Transformation Project (2011). According to James Powney, formerly a councillor in the Brent London Borough Council, the service “responded to central government cuts by concentrating our resources on a smaller number of improved buildings.”
Brent closed half its libraries and reduced its overall budget, but funnelled resources into the remaining buildings. Opening hours were extended to 7 days a week. In particular, 3 libraries (Kilburn, Wembley, and Willesden) were given major capital investment, resulting in designs that more easily accommodated wireless technology and the changing nature of library visits: large spaces for events and separate areas for quiet versus noisy visitors (such as students and children, respectively).
Recent evidence has indicated the project’s success. Annual visits have increased 4.5% over the year before, another point in a continuously upwards trajectory since the project’s initiation. Book loans have increased, though not continuously, since 2011, demonstrating still more trend-bucking potential.
It is questionable whether one can prove this “fewer but better” thesis using the CIPFA data. One possible way is to see if closures impact usage statistics.
CIPFA measures the population per library service point open 10 or more hours a week. As closures and cutbacks have affected library services, the population served by each individual library has increased. Libraries serve on average 33% more people per service point open 10 or more hours a week than they did a decade ago. Some of this change may include population growth (the UK has a whole experienced a population increase of just under 8% over this time period).
Graph showing the top quintile (by visits): average percent change from 2006-2007
Graph showing the bottom quintile (by visits): average percent change from 2006-2007
If the “fewer but better” argument held, one would expect to see that better performing library services would demonstrate larger increases in population served per service point.
However, the difference (36% verses 33%) isn’t very large. Though the higher performers do have slightly higher increases in populations per service point, it isn’t a large enough discrepancy to fairly draw inferences. Especially because better-performing libraries tend to be associated with urban areas, the higher population increase may simply reflect that these authorities have faster-growing populations due to urban demographics.
Another aspect of the “fewer but better” argument to explore is the effect of changes to opening hours. It may be that the ten-hour mark is an incorrect cut-off point. There has been political pressure to prevent the proposed closure of libraries, and some councils may see it as more politically expedient to decrease hours across libraries rather than completely close libraries.
The difference would be visible between libraries open 60 hours or more and those open less than 60 hours. The following graph looks at the top and bottom quintiles of libraries by visits to determine patterns in their opening hours.
There is an association between the number of libraries with long opening hours and the percent change in visits for the library service as a whole. The library services who perform better in visits also have a higher percentage of their libraries open for more than 60 hours a week (15% of all libraries in the top quintile, compared to 1% of all libraries in the bottom quintile).
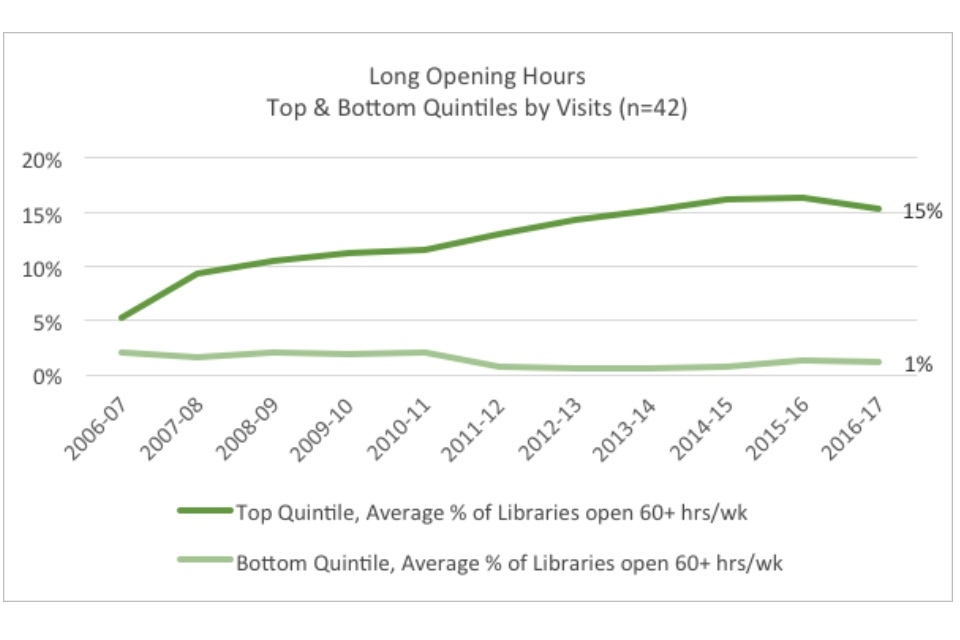
Graph showing long opening hours: top and bottom quintiles by visits
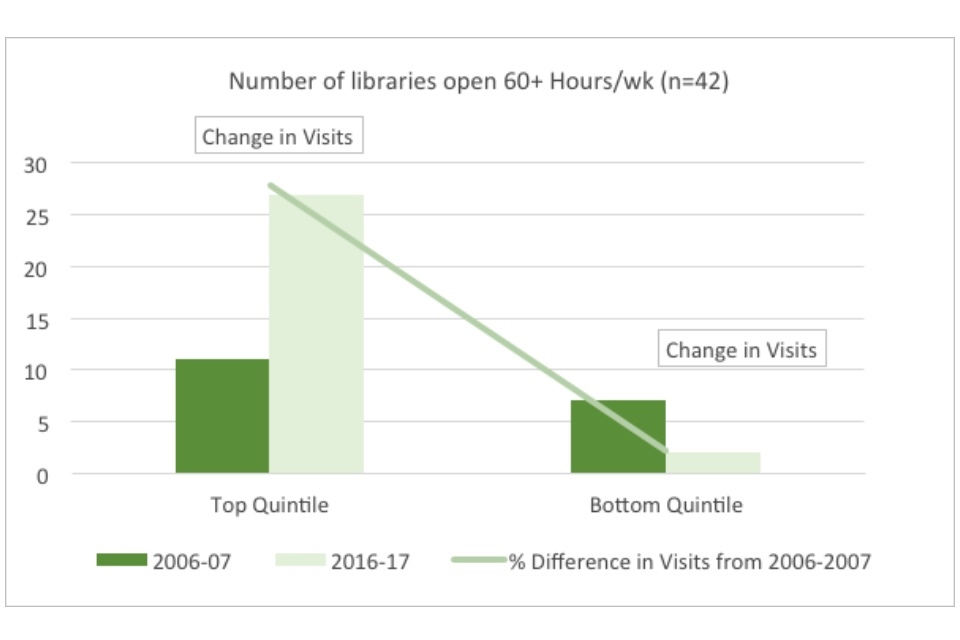
Graph showing the number of libraries open 60+ hours per week
Interestingly, the top quintile increased the percent of its libraries open 60+ hours/week the year following a dip in visits, as demonstrated by Figure 22, indicating that the change in opening hours may have been in response to perceived declines in visits. This indicates that local leadership may have the flexibility required to respond to changes in consumer demand.
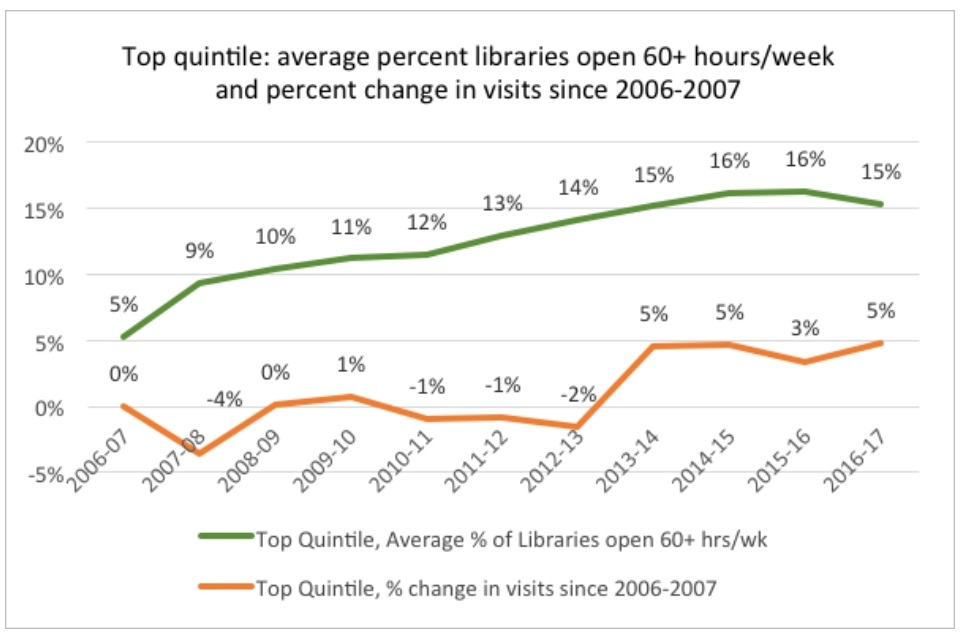
Graph showing the top quintile: average percent libraries open 60+ hours/week and percent change in visits since 2006-2007
Measuring population served and hours open does not give a complete picture of whether or not the “fewer but better” thesis actually results in improved usage. Further research is required to distinguish between indicators of what may be thought of as the “fewer but better” versus the “fewer but dying.”
One hotly contested outcome of budget cuts has been its impact on the number of staff in libraries. CIPFA measures the “full time equivalent” staff in position at a point in time. A full-time equivalent is an integer or a fraction representing the number of hours per week that position holds. For instance, a 40-hour per week employee counts as 1, whereas a 20-hour per week employee counts as 0.5. CIPFA measures 2 categories of staff: staff in professional posts and staff in all other posts.
‘Professional’ posts are defined as those for persons holding formal qualification in librarianship or information science, or for persons who have completed their qualifying examinations. All ‘other’ posts include administrative, clerical, and general duties plus posts for individuals with library certificates, but it does not include contractors.
Across public libraries in England, total staff has declined by 45% since 2006-07.
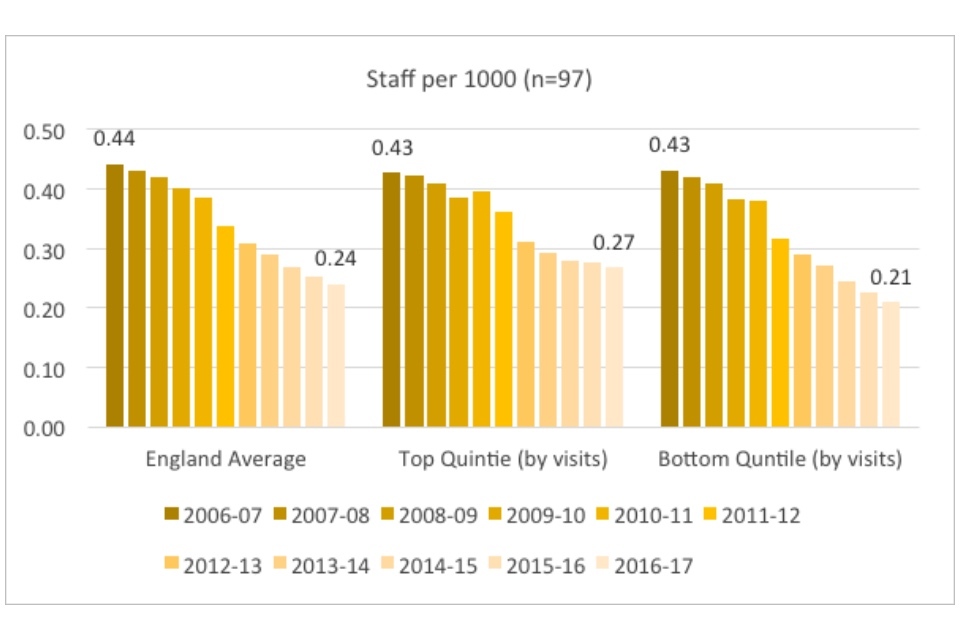
Figure 23: Staff per 1000 population: averages for England, top quintile and bottom quintile (by visits)
When looking at the raw statistics, the difference between the top and bottom quintiles in total staff do not appear large. Both groups started with an average of 0.43 FTE staff per thousand (roughly equivalent to 157 staff members for a population the size of the average authority).
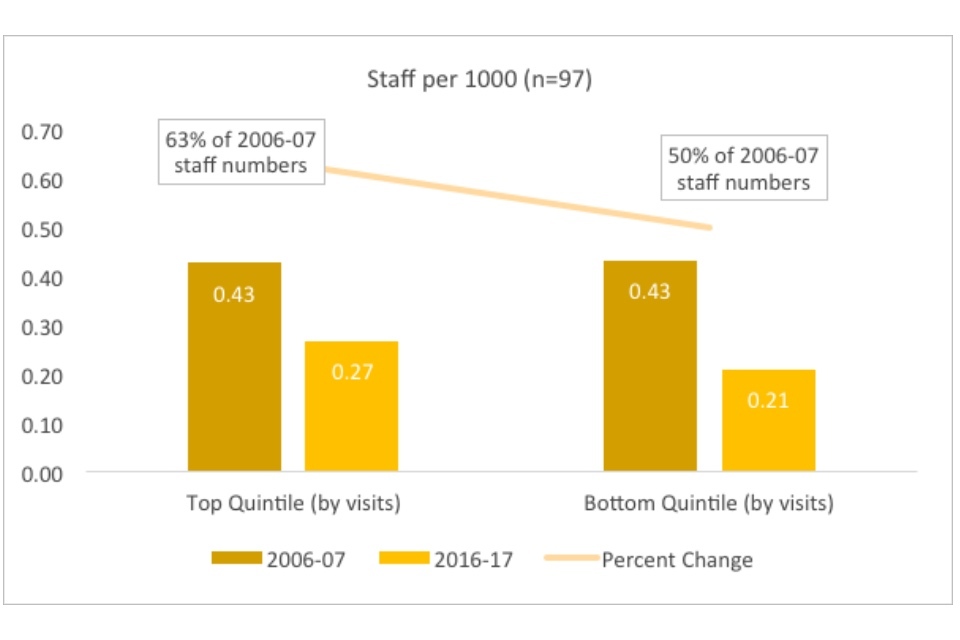
Figure 24: Staff per 1000 population: top quintile and bottom quintile (by visits)
The top quintile declined to 0.27 staff members per 1000, whereas the bottom quintile declined to 0.21. Although the raw numbers appear similar, they are actually equivalent to a 21-person difference (98 versus 77 FTE) between staff sizes for an authority of the average population size (roughly 368,000).
The top quintile began in 2006-07 with a staff roughly two-thirds on average the size of the bottom quintile. This may indicate a number of things. Most likely, given the research done on trend-buckers, this is because higher-performing library services are located in dense, urban areas where fewer staff are required to manage fewer - and more easily accessible - buildings.
‘Professional’ staff have declined more on average than ‘other’ staff (44% versus 32% since 2006-07). There are 2 possible reasons for this. First, ‘professional’ staff are more expensive than ‘other’ staff and libraries have been struggling with budget cuts (the “budget thesis”). Second, as library services move away from traditional services towards other services, such as events and space reservations, the desired skillset may have changed, making ‘other’ staff positions more valuable (the “changing hiring practices thesis”).
If the second thesis holds, we would expect to see a larger decline in ‘professional’ staff in high-performing library services, as they are more likely to have shifted their staffing to reflect changes in service provision. Concurrently, we would expect to see a smaller decline in ‘other’ staff for higher-performers and larger decline for lower-performers, reflecting the difference between the ability of the top and bottom quintiles to respond to the changing nature of library services.
Although the most successful libraries do show a slightly larger percent decline in ‘professional’ staff, the difference (59% versus 57%) is very small. In addition, percentages do not tell the full story, as the relative sizes of the staffs are different in the top and bottom quintiles, with services in the top quintile having begun with on average roughly two-thirds the number of professional staff as services in the bottom quintile (approximately 24 and 32 professional FTE positions in 2006-2007, respectively). In real numbers, this means that library services in the top quintile lost on average 15.8 ‘professional’ FTE positions and library services in the bottom quintile lost 17.7 ‘professional’ FTE positions, a greater number overall. This may provide evidence for the “budget thesis”: library services in the bottom quintile are losing staff concurrent with their decreasing budgets.
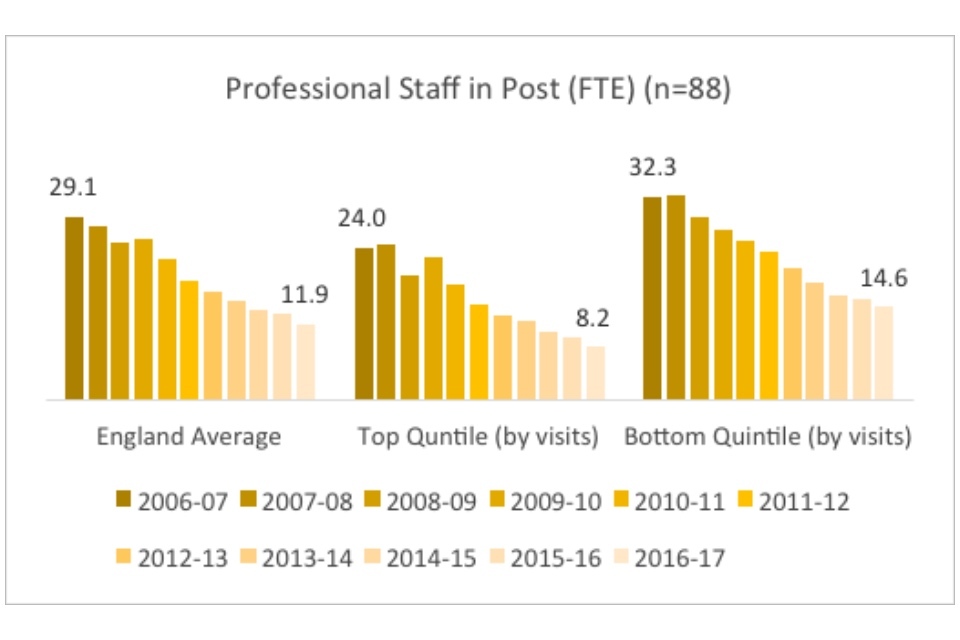
Graph showing professional staff in post (FTE)
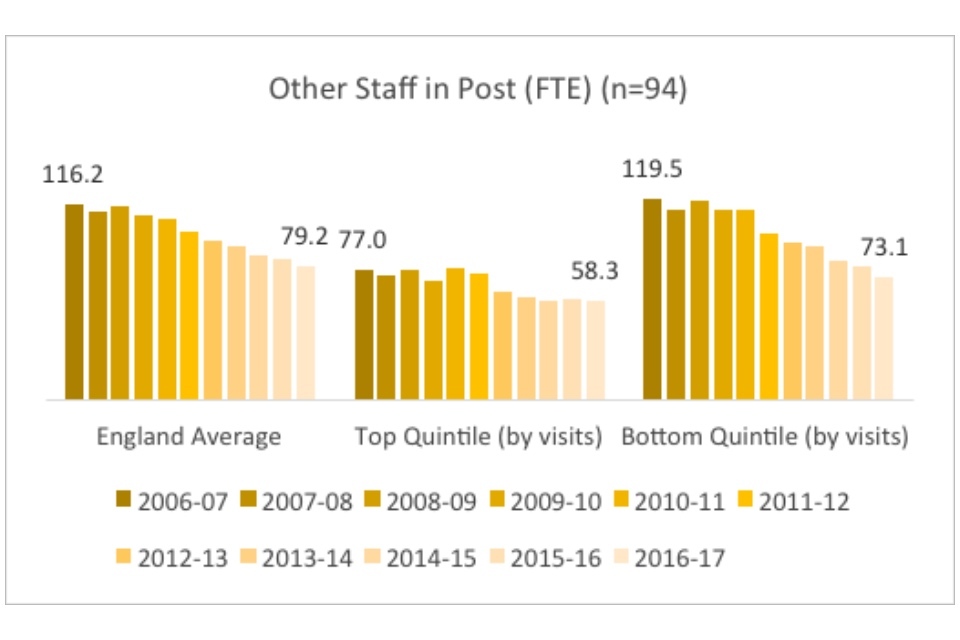
Graph showing other staff in post (FTE)
However, the lack of a corresponding decrease in ‘other’ staff equivalent to the decrease in ‘professional’ staff in the top quintile is highly suggestive. (The top quintile had a ‘professional’ staff 56% the size of the much larger staffs in the bottom quintile, but 80% of the ‘other’ staff positions!). It indicates that top performing library services are retaining or hiring employees for positions that do not require traditional qualifications and may demonstrate that high-performing library services are looking forward into the next generation of library consumer demand.
The ‘failure to modernise’ argument: libraries have failed to innovate in response to changes in service demand, which prevents the acquisition of new users and hinders repeat use
The failure to modernise argument is particularly difficult to prove or disprove with a time series dataset, as the variables which demonstrate modernisation wouldn’t be measured before the modernisation has occurred. So, for instance, libraries that are early adopters of a particular technology – for instance, iPads – would not be asked for data on that technology until it had already become sufficiently adopted by a significant proportion of the greater population.
However, there are some data points which may be illuminative. For instance, the data shows that library services have managed to prioritise different elements of their services, likely in response to the changing desire of customers. Library services appear to have begun prioritising digital acquisitions over book acquisitions, as demonstrated by Figure 27.
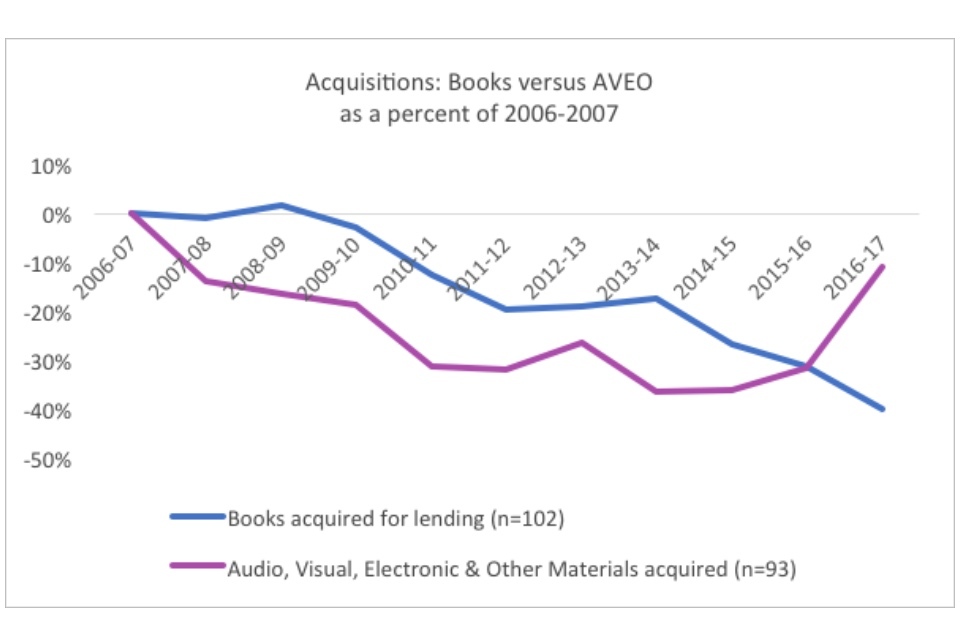
Figure 27: Acquisitions: books verses AVEO as a percent of 2006-2007
Another mark of modernisation is wifi, as free access to this has recently been understood to be a popular feature for work and study spaces.
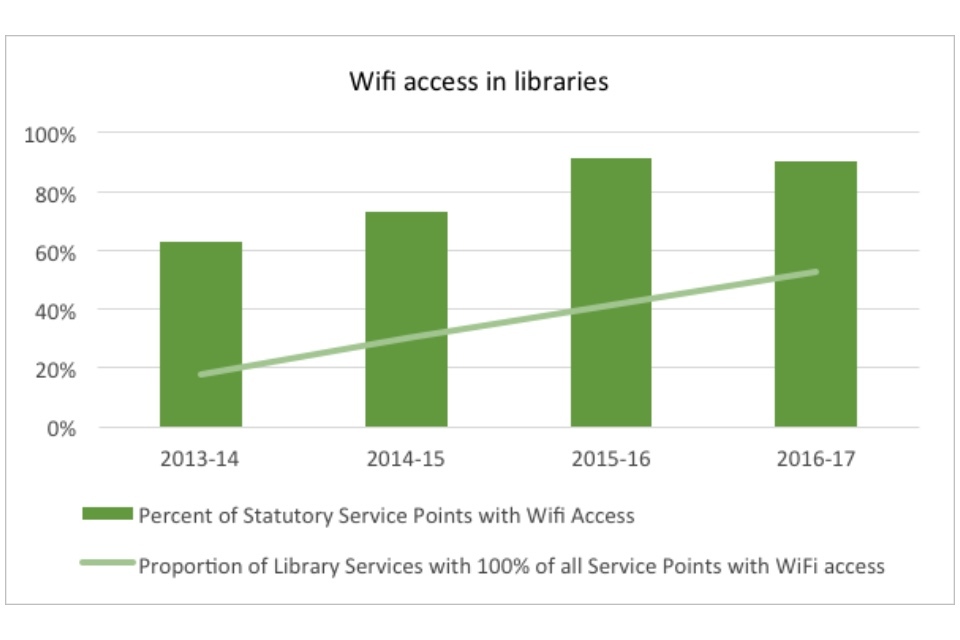
Graph showing wifi access in libraries
For the 80 library services with consistent data regarding wifi access, 90% of their statutory service points – including mobile service points - have public wifi. Of static service points, 99% offer wifi. Increasingly, local authorities are ensuring that every service point (even mobile) provides wifi: 53% of authorities had wifi in every service point in 2016-2017, an increase from just 18% three years earlier[footnote 4].
One reason for the increased growth in availability of wifi is the awarding of £2.6 million for that purpose by DCMS beginning in 2015. The programme, managed by the Arts Council, and completed in April 2016, enabled the installation or upgrade of wifi in over 1,000 libraries in England.
Although wifi access rapidly increased in England’s libraries from 2010 to 2017, overall decline in visits continued. However, once again, there is a stark difference in highest and lowest performers.
The top quintile by visits had on average 81% of service points equipped with wifi by 2013-14, and its numbers rose from 93% of 2010-11 visits the year before to 103% in 2013-2014. In the same time frame, the bottom quintile had only 39% of its service points equipped with wifi by 2013-2014. Its visits declined from 82% of 2010-2011 numbers to 75%.
Table: Average percent of service stations with wifi
| 2010-11 | 2011-12 | 2012-13 | 2013-14 | 2014-15 | 2015-16 | 2016-17 | |
| Top quintile | 20% | 38% | 53% | 81% | 85% | 93% | 95% |
| Bottom quintile | 17% | 22% | 34% | 39% | 59% | 85% | 87% |
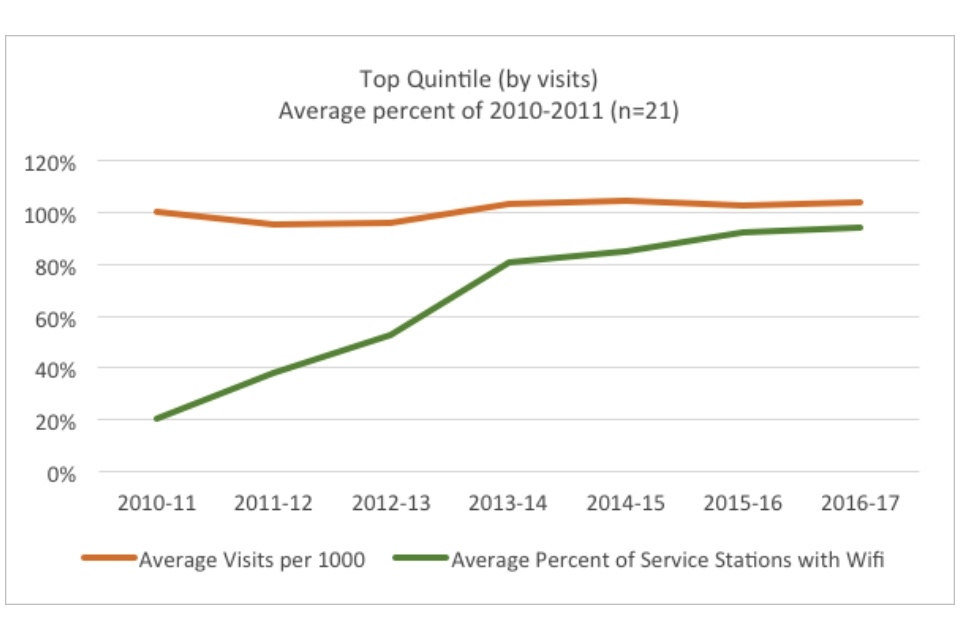
Graph showing the top quintile (by visits): average percent of 2010-2011
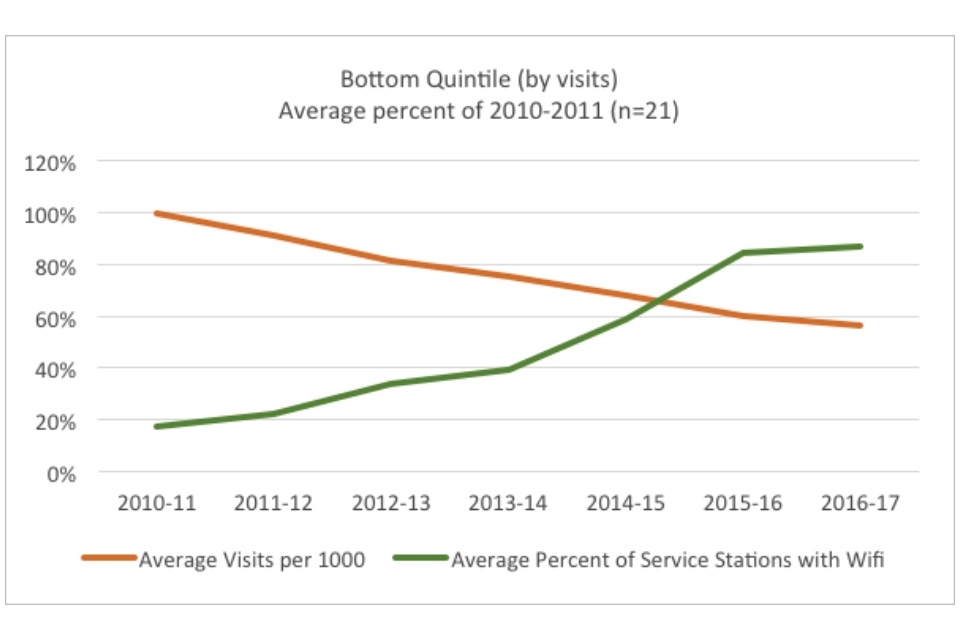
Graph showing the bottom quintile (by visits): average percent of 2010-2011
The figures indicate that the difference between the top and bottom performers is not modernisation per se, as both eventually reach a fairly high saturation of wifi in their service points (95% and 87%, respectively). Rather, it is the early adopter/late adopter distinction which provides the key distinction. The data does not indicate causation. It may be that the top performers’ modernisation led to visits, or that high visit library services have leadership more empowered to modernise. Or there may be a third variable, such as forward-thinking leadership, that causes both increased visits and faster wifi implementation.
Case study: Library innovation
Some services are not just modernising, but innovating. The Carnegie UK Trust’s Library Lab recently announced the selection of representatives from 6 library authorities – Oldham, West Lothian, Powys, Redbridge, Bexley, and Wakefield - to receive funding for their innovative projects, from recycled robots to coding for children.
Other library innovations include:
- Dudley libraries’ Digital Festival, featuring workshops on beauty blogging and digital music creation, in addition to Xbox game tournaments and Minecraft taster sessions
- tablet loans by Leeds libraries for digitally excluded groups, such as refugees, the elderly, and young people in Children’s Services
- Suffolk libraries designed their own library self-service software to create a progressive web-app for self-checkouts
It is difficult to evaluate leadership across services, as there is no direct data assessing management practices. However, there are a few variables that work as proxies. Looking at variables such as stock acquisitions or employee pay may tell us something about how library services conduct their management of stock or personnel. One thesis undergirding the ‘failure to modernise’ argument is the notion that libraries have stopped purchasing new books, and as a result the stock is outmoded and undesirable to the consumer.
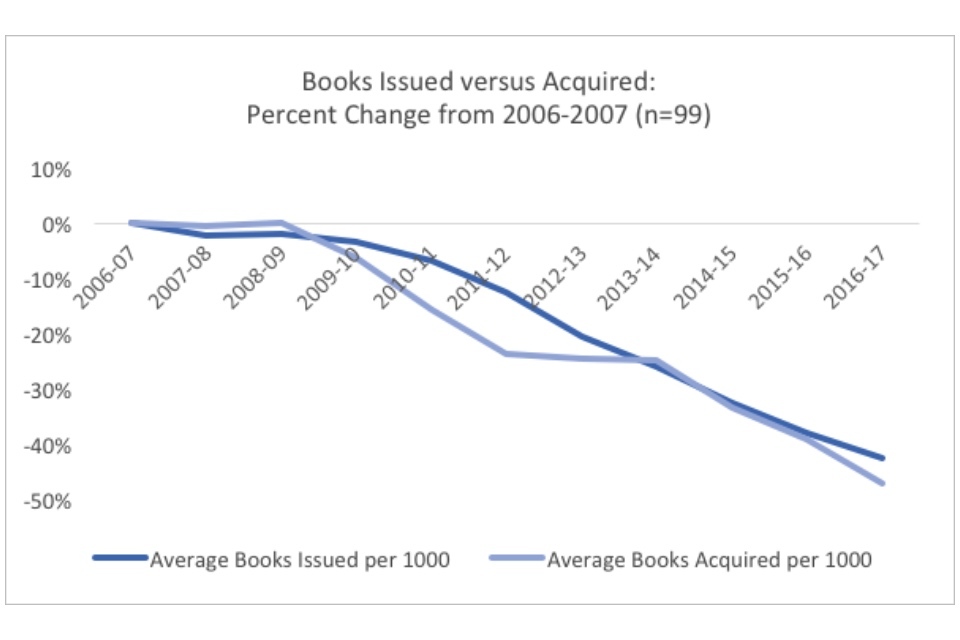
Graph showing books issues versus acquired: percent change from 2006-2007
There is a visible drop in the purchase of new books following the onset of austerity. However the decline in issues precedes the decline in acquisitions. It could be that it takes a few years for the stock to become substantially outmoded enough (or generic enough, if they’ve switched entirely to book supplier recommendations) to influence issues.
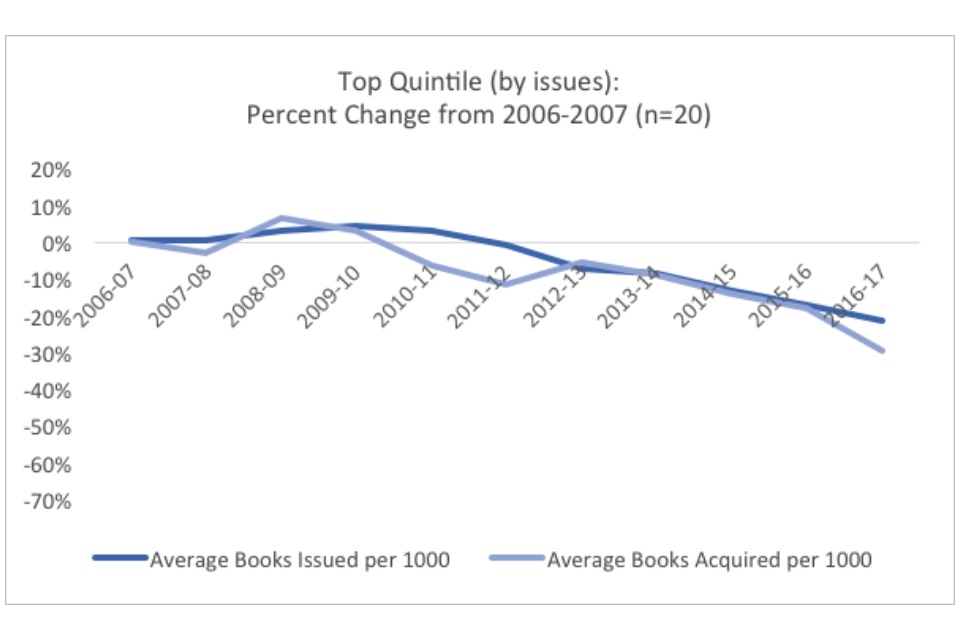
Graph showing the top quintile (by issues): percent change from 2006-2007
Libraries in the top and bottom quintiles decreased their acquisitions, but libraries in the bottom quintile began a year earlier and declined more dramatically. The bottom quintile decreased their acquisitions by twice as much. Correlatedly, their issue declines were steep as well.
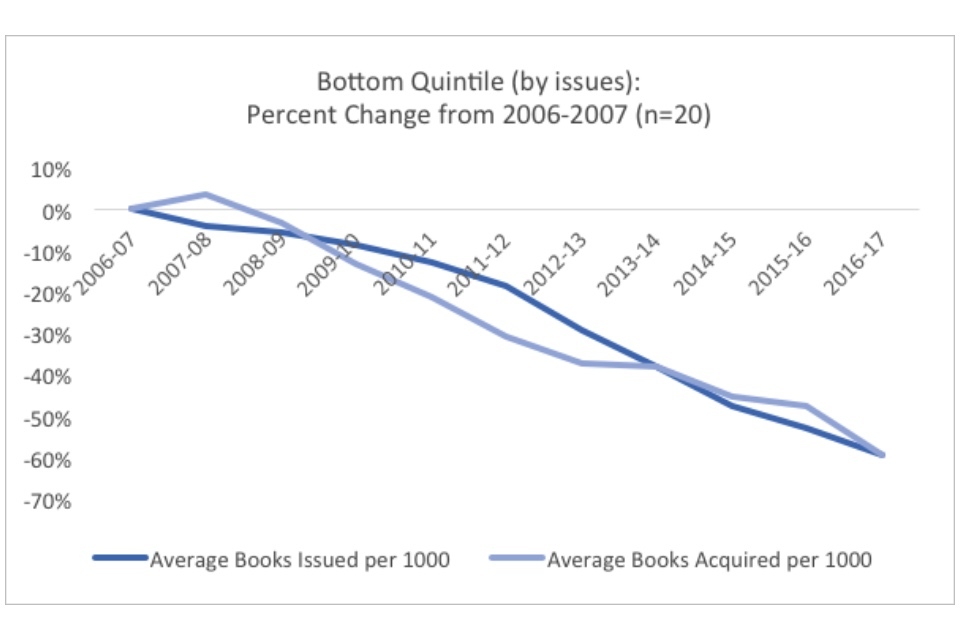
Graph showing the bottom quintile (by issues): percent change from 2006-2007
But once again, correlation is not causation. It seems as though the bottom quintile had been declining despite increased acquisitions in 2007-2008, so whether the declines were exacerbated due to decrease in acquisitions is hard to ascertain. It could be that the rapid declines demonstrate management’s desire to prioritise other services among rapidly shrinking budgets (perhaps they were innovating, but focussed on the wrong investment). There is also anecdotal evidence that in library budgets, book funds are the easiest element to target (unlike staff, books don’t know they’re being downsized). Or it might be that cuts changed the way libraries acquired books. If the staff who once gave input into the buying have been either let go or overloaded with the duties of their former colleagues, the library service may have to rely on the less-tailored recommendations of the book supplier. Further research would be required to determine what causality is at play here.
There are 2 measures that track employee pay: revenue expenditure (per 1,000 population) on employees and the employee costs per employee. These variables can be seen as proxies for questions of management and talent (for more on professional development, see this case study.
Expenditure spent on employees tracks the decline in overall expenditure fairly well, with employee spending declining by 36% and overall spending declining by 32% relative to 2006-07 spending in 2016-17.
Table: Expenditure on employees per 1000 population
| 2006-07 | 2007-08 | 2008-09 | 2009-10 | 2010-11 | 2011-12 | 2012-13 | 2013-14 | 2014-15 | 2015-16 | 2016-17 | |
| Top quintile | 0% | -1% | -3% | -6% | -6% | -15% | -24% | -28% | -33% | -32% | -35% |
| Bottom quintile | 0% | 0.2% | 0% | -0.1% | -6% | -16% | -27% | -30% | -35% | -40% | -43% |
Graph showing the top quintile (by visits): average percent change from 2006-2007
Graph showing the bottom quintile (by visits): average percent change from 2006-2007
Similar to overall spending, the employee spending in the top quintile by visits declined less precipitously than the spending in the bottom quintile (35% versus 43%). However, it is interesting to note the shape of the declines for each quintile. In the top, declines following austerity began gradually – indicating some degree of downsizing – and then increased in severity, likely as employee contracts ran out and were not renewed.
But in the bottom quintile, spending remained almost constant until it begins to dramatically decline in 2010-11. This might indicate the lower bargaining power of management (and perhaps is a proxy for weaker management overall) in the bottom quintile, as they were only able to cut spending on staff after dealing with 2 years of austerity.
Another aspect of staff pay is not just the amount spent on staffing overall, but rather the average amount spent on each employee. We may expect better performing libraries to spend more on each employee, ensuring access to the best talent. In addition, as libraries cut down on staff, there may be an incentive to spend more on the remaining staff to ensure retention. And indeed, the data shows that spending on each individual employee has risen over time, culminating in an increase of 18% over 2006-07.
Unexpectedly, the cost per employee was higher for the bottom quintile than the top quintile (18% versus 5%). This implies that the difference between spending on employees between top and bottom quintile is not just because the bottom quintile has more employees, but also because they are better paid.
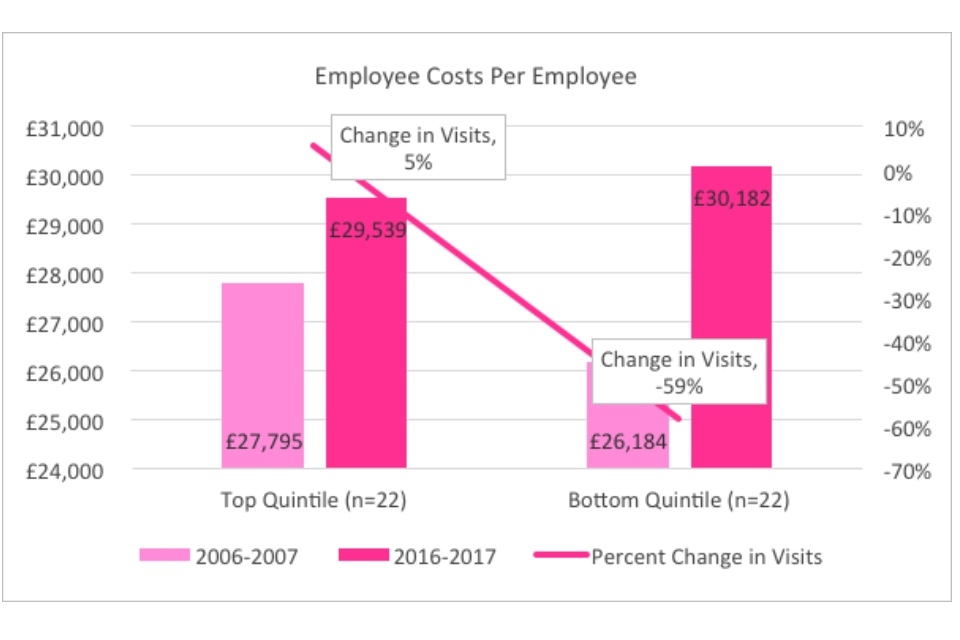
Graph showing the employee costs per employee
One thesis for this might be that lower performing library services have to pay higher wages, in order to draw people into what might be considered a less popular sector or to less popular (such as rural) locations. As the Sue Hill Salary Survey for library, archives, knowledge information, and record management (2015) points out, there exist skill shortages regarding open access and digital resources, creating a subsequent candidate shortage. The survey also notes that more “broadly across the junior to mid-level roles, clients are beginning to move beyond simply hiring replacement staff to recruiting for growth.” This may indicate that the top quintile – as it moves from holding to growing – is hiring younger employees, who are relatively cheaper and therefore do not contribute as much to overall employee cost per employee.
A 2015 study by CILIP provides some evidence for this, as it demonstrates the presence of an ageing workforce for information professionals overall. Roughly 55% of information professionals in the UK are over 45 years of age (compared to 41% in the population as a whole). Older staff will cost considerably more due to pay increases and pensions than younger staff, who have been especially affected by the pay freezes over the past decade. Therefore, library services which are growing and/or hiring for new types of positions are likely to have lower employee costs.
Another factor influencing the employee costs per employee is the requirement for professional qualifications. According to the same CILIP study, high-earning employees are more likely to hold professional qualifications than low earners. Of those earning £40,000 or more, nearly 65% hold a professional qualification. Because library services in the bottom quintile have almost twice as many professional FTE staff positions than the top quintile (see figure 25), they can expect to spend more on their employees.
One factor that make analysing this data difficult is that it is hard to tell what exactly is covered in expenditure on employees or employee cost per employee. Ideally, it would include wages and all manner of professional development expenses, but it is possible that some libraries only submit some fraction of that expenditure (for example, just wages).
Case study: Greenwich Leisure Libraries
Greenwich libraries consistently top the charts in terms of visits, culminating in a stunning 68% improvement since 2006-07. The library service is run by Greenwich Leisure Ltd (GLL), a non-profit charitable social enterprise organisation. Among other things, including data-based decision-making, GLL credits strong recruitment and professional development for its success.
The data-driven system provides accountability for their management to reward well-performing staff members or provide assistance to service points that are struggling. Staff also undergo a rigorous standard training program, with 14 different modules linked to progression routes, making their completion necessary for promotion. GLL insists on appropriate qualifications for all new hires. Finally, GLL will fund continued education for staff, with tuition reimbursement and benefits such as time to study (3 members are currently undertaking degree studies).
The ‘digital shift’ argument: changes in consumer behaviour, and particularly channel shift away from print and towards digital, have left the ‘physical library’ obsolete
Across industries, there is a concern that the “digital shift” will leave physical locations obsolete. Growth in online sales has increased rapidly in the U.K., rising from 12% of the market in 2012 to 24% in 2017, and in-store sales in some markets have begun to decline. There is reason to believe libraries are vulnerable to the same trend.
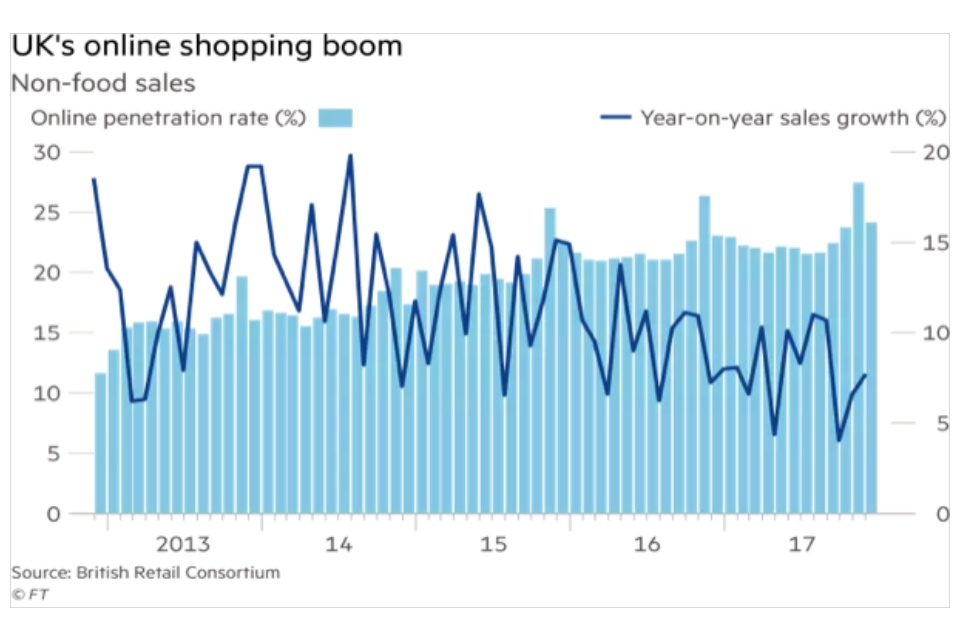
Graph showing the UK's online shopping sales
The digital shift argument has a number of weaknesses, foremost among them that library visits are the only metric to increase over time. The “physical library” as a location has therefore not yet been superseded, though it may be fair to argue that physical book issues are on their way to becoming so.
One way to judge if the digital shift argument was accurate would be to explore a variation of the “failure to modernise” argument. Essentially, the digital shift argument is true if both successful and unsuccessful library services show the same move towards digital, but equally struggle to reach customers. For instance, one can compare the growth in digital stock with the growth in digital issues.
In the CIPFA spreadsheets, the variables for digital stock have changed over time, as is to be expected after a decade of technological progress. In addition, the data is patchy: for some variables, such as e-magazines, fewer than half of library services consistently return data. So instead of comparing different digital items, this report compares “total audio, visual, electronic, and other stock” which includes music, talking books, videos and DVDs, CD-ROMs and software, e-books (all kinds), e-magazines, e-audio and e-audiovisuals.
Although total AVEO stock has been rising since 2014-15, jumping by 18 percentage points, AVEO issues have not shown a correlated increase. In fact, overall AVEO issues have shown larger declines since 2006-07 than physical book issues (54% versus 38%).
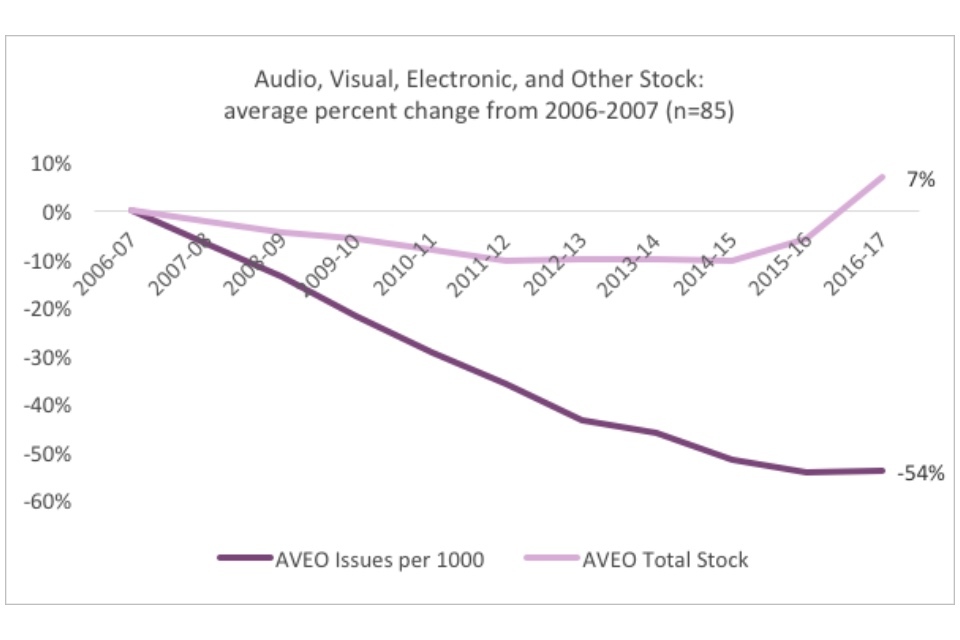
Graph showing audio, visual, electronic and other stock: average percent change from 2006-2007
According to Publishers Weekly, e-book sales to consumers peaked in 2014-15, and have now begun to decline.
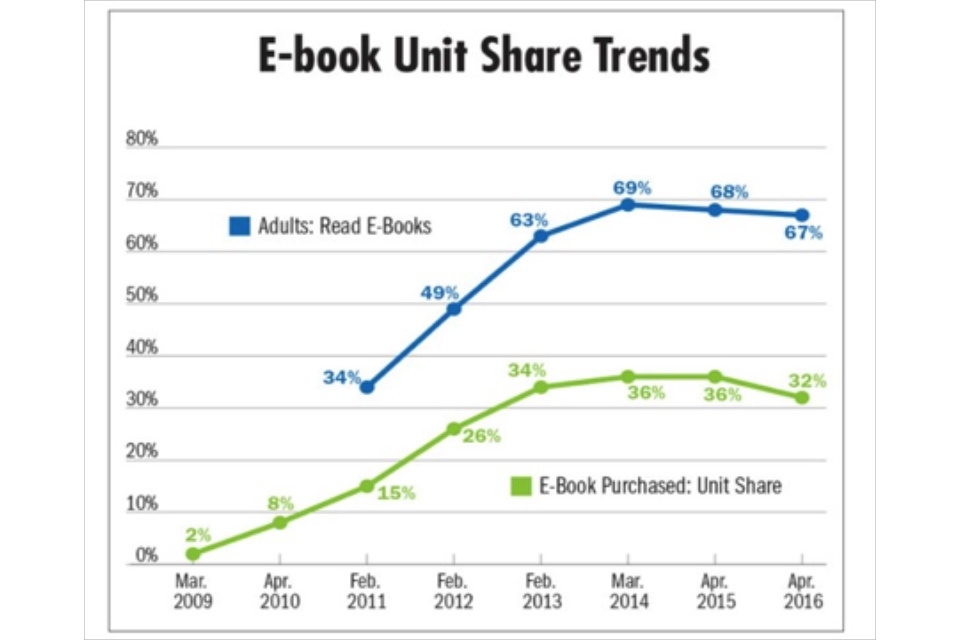
Graph showing e-book unit share trends
The Codex survey found that book buyers spend almost 5 hours of daily personal time on their screens, but roughly a quarter (and 37% of those ages 18-24) want to spend less time on digital devices. If this trend continues, it may be that libraries may wish to consider their turn to digital.
The shift to digital argument is especially belied by the experience of the top quintile of library services. The relatively large investment in digital has not been rewarded with a correspondingly large increase in digital issues. In part this may be due to failure to market these resources, especially to particular demographics.
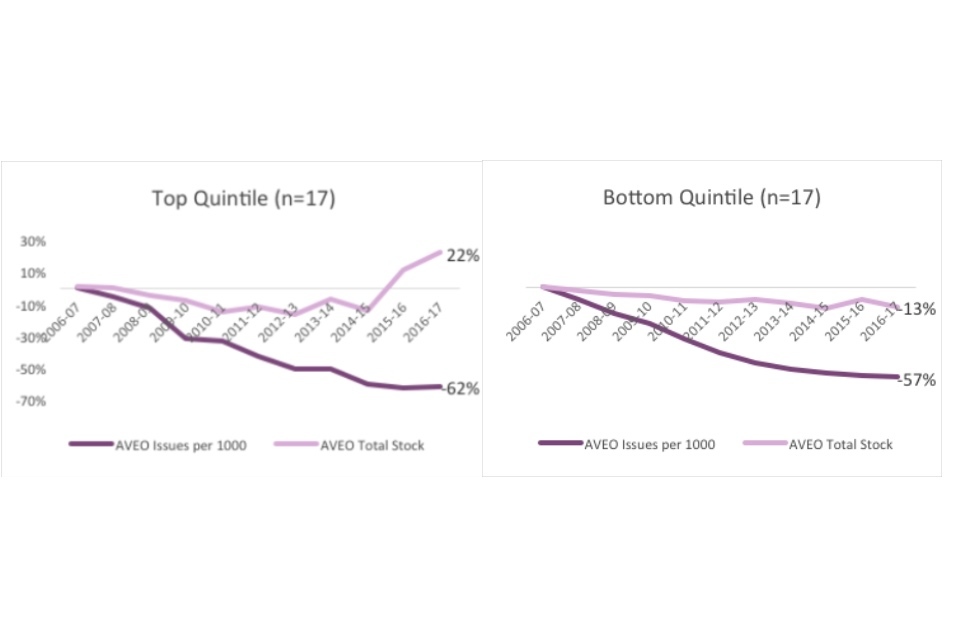
Graph showing the top quintile and bottom quintile by digital visits
In fact, the top quintile is outperformed by the bottom quintile in digital issues, showing despite dramatic increases in stock (22% versus the bottom quintile’s decline of -13%) declines of 62% in issues versus the bottom quintile’s decline of 57%. In part, this could be that bottom quintile library services are seeing a decline in their physical visits because they encourage “digital visits” – the use of online stock.
To test this hypothesis, I compared e-book issues with visits in each quintile. In the bottom quintile by visits, e-book issues are somewhat correlated with a decline in visits.
If local authorities in the bottom quintile are more likely to be rural or sparsely populated (and there is evidence that this is the case), it may be a viable strategy for providing the appropriate services for the local community.
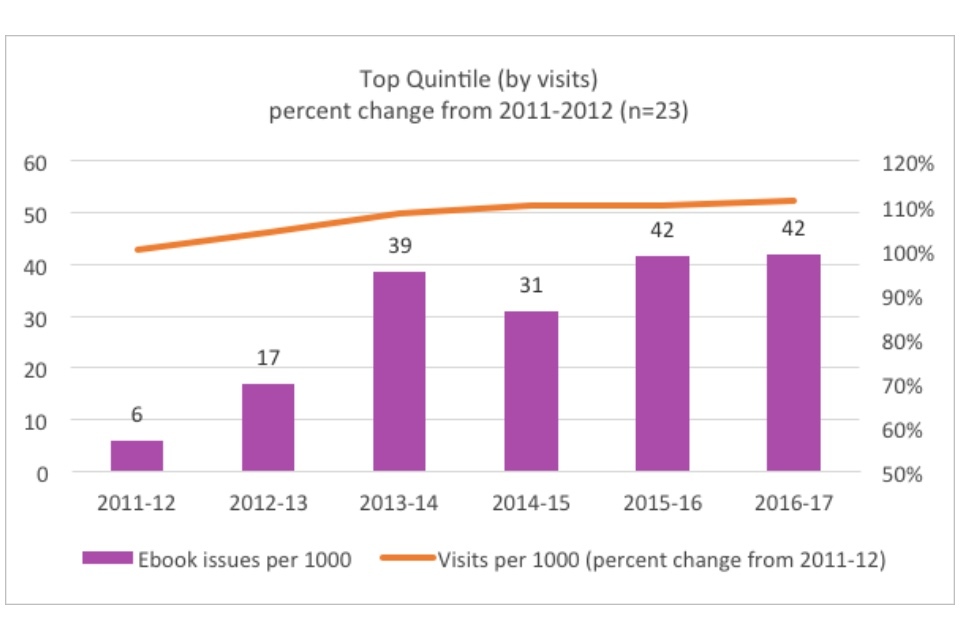
Graph showing the top quintile (by visits): percent change from 2011-2012
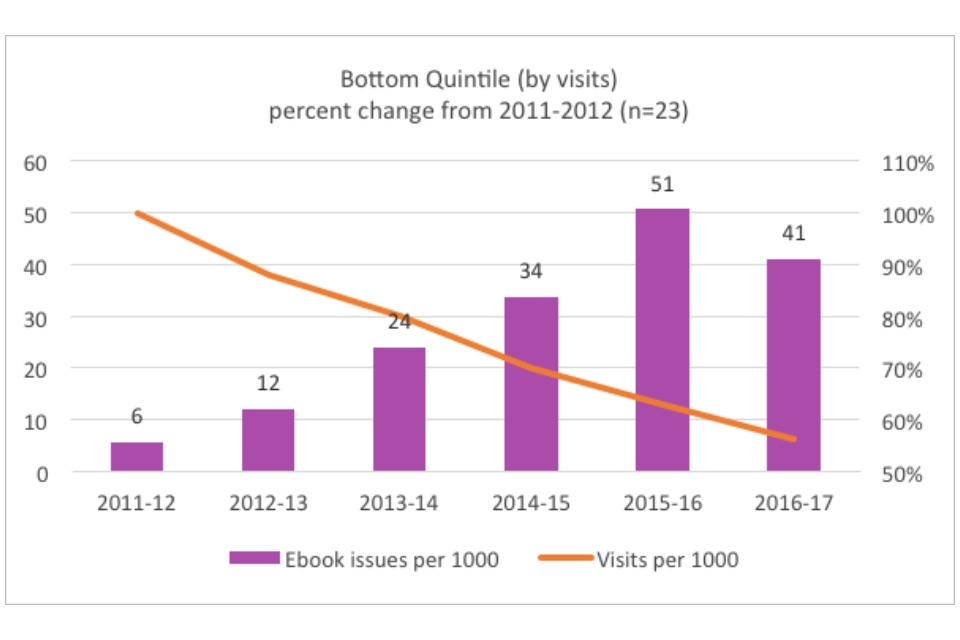
Graph showing the bottom quintile (by visits): percent change from 2011-2012
Another point against the argument that library services have failed to go digital is that the political climates of both national and local government over the past 5 years have encouraged public services to go digital, in the name of both efficiency and digital inclusion. In 2012, the Government Digital Strategy launched, which laid out aspirations to make public services “digital by default” by 2014 - meaning that digital services would be so convenient that all those who could use them would choose to do. In 2014, the government announced its Digital Inclusion Strategy with the aim of making every citizen who could be digitally capable by 2020.
Government services are now largely accessible online, but an estimated 11% of households in England do not have internet access. This is a significant gap that libraries have an important role in filling. This is reflected in the Taskforce’s vision for England’s libraries, Libraries Deliver, Outcome 3 “improved digital access and literacy.” The UK Digital Strategy highlights the role of public libraries as the ‘go-to’ provider of digital access, training and support, as well as providers of “seamless physical and virtual access to their resources and activities.” The Taskforce has also encouraged the vision of libraries as “makerspaces” with access to higher-end technology for digital co-creation.
To that end, in 2015, Arts Council England, on behalf of DCMS, allocated £2.6m to ensure that over 1,000 libraries were able to offer or upgrade wifi services.
The ‘changing use’ argument: the way people use libraries is changing, but current metrics are failing to pick up these patterns of altered use
This argument encompasses 2 factors. First, there are a number of variables not recorded by CIPFA that would more accurately reflect how libraries are being used. Examples of these include events, space reservations, or internet use (for example, gigabytes downloaded). Second, the way variables are currently understood may obfuscate how library use has changed.
For example, with regards to visits, libraries may be used less often but for more time. Especially as libraries alter their physical design to reflect the focus on “community hubs” over pure material provision, one could expect to see a decline in raw visit numbers. For instance, it may be that students no longer need daily access to reference material for thirty minutes, but rather spend 4 or 5 hours in the library writing a paper over the weekend.
Visits could also be affected by the increasingly accessible nature of digital services, both library and otherwise. If customers can check out a book on their tablet from the ease of their living room, visit numbers will understandably decline.
In issues, the rise of social media can also change how customers approach the library. Instead of taking out 4 or 5 books to be sure that one will suit their taste, online resources such as Goodreads.com can point them to the particular work that best reflects their needs, once more leading to a decline in raw numbers.
Streaming is a particularly difficult aspect of library use to measure. In particular, music numbers are liable to be lower because CD-ROMs are being replaced with online listening, both generally as the technology fades and in libraries in particular, as many services now offer in-house streaming. A similar trend applies to DVDs.
The ‘failure to market’ argument: libraries have neglected targeted marketing to engage traditional non-users and new customers
The CIPFA statistics do not have any variables that would shed light on this argument. Marketing is not tracked directly, or indirectly by counting numbers of events or financial outlay.
However, there is anecdotal evidence in favour of this argument. In the consultation surrounding the Taskforce’s vision for libraries, Libraries Deliver, there was wide support around marketing. People commented on “the need to combat stereotypes and promote the diverse range of activities now available in libraries”. They also emphasised “the need to promote library services to decision makers.”
The Taskforce grouped these 2 desires under ‘Making the case for libraries’ and implemented a broad action plan. In the short-term, the Taskforce is focusing on the co-ordination and consistency of messaging and working to ensure that all library services are equipped to contribute to the overall programme.
In addition, the Taskforce blog (which began in August 2015) has a number of case studies that raise awareness about how individuals and communities benefit from libraries.
Case study: Leeds libraries
Leeds libraries launched an online-offline aligned marketing campaign in late June 2015, entitled #whatsyourstory. The campaign involved banners, a billboard, press and TV coverage, along with a website, blogposts, and a comprehensive social media campaign.
Not only did the campaign gather local coverage, but there were online interactions with people from Australia, Canada, and the USA. In particular, the campaign was successful in improving the profile of the Leeds libraries within the council audiences, including the CEO of Leeds City Council. The #whatsyourstory campaign won the Best Creative Comms award at the ‘comms2point0 UnAwards 2015’. A follow-up campaign has occurred in 2016.
Unfortunately, Leeds did not return CIPFA figures for 2016-17, so it is not possible to assess the campaign for this report.
The ‘time poor’ argument: usage has declined because libraries face increased competition with a wider range of leisure-time options and work commitments
The Sieghart report posited that the reinvigoration of the library network would require libraries to offer a comfortable, “retail-standard environment” with the “amenities of coffee, sofas and toilets,” an indirect comment on the nature of the competition facing libraries.
Coffee shops are on the rise in England. In fiscal year 2016-17, Costa Coffee had 2,218 locations in the UK, over double the 881 shops in 2008-09. In comparison, in 2016-17 there were 3,034 public libraries in England alone.
Two thirds (65%) of all people in Great Britain visited a coffee shop in the months between August and October 2016, and 73% of 16-24-year olds did. Coffee shops are forecast to continue their increase, with their market valuation expected to grow by nearly 30% by 2021.
Time spent reading and studying in coffee shops is time not spent in libraries. However, libraries have an advantage in being a free and neutral space, requiring no purchase to access. Some libraries have started to follow through on the Sieghart report recommendations, offering things like refreshment facilities to meet consumer demand.
Libraries are also competing with other shifts in customer desire. Instead of shifting where leisure time is spent, some people may change what they do with their leisure time. They may be prioritising screen-time over visiting physical spaces.
One piece of evidence in favour of this argument is the trends influencing other cultural institutions. Museums and galleries have also seen a decline in visits, but only beginning in the past 5 years.
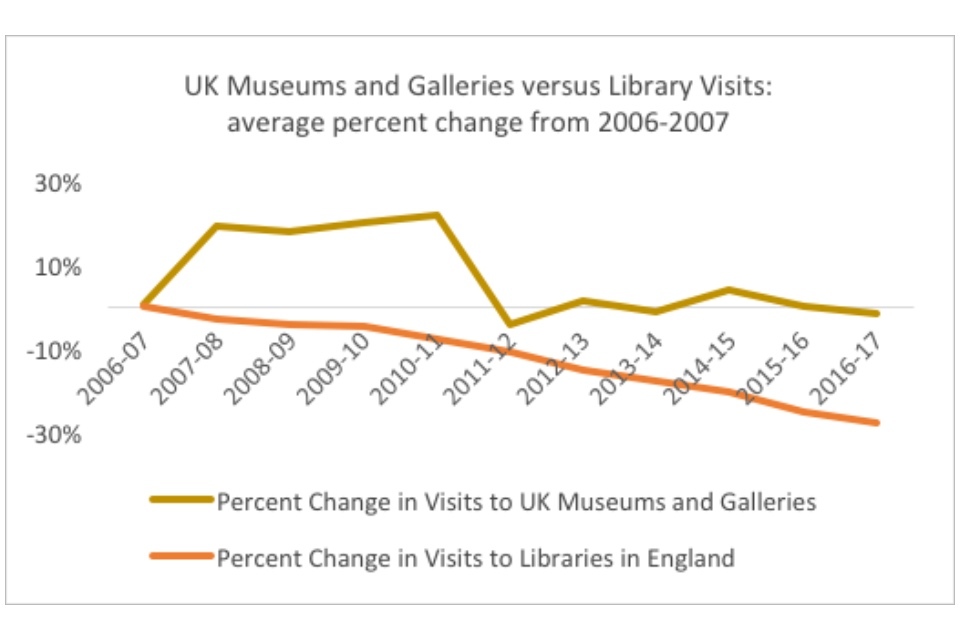
Graph showing UK museums and galleries versus library visits: average percent change from 2006-2007
The decline in museums and galleries corresponds with the spread of smartphones and tablets, indicating that public libraries – like their counterpart public institutions – share the same challenges as a result of the changing nature of societal engagement.
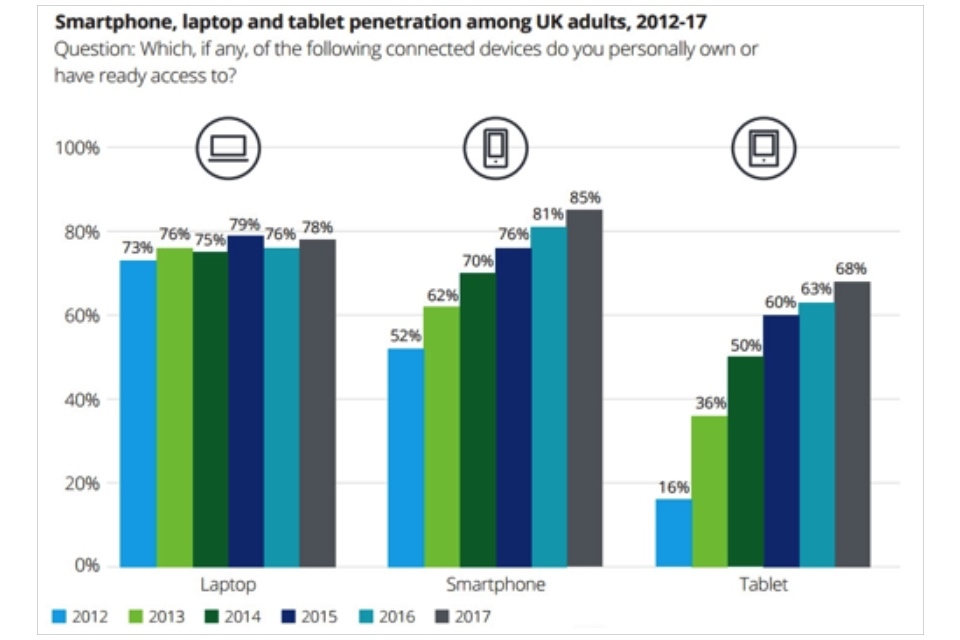
Graph showing the smartphone, laptop and tablet penetration among UK adults, 2012-2017
The Taking Part survey also notes this effect: “those with children aged 5-10 and incomes over £20,000, income has a negative association with libraries. This finding supports the argument that at a certain level of income some families provide books, computers and digital media such that trips to the library are not necessary.”
However, since households with children aged 11-15 and relatively low personal incomes (£5,000 to £19,999) are positively associated with use, the survey believes that for these individuals “libraries are an ‘accessible’ product and an enabler of access to books, computers, digital media and social space.”
The Taking Part analysis discusses an extremely important factor to consider when discussing the “time poor” argument: regardless of leisure options available in England, libraries play a critical role in ensuring national equity.
There will always be individuals who need libraries to provide basic goods. One example is electronic workstations, which are key to accessing a range of public services. Libraries provide those, and especially during times of need – evidenced by the rise in workstations during the recession (103% of 2006-07 numbers in 2010-11) – will ensure fair access.
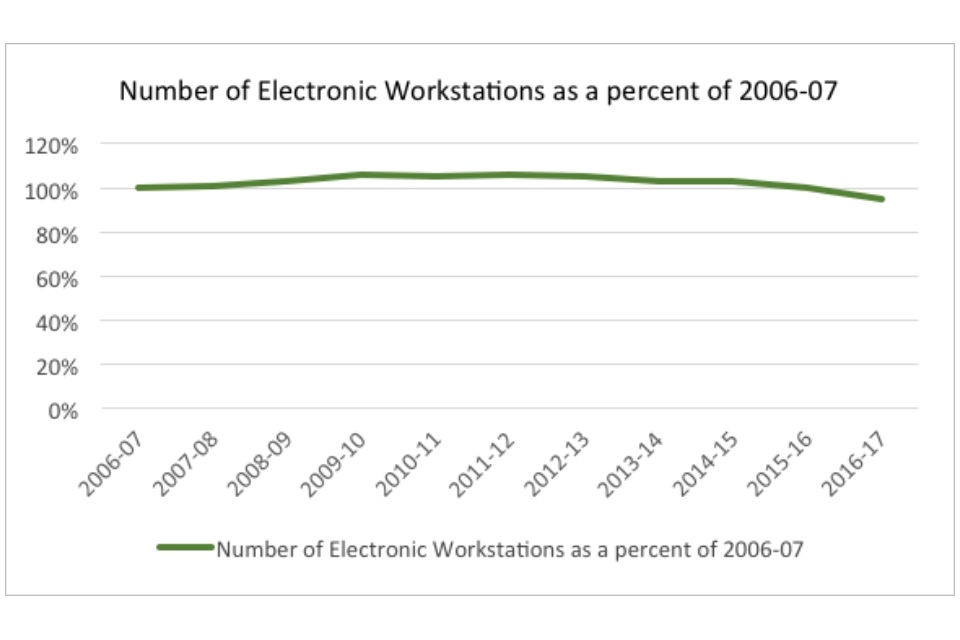
Graph showing the number of electronic workstations as a percent of 2006-2007
A recent drop in the number of workstations (95% of 2006-07 figures in 2016-17) likely reflects that as the economy recovers and digital device saturation increases (tablet ownership increased from 16% to 68% just over the past 5 years), library services may be more focused on providing fast wifi for devices brought from home or for new tablet lending schemes. Additionally, workstations as tallied may or may not include take-home digital devices, another factor that could skew numbers towards decline. (CIPFA defines electronic workstations as “terminals for public or joint use with staff” – whether a take-home tablet is considered a terminal depends on the service). Finally, a number of libraries are providing ‘captive tablets’ or touchscreen shelves, which provide a limited range of online activities and may or may not be counted as a ‘workstation’ due to these constraints.
Case study: Suffolk libraries
Suffolk libraries’ innovative iPad lending project seeks to improve people’s access to digital library services by providing them with the requisite technology and skills. Suffolk began a partnership with a local electrical retailer who had previously supported its “Get Connected” digital skills development series, and gradually rolled out iPad lending across 15 libraries. Individual service points requested to join the project after identifying a community need, such as having a training program for older people or to use iPads to introduce young people to e-books. On top of a broad range of digital services, the iPad lending scheme encourages customers to access digital knowledge and builds their confidence in their digital literacy
The ‘fragmentation’ argument: devolution by the national government has made it difficult to manage and strategise across English libraries (as one would a national retail chain)
The Localism Act of 2011 aimed to strengthen society by helping “people and their locally elected representatives to achieve their own ambitions.” In part it did this by devolving certain powers and freedoms to local authorities, reversing previous acts that had centralised government in the UK.
This trend in governance is actually in opposition to the trend in retail, in which centralised retail chains have grown in strength and prominence. These retail chains have taken advantage of economies of scale and standardised services to increase their market share.
To determine if centralisation affects the ability of library services to perform, this report investigates two possibilities. The first is to examine if actions by the Libraries Taskforce, which has provided centralised coordination and support, are correlated with improved usage metrics. The second is explore whether public mutual organisations, some of whom operate multiple library or other public services akin to large retailers, demonstrate a significant improvement over individually run services.
Most notably, the quintile with the most improvement (top quintile by visits) began growth before the Sieghart report was published and the Taskforce began its work. However, in the other quintiles and in the average across England, post 2015 one sees the potential for a “hockey stick” shape, as declines have slowed and the existence of trend-buckers signals growth.
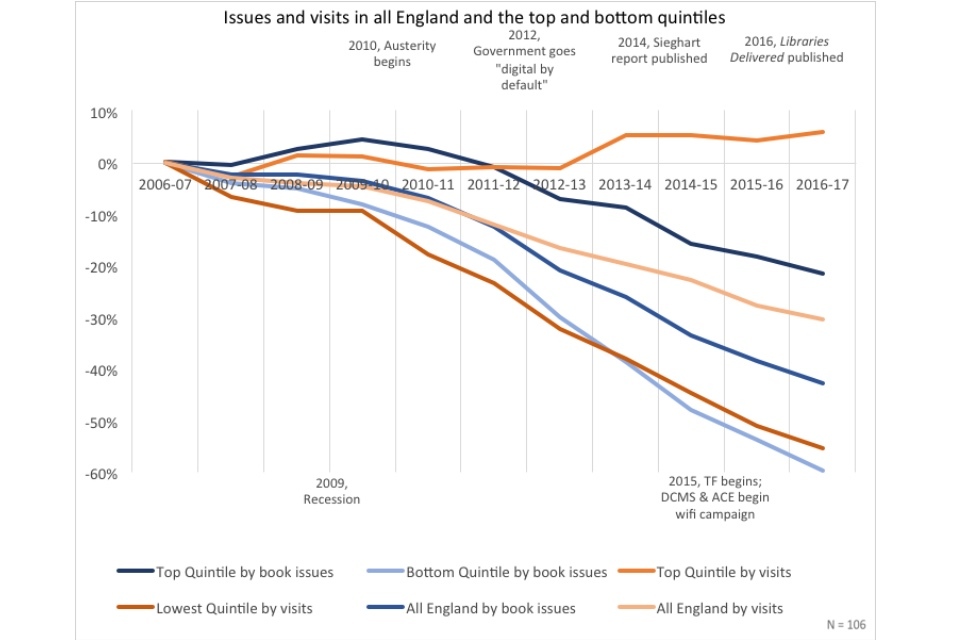
Graph showing issues and visits in all England and the top and bottom quintiles
The slowed decline may reflect the influence of the Taskforce in setting a centralised vision and promoting the importance of libraries to policymakers. However, it could also reflect any number of structural factors (for instance, the e-book fatigue).
Public service mutuals (PSM) are organisations that have left the public sector but continue delivering public services. PSM have a few advantages over other forms of service provision. They receive their budgets in 4 year contracts, providing stability. They have more freedom from council oversight, which can improve employee agency and morale. And in particular, they can benefit from efficiencies of scale when they run multiple services or multiple types of service (for example, leisure and libraries) within an authority.
There are 4 public library sector mutuals - in York, Nottinghamshire, Devon, and Suffolk - as well as one social enterprise organisation (which has many of the same characteristics) running Greenwich, Lincolnshire, Wandsworth, Dudley, and Bromley library services.
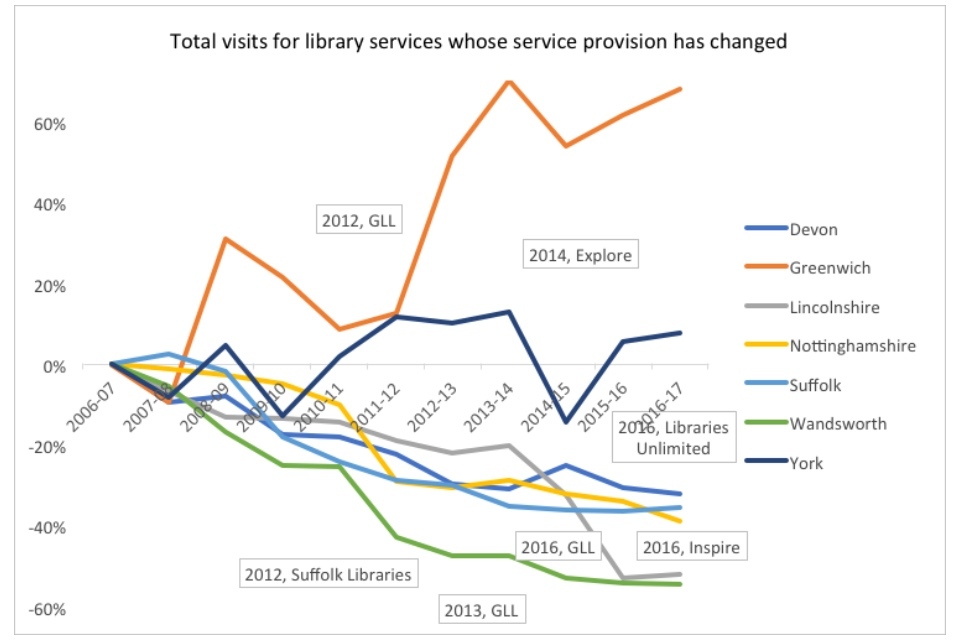
Graph showing the total visits for library services whose service provision has changed
Data regarding the PSMs does not support the centralisation argument. Only two library services as yet show improvement in visits following the change in service provision, both run by GLL: Greenwich and Lincolnshire. No service as of yet has shown improvement in issues, and some have shown steep declines. However, for some library services it may be too early to tell; Devon (Libraries Unlimited) and Nottinghamshire (Inspire) only have one year of data.
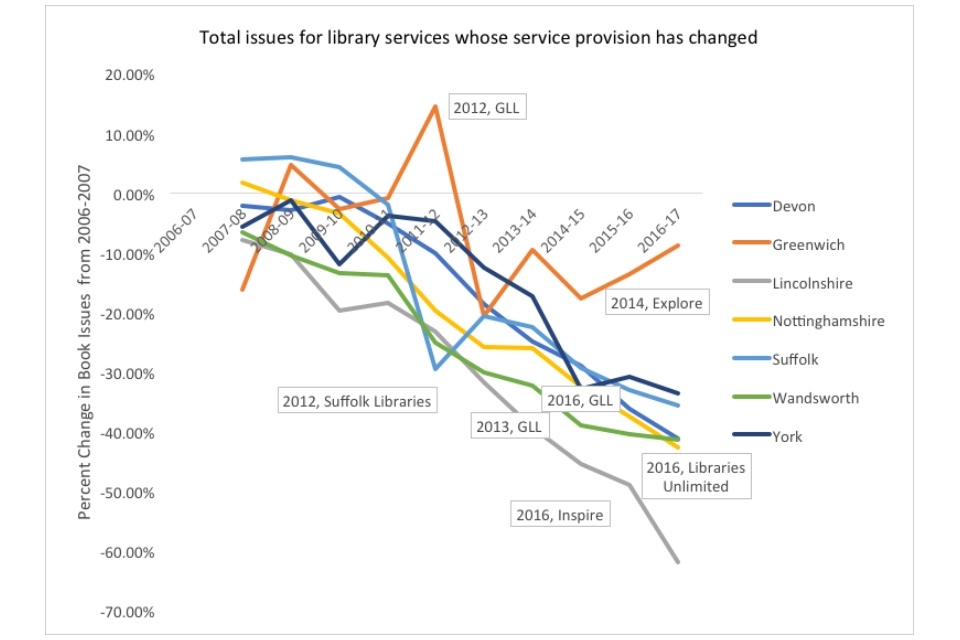
Graph showing the total issues for library services whose service provision has changed
A factor to keep in mind when considering services like York (2014), Libraries Unlimited (2016), and Inspire (2016) is that a dip immediately following start of service does not necessarily indicate an actual drop in use. Changing management tends to change how statistics are counted (for example, switching from sampling to door counters) as well as periodic suspensions of service for renovation or in-depth analysis, which can lower overall visit and issue numbers.
6.3 What do successful library services have in common?
31 library services have increased their visit numbers over the past year (since 2015-16). They are:
- Birmingham
- Bournemouth
- Brent
- Bromley
- Calderdale
- Darlington
- Greenwich
- Hammersmith and Fulham
- Havering
- Islington
- Lambeth
- Lewisham
- Lincolnshire
- Manchster
- Medway
- Newham
- Plymouth
- Redbridge
- Richmond-Upon-Thames
- Rotherham
- Sefton
- Slough
- Southwark
- Stockport
- Suffolk
- Sutton
- Telford and Wrekin
- Windsor and Maidenhead
- Wolverhampton
- Worcesteshire
- York
10 library services have increased their visit numbers over the past decade (since 2006-07). They are:
- Brent
- Ealing
- Greenwich
- Hammersmith and Fulham
- Havering
- Lewisham
- North Tyneside
- Rochdale
- Sandwell
- York
10 library services have increased their book issues over the past year (since 2015-16). They are:
- Brighton and Hove
- Bromley
- Gloucestershire
- Greenwich
- Hammersmith and Fulham
- Kensington and Chelsea
- Leicestershire
- North Yorkshire
- Rochdale
- Southwark
1 library service has increased its book issues numbers over the past decade (since 2006-07). It is:
- Southwark
Over one quarter of all library services are trendbuckers. By exploring what these library services have in common, it may be possible to learn about what internal and external factors are most influential on a library services success.
Trend-bucking library services are spread across England. Orange are library services that have trend-bucking visits and blue are services with trend-bucking book issues.
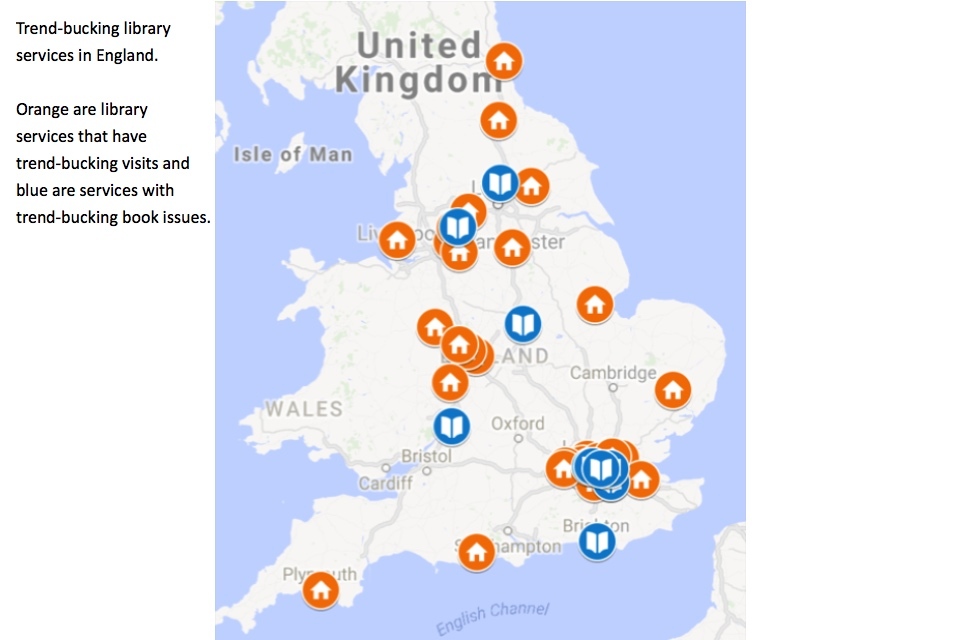
Map showing the trendbucking library services in England
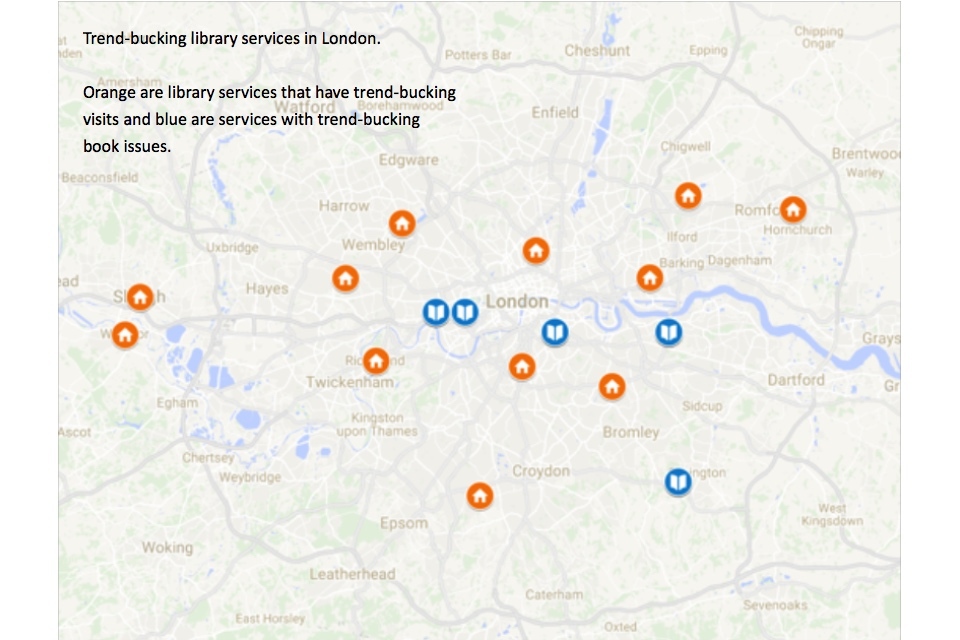
Map showing the trendbucking library services in London
The most prominent trend that emerges across the 7 arguments discussed in the previous section is the early-adopter advantage, indicating that the more successful library services are quick to recognise and respond to shifts in customer desire.
Interviews with a range of library services resulted in the identification of the following factors as likely to determine a library service’s relative responsiveness: support from outside decision makers, ability to budget over the long term, and library leadership open to innovation and risk-taking.
Unfortunately, none of these variables are directly measured by CIPFA, and further research is required. However, it may be possible to determine correlations by examining associated variables, such as demographic characteristics for trendbucking library services.
In this section, I create two groups: “visit-trendbuckers” and “book issue-trendbuckers.” Each group contains all of the one-year and ten-year libraries. There are 35 total visit-trendbuckers and 10 total book issue-trendbuckers[footnote 5].
6.4 Visit - trendbuckers
Nearly one quarter of library services are visit trendbuckers. The majority of trendbuckers are London Boroughs.
| Visit trendbuckers | All England | |||
| 2016-17 | Number of library services | % of trendbuckers | Total number of local authorities per type | Trendbuckers as % of authorities |
| English Counties | 3 | 9% | 27 | 11% |
| London Boroughs | 14 | 40% | 33 | 42% |
| Metropolitan Districts | 10 | 29% | 36 | 28% |
| Unitary Authorities | 8 | 23% | 55 | 15% |
| All England | 35 | 100% | 151 | 23% |
Unitary Authorities (15%) and English Counties (11%) underperform, relative to the average percent of trendbuckers in England (23%). London Boroughs (42%) and Metropolitan Districts (28%) overperform, relative to the average.
This indicates that the type of local authority affects the likelihood that a service will be a trendbucker. The more dense, urban, and wealthy local authorities are more likely to have trendbuckers than the more sparse, rural, and poor local authorities.
This could be a result of demographics. Cities tend to have younger populations – who are more likely to use library services - than rural areas. Local authorities therefore also have more flexibility with spending, as they are less restricted by the costs of services required by an ageing population.
The demographic hypothesis is borne out still further when looking at just the ten-year visit trendbuckers. On average, these services demonstrated a 20% growth in visits per 1000 residents over 2006-07 figures, an astounding 75% point differential compared to the all-England average (-55%).
The ten-year visit trendbuckers are almost entirely urban authorities, with the exception of York. The majority of them are located in the London boroughs.
| Authority type | Number of services |
| London Boroughs | 6 |
| Metropolitan Districts | 3 |
| Unitary Authorities | 1 |
| English Counties | 0 |
Urban areas have a number of advantages regarding visits, most notably density and public transportation networks. 8 of the 10 trendbuckers are located in or near areas with growth in commuting by public transport, which may indicate that improved public transportation networks are key to high growth library services. However, for public transit to benefit library services, it is critical that it be coordinated with service point locations and opening hours, requiring support from council decision-makers.
Urban areas are also subject to demographic shifts that impact the staff talent accessible to library services. In particular, urban areas are subject to more rapid population growth than rural areas. The visit trendbuckers showed population growth of an average 12.9%, over half again as much growth as England as a whole (approximately 8%).
One of the most important knock-on effects of population growth is the potential for increased human capital. 9 out of the 10 ten-year visit trendbuckers are located in areas associated with net-positive domestic migration. Domestic migrants tend to be young (aged between 16-30) and have A-Levels and degrees. As young professionals move to urban areas in search of employment opportunities, they bring with them spouses and partners - usually equally well educated - in need of jobs as well.
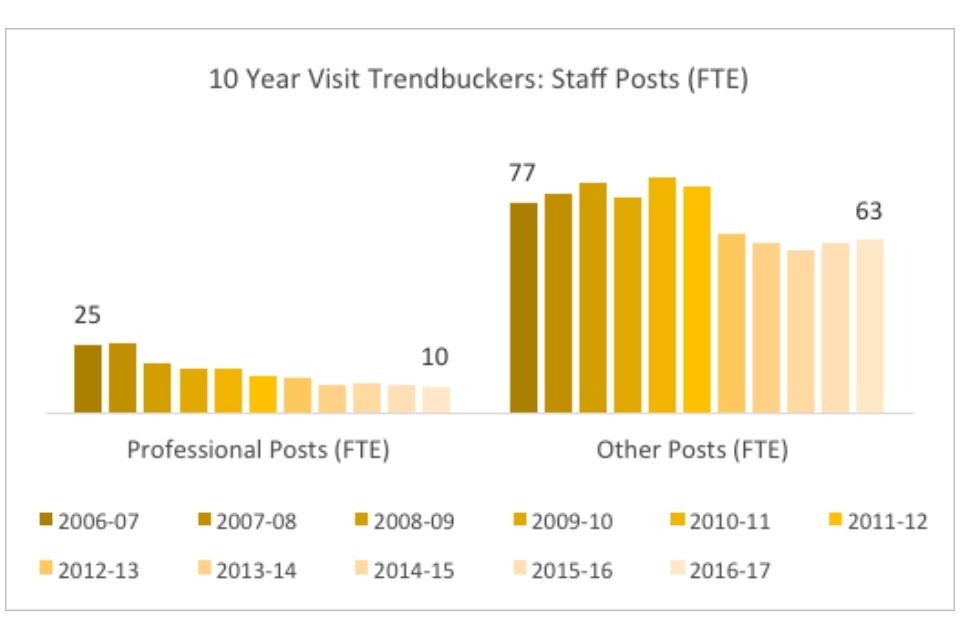
Graph showing the 10 year visit trendbuckers: staff posts (FTE)
A large talent pool from which to pull gives these library services an advantage in finding innovative and motivated leadership. These employees may never have intended to work in a library service, and thus once employed bring alternative perspectives and skills to their positions. The career-switch of employees in the trendbuckers is potentially evidenced by the fact that ‘professional’ posts have shown an almost perfectly consistent decline, even before the onset of austerity, while ‘other’ posts showed growth, peaking at an average of 85 posts in 2010-11, before expenditure decreases began that same year. The decline in ‘professional’ posts while ‘other’ posts rose implies that library services are hiring employees without traditional librarianship qualifications. Overall, visit trendbuckers retained on average 82% of other staff posts over the past decade, but only 40% of professional posts.
Ten-year visit trendbuckers did not show expenditure decreases until 2010-11, one year after expenditure decreases for the bottom quintile, and especially notable given that the first austerity measures began in 2008. The delay may indicate that the library services were in some way protected from budget cuts as they first began. This may imply the presence of two underlying variables: support from decision-makers and long-term budget flexibility. Either the library services had a budget arrangement, such as a 4 year contract, which kept their incomes steady until the next renegotiation, or political allies were able to protect library services from budget cuts as local authorities began implementing austerity measures. Further research to determine the exact applicability and causality of these variables is required.
Returning to the visit trendbuckers at large, another variable which may correlate with underlying variables such as support from outside decision makers, long-term budgeting, or innovative library leadership is the variety of libraries in each library services. The trendbucking library services may prefer one organisational approach over another.
CIPFA’s typology differs from the Taskforce’s, but aligns roughly. An Authority Run Library is funded and delivered by the public library authority, equivalent to the Taskforce’s Authority-Run Library. A Commissioned Community Co-Produced Library is commissioned and fully funded by the council but delivered by a not-for-private-profit community, social enterprise or mutual organisation, either existing or newly created, equivalent to the Taskforce’s Commissioned Library. A Community Supported Co-Produced Library is council-led and funded, usually with paid professional staff, but given significant support by volunteers. This does not have a Taskforce equivalent term, but is grouped by the Taskforce under Authority-Run libraries. The Community Managed Co-Produced Library is community-led and community delivered, rarely with paid staff, but often with some form of ongoing council support and often still part of the public library network, most nearly equivalent to the Taskforce’s Community-Run Library. CIPFA does not measure the equivalent of the Independent Community Library.
| 2016-2017 | Visit trendbuckers | All England |
| Authority Run Library | 392 | 2048 |
| Commissioned Community Co-produced Library | 114 | 294 |
| Community Managed Library | 61 | 241 |
| Community Supported Library | 13 | 94 |
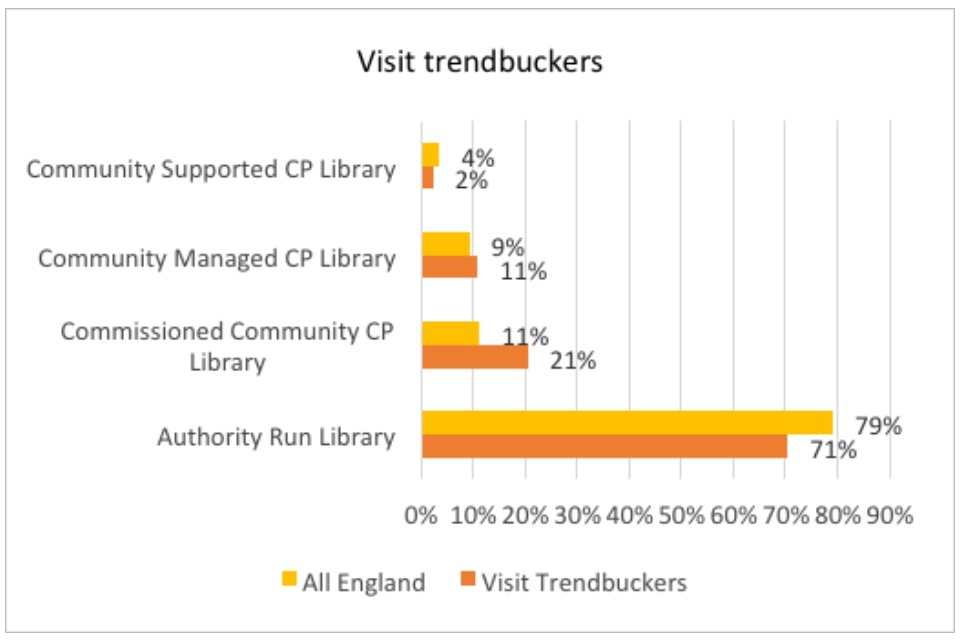
Graph showing visit trendbuckers
Nearly twice the proportion of libraries in the visit trendbuckers are commissioned libraries as in England as a whole (21% versus 11%). This may indicate that long-term budgeting and innovative leadership are important variables in library service success. First, commissioned libraries are more likely to have signed budget contracts over the course of years, freeing them from year to year uncertainty. Second, commissioned libraries may be correlated with innovative leadership because they are a newer type of organisational approach, and risk-taking individuals may find new approaches more appealing. However, once again, correlation is not causation, and further research is required.
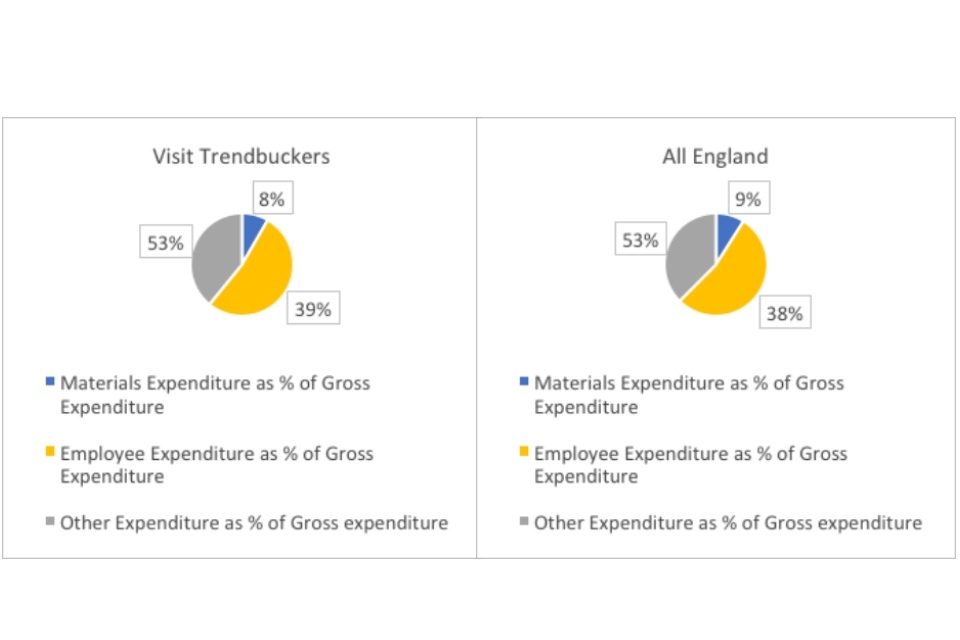
Graph showing expenditure for visit trendbuckers and and all England
In terms of expenditure, trendbuckers spend roughly the same proportion on employees as England as a whole. One difference between trendbuckers and library services as a whole is that trendbuckers spent a slightly lower proportion of their expenditure on materials, instead spending it on capital improvements. In 2016-17, visit trendbuckers spent 13% more on average on premises. This makes sense, as having an appealing premise seems very likely to affect the number of visits.
An especially large difference in the net expenditures between visit trendbuckers and library services in England as a whole is the amount spent on capital charges. Visit trendbuckers spent an average of £195,017 less than England overall on their net expenditures, but when capital charges were included, they spent £16,675 more.
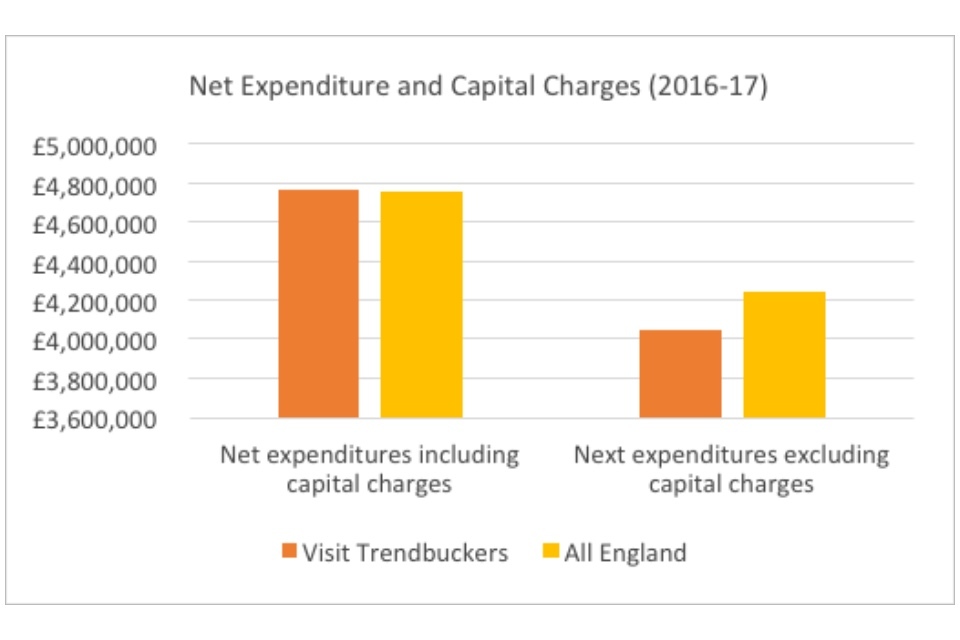
Graph showing the net expenditure and capital charges (2016-2017)
The expenditure priorities of the visit trendbuckers, especially on premises, indicates that these library services have a degree of responsiveness necessary to ensure recognition and satisfaction of customer demand. Finally, one library service in particular deserves special recognition. Of all the library services, only Lewisham has remained consistently above its 2006-2007 visit numbers.
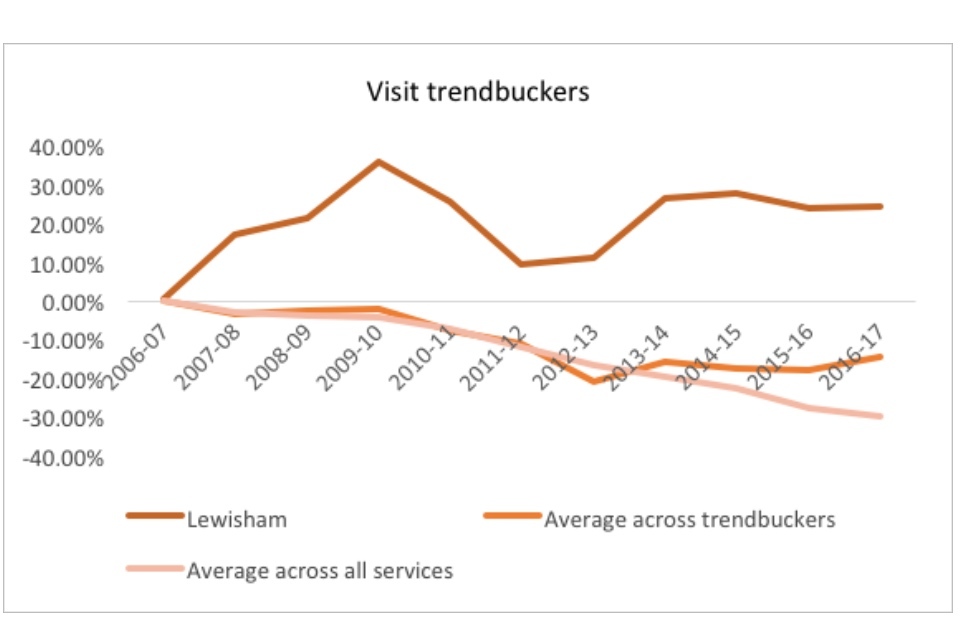
Graph showing visit trendbuckers
6.5 Book issue - trendbuckers
Once again, the majority of trendbuckers are London boroughs.
| 2016-17 | Number of library services | % of trendbuckers | Total number of local authorities per type | Trendbuckers as % of authorities |
| English Counties | 3 | 30% | 27 | 11% |
| London Boroughs | 5 | 50% | 33 | 15% |
| Metropolitan Districts | 1 | 10% | 36 | 3% |
| Unitary Authorities | 1 | 10% | 55 | 2% |
| All England | 10 | 100% | 151 | 7% |
Unitary Authorities (2%) and Metropolitan Districts (3%) underperform, relative to the average percent of trendbuckers in England (7%). London Boroughs (15%) and English Counties (11%) overperform, relative to the average.
Unlike in visits, book issues seem to be less tied to the density of the authority. This may be because in less dense regions, authorities do not have to compete with other physical book suppliers for customers.
Book issue trend-bucking services have more community supported (5% versus 4%) and community managed (22% versus 9%) libraries than services overall. This may indicate the relative strength of having volunteers in a library is that stock may better reflect community desire, or possibly that volunteers themselves are high volume borrowers. Further research is required.
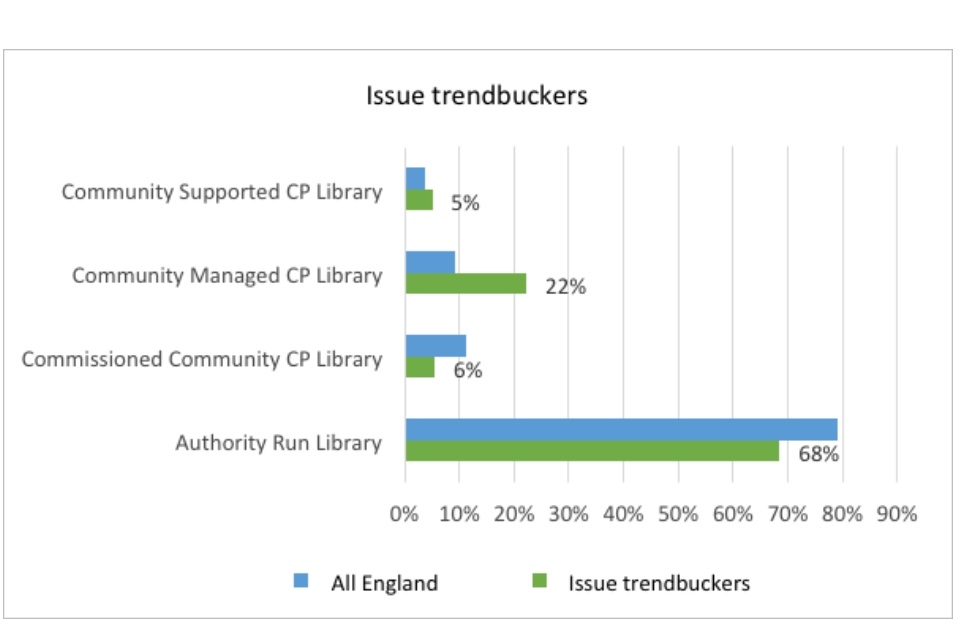
Graph showing issue trendbuckers
Although commissioned libraries outperformed on visits, they seem to have underperformed on book issues: only 7% of libraries in book issue trend-bucking services are commissioned, as compared to 11% overall. This may indicate that commissioned libraries are more likely to focus on visits as their dominant metric over book issues.
| 2016-2017 | Book Issue Trendbuckers | All England |
| Authority Run Library | 147 | 2048 |
| Commissioned Community CP Library | 12 | 294 |
| Community Managed CP Library | 48 | 241 |
| Community Supported CP Library | 11 | 94 |
In book issues per 1000 population, the trendbuckers largely track the average across all services until 2014-15, when they flatten, and then begin to show improvement after 2015-16.
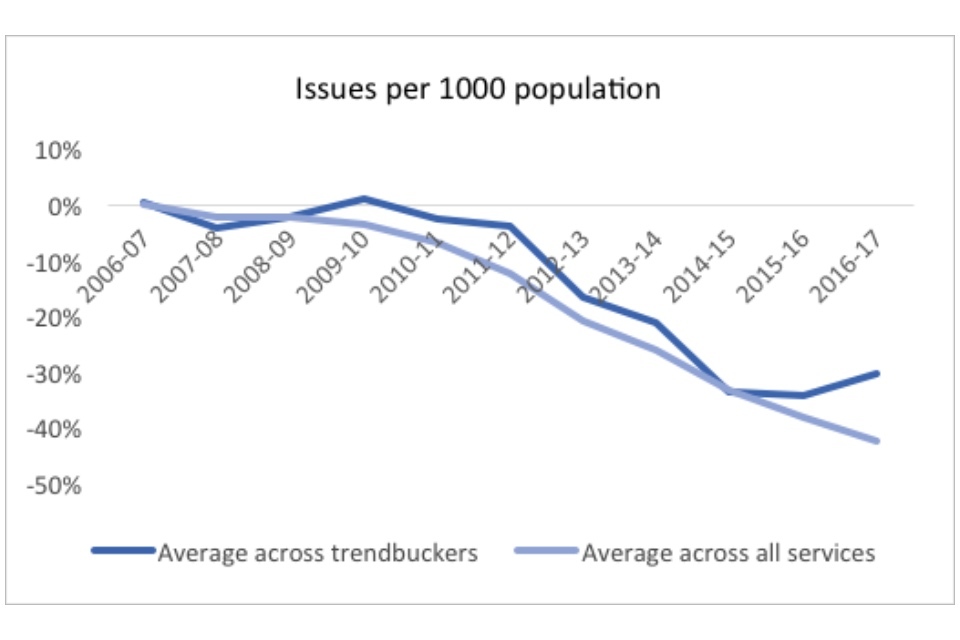
Graph showing issues per 1000 population
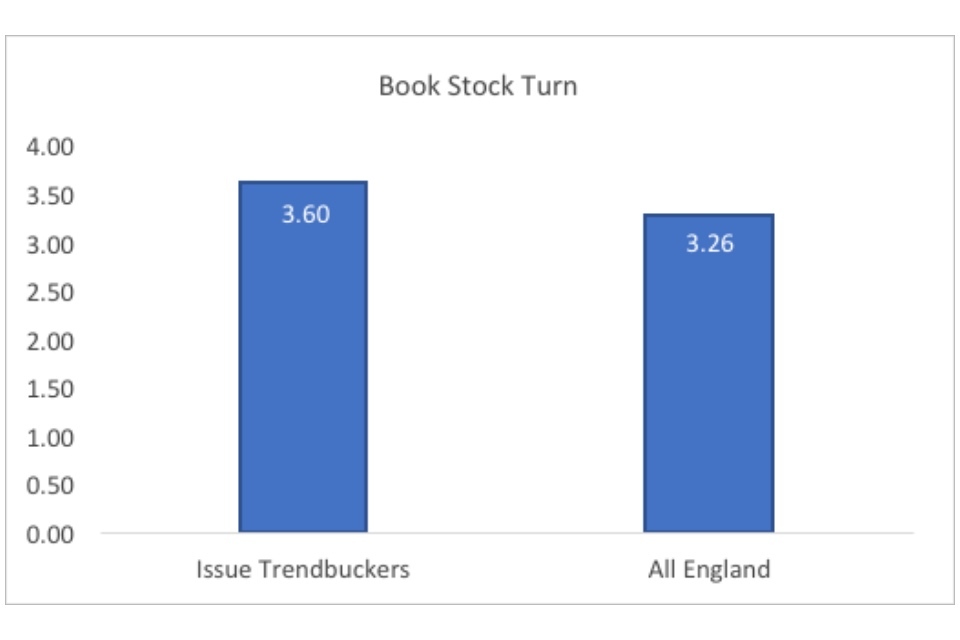
Graph showing book stock turn
Book stock turn – which is the average number of times a book is taken out in a given year - is higher for issue trendbuckers than England as a whole by roughly 10%, indicating that these library services choose stock that is more popular with their demographics.
Case study: Southwark libraries
The only library service to have increased its issues over the past decade, Southwark Library Service prides itself on its employee involvement in stock management. According to Praveen Manghani, the Libraries and Heritage Manager for Southwark Council, the staff “make the stock work hard”.
Southwark Libraries balance supplier selection for generic popular titles with employee selection of purchases, which are made with the individual library populations in mind. Approximately one third of purchases are supplier driven, with the remaining two thirds selected by employees. Southwark also uses data to assess performance monthly, looking not only at library performance, but also the performance of genres within each library. Staff can thus take a bespoke approach to match books to the appropriate populations. Another way performance is measured is by stock turn, with the higher being the better, as it demonstrates that the staff have picked stock that is truly in demand.
7. Issues with the data
7.1 Why examine the data?
The CIPFA dataset is regularly used by activists, stakeholders, and journalists to further the discussion around England’s public libraries.
Its perceived importance as a primary source of evidence cannot be understated. For instance, when the Carnegie UK Trust released its report on public libraries, Shining A Light, one prominent complaint was that the report neglected to include the CIPFA statistics.
Although the CIPFA data is the most complete, continuous set of data we have regarding the state of the nation’s library services, it is flawed. Given the influence of the CIPFA statistics on the conversation surrounding England’s libraries, it is critical to understand its limitations and the ways in which the data may be incomplete or misleading.
This report identifies the following flaws in the CIPFA datasets.
- The data is not structured appropriately for analytics.
- The data reflects inconsistencies in reporting.
- The data’s standardisation is opaque or misleading.
- The data does not measure the appropriate variables.
- The data lacks auditing and accountability.
7.2 Data structure
CIPFA statistics sheets were never designed to be a dataset; however, they are used as one by most stakeholders. As a result, the CIPFA data is not structured to provide information on improvement for individual library services, nor to facilitate services exploring the data themselves.
Formatting
Each year, CIPFA data is released in two forms: 1) a PDF booklet and 2) an excel spreadsheet.
There is no substantial variation in organisation between the two forms. As a result, the excel spreadsheet, as published, is practically unusable for analytic purposes. Variable names are spread across multiple cells, cells are merged arbitrarily, and some variable headings are found within the data rows. These qualities make even the most basic sorting function unusable. In order to analyse the data for this report, it took many hours of work to restructure the CIPFA statistics sheets into a rudimentary dataset.
The data also uses symbols in place of numbers in certain instances, which makes the data unfit to enter straightforwardly into other software analysis tools. For instance, 0 does not actually mean 0, but rather that the data is too small to register. Nil data is marked by ‘-‘, which is indistinguishable from non-applicable data. Given that it matters for analyses whether libraries spend £0 on e-books in a given year, or no longer purchase e-books (‘-‘), the symbols further complicated the work required to undertake this report.
Symbols used by CIFPA:
| 0 | Indicates that the figure is too small to register |
| .. | Indicates that information is not available |
| - | Indicates nil or not applicable |
| Col x | Indicates that data relating to this column are included in another column, (Column ‘x’) |
The last symbol demonstrates a particularly frustrating aspect of the spreadsheet: the propensity to place column labels in positions instead of numbers. For instance, when a service fails to return the desired data, instead of leaving the space blank, the relative column number is placed in the variable box. For example, see this information on Lewisham’s expenditures.
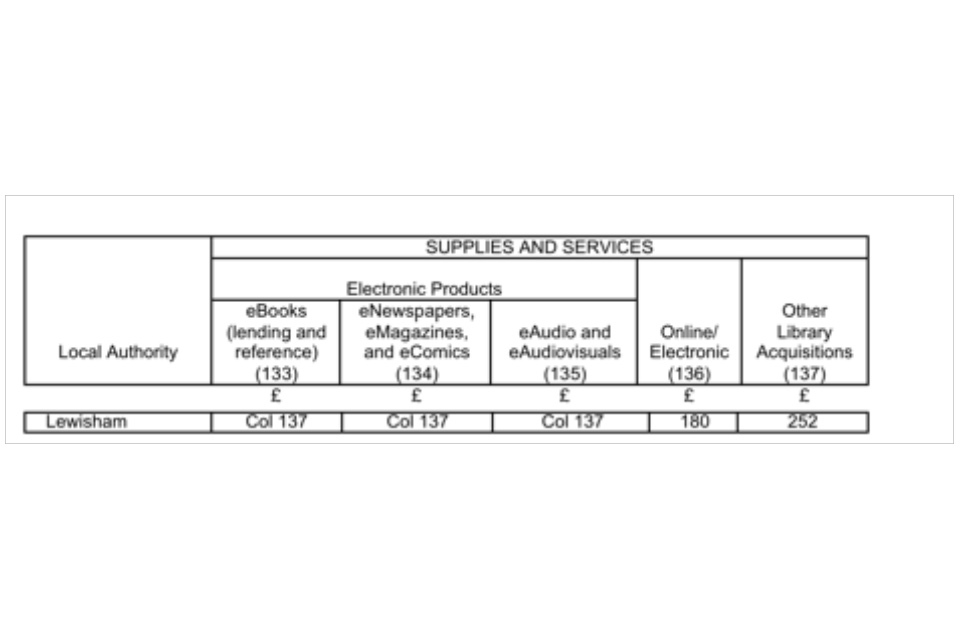
An excerpt from CIPFA of information on Lewisham's expenditures
The column number also does not match the actual column label in excel, making it difficult to find data. Column 137 in this spreadsheet (2016-2017) is located in column FG, the 162nd column in the data sheet. An out-of-date structure – seemingly made for access via paper, not computer – is contrary to the purposes of an online data set. The structure hinders data analysis on the part of DCMS, the local authority, or interested citizens.
7.3 Analysis
The structure of the data also prevents particular forms of analysis.
For instance, CIPFA warns in the notes preceding each year’s dataset the need for caution in making inter-authority comparisons. The note explicitly points out the differences between inner-city and rural authorities, whose cost bases differ dramatically due to the nature of the populations they serve.
However, this difference is exactly of the kind that a data-based approach should be able to account for. Categorising different authorities using relevant markers would enable useful inter-authority comparisons. For instance, library services that serve primarily poor populations would benefit from the ability to learn from their similarly-situated counterparts. CIPFA currently releases comparative profiles by authority class, which is a good start, but it doesn’t enable authorities to independently select the comparison variable. A metropolitan district authority and a London borough authority may vary in many ways, but share the same overarching demographic profile, making a comparison between the two valuable.
This isn’t necessarily to say that CIPFA must create multi-gigabyte datasets including every possible variable of interest for the purposes of making comparisons. Rather, by standardising its data structure, it would enable individuals to combine the CIPFA data with other variables of interest (such as census demographics released by the Office of National Statistics (ONS)) to draw new and interesting insights from the data.
CIPFA also currently misses the opportunity to record high impact events, such as renovations or temporary closures, within its data structure. For instance, Barnet Libraries experienced the closure of 10 (of 14 total) libraries “for a period of between 4 and 9 weeks as part of the building works programme during 2016-17.” CIPFA commented that this “has impacted on visitor and issue statistics,” but this key fact is hidden from the casual observer in one of the fifteen tabs (“Notes”) of the excel spreadsheet. There is no marker to sort the statistics of libraries with extenuating circumstances, which has probably affected graphs showing year-over-year data (such as figures 3 and 4).
7.4 Inconsistencies
CIPFA data is inconsistent over time. As this report showed, it was often the case that only 80 to 100 local authorities would report data on a given variable every year across the ten-year span.
In part, this is because local authorities voluntarily participate in the data collection and must pay to receive a return. As a result, library services can and do decide not to participate. The number of libraries reporting overall has decreased, from 100% of authorities in 2006-2007 to 86% in 2016-2017. The following graph shows the number and percent of libraries reporting as of 2009, when the total number of local authorities stabilized at 151.
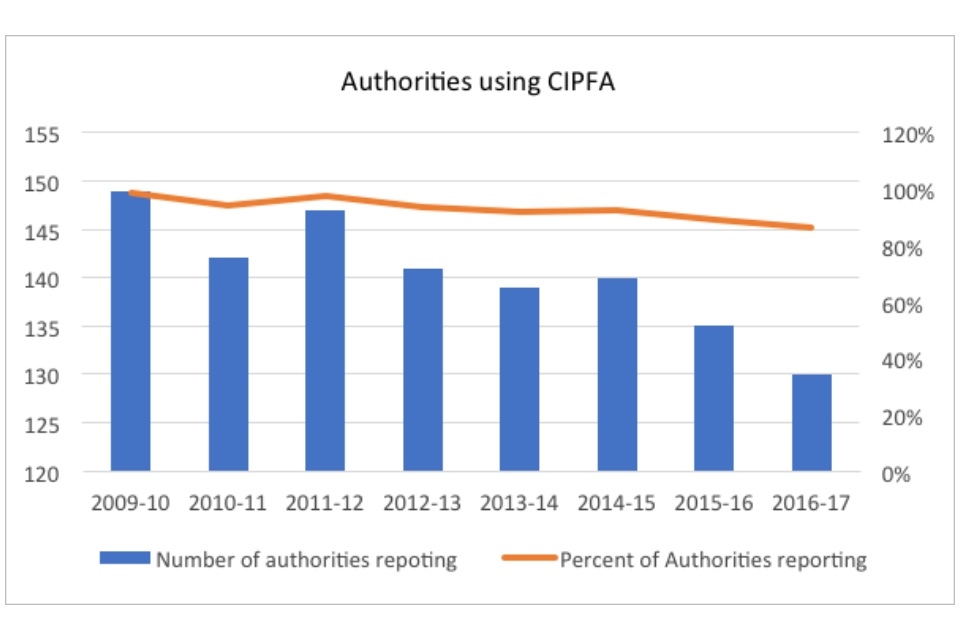
Graph showing the number of authorities using CIPFA
There are numerous reasons for this decline, but the most prominent one is that library services say they do not find the CIPFA data valuable. It is a time-consuming process to collect and report this data, which is done by filling out a survey manually (as opposed to computerised processes, such as data scraping). The data that is returned to them is often flawed and there are intense public pressures as a result of its publication (see the Accuracy section).
For the library services who do submit CIPFA data, it is increasingly difficult to justify the efforts to provide consistent and accurate data, especially given constrained resources. As a result, variables are left blank, further decreasing the consistency of the dataset overall.
The data can also be made irregular by other factors. In interviews, library staff have described how new management approaches or a new LMS can result in counts that are substantially different year-to-year, leading to variations in the data that may not be due to actual usage changes.
One variable where year-to-year variations are particularly noticeable is “virtual visits.” The following is a small subset of data, taking from the first 5 rows of an aggregation of all virtual visit data points.
| Local authority | 2008-09 | 2009-10 | 2010-11 | 2011-12 | 2012-13 |
| LA1 | 973,696 | 1,557,478 | 294,006 | 217,304 | 215,569 |
| LA2 | 2,286,335 | 3,830,221 | 3,013,416 | 679,792 | 737,313 |
| LA3 | 1,267,339 | 2,156,911 | 1,622,562 | 239,184 | 263,632 |
| LA4 | 1,099,746 | 1,730,885 | 1,292,082 | 280,369 | 203,257 |
| LA5 | 1,223,020 | 619,977 | 246,236 | 237,015 | 496,868 |
In the very first row, virtual visits drop from 1.5 million one year to less than 300,000 the next – a decrease of over 80%. In part, this is likely due to confusion around counting (for example, the distinction between a page hit and a visit) but there is room for data to change depending on the qualitative assumptions of the collector.
The CIPFA survey questionnaire asks for “Estimated number of visits to the network resource (website) in” the financial year. The Guidance Notes attached define a virtual visit as “a session of activity/series of one or more PAGE IMPRESSIONS, served to one USER, to the library website…The session is deemed to end when there is a lengthy gap of usage between successive PAGE IMPRESSIONS for that USER. As an example of a ‘lengthy gap’ would be a gap of at least 30 minutes. Count one visit per visitor session.”
Depending on the service, a staff member may think 25 minutes “rounds up”, whereas another staff member may examine the data more strictly.
An additional factor at play in virtual visits is the presence of joint service provision, where multiple local authorities share one service provider and therefore one website. This makes disaggregating the figures for the individual services very difficult. Finally, different services also use different analytical software, which will also vary in counting methodology.
The CIPFA data is especially vulnerable to counting inconsistencies concerning new technology, which is only to be expected given the necessary learning-curve. However, the CIPFA data is also vulnerable to inconsistencies between library services in one of its key metrics: visits.
Visits are a difficult metric to count in in particular because of the trend towards co-location. Libraries that are in the same building as other public services, such as a Jobcentre Plus, may be likely to increase visits. However, in order to accurately measure this, it would be important to sort the visitors to the library from the visitors to the other services. In a multi-use building, it is difficult to tell what visitors are using which services.
On top of this, there are multiple ways of collecting visits data. Some libraries use electronic counters, which is CIPFA’s preferred method. However, counters mark the movement at the door, not the direction of travel, so to account for exits, libraries will cut the number of electronic counts in half. (Anecdotally, there have been reports of libraries inadvertently submitting the total count). For more on this, see the Accuracy section.
Other libraries don’t have electronic counters and use sampling. CIPFA’s recommended sampling methodology encourages a one-week sampling of all visitors, which is then multiplied by 50 weeks (the missing 2 weeks are to account for bank holidays). The result is then a mix of luck and astuteness (because library services can select when these samples are taken, sampling during a popular week might therefore be preferred to an unpopular week).
The week-based sample therefore fluctuates depending on the surveyor’s decision, and its consistency depends on the decisions of the staff. There is no mandate that library services chose the same week each year. The variability in visits data is a critical limitation for the conclusions in the first half of this report.
7.5 Standardisation
Because the reporting has so many inconsistencies, CIPFA has standardisation protocols in-place to enable it to provide gross figures. CIPFA has two approaches, one for financial and one for non-financial information.
Financial information
‘Where a return has not been received from an authority the total will be derived by attributing the same level of increase among the class average for responders, to the expenditure observed by the authority in the previous year. Where this figure is also missing, then total expenditure and distribution is scaled to the per capita class average.’
CIPFA divides local authorities into classes based on their organisational structure. There are 4 classes in England: London Boroughs, Metropolitan Districts, English Unitary Authorities, and English Counties.
When a library service fails to turn in a piece of financial data, such as “revenue expenditure (per 1,000 population) on bookbinding,” CIPFA uses the previous year’s number to make an estimate. It does so by multiplying the previous figure by the “average increase” for the class as a whole. So when Barking and Dagenham failed to return their bookbinding expenditure figure for 2016-2017, CIPFA would have used the figure from the year before, multiplied by the average percent change for all London Boroughs, to receive a figure it could use to gross the data for all of England.
Because it is possible that library services are less likely to turn in figures that are poor, it is feasible that these “class scales” are making for over-estimates. In addition, as more library services drop out, the fewer services these average percent differences are drawn from, the more likely each average is to be swayed by outliers.
Non-financial information
For non-financial information, such as number of visits or stock of children’s fiction, CIPFA has a different strategy.
“Where a return was received in the previous year, the same data are adopted. Otherwise the class average is scaled by percentage increases based on real returns in the same class of authority.”
This means that when Leicester failed to return its total book stock figure, CIPFA checked to see if the data point existed in the year before. If so, they simply used the previous year’s figure in tallying the sum for the class (Unitary Authority), nation (England), and country (UK).
If Leicester had also failed to return the data point the year before, the sums would be determined by multiplying the previous year’s figure by the average percent increase across all the real returns in the class. For example, if Lincolnshire, Norfolk, and North Yorkshire showed percent increases of 1%, 3%, and 5% respectively, those increases would be averaged (3%) and then last year’s figure for the entire class (encompassing all 4 libraries) would be multiplied by 103% to get the final figure.
Once again, this is may result in over-estimations, because underperforming library services could be more likely to fail to return data, and as fewer libraries report, the averages are more likely to be swayed by outliers in percent change.
7.6 Variables and measurement
The CIPFA variables and measurement granularity are not fit for purpose. It is therefore questionable about how useful the current CIPFA variables and granularity of measurement are for making any judgements about the current performance of library services in England, or for using as benchmarking data which could assist library services in identifying strategies for improvement.
As mentioned in the ‘changing use’ argument, some variables that CIPFA measures no longer reflect the primary duties of the library. For instance, enquiries have dramatically lowered in response to the rise of online searching, as students and researchers find the information they need at hand.
As mentioned above, because CIFPA does not audit the figures, there is no way of being certain that measurements are consistent across services. For instance, a large discrepancy in visit numbers is the difference between “entry/exit” measures and “action” measures. Some library services have installed electronic door counters that measure each time the building is accessed, whereas other services use sampling, and still others only mark a visitor when they have performed an action – such as visiting the front desk or taking out a book.
In particular, some measurements run against the code of ethics followed by library professionals. It is important that privacy be maintained, especially for some of the most vulnerable users, who can only access sensitive or personal information and advice at the library (for example, research on sexual health, online banking).
For this reason, library professionals can be hesitant when they believe measuring a particular figure may be intrusive. For instance, distinguishing between “visits for library purposes” and “visits for non-library purposes” (two CIPFA variables) may require more interaction than customers desire to give or staff feel appropriate to ask for.
In other ways, CIPFA misses important variables that either reflect the changing nature of library use today or enable library services to pinpoint trouble spots or learn from each other. For instance, this report evidenced the lack of variables surrounding management and staff quality, such as paygrades, professional development and average duration of employment. Other missing variables include information such as how wifi is used (gigabytes downloaded) or streaming services, and variables that reflect the use of libraries as ‘community hubs’: reservations, events, special displays, and co-locations.
Library services would also benefit from qualitative variables that demonstrate best practices. Certain Library Management Systems (LMS) or book suppliers may be associated with better outcomes for different services; by recording what libraries use which, suppliers and which libraries adopt innovative practices (for instance, purchasing access to a data management system – there is currently no record of what percent of public libraries in England are data-driven), library services can both adopt and borrow each other’s strategies, as well as potentially “poach” each other’s employees, creating a thriving and vibrant market for library professionals.
One particularly insightful comment on the part of a library staff member noted that CIPFA tends to “measure outputs, not outcomes.” When library services feel as though they are fighting for resources, it is critical that they be able to demonstrate to their communities the impact they have.
In-house data systems like that of Norfolk library service have turned to the Libraries Deliver strategy document to determine which outcomes they should aim to measure. There are 7 such outcomes:
- cultural and creative enrichment
- increased reading and literacy
- improved digital access and literacy
- helping everyone achieve their full potential
- healthier and happier lives
- greater prosperity
- stronger, more resilient communities
By categorising “business events” such as Start-Up Day or “health partnerships” with NGOs such as Dimensions, library services can start pointing to metrics that actually matter to their communities. (This would also be served by better structured data, as aligning such outcome measurements with other information on population demographics or investment by other sectors would enable a multi-sectoral approach to truly tackle some of the most pressing issues facing England’s local authorities).
7.7 Accuracy
CIPFA relies on voluntary reporting by local authorities, who then purchase access to the complete statistics sheets roughly 6 months later. (DCMS purchases access to the comparative profiles for all local authorities).
The voluntary nature of the reporting, in conjunction with the lack of positive incentives to report and the negative publicity that results from publishing low numbers means there is little incentive – aside from professional pride – to ensure that the numbers are high quality.
Collecting data on over 150 separate variables (2016-2017) is strenuous and time-consuming. As budgets shrink, there are fewer staff-hours available for the task. In addition, library services already have staff at work on collecting data variables that they find useful (see “Variables”, above) and at the appropriate level of granularity.
CIPFA reports at the service-level, but trouble spots in services are often only locatable at the library level. For instance, GLL’s in-house data system can identify not only the particular library whose issues have shrunk, but also the particular category of book (for example, where Adult Fiction issues have declined but Children’s Non-fiction has increased). Southwark – the only library service with a ten-year percent increase in issues (24%) – goes still further in its data collection and can identify fluctuations not only by library and category, but also by genre (such as, business books, fantasy). Norfolk libraries examines their “Public PC sessions per hour per weekday,” enabling them to pinpoint the needs of their customers. They can place anonymised demographic information (sex and age) alongside post-code analysis, in order to determine how they are meeting their equity goals (based on the 7 outcomes in the Taskforce’s vision for public libraries in England, Libraries Deliver).
These data-minded services check their statistics on a weekly or monthly basis, allowing for real-time brainstorming and solution implementation. Not only are the CIPFA statistics too broad, but they are also too late. Six months after the fact is much too slow for a modern library service.
Library service staff have said that the most useful aspect of the CIPFA data is the rankings, which show how library services are performing in comparison to their class (for example, among Unitary Authorities or Metropolitan Districts) and across the country as a whole. Library services are proud to top figures such as most visits or most issues.
After the publication of the CIPFA statistics, it is common to find journalists and campaigners providing rudimentary analysis – usually negative – on the basis of the overall trends. The negative publicity reinforces the idea of library services is decline and makes political manoeuvring around scarce resources still more difficult. As the data is not the appropriate level of granularity (making accuracy less useful to the individual service) and requires a time-consuming collection process, there is no reason for library services to 1) double-check their data for accuracy; and 2) re-examine their collection process for distortions.
This can lead to all manner of errors. Some of the following have been mentioned in interviews across the sector:
- double-counting issues, such as inter-library loans, which are checked out both at point of origin and delivery point
- forgetting to remove the names of deceased citizens from active borrower lists
- failing to halve the numbers from electronic door counters (as people enter and exit, the electronic counter tallies them twice)
- not standardising visits counts from electric door counters on the day of fire drills or other special circumstances (in the case of a fire drill, visitors enter and exit twice and are counted as such)
- sampling on days with special events, skewing the visitor numbers larger
Although CIPFA itself does a quality assurance and quality control (QAQC) post-collection, (reportedly at least 3 times before publication), the lack of an auditing system means that it is not possible to catch some of these errors.
7.8 Moving forward
Finally, the nature of CIPFA’s statistics sheets goes against very ethos of the library sector: proprietary data, expensive and inaccessible, is the exact opposite of the free and open information libraries are proud to provide.
Some library systems are experimenting with alternative data aggregators, and in particular are moving towards “open data.” This has been encouraged as a part of the Government Transformation Strategy.
Defined by the Open Data White Paper (2012), “open data” is data that meets the following criteria:
- accessible (ideally via the internet) at no more than the cost of reproduction, without limitations based on user identity or intent
- in a digital, machine readable format of interoperation with other data
- free of restriction on use or redistribution in its licensing conditions
The transparency provided by open data enables people to make better choices about their public services and hold their government accountable on spending and outcomes. As part of this movement, the Libraries Taskforce is collating its Core Dataset, with an automated and transparent process to gather data and share it.
8. Main takeways
-
Overall, the CIPFA data shows a continuing decline in public library use (both in visits and book issues) in England. But: a. The downward trend may be slowing b. The overall trend masks significant variations across and within library services
-
Over one quarter of all library services are trendbuckers, meaning they have shown an increase in use (visits or issues) over the past year and/or the past decade.
-
The report considers 7 arguments - including cuts, the digital shift, and the failure to modernise - posited as explanations for the overall trend of decline in use of libraries, using data to analyse them when possible. No one argument was found to be sufficient as an explanation for decline on its own.
-
Analysis of the arguments pointed at underlying (unmeasured) variables which distinguish the “high-performers” from the rest, namely forward-thinking leadership alongside the political support and purchasing flexibility needed to innovate in response to structural changes.
-
The second half of the report comments on the limitations of the data collected by CIPFA. The CIPFA statistics sheets were not designed to be a dataset and have only been used as such due to the lack of any alternative national figures. The statistics sheets have significant flaws that undermine their ability to be used as a definitive and authoritative source of data on trends in public library usage over time. The flaws fit into 5 broad categories: issues with structure, consistency, accuracy, standardisation, and variable selection and measurement.
-
The flaws in the data impair our ability to understand trends at the national level in a comprehensive way. It may be possible to remedy this if all library services contribute in the future to a consistent and comprehensive open dataset, along the lines of the work currently being led by the Taskforce Team on implementing the collation and publication of the Core Dataset previously agreed by the sector.
9. Annex
9.1 Terms and definitions
Local authority – a local government in the United Kingdom with the statutory responsibility to provide library services.
Library service – an authority-wide library system.
Statutory library – a service point that counts towards a library service’s statutory duty, for example, the provision of the following services:
- encourage both adults and children to make full use of the library service (section 7(2)(b)); and
- lend books and other printed material free of charge for those who live, work or study in the area (section 8(3)(b)).
Service point – any library, static or mobile, through which the public library authority provides or directly manages a service to the general public.
Issue – the loaning of material. Issues may be book, audio, visual, or other (e-book, etc.). When referred to, issues means all issues of all materials. Other issues will be named according to material (such as, book issue).
-
Boots has approximately 2,500 stores in the UK as of 2017 and Costa Coffee has 2,422 stores in the UK as of 2017. ↩
-
One can see that the sample size for each variable (book issues and visits) alone is greater than the sample size for both (106 versus 100). This is because the methodology of this report only counts library services if they have every data point for every variable. The fewer variables examined, the more library services will have submitted 10 years’ worth of data. ↩
-
The emphasis on book issues over all issues reflects that the statutory requirement on public libraries in England to “lend books and other printed material free of charge.” ↩
-
2013-2014 is the first year for which data based on the statutory nature of each library is available. ↩
-
Trendbucking library services are not synonymous with the top quintiles examined above. For one, there are more of them (35, as opposed to the 16-20 – depending on the completeness of the data – for each variable-based quintile). For another, trendbuckers are both those who have succeeded in the past year as well as over the past decade, whereas quintiles are just judged on their decade averages. ↩