AAA screening standards: data report 1 April 2018 to 31 March 2019
Published 13 November 2019

© Crown copyright 2019
This publication is licensed under the terms of the Open Government Licence v3.0 except where otherwise stated. To view this licence, visit nationalarchives.gov.uk/doc/open-government-licence/version/3 or write to the Information Policy Team, The National Archives, Kew, London TW9 4DU, or email: psi@nationalarchives.gov.uk.
Where we have identified any third party copyright information you will need to obtain permission from the copyright holders concerned.
This publication is available at https://www.gov.uk/government/statistics/abdominal-aortic-aneurysm-screening-2018-to-2019-data/aaa-screening-standards-data-report-1-april-2018-to-31-march-2019
1. Introduction
The NHS Abdominal Aortic Aneurysm Screening Programme (NAAASP) aims to reduce aneurysm-related mortality through early detection, appropriate monitoring and treatment. NAAASP invites men for ultrasound screening during the year they turn 65 while men over 65 who have not previously been screened can self-refer.
The programme offers quarterly or annual surveillance for all men who on initial scan are found to have a small or medium aneurysm. Men found to have a large aneurysm are referred into the care of vascular services for diagnosis and treatment.
The standards give a defined set of measures that providers must meet to ensure providers are safe and effective. NAAASP published a set of revised standards in April 2015.
Performance against standards are published annually unless they are also a key performance indicator (KPI) in which case performance is published quarterly and annual figures are aggregated where data were provided for all 4 quarters.
Performance thresholds are selected to align with existing screening standards and service objectives. Overall 2 thresholds are specified.
Acceptable threshold
This is the lowest level of performance which screening services are expected to attain. All screening services should exceed the acceptable threshold and agree service improvement plans to meet the achievable threshold. Screening services not meeting the acceptable threshold are expected to put in place recovery plans to deliver rapid and sustained improvement.
Achievable threshold
This represents the level at which the screening service is likely to be running optimally. All screening services should aspire to attain and maintain performance at or above this level.
Data are presented by financial year (1 April 2018 to 31 March 2019) unless stated otherwise.
2. Results
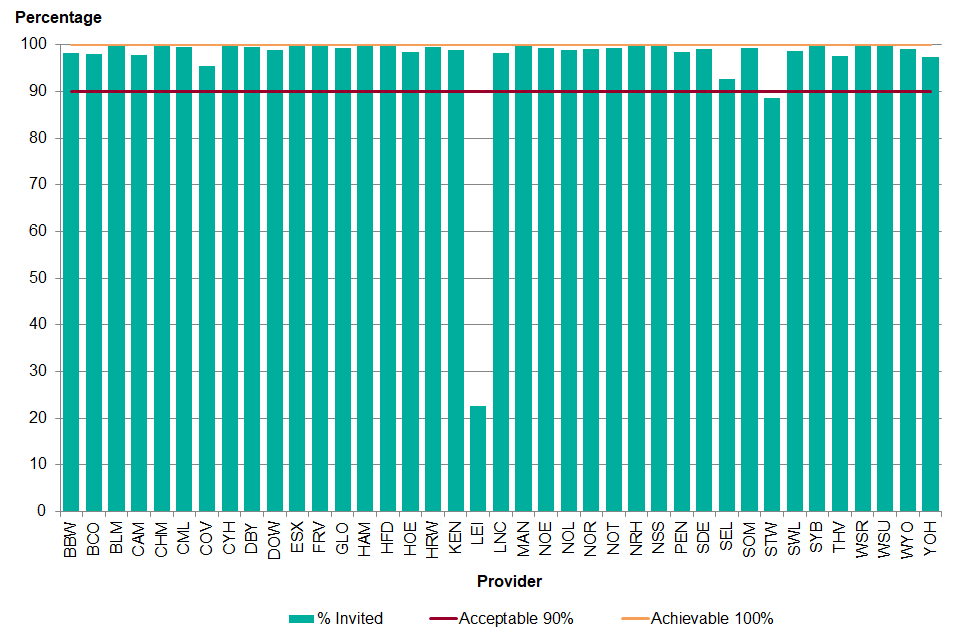
2.1 AAA-S01a Percentage of eligible cohort men who are offered an initial screen
Numerator: number of eligible cohort men offered screening within the screening year plus 3 months
Denominator: number of eligible cohort men
This standard is needed to provide assurance that screening is offered to everyone who is eligible. Men should be invited within the screening year in which they turn 65. An additional 3 months after the end of the screening year is allowed in the event of a man being loaded into the cohort on the last day of the screening year or if a man does not attend his appointment at the end of the screening year. This allows a second invitation to be sent.
An offer of an appointment is not considered to be made if it has not reached the participant. Therefore, if the provider has incorrect contact details or if a post office return is received, the offer is not counted in the numerator.
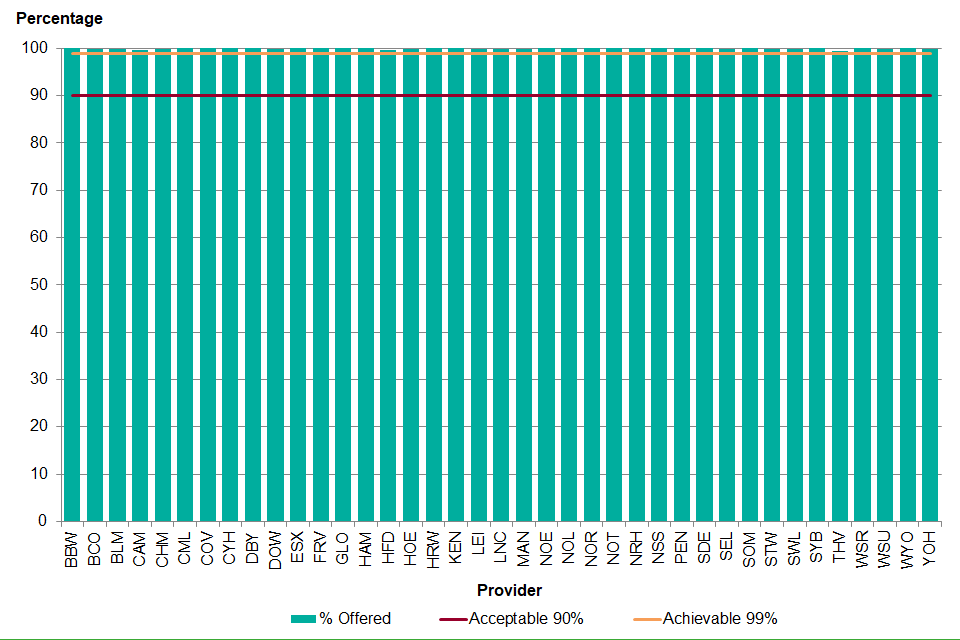
Figure 1. Percentage of eligible cohort men offered screening within the screening year plus 3 months, 1 April 2018 to 31 March 2019
There were 292,875 men aged 65 eligible for abdominal aortic aneurysm (AAA) screening between 1 April 2018 and 31 March 2019. Of the eligible men, 99.9% were offered an initial screen.
The reasons for not being invited include:
- incorrect contact details
- deferring screening
- opting out of the screening programme receiving personal details for screening
- offered after 30 June 2019
- not offered
Between 1 April 2018 and 31 March 2019, all 39 providers reached the achievable level of offering at least 99.0% of the eligible cohort an appointment within the screening year plus 3 months (see Figure 1).
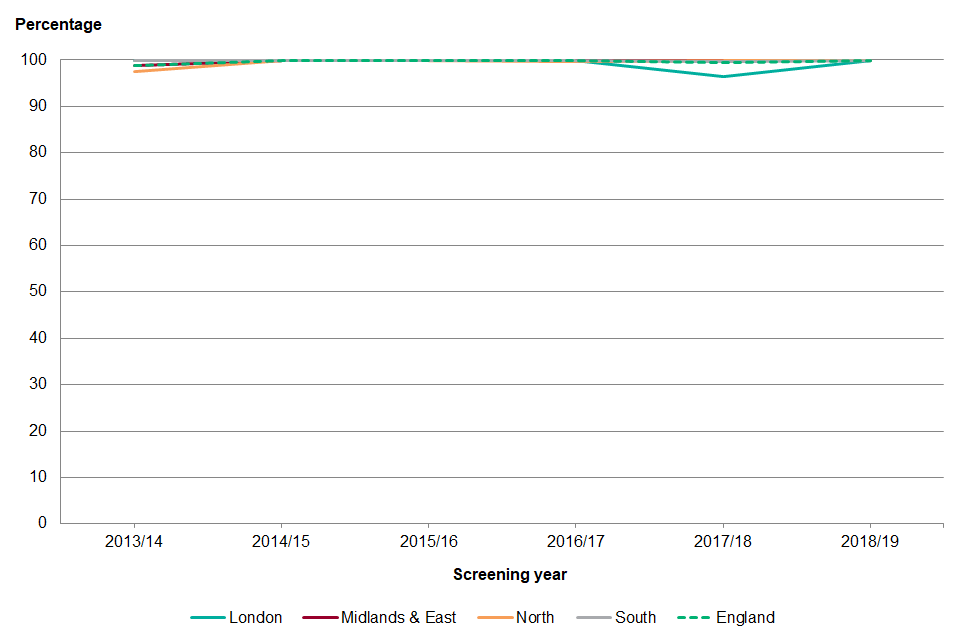
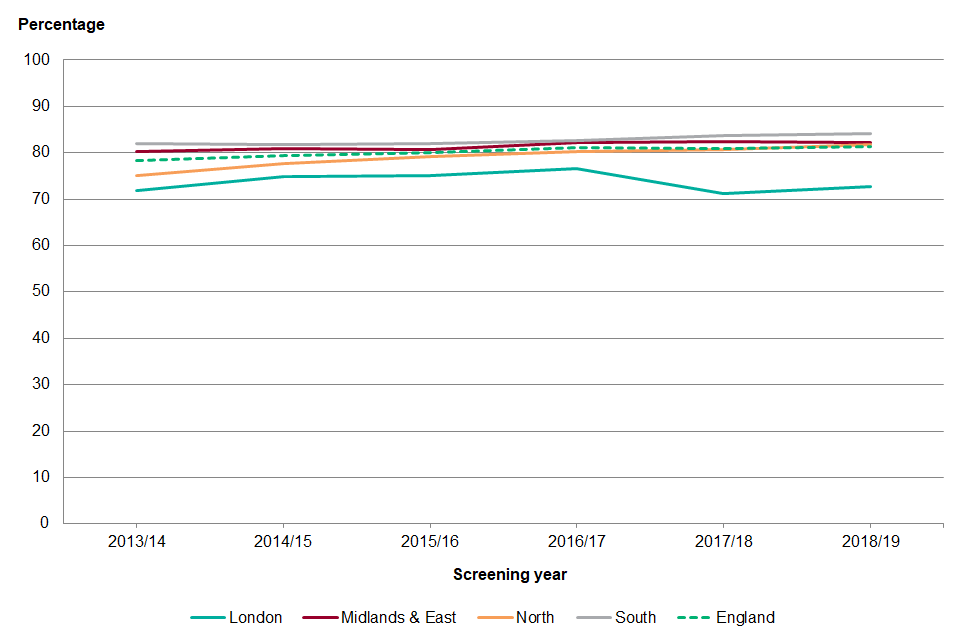
Figure 2. Percentage of eligible cohort men offered screening within the screening year plus 3 months, 1 April 2013 to 31 March 2019
Offer of the initial screen to men in each cohort year has been relatively stable over the past 5 years (see Figure 2). Nationally the achievable threshold of 99.0% has been met since 1 April 2014 to 31 March 2015. Following a slight drop in completeness of offer in the 2017 to 2018 screening year to 99.4% it has now risen back to 99.9%.
North London and Thames Valley have increased completeness of offer from the last screening year to reach the achievable threshold this year (100.0% and 99.5% respectively).
Following a commissioning process, the North London provider commenced screening on 1 April 2018 and also had responsibility for screening outstanding cohort men from the previous 3 north London providers. South East London also increased their completeness of offer from 86.4% to 99.8%. There was no provider in place between November 2017 and June 2018. Kent and Medway acting as interim provider, invited the outstanding 2017 to 2018 cohort and 2018 to 2019 cohort between June 2018 and June 2019.
There were 10,906 men who self-referred into the AAA screening programme between 1 April 2018 and 31 March 2019 and 99.7% were offered an initial screen. A total of 38 men were not offered an initial screen.
The reasons for not being invited include:
- deferring screening
- declining screening
- offered after 30 June 2019
- not offered
Recommendations
Performance against this standard has exceeded the achievable threshold. Providers should review those men who have not been invited to make sure that they have not missed the opportunity to be screened and that the records have been appropriately managed on the national system SMaRT (screening management and referral tracking).
2.2 AAA-S01bi Percentage of annual surveillance appointments due where there is an offered appointment within 6 weeks of the due date
Numerator: number of appointments offered within 6 weeks of the corresponding due date where the man was eligible for annual surveillance
Denominator: number of appointments due where the man was eligible for annual surveillance
The purpose of collecting data against this standard is to ensure that all men on annual surveillance for a small AAA (aorta size of 3.0 to 4.4cm) are offered an appointment that occurs up to 6 weeks before or 6 weeks after when they are due to be rescreened. This is to make sure that men are tested on an annual basis and it gives an indication of screening provider capacity.
The standard counts appointments rather than men as some men may have more than one appointment due during the screening year.
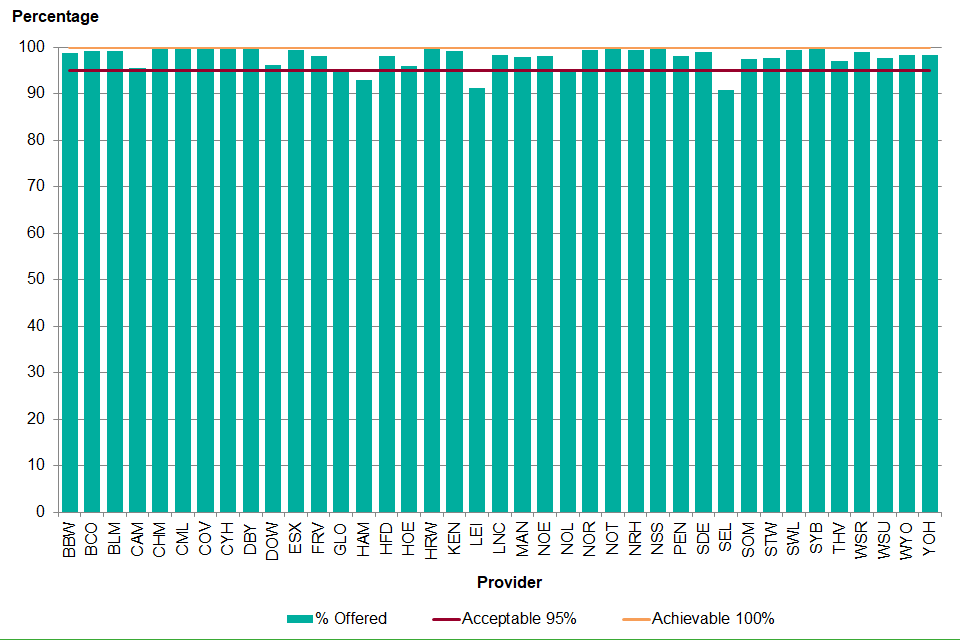
Figure 3. Percentage of annual surveillance appointments due where there is an offered appointment within 6 weeks of the due date, 1 April 2018 to 31 March 2019
Between 1 April 2018 and 31 March 2019 there were 12,551 annual surveillance appointments due and 12,282 had an offer within 6 weeks of their due date (97.9%). There was little variation across the country; the interquartile range was 1.78%.
A total of 3 providers did not meet the acceptable threshold of offering 95.0% of annual surveillance appointments within 6 weeks of when they are due. There were 30 providers who met the acceptable threshold of 95.0% and 6 providers met the achievable threshold of 100.0%.
The national AAA screening programme introduced the surveillance standards in April 2015 following a year developing and piloting the standards with the local screening providers. Nationally the performance has remained similar across all 3 years at approximately 98.0%.
A total of 11 providers had an increase of more than 1% in the percentage of annual surveillance appointments with an offer within 6 weeks of the due date between 2016 to 2017 and 2018 to 2019. A total of 20 providers had no change and 8 had a decrease of more than 1%.
Recommendations
Providers must make sure that the process for booking surveillance appointments enables appointments to be within 6 weeks either way of the due date.
Providers must routinely review the SMaRT alert screen for those due to be screened.
2.3 AAA-S01bii Percentage of quarterly surveillance appointments due where there is an offered appointment within 4 weeks of the due date
Numerator: number of appointments offered within 4 weeks of the corresponding due date where the man was eligible for quarterly surveillance
Denominator: number of appointments due where the man was eligible for quarterly surveillance
The purpose of collecting data against this standard is to ensure that all men on quarterly surveillance for a medium AAA (aorta size of 4.5 to 5.4cm) are offered an appointment that occurs up to 4 weeks before or 4 weeks after when they are due to be rescreened. This is to make sure that men are tested on a quarterly basis and gives an indication of screening provider capacity. The standard counts appointments rather than men as men will have more than 1 appointment due during the screening year.
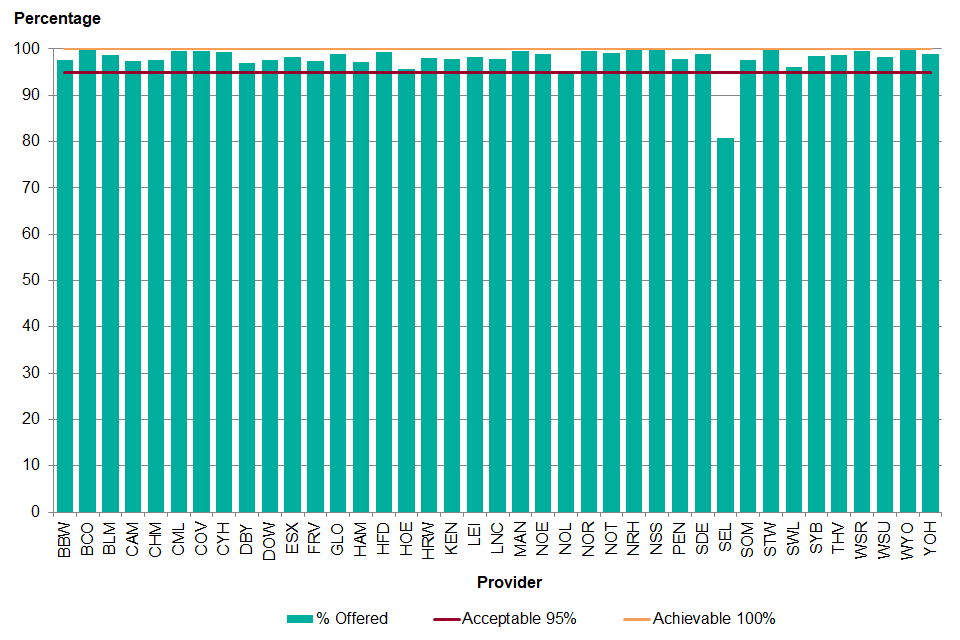
Figure 4. Percentage of quarterly surveillance appointments due where there is an offered appointment within 4 weeks of the due date, 1 April 2018 to 31 March 2019
There were 9,500 quarterly surveillance appointments due between 1 April 2018 and 31 March 2019 and 9,326 appointments were offered within 4 weeks of the due date (98.2%). As with the annual surveillance men, there is little variation across the country (interquartile range 1.77%). North London and South East London were under the acceptable threshold of 95.0% for 1 April 2018 to 31 March 2019.
South East London had no provider in place between April and June 2018, which has had an impact on the quarterly surveillance standards. A total of 32 providers reached the acceptable threshold and 5 reached the achievable threshold of 100.0%.
Between 2016 to 2017 and 2018 to 2019, 14 providers had an increase of more than 1% in the percentage of appointments with an offer within 4 weeks of the due date. The largest increase was a 18.6% increase to 97.9% in Lincolnshire. A total of 17 providers had no change in the percentage of appointments offered within the timeframe and 8 had a decrease of more than 1%. The largest decrease was 12.4% to 80.9% in South East London.
Recommendations
Providers must make sure that the process for booking surveillance appointments enables appointments to be within 4 weeks either way of the due date.
Providers must routinely review the SMaRT alert screen for those due to be screened.
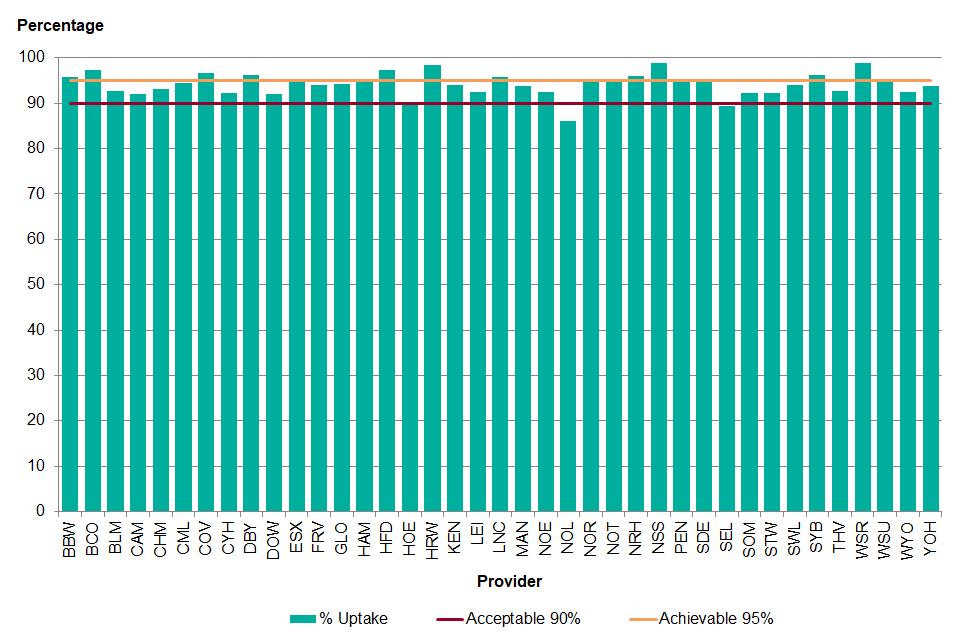
2.4 AAA-S02a Percentage of eligible cohort men who are conclusively tested
Numerator: number of eligible cohort men conclusively tested within the screening year plus 3 months
Denominator: number of eligible cohort men
Coverage is an important measure for the screening programme as it provides an indication of the accessibility of the service and the acceptability of the screening test. This standard needs to be looked at in conjunction with the percentage of people offered an initial screen. A low coverage may be the result of people not attending the initial screening appointment, formally declining screening or it may be because they have not been offered the screen.
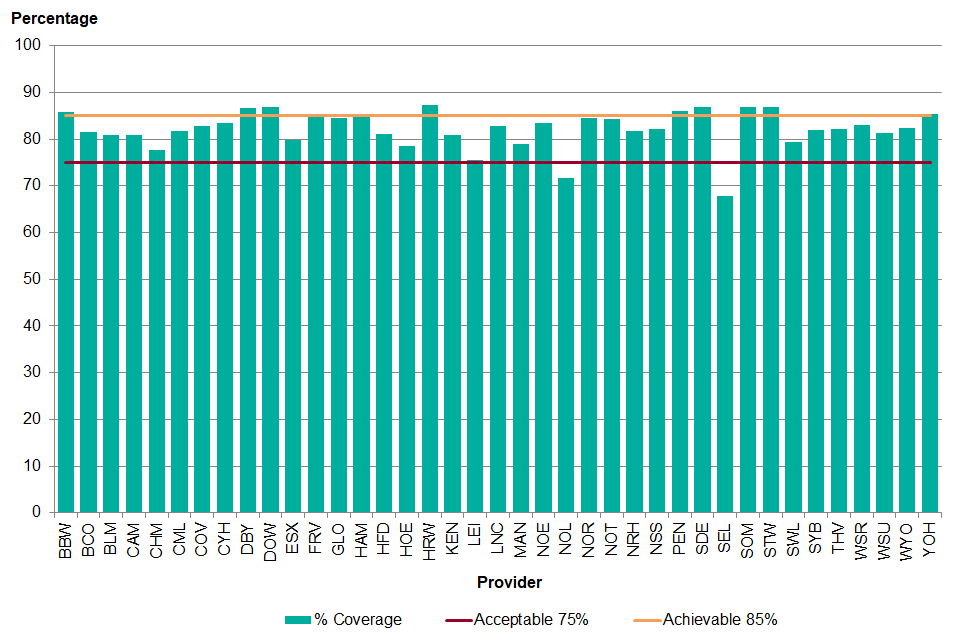
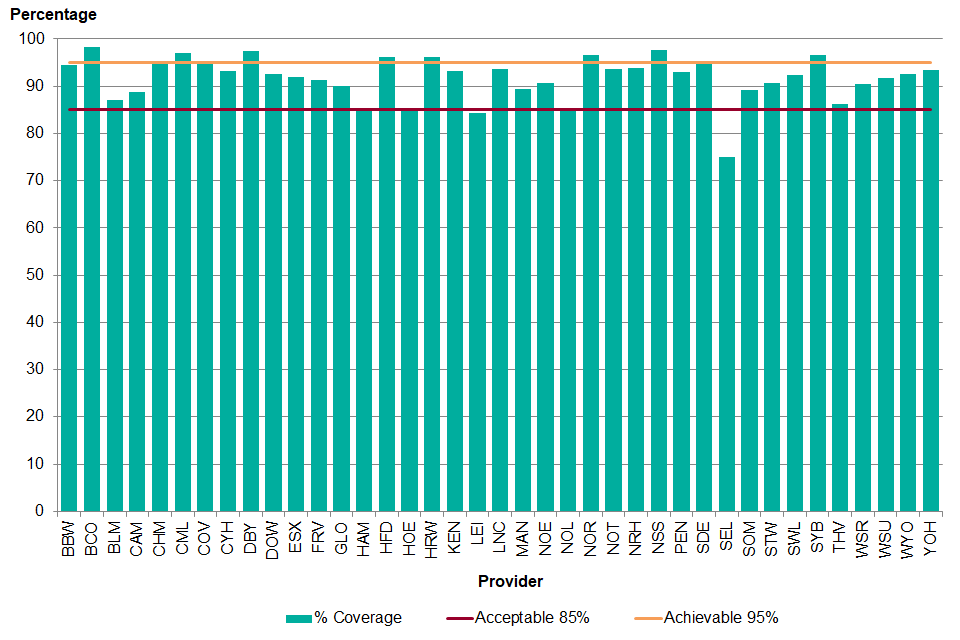
Figure 5. Percentage of eligible cohort men conclusively tested within the screening year plus 3 months, 1 April 2018 to 31 March 2019
Nationally 81.3% of eligible men were conclusively tested within the screening year plus 3 months. A total of 2 providers did not meet the acceptable threshold of 75%, North London and South East London. North London starting screening from 1 April 2018 and South East London started screening from July 2018. A total of 27 providers reached the acceptable threshold and 10 reached the achievable threshold of 85%.
The highest coverage was 87.4% in Herefordshire and Worcestershire, a 1.5 percentage point increase compared to 1 April 2017 to 31 March 2018. South East London had the largest increase from 1 April 2017 to 31 March 2018 (13.0 percentage points).
As shown in Figure 6, men living in the most deprived tenth of areas of the country were less likely to attend for screening compared to those living in the least deprived areas (70.6% to 88.2%). This contrasts with the detection of aneurysms, which was highest for men living in the most deprived tenth of areas and lowest for men living in the second least deprived tenth of areas (1.34% to 0.64%).
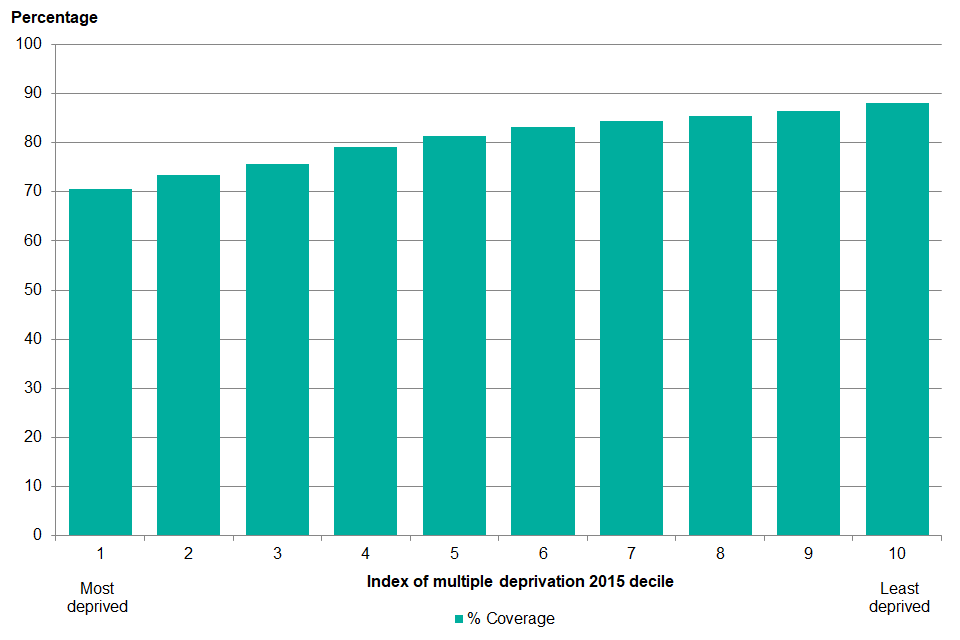
Graph showing percentage of eligible cohort men conclusively tested within the screening year plus 3 months by index of multiple deprivation (IMD) 2015 decile, 1 April 2018 to 31 March 2019
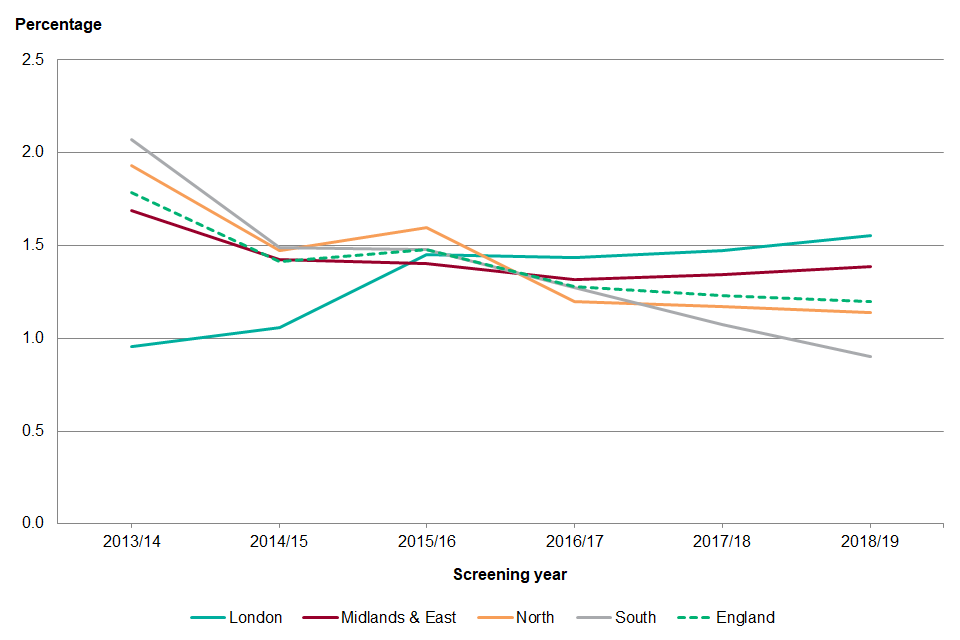
Between 1 April 2018 and 31 March 2019, 2,318 eligible cohort men tested were found to have an aneurysm of 3.0cm or greater (0.97%). This varied from 0.66% in North London to 1.77% in Lincolnshire. The percentage of men with aneurysms continues to decline each year, although there are some providers where the percentage has been increasing for the past 3 years. It is thought to be due to the population of men in the area as the delivery of the screening programme in the areas has not changed and coverage has not increased significantly.
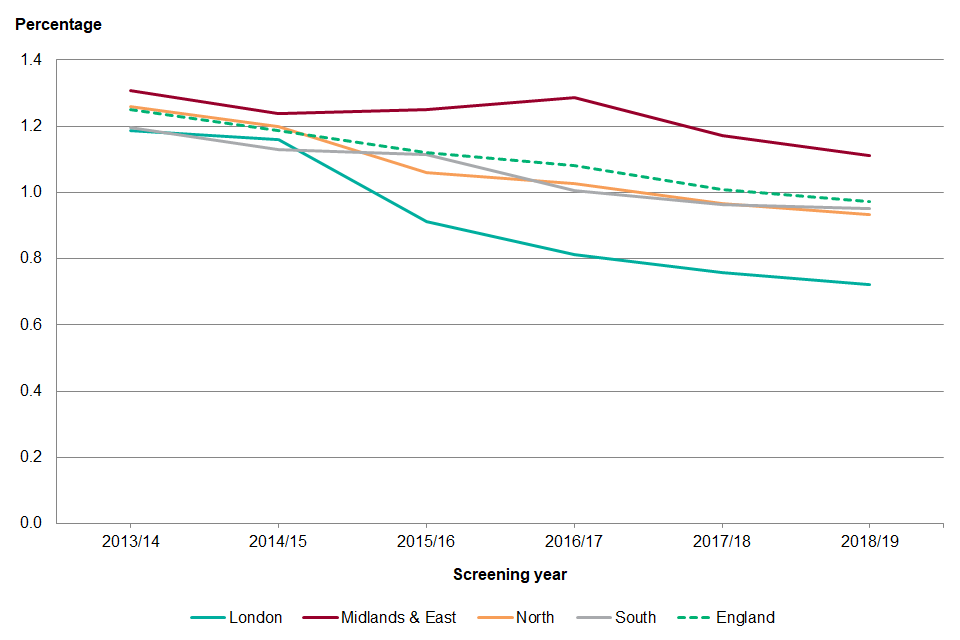
Graphe showing percentage of aneurysms detected in eligible cohort men, 1 April 2013 to 31 March 2019
Coverage has been gradually increasing across each of the regions from 1 April 2013 onwards. However, there was a decline in coverage in London for 1 April 2017 to 31 March 2018 due to the commissioning of new services but performance has improved in the past year.
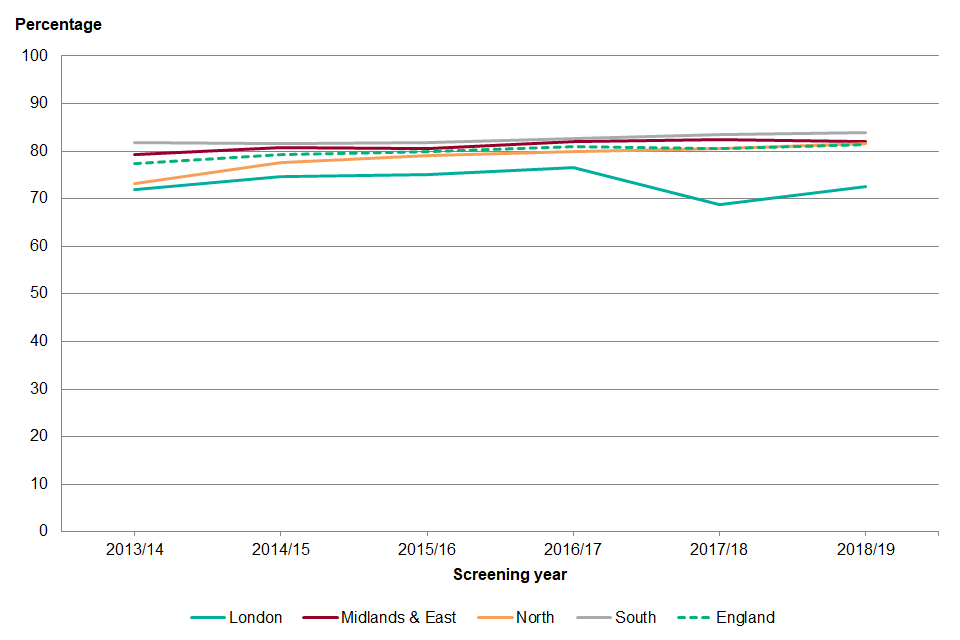
graph showing percentage of eligible cohort men conclusively tested within the screening year plus 3 months, 1 April 2013 to 31 March 2019
The coverage of the initial screen in men self referring to AAA screening was 97.6%, which was higher than for 1 April 2016 to 31 March 2017 (95.8%). Coverage ranged from 87.4% in Gloucester to 100% in Black Country and Bedfordshire, Luton and Milton Keynes. When the coverage of screening in self referral men is broken down by IMD2015 decile, coverage is similar across all groups (93.1% in decile 1 to 98.3% in decile 10) for 1 April 2018 to 31 March 2019. However, only 3.7% of the men self referring lived in the most deprived tenth of areas in the country whereas 16.1% lived in the least deprived tenth of areas.
The percentage of aneurysms detected in self referral men was 3.2%. This was higher than in the cohort men and varied from 1.0% in Shropshire, Telford and Wrekin to 7.7% in Leicester. The risk of developing an aneurysm increases with age resulting in a higher detection rate in men self referring into the programme. Men who self referred in 2018 to 2019 were on average aged 76 years but this varied from 66 to 95 years.
Recommendations
Providers are encouraged to review the inequalities toolkit for best practice on increasing coverage.
Providers should use the deprivation and ethnic group report to better understand coverage within their area.
Providers are encouraged to submit any subsequent interventions to reduce inequalities to the toolkit.
2.5 AAA-S02bi Percentage of annual surveillance appointments due where there is a conclusive test within 6 weeks of the due date
Numerator: number of conclusive tests occurring within 6 weeks of the corresponding due date where the man was eligible for annual surveillance
Denominator: number of appointments due where the man was eligible for annual surveillance
Men who have an AAA are at an increased risk of rupture so it is important for men to be screened in a timely manner. For men with a small AAA they should be screened on an annual basis. This standard should be looked at in conjunction with the percentage of annual surveillance appointments offered within 6 weeks. The standard counts appointments rather than men as some men may have more than 1 appointment due during the screening year.
Graph showing percentage of annual surveillance appointments due where there is a conclusive test within 6 weeks of the due date, 1 April 2018 to 31 March 2019
Of the 12,551 annual surveillance appointments due between 1 April 2018 to 31 March 2019, 91.6% had a conclusive test within 6 weeks of the due date. This varied from 75.0% in South East London to 98.3% in Black Country. A total of 4 providers didn’t meet the acceptable threshold of 85.0%: South East London, Leicester (84.4%), North London (84.8%) and Central England (84.9%). The absence of a provider in South East London for the first quarter of the screening year will have impacted on the coverage of the annual surveillance scan. There were 26 providers who met the acceptable threshold and 9 providers met the achievable threshold of 95.0%.
There were 13 providers who had a decrease of more than 1% in the percentage of appointments with a conclusive test result within 6 weeks of the due date from the previous screening year. A further 7 had no change and 19 had an increase of more than 1%. The largest increase was in Nottinghamshire where there was a rise from 87.5% in 2017 to 2018 to 93.5% in 2018 to 2019.
Recommendations
Providers should review the accessibility and number of screening sites to maximise the opportunity for men to attend screening.
Providers should develop local standard operating procedures to show how vulnerable men are supported and when appointments should be sent out.
2.6 AAA-S02bii Percentage of quarterly surveillance appointments due where there is a conclusive test within 4 weeks of the due date
Numerator: number of conclusive tests occurring within 4 weeks of the corresponding due date where the man was eligible for quarterly surveillance
Denominator: number of appointments due where the man was eligible for annual surveillance
Men who have an AAA are at an increased risk of rupture so it is important for men to be screened in a timely manner. For men with a medium AAA they should be screened on a quarterly basis. This standard should be looked at in conjunction with the percentage of quarterly surveillance appointments offered within 4 weeks. The standard counts appointments rather than men will be due to have 4 appointments during the screening year.
Graph showing percentage of quarterly surveillance appointments due where there is a conclusive test within 4 weeks of the due date, 1 April 2018 to 31 March 2019
Of the 9,500 quarterly surveillance appointments due between 1 April 2018 to 31 March 2019, 92.4% had a conclusive test result within 4 weeks of the due date. Performance ranged from 72.3% in South East London to 98.8% in North and South Staffordshire.
South East London and North London were the only providers to not meeting the acceptable threshold. There were 30 providers that met the acceptable threshold of 85.0% and 7 reached the achievable threshold of 95.0%. Of those 5 also met the achievable threshold for annual surveillance coverage: Black Country, Coventry and Warwick, Hereford and Worcester, Hertfordshire and North and South Staffordshire.
Coverage of the quarterly surveillance scan dropped slightly in 2017 to 2018 to 91.9% but has risen in the most recent year and is the same as 2016 to 2017. However, the change varies across the country. There were 12 providers with a decrease of more than 1% from last year with the largest being 21.0% in South East London. A total of 6 providers had no change and 21 had an increase of more than 1%. West Surrey had the largest increase, 88.2% in 2017 to 2018 to 98.4% in 2018 to 2019.
Recommendations
Providers should review the accessibility and number of screening sites to maximise the opportunity for men to attend screening.
Providers should develop local standard operating procedures to show how vulnerable men are supported and when appointments should be sent out.
2.7 AAA-S03 Percentage of men not responding to first offer to whom a second offer is made, where the appointment is scheduled to take place within the cohort year plus 3 months
Numerator: number of eligible men who did not attend at first non-cancelled appointment, offered a new appointment date within the screening year plus 3 months of the first non-cancelled appointment date
Denominator: number of men who did not attend their first non-cancelled appointment
We recommend that providers should offer men who do not turn up to their first appointment a second appointment within the initial screening year. This makes sure men do not miss out on the opportunity to be screened. Some men may formally decline screening after not attending their first appointment and some providers may find that they have incorrect contact details and cannot offer a second screen.
Men may also be offered a second appointment within 3 months of the end of the screening year if their original appointment was at the end of the screening year.
Graph showing percentage of men not responding to first offer to whom a second offer is made, where the appointment is scheduled to take place within the screening year plus 3 months, 1 April 2018 to 31 March 2019
Between 1 April 2018 and 31 March 2019, 70,924 (24.2%) eligible men offered AAA screening did not attend (DNA) their first non-cancelled appointment. Only 2 providers did not meet the acceptable threshold of 90%.
The Leicestershire screening provider operates a different model whereby men are sent an open invitation. This is where the man can call the screening provider to arrange an appointment on a day and time that is convenient to them rather than being sent a specific date and time. The 37 remaining providers met the acceptable threshold with 24 providers over 99.0%. The highest performer was West Surrey at 99.9%.
Achievement of this standard is high and was relatively stable with a decrease in 2017 to 2018 primarily due to the recommissioning of the London providers. It has varied from 95.8% for 1 April 2013 to 31 March 2014 to 97.8% for 1 April 2016 to 31 March 2017.
Nationally between 1 April 2015 and 31 March 2016, 36% of men who did not attend their first appointment attended a subsequent appointment. This was 37% for 2017 to 2018 and 2018 to 2019. The highest rate of attendance following a first appointment DNA between 1 April 2018 and 31 March 2019 was 51% in South Devon and Exeter.
Only 2.5% of men self referring to AAA screening did not attend their first non-cancelled appointment with 93.4% offered a second appointment. Some men declined a further appointment, some men were offered a second appointment after 30 June 2019, some were discharged due to DNA and a small number have yet to be sent a second invite.
Recommendations
Providers must offer men (who do not turn up to their first appointment) a second appointment within the initial screening year so they do not miss out on the opportunity to be screened.
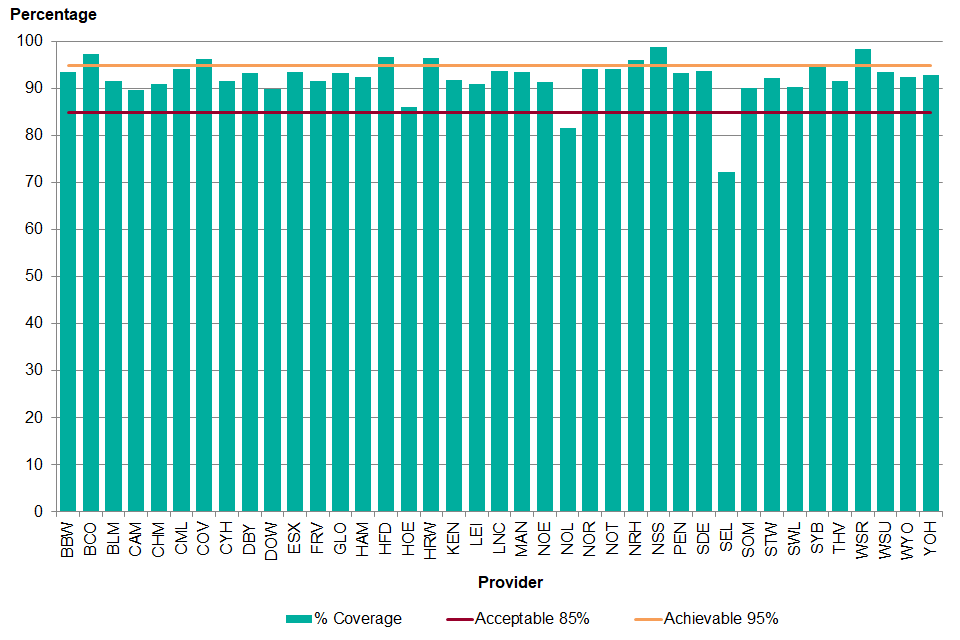
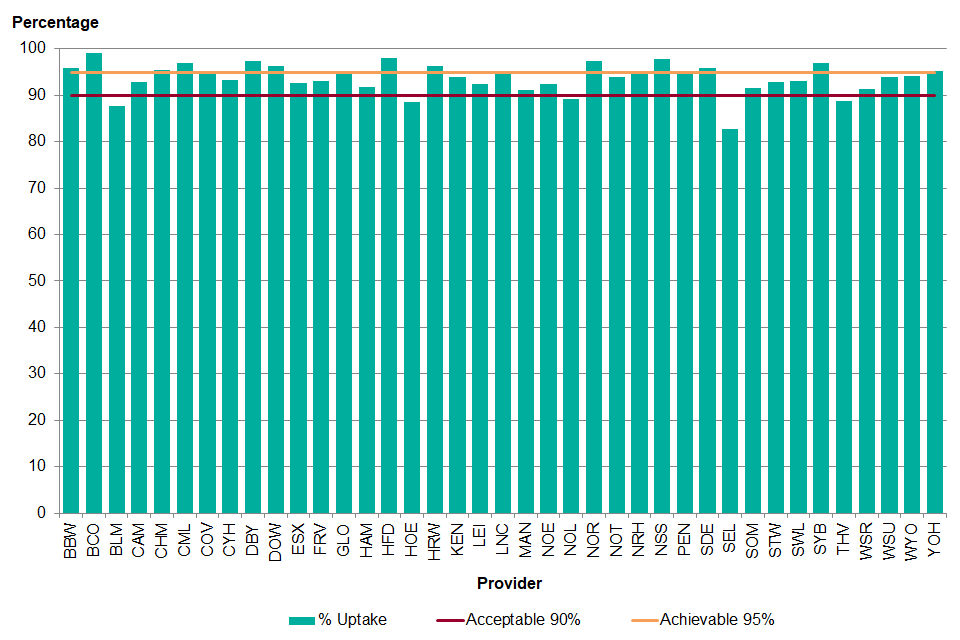
2.8 AAA-S04a Percentage of men offered screening who are tested
Numerator: number of eligible men tested at initial screen with conclusive test result which occurred within the screening year plus 3 months
Denominator: number of eligible cohort men offered screening within the screening year plus 3 months
This standard gives an indication of the acceptance of the screening test in those offered the screen. Low uptake may be due to men not wishing to be screened, not understanding the importance of being screened, forgetting the appointment or it may be because a conclusive test cannot be obtained for the man. Due to the high percentage of men offered screening, uptake and coverage are similar for most providers.
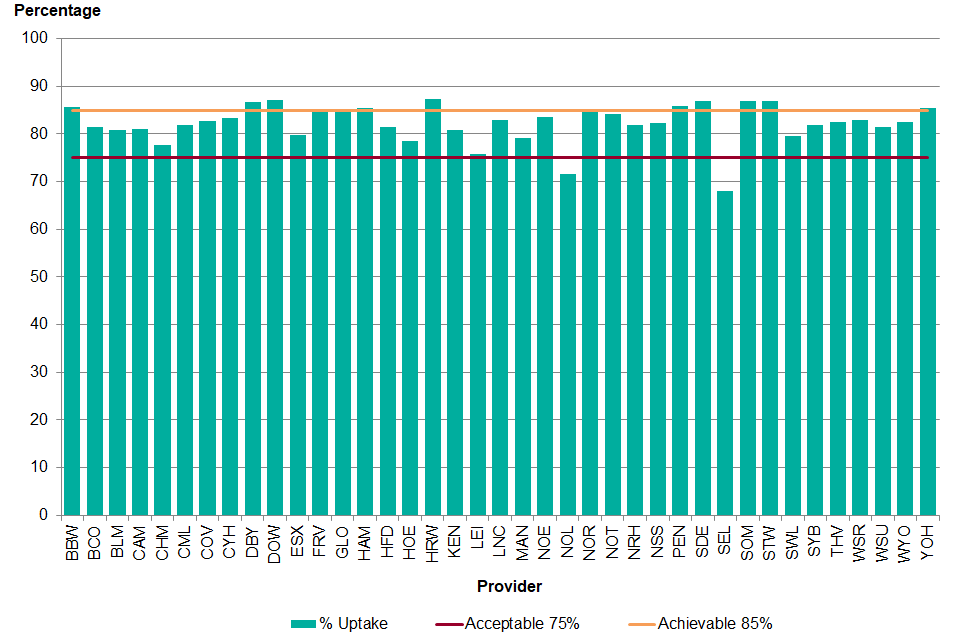
Graph showing percentage of eligible men offered screening who are conclusively tested within the screening year plus 3 months, 1 April 2018 to 31 March 2019
Nationally uptake was 81.4% for the screening year plus 3 months. A total of 2 providers did not meet the acceptable threshold: North London and South East London. A total of 27 providers met the acceptable threshold of 75% and 10 met the achievable threshold. The Hereford and Worcester provider had the greatest uptake at 87.4%.
graph showing percentage of men offered screening who are conclusively tested within the initial screening year plus 3 months, 1 April 2013 to 31 March 2019
As with coverage, uptake has been increasing gradually across the country from 1 April 2013. The year 2018 to 2019 had the highest national uptake over the past 6 years. As demonstrated in Figure 11, there has been small increases in the North and South regions while the Midlands and East regions have remained similar. Uptake has improved in London since the previous year but remains below the high of 76.5% in 2016 to 2017.
As with coverage this has been due to recommissioning of the services in London. South East London had the greatest increase in uptake from the previous screening year (7.1% increase to 68.0%) while Cheshire and Merseyside had the greatest increase in uptake from 1 April 2013 to March 2014 (27.7% increase to 77.8%).
Recommendations
Providers are encouraged to review the inequalities toolkit for best practice on increasing coverage.
Providers should use the deprivation and ethnic group report to better understand coverage within their area.
Providers are also encouraged to submit any subsequent interventions to reduce inequalities to the toolkit.
2.9 AAA-S04bi Percentage of annual surveillance appointments offered where there is a conclusive test within 6 weeks of the due date
Numerator: number of conclusive tests occurring within 6 weeks of the corresponding due date where the man was eligible for annual surveillance
Denominator: number of appointments offered within 6 weeks of the corresponding due date where the man was eligible for annual surveillance
This standard gives an indication of the acceptance of the screening test in those offered the screen. A low uptake may be due to men cancelling or not attending their appointment. Some men may have also moved from annual to quarterly surveillance during the screening year or have been screened at a medical imaging department following a non-visualised screen. The standard counts appointments rather than men as some men may have been offered more than 1 appointment during the screening year.
Graph showing percentage of annual surveillance appointments offered where there is a conclusive test within 6 weeks of the due date, 1 April 2018 to 31 March 2019
Of the 12,282 annual surveillance appointments that were offered within 6 weeks of the due date, 93.6% had a conclusive test within the 6 weeks. A total of 5 providers did not meet the acceptable threshold of 90%: South East London, Bedfordshire, Luton and Milton Keynes, Central England, Thames Valley and North London.
North London has historically had a low uptake of the annual surveillance appointment with several men repeatedly not attending appointments.
South East London did not have a provider in place for the first quarter of the year, which has affected performance. For the other providers the breaches were mainly due to a mix of patient choice and limitations of reporting appointments within SMaRT. The Black Country provider had the highest uptake at 99.1%.
Uptake of the annual surveillance appointment was introduced as a standard from April 2015. As with standards 1bi and 1bii, they were developed and piloted during the year with 1 April 2016 to 31 March 2017 being the first year the data was reported on.
Uptake of the annual surveillance screen has increased slightly from 1 April 2016 to 31 March 17 (92.9%) but there have been some significant changes at the provider level.
The largest increase was in North and South Staffordshire where there was an 8.9% increase from 2016 to 2017 to 97.8% in 2018 to 2019. Over the past year 8 providers increased performance up to the achievable level. The largest decrease was by 11.7% from 2016 to 2017 to 82.7% in 2018 to 2019 for the uptake of the annual surveillance appointments in South East London.
Recommendations
Providers should review service accessibility for surveillance men to improve uptake (including clinic venues, geographical locations and numbers, hours and days clinics are planned).
Providers should develop local standard operating procedures to show how vulnerable men are supported and when appointments should be sent out.
2.10 AAA-S04bii Percentage of quarterly surveillance appointments offered where there is a conclusive test within 4 weeks of the due date
Numerator: number of conclusive tests occurring within 4 weeks of the corresponding due date where the man was eligible for quarterly surveillance
Denominator: number of appointments offered within 4 weeks of the corresponding due date where the man was eligible for quarterly surveillance
This standard gives an indication of the acceptance of the screening test in those offered the screen. A low uptake may be due to men cancelling or not attending their appointment. Some men may have also moved from quarterly to annual surveillance during the screening year or have been screened at a medical imaging department following a non-visualised screen. The standard counts appointments rather than men, as men will have been offered more than 1 appointment during the screening year.
Graph showing percentage of quarterly surveillance appointments offered where there is a conclusive test within 4 weeks of the due date, 1 April 2018 to 31 March 2019
Nationally, 94.1% of quarterly surveillance appointments offered within 4 weeks of the due date had a conclusive test result within 4 weeks. A total of 2 providers did not reach the acceptable threshold of 90%, North London and South East London, which is due to the impact of recommissioning of the services. A total of 21 providers met the acceptable threshold, and 16 met the achievable threshold of 95%. West Surrey had the highest uptake of quarterly surveillance appointments at 99.0%. A total of 9 providers reached the achievable threshold for the uptake of both annual and quarterly surveillance appointments:
- Black Country
- Bristol, Bath and Weston
- Coventry and Warwick
- Derbyshire
- Hereford and Worcester
- Hertfordshire
- Lincolnshire
- North and South Staffordshire
- South Yorkshire and Bassetlaw.
There was a very small increase in the uptake of quarterly surveillance appointments between 2017 to 2018 (93.8%) and 2018 to 2019 (94.1%). A total of 14 providers had a decrease of more than 1% and 17 had an increase of more than 1%. The greatest decrease was North London, by 9.0% from 94.5% in 2017 to 2018 to 86.0% in 2018 to 2019. The greatest increase was in West Surrey, from 88.8% in 2017 to 2018 to 99.0% in 2018 to 2019.
Recommendations
Providers should review service accessibility for surveillance men to improve uptake (including clinic venues, geographical locations and numbers, hours and days clinics are planned).
Providers should develop local standard operating procedures to show how vulnerable men are supported and when appointments should be sent out.
2.11 AAA-S05 Percentage of assessed images of acceptable quality
This standard is not currently measured. The national AAA screening programme is working to identify an appropriate method for assessing screener performance.
2.12 AAA-S06 Percentage of inaccurate calliper placements, determined by review of static image
This standard is not currently measured. The national AAA screening programme is working to identify an appropriate method for assessing screener performance.
2.13 AAA-S07 Percentage of screening encounters where aorta could not be visualised
Numerator: number of tests recorded as non-visualised
Denominator: number of screening tests
It is important to monitor the number of men who do not have a successful screen to make sure that the men who have accepted screening are able to benefit from screening. A high non-visualised rate may be due to a training issue, equipment maintenance issues or it may be a reflection of population being screened.
A high body mass index, excessive bowel gas and unusual anatomy can affect the ability to obtain an adequate image.
Men who have a non-visualised screen should be offered another appointment through the screening provider and if they cannot obtain an adequate image the man should be referred to the medical imaging department or vascular laboratory of the vascular service. The standard counts screens rather than men.
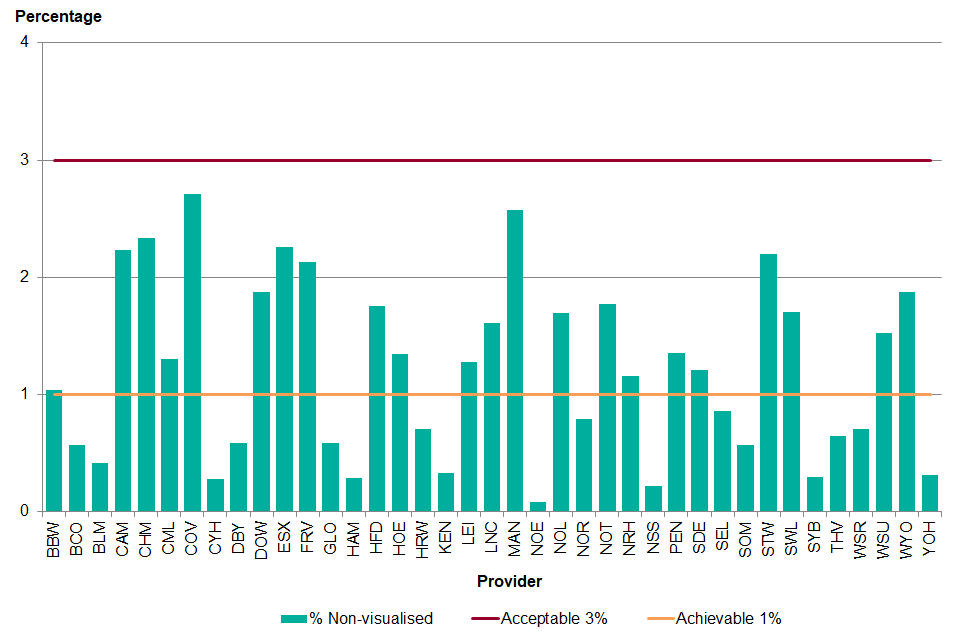
Graph showing percentage of screening encounters where aorta could not be visualised, 1 April 2018 to 31 March 2019
Screening providers should aim to minimise the percentage of screens that cannot be visualised. Therefore, the lower the value the better for this standard. All providers met the acceptable threshold of 3% non-visualised screens or fewer. Of those, 17 providers met the achievable threshold of 1% non-visualised screens or fewer. The lowest percentage of non-visualised screens was 0.08% for the North East and North Cumbria provider.
Graph showing percentage of screening encounters where aorta could not be visualised, 1 April 2013 to 31 March 2019
Over the past 5 years the percentage of non-visualised screens has been decreasing across England as a whole but there has been significant variation between the providers. In London there has been a small increase, which may be due to an increase in trainee screeners.
There is also a small increase in the Midlands and East region. A total of 9 providers had an increase of more than 1% in non-visualised screens from 2017 to 2018, although all are still within the acceptable threshold:
- Lincolnshire (24.6% increase to 1.61%)
- Hereford and Worcester (27.2% increase to 0.70%)
- Coventry and Warwick (32.0% increase to 2.71%)
- Black Country (38.7% increase to 0.57%)
- Shropshire, Telford and Wrekin (41.0% increase to 2.20%)
- Leicester (44.8% increase to 1.28%)
- Essex (61.8% increase to 2.26%)
- Bedfordshire, Luton and Milton Keynes (155.3% increase to 0.41%)
- Derbyshire (197.7% increase to 0.58%)
Recommendations
Providers should use the monthly screener report to review individual technician’s non-visualised figures.
Providers must make sure equipment is checked and maintained in line with national guidance. The clinical skills trainer must undertake 4 monthly observations of screeners.
Providers should have 2 technicians at each appointment, as per national guidance, so that there are 2 opportunities to scan the man.
2.14 AAA-S08 Percentage of incomplete screening episodes
Numerator: number of men screened but with no conclusive test result
Denominator: number of men scanned
The number of men for whom a successful scan could not be obtained in either the screening provider or the hospital medical imaging department is monitored to maximise the impact of the screening programme. These men who have indicated that they wish to be screened have an incomplete screening episode as a conclusive screen was not obtained.
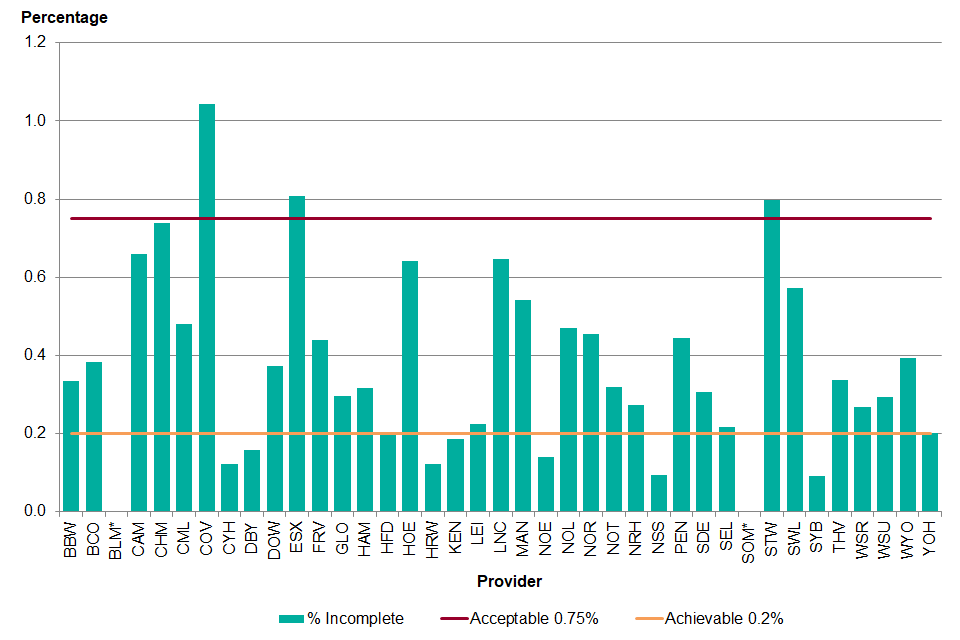
graph showing percentage of incomplete screening episodes, 1 April 2018 to 31 March 2019
*Percentage masked due to less than 5 incomplete screening episodes
Nationally 0.37% of screening episodes were incomplete. As with the non-visualised screens providers should be aiming to reduce the percentage of incomplete screening episodes. A total of 3 providers were above the acceptable level of 0.75%: Shropshire, Telford and Wrekin, Coventry and Warwick and Essex. Following an audit of the incomplete screening episodes in each of the providers it hasn’t been possible to determine a reason why the percentage of incomplete screening episodes has risen. The lowest percentage of incomplete episodes was in South Yorkshire and Bassetlaw (0.09%).
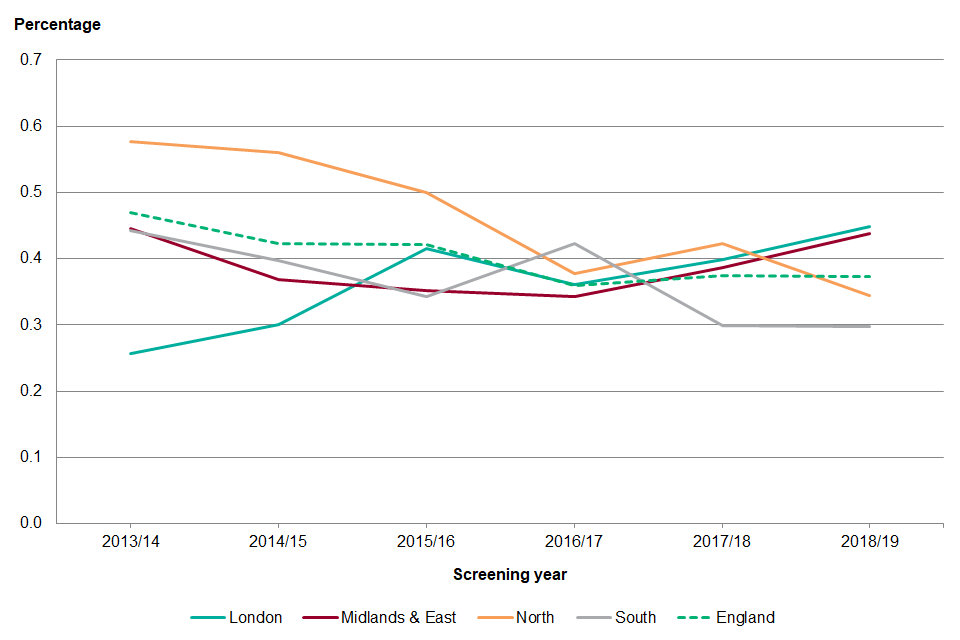
Graphshowing percentage of incomplete screening episodes, 1 April 2013 to 31 March 2019
Nationally the percentage of incomplete screening episodes has remained the same over the past 6 years. However, there have been small increases in London and Midlands and East from the previous screening year. Both North London and South West London had increases. In the Midlands and East region there were increases in Central England, Coventry and Warwickshire, Hertfordshire, Essex, Nottinghamshire, Leicester, Black Country, Lincolnshire, Shropshire, Telford and Wrekin and Derbyshire. The largest increase was in Derbyshire where the percentage of incomplete screening episodes increased from 0.02% in 2017 to 2018 to 0.16% in 2018 to 2019. In the North there were increases in West Yorkshire, Lancashire and South Cumbria and North Yorkshire. The largest increase was in the North Yorkshire and Humber provider, where there was an increase from 0.16% in 2017 to 2018 to 0.20% in 2018 to 2019.
Recommendations
The provider should make sure that there is good communication between the service and trust medical imaging and/or vascular laboratory including timely feedback of results.
2.15 AAA-S09 Percentage of men with AAA ≥5.5cm referred within 1 working day
Numerator: number of men where the days between the latest successful screening session date and referral date is ≤1
Denominator: number of men referred for surgery
Men with a large aneurysm (≥5.5cm) are at increased risk of rupture and should be seen by a vascular surgeon and operated on, if suitable for surgery, within an 8-week timeframe. Ensuring that the man is referred within one working day is the first step in this pathway and ensures the programme does not cause unnecessary delays in the man’s treatment.
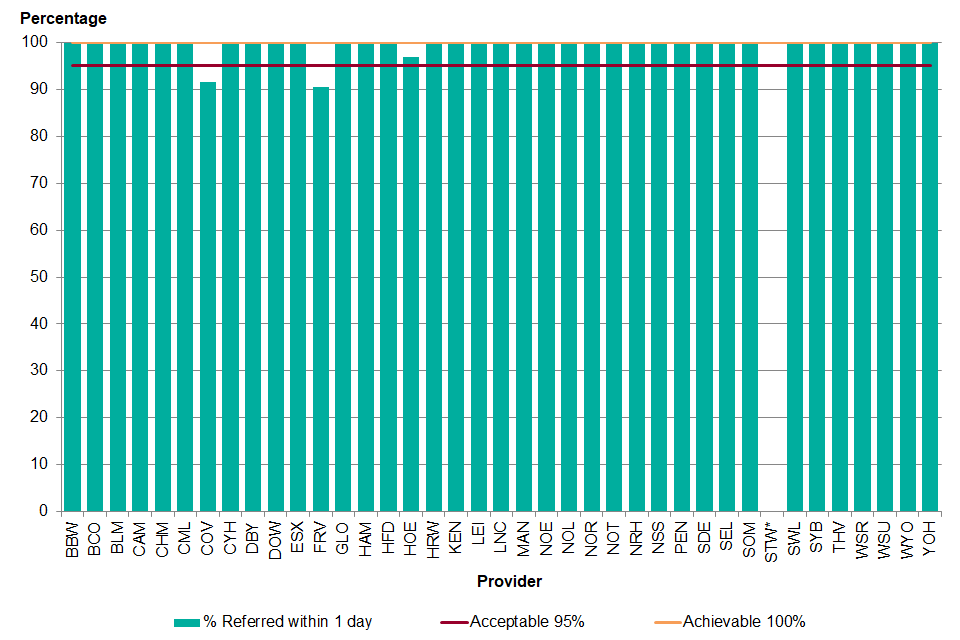
Graph showing percentage of men with AAA greater than or equal to 5.5cm referred within 1 working day, 1 April 2018 to 31 March 2019
*Percentage masked due to less than 5 men referred
Nationally, this standard was well achieved across the country: 99.5% of men were referred to a vascular service within 1 day of the screen where a 5.5cm or greater aneurysm was detected. A total of 2 providers did not meet the acceptable threshold: A total of 5 Rivers and Coventry and Warwick. One provider met the standard at the acceptable threshold of 95% and 36 providers met the achievable threshold of 100%.
The standard has remained stable over the past 4 years varying from 98.0% for 1 April 2014 to 31 March 2015 to 99.6% for 1 April 2017 to 31 March 2018. There have been small fluctuations in provider performance but this is often due to very small numbers, such as 1 man not being referred within 1 working day.
Recommendations
Providers should review all men who are not referred within 1 day to identify reasons for delay and remove potential barriers to improvement.
2.16 AAA-S10 Percentage of referred men subsequently found to have an aorta <5.5cm on confirmatory CT or MRI scan
Numerator: number of men with a maximum aorta measurement of <5.5cm on confirmatory CT or MRI scan
Denominator: number of men referred for surgery
Screening tests are not considered to be diagnostic. Following referral, a CT or MRI scan is required to confirm that their aorta is ≥5.5cm and therefore referral to surgery has been appropriate. A high false positive rate may be due to training or equipment maintenance issues within the screening service. However, this data has to be interpreted with caution as the numbers referred and the number of false positives are small.
There were 883 men referred for surgery between 1 April 2018 and 31 March 2019. Of those, 3.3% were found to have an aorta <5.5cm on confirmatory CT or MRI scan. The majority were men who were found to have an aneurysm <5.5cm with less than 5 men not having an aneurysm at all. In the cases where the aneurysm was less than 5.5cm, the men were retained in hospital surveillance outside of the screening programme and will be monitored until their aneurysm reaches 5.5cm.
A total of 19 providers had no false positives for men referred during the screening year. A total of 13 providers had 1 false positive, 6 providers had 2 false positives and 1 had 4 false positives (20.0% of referred men). The PHE screening quality assurance service (SQAS) followed up each of the false positives with the providers to identify if any further action was required.
Recommendations
The provider should review all men found to be inappropriately referred to identify any training needs.
Providers should make sure equipment is checked and maintained in line with national guidance.
2.17 AAA-S11 Percentage of men with aorta ≥5.5cm seen by vascular specialist within 2 weeks
Numerator: number of men where days between last attended appointment and first assessment ≤14
Denominator: number of men appropriately referred for surgery
Men with a large aneurysm are at risk of rupture and should be seen by a vascular surgeon and operated on, if suitable for surgery, within an 8 week timeframe. Men should be assessed for their suitability for surgery within 2 weeks of their last conclusive result so that there are no unnecessary delays in treatment or patient care.
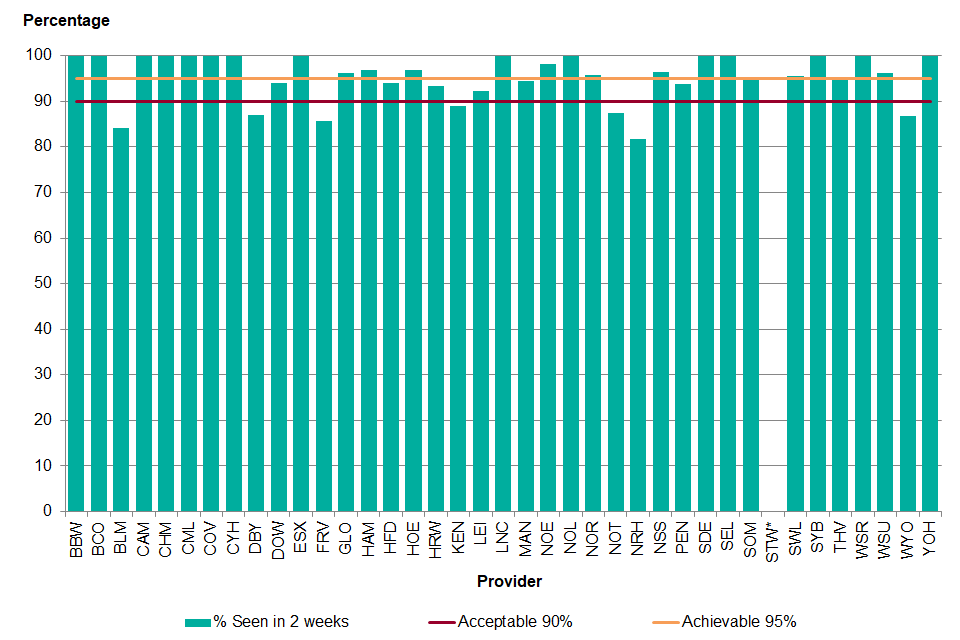
Graph showing percentage of men with aorta greater than or equal to 5.5cm seen by vascular specialist within 2 weeks, 1 April 2018 to 31 March 2019
*Percentage masked due to less than 5 men referred
Of the 854 men appropriately referred for surgery, 814 (95.3%) were seen for their first specialist assessment within 2 weeks of their last conclusive scan. A total of 7 providers did not reach the acceptable threshold of 90%. A total of 7 providers met the acceptable threshold and 25 providers met the achievable threshold of 95%.
For the men who were not seen in 2 weeks, just under half (48.7%) were due to patient choice while 41.0% were due to hospital factors. Hospital factors includes delays in testing, no available beds, winter pressures, limited staff availability and theatre availability due to emergency operations amongst other reasons. The remainder were due to comorbidities that prevented attendance.
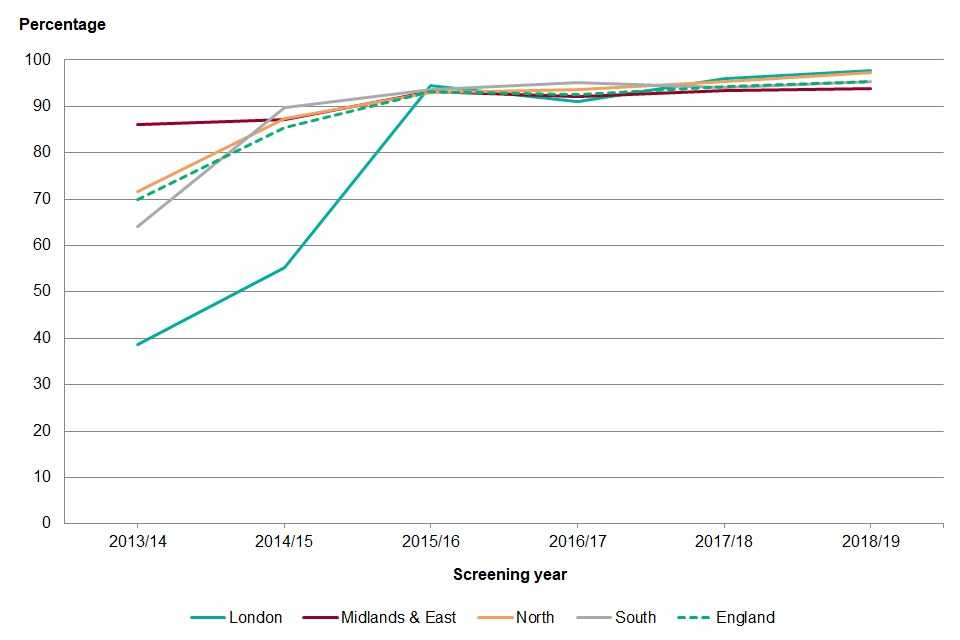
Graph showing percentage of men with aorta greater than or equal to 5.5cm seen by vascular specialist within 2 weeks, 1 April 2013 to 31 March 2019
Nationally the percentage of men seen for a specialist assessment within 2 weeks (14 days) of their last conclusive scan has increased by 1.0 percentage points since the previous screening year. The greatest increase was in the North region, which improved by 1.9 percentage points, with the largest increase in North Yorkshire and Humber (8.7% increase to 100.0%). Northamptonshire had the greatest decrease from 100% in 2017 to 2018 to 81.8% in 2018 to 2019.
Recommendations
The provider should ensure there is good communication with the vascular service and track men throughout the screening pathway.
2.18 AAA-S12 Percentage of men with aorta ≥5.5cm deemed fit for intervention and not declining, operated on by a vascular specialist within 8 weeks
Numerator: number of men referred whose surgery date was within 8 weeks of the last attended appointment
Denominator: number of men appropriately referred for surgery, fit for intervention and not declining
Men with a large aneurysm (≥5.5cm) are at increased risk of rupture and should be seen by a vascular surgeon and operated on, if suitable for surgery, within an 8 week timeframe. Delays in having surgery can occur and are the result of several factors including patient choice and hospital capacity.
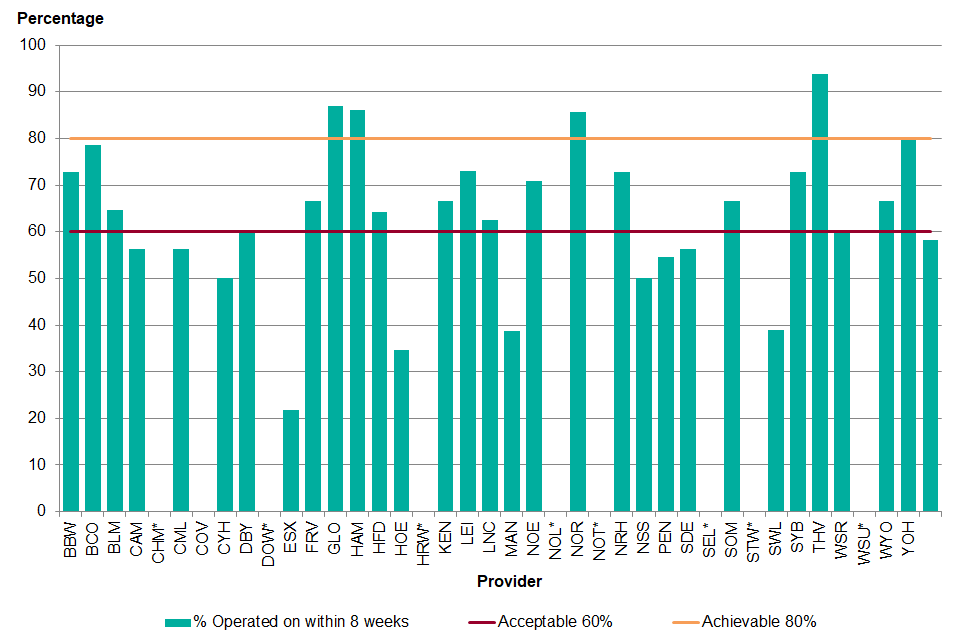
Graph showing percentage of men with aorta greater than or equal to 5.5cm deemed fit for intervention and not declining, operated on by a vascular specialist within 8 weeks, 1 April 2018 to 31 March 2019
*Percentage masked due to less than 5 men referred
Nationally, from the 854 men who were appropriately referred, 146 men were unsuitable for surgery and 38 men declined surgery. Men who were unsuitable for surgery may have had a comorbidity that required treatment prior to the AAA repair, such as cancer treatment or the risk of surgery was greater than the risk of rupture. Of the men who were appropriately referred, did not decline and were suitable for surgery, 58.4% were operated on within 8 weeks. For the men who did not have surgery within 8 weeks, 44.2% of men had comorbidities that delayed surgical intervention. In 21.6% of cases the delay was due to hospital factors. This was a problem over the winter months where many hospitals had general capacity problems and operations were cancelled. Some men (12.0%) had a delay while waiting for a stent, and some (16.3%) opted to delay the surgery due to personal reasons.
An elective repair was carried out in 93.6% (n=627) of appropriately referred men who did not decline and were suitable for surgery. Nationally, just over half of the surgical interventions were open repairs but there was significant variation across the country (range 0% to 90.0%). The post-operative 30 day mortality was 1.79% overall. The average wait time for surgery was 79 days (range 0 to 412 days).
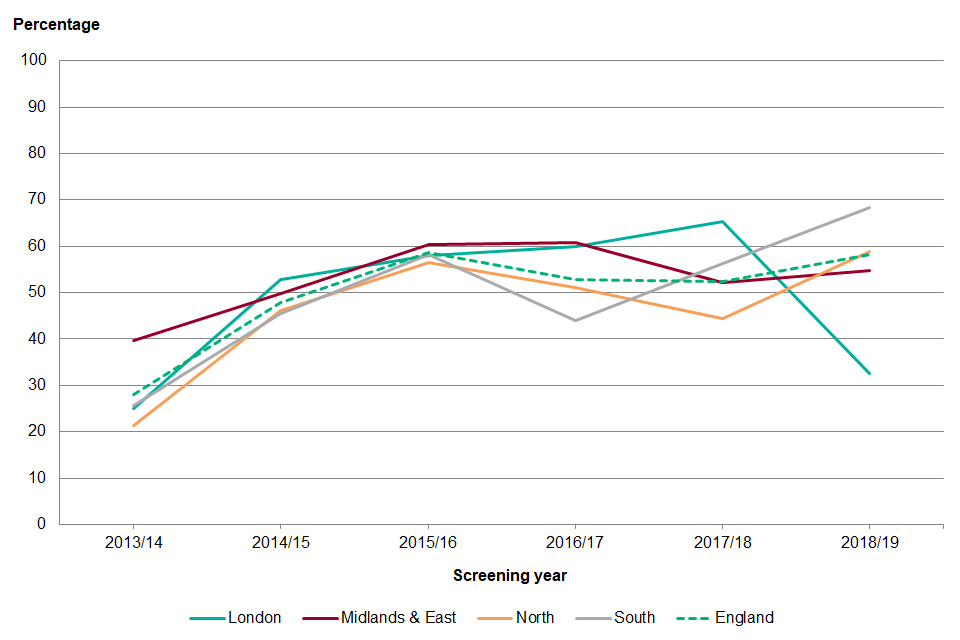
Graph showing percentage of men with aorta greater than or equal to 5.5cm deemed fit for intervention and not declining, operated on by a vascular specialist within 8 weeks, 1 April 2013 to 31 March 2019
Nationally the percentage of men operated on in 8 weeks reached a peak in 2015 to 2016. Performance has since dipped before increasing again in 2018 to 2019. The timeliness of surgical repair for AAA has been affected by several factors including the general increased demand for hospital services, and winter pressures which have led to delays in elective surgeries. There has also be an increase in the waiting times for custom made stents. Men are also being referred at an older age as more men are being referred from surveillance. In 2013, 60.3% of men were referred from their initial screen compared to 32.3% in 2016. As a consequence, the men referred tend to have more comorbidities and require more assessments for fitness prior to surgery. There have also been some genuine improvements in the waiting times for AAA repair but there have also been improvements due to the way men are recorded within the national database. Where men have had comorbidities that have required significant time for treatment and recovery, such as cancer, they have now been classified as unsuitable for surgery and have not been included in the denominator of standard 12.
Recommendations
The provider should ensure there is good communication with the vascular service to enable men to be tracked throughout the screening pathway to identify and resolve potential avoidable delays to treatment.
3. Outcomes
There were 25 AAA ruptures during the screening year, 24 of which were fatal. In total, 12 of the deaths were in men on surveillance (2.6% of the deaths in surveillance) and 11 had been referred for surgery. For the men referred to surgery, 9 had been turned down for surgery due to comorbidities or had declined the operation. The remaining 2 died while waiting for surgery although both ruptured within 56 days of referral. One man died from a leak of an endovascular repair, which had been carried out 4 years ago.