Work Capability Assessment decisions by health assessment mode
Published 15 September 2026
Applies to England, Scotland and Wales

© Crown copyright 2026
This publication is licensed under the terms of the Open Government Licence v3.0 except where otherwise stated. To view this licence, visit nationalarchives.gov.uk/doc/open-government-licence/version/3 or write to the Information Policy Team, The National Archives, Kew, London TW9 4DU, or email: psi@nationalarchives.gov.uk.
Where we have identified any third party copyright information you will need to obtain permission from the copyright holders concerned.
This publication is available at https://www.gov.uk/government/statistics/work-capability-assessment-decision-based-mode-of-assessment-statistics-april-2019-to-march-2026/work-capability-assessment-decisions-by-health-assessment-mode
Introduction
This publication provides information in relation to the mode of assessment used to conduct a Work Capability Assessment (WCA), the benefit decision taken following the assessment, and the age, gender and medical conditions of the claimants undertaking the assessment.
Background
Before 2020 the majority of claimants undertaking a WCA were assessed via a face-to-face consultation, with a small proportion of recommendations being made ‘on paper’, based on the evidence provided in their application. During the COVID-19 pandemic, the Department for Work and Pensions (DWP) designed and implemented a multi-channel delivery system of health assessments to address the swift demand for remote methods of assessment. Research on the impact of the introduction of remote channels on Personal Independence Payment (PIP), Universal Credit (UC) Health and Employment Support Allowance (ESA) claimants showed that claimants’ perception of suitability of assessment channel was influenced by award outcome and their interaction with the assessor, rather than by the assessment channel specifically [footnote 1].
In all cases the decision on benefit entitlement is made by a DWP Case Manager, not by the health professional undertaking the assessment. Decisions may be amended as a result of a mandatory reconsideration or appeal.
Further quantitative research on initial health assessments completed between May 2022 and March 2023 showed no substantial benefit outcome differences between claimants allocated to a remote assessment and those scheduled for a face-to-face assessment.
This ad hoc release provides further information on claimants attending remote and face-to-face health assessments and their benefit outcomes, including the mode of assessment breakdown of the total number of UC Health (UC-H) and ESA WCA decisions between April 2019 and March 2026; and the gender, age and medical conditions reported by these claimants by the assessment mode attended.
Methodology
For the total number of WCA decisions between April 2019 and March 2026, the information is extracted from published data on Stat-Xplore. To determine the mode of assessment used to conduct a WCA and the medical conditions in Figure 6, this data was matched to the Medical Services Referral System (MSRS), a portal between the Health Assessment Advisory Service (HAAS) and DWP which is only completed if a claimant undertakes a WCA. A claimant’s conditions and mode of assessment will not be available if there is sufficient evidence in the application process to make a decision without the need for a full WCA. Cases in which, due to evidence provided, a decision can be made without a WCA, are reported as ‘unknown mode’. Data on consultation type prior to April 2022 is not available as the proportion of cases where the mode of assessment is recorded falls below the required threshold for publication. The face-to-face category includes both assessments conducted in a DWP assessment centre and home visits. In all cases the benefit decision is made by a DWP Case Manager.
Claimants that migrate from ESA do not require a further WCA when joining UC, therefore their respective UC decisions do not have an associated record on MSRS. These decisions are excluded from all UC tables in this analysis. The exclusion will particularly impact data from 2024 onwards, when the department increased the volume of managed migrations of income-related ESA claimants to UC.
Primary medical condition is not recorded for UC health claimants. Claimants often have complex health issues and can thus be recorded with multiple conditions within each classification group, as well as across multiple groups, but are only recorded once within a specific classification group for the purposes of this analysis. Conditions as recorded on MSRS have been mapped to reflect as closely as possible the appropriate International Classification of Diseases version 10 (ICD10) code [footnote 2]. Medical condition is based on evidence recorded at the WCA, this in itself does not confer entitlement to Universal Credit.
For ESA, conditions data is taken from published ESA official statistics on Stat-Xplore and based on the medical evidence provided at the start of the claim. This in itself does not confer entitlement to ESA and may not represent a claimant’s most recent medical condition. Unlike for UC, where someone has more than one diagnosis or disabling condition, only one is recorded and reported for these statistics, which should be the predominant condition, but may not be in all cases. Like UC, the conditions have been mapped to reflect as closely as possible the appropriate ICD10 code [footnote 2].
Results
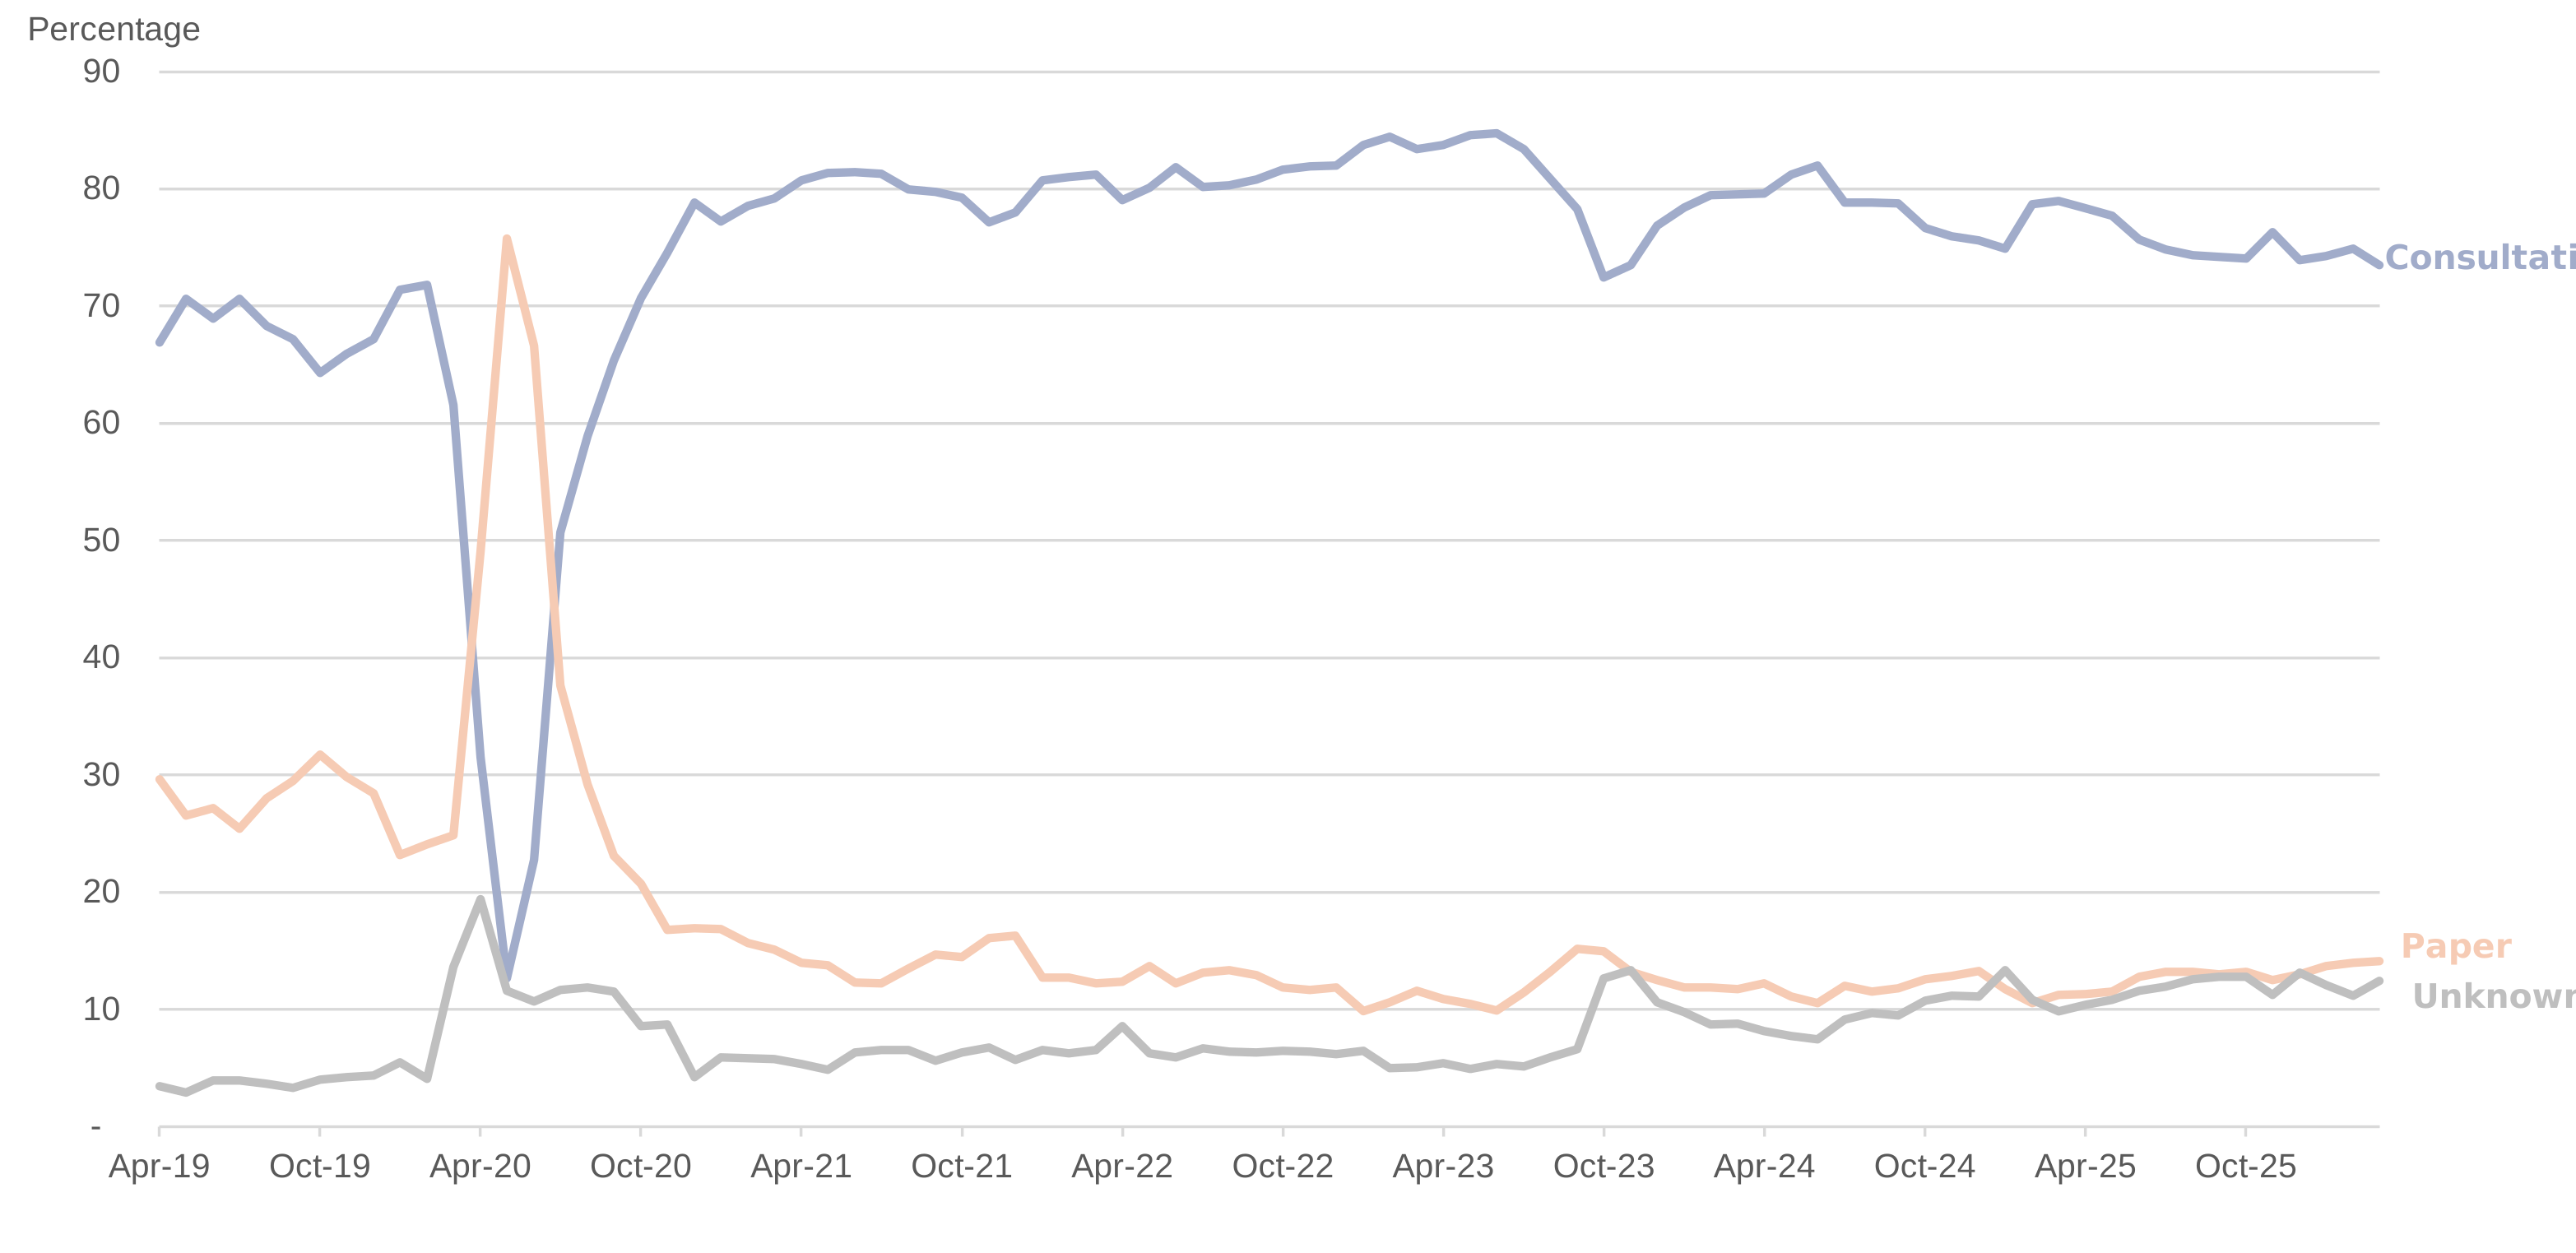
Figure 1: Monthly UC and ESA WCA decisions by assessment mode, April 2019 to March 2026
Between April 2019 and February 2020, 69% of WCA decisions were made after a consultation (either face-to-face or remote), 27% of WCA decisions were made after reviewing the evidence on paper, and for 4% of WCA decisions the assessment mode was unknown. In 2025 to 2026, 75% of WCA decisions were made after a consultation (either face-to-face or remote), 13% after reviewing the evidence on paper and for 12% of WCA decisions the assessment mode was unknown.
Source: ODS Tables
Figure 1 shows a line chart from April 2019 to March 2026 with 3 lines labelled consultation, paper, and unknown and the proportion of WCA decisions represented by each. The chart shows that other than the period between April and July 2020 where there was a sharp increase in the proportion of paper-based decisions (during the COVID-19 pandemic), the majority of WCA decisions were made after a consultation.
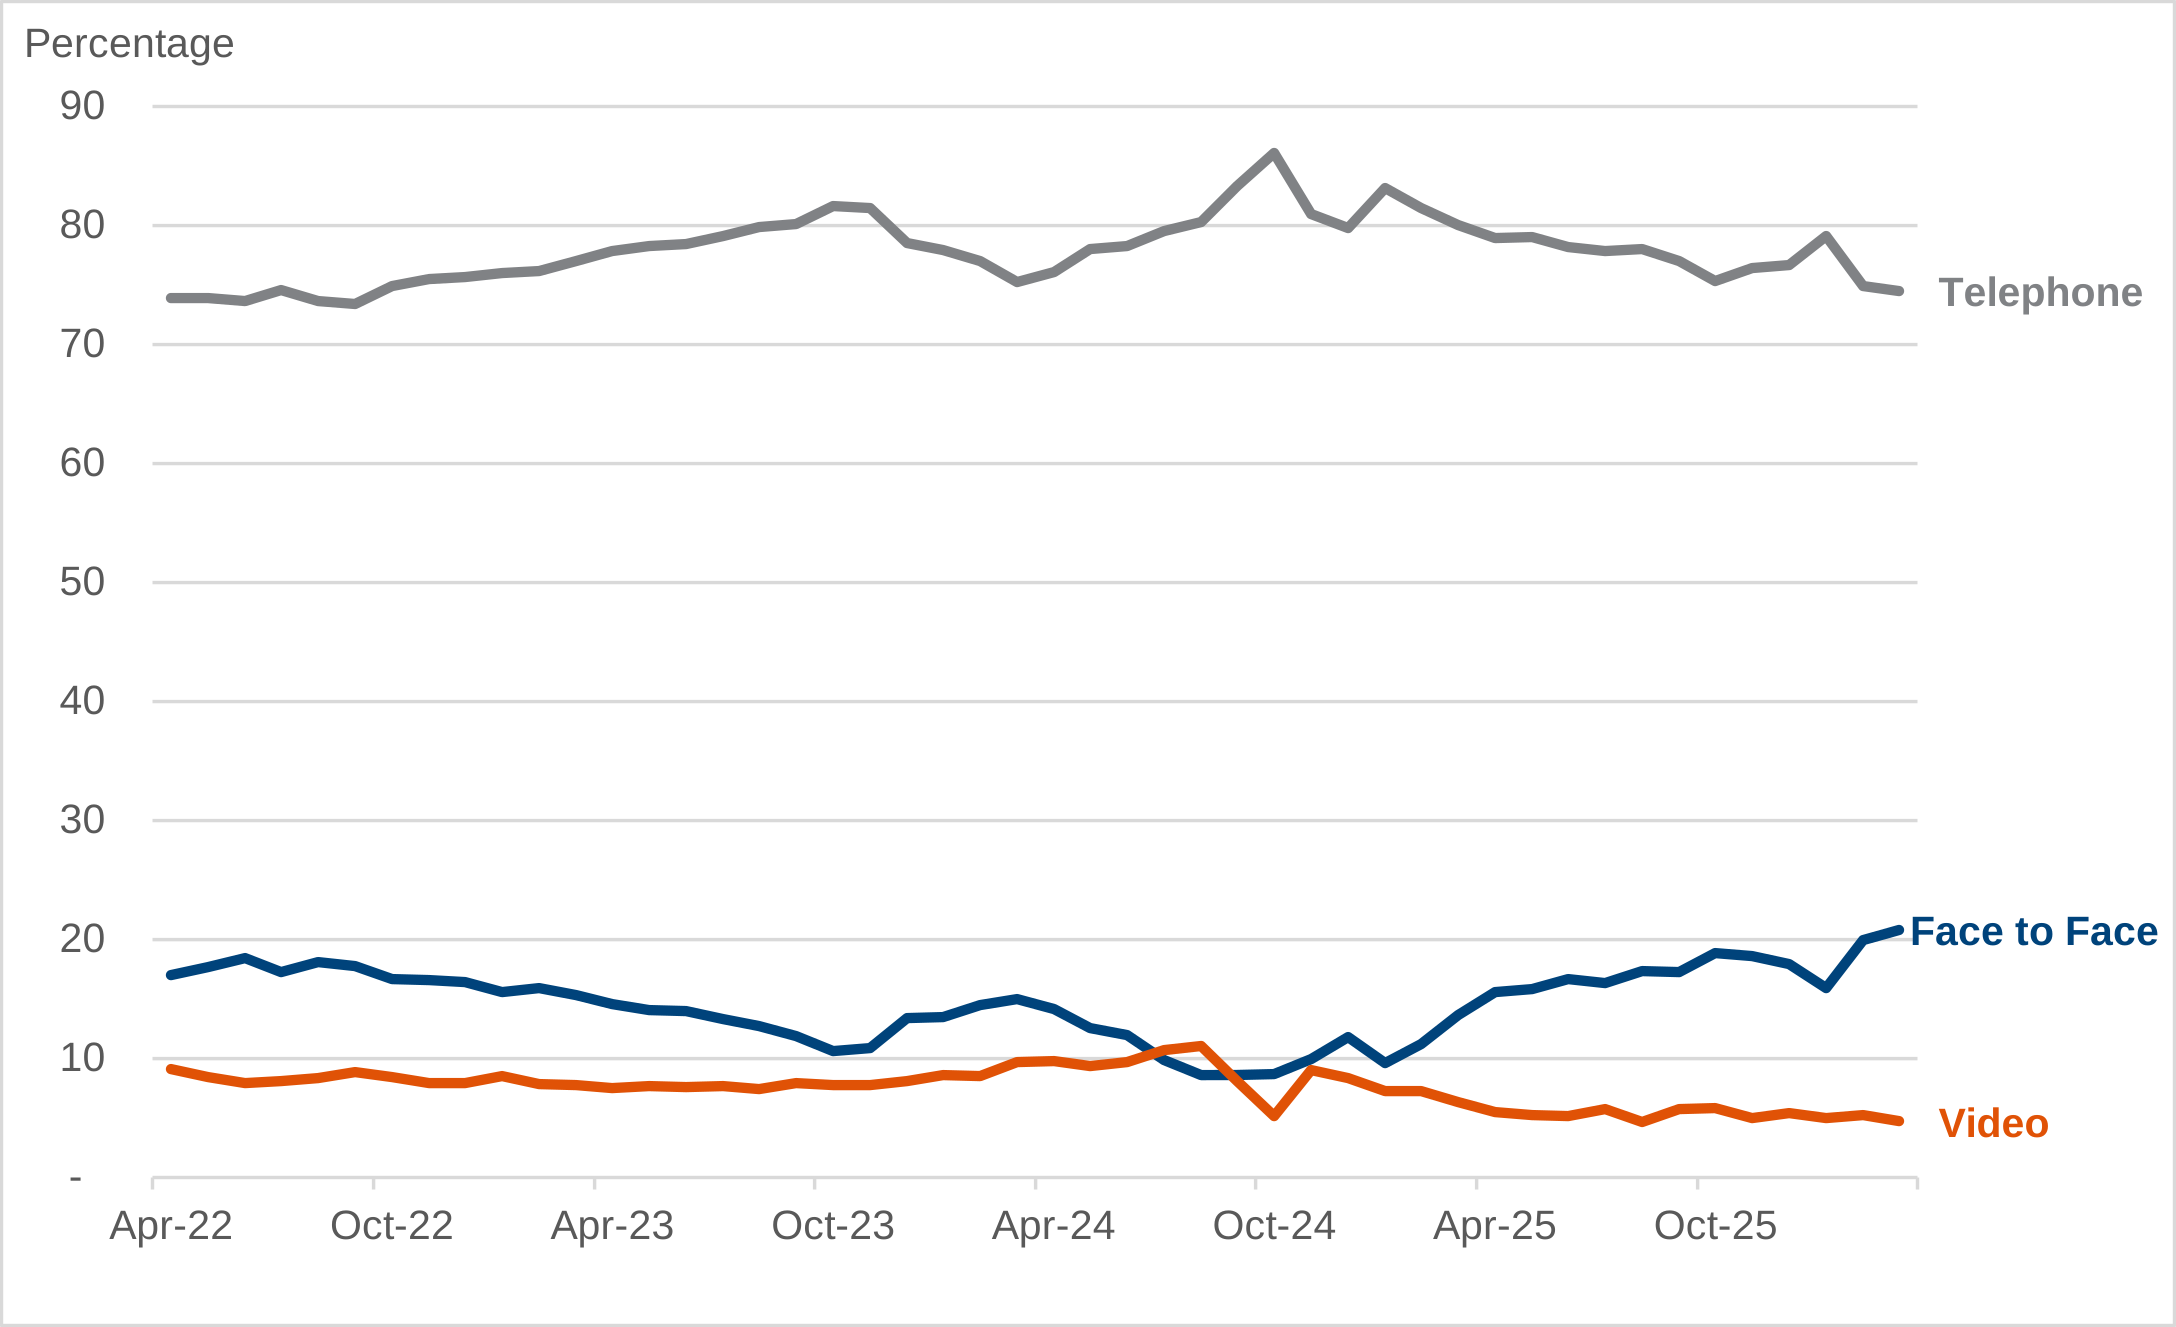
Figure 2: Monthly UC and ESA WCA decisions by consultation channel, April 2022 to March 2026
Across the full period from April 2022 to March 2026, of the WCA decisions where the assessment channel was a consultation, 14% were made after a face-to-face assessment, 78% after a telephone assessment and 8% after a video assessment. The proportion of decisions involving a face-to-face consultation has doubled since the start of 2025.
Source: ODS Tables
Figure 2 shows a line chart from April 2022 to March 2026 with 3 lines labelled face-to-face, telephone, and video and the proportion of WCA decisions represented by each. The chart shows the highest proportion of WCA decisions over the time period were by telephone consultation.
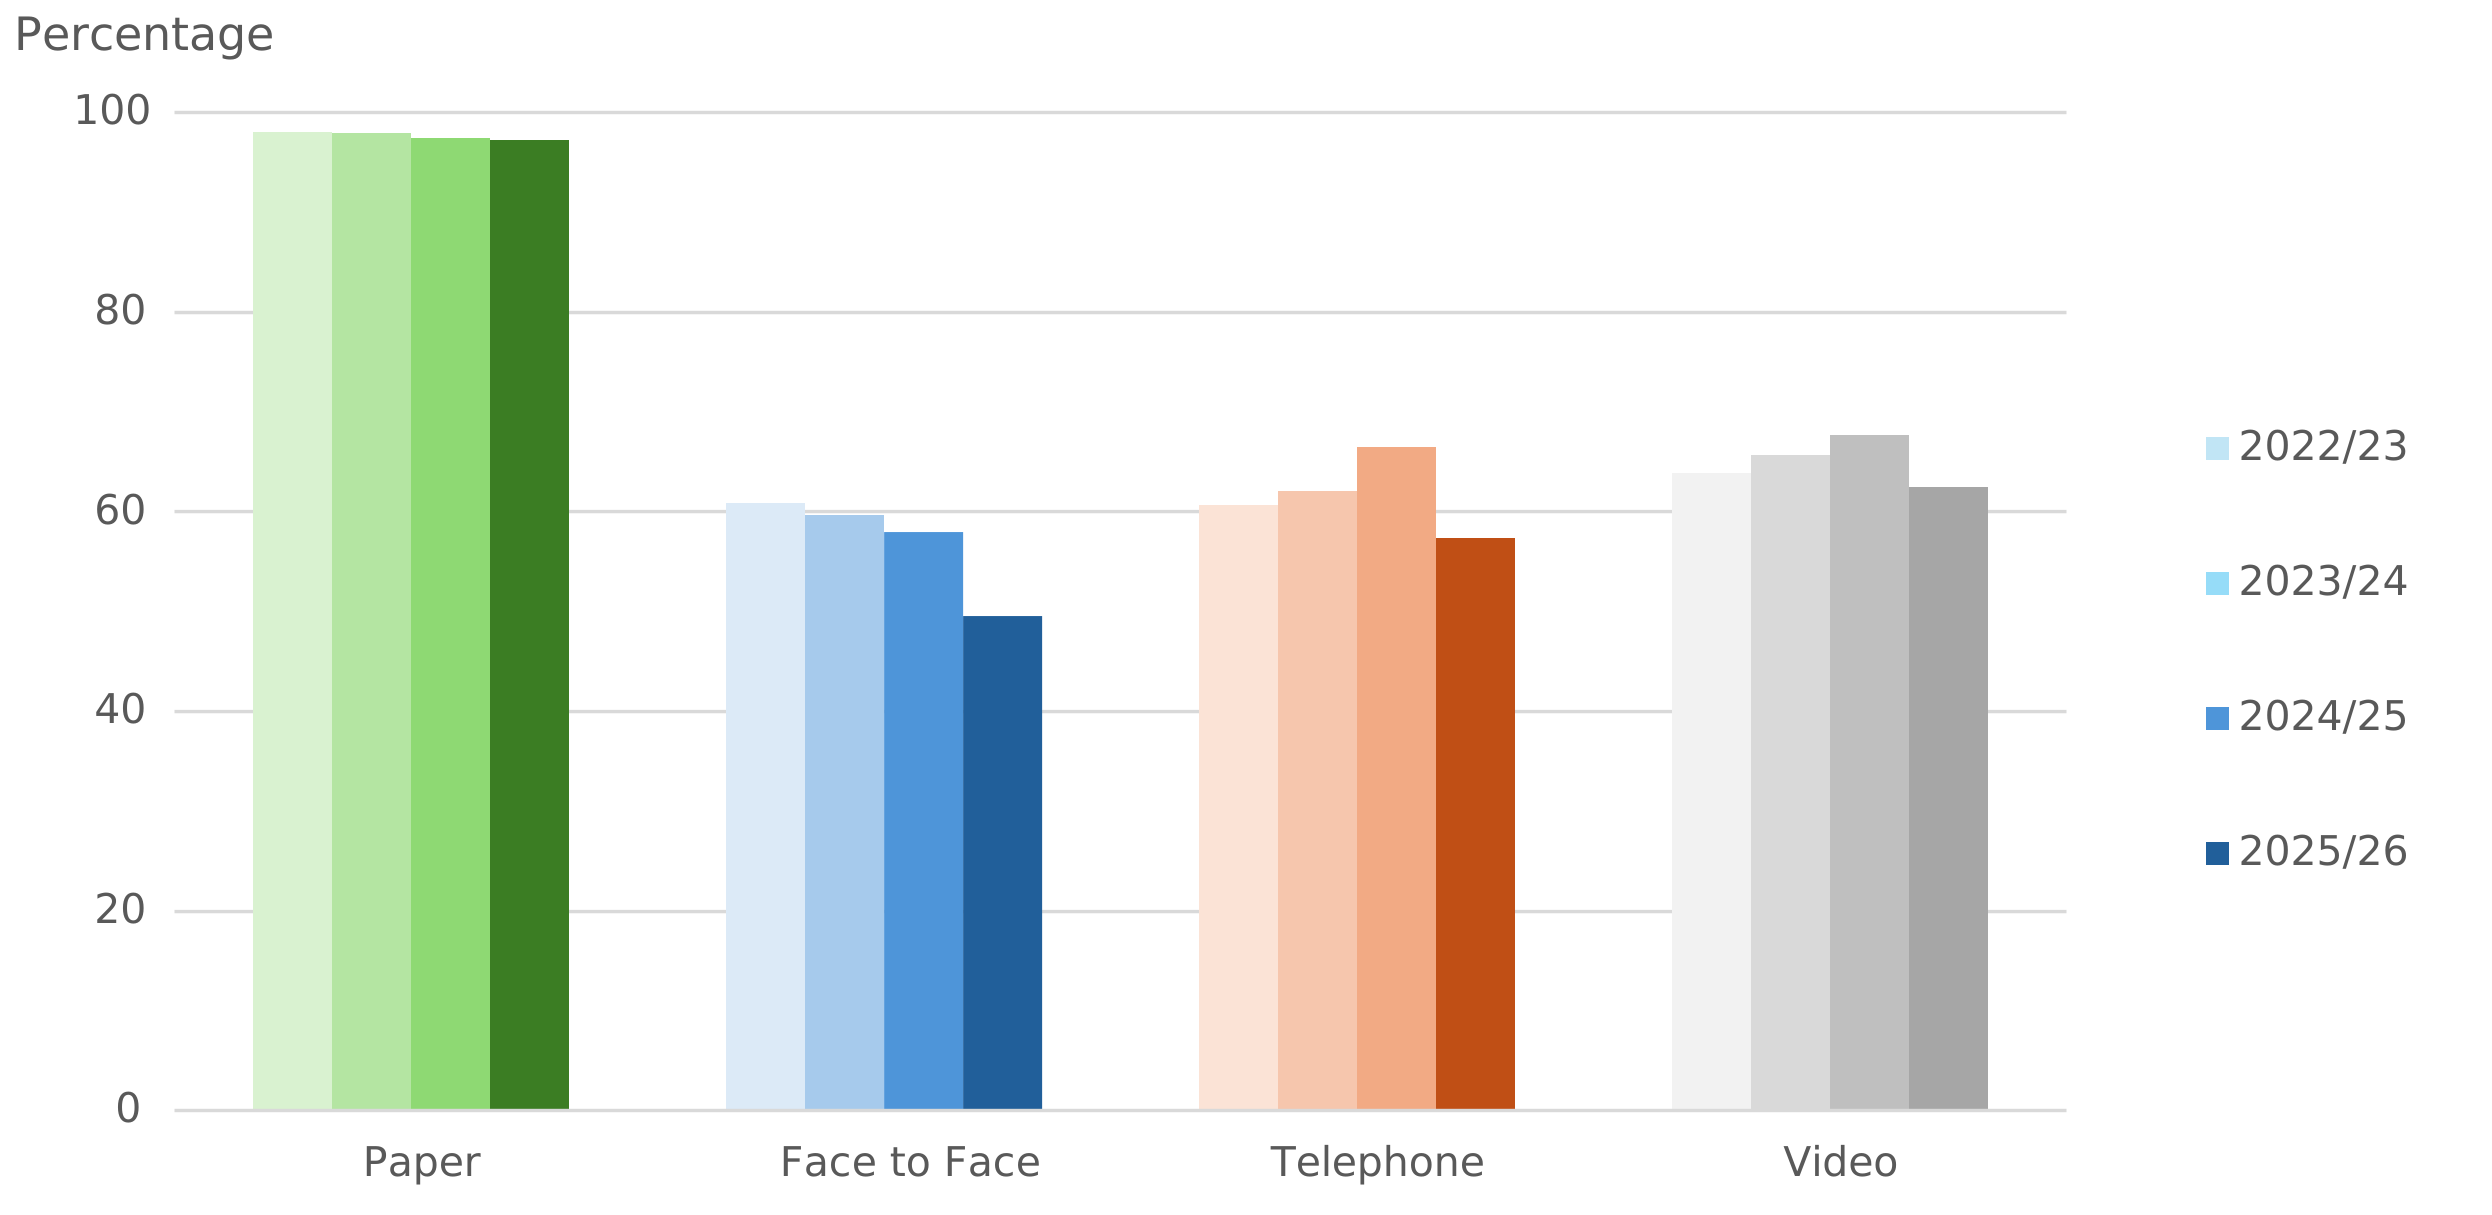
Figure 3: UC and ESA WCA Limited Capability for Work and Work-Related Activity (LCWRA) and Support Group (SG) decisions as a proportion of all WCA decisions by mode of assessment, April 2022 to March 2026 by financial year
The proportion of LCWRA and SG decisions following a face-to-face assessment decreased between 2022 to 2023 and 2025 to 2026, while the proportion of LCWRA decisions following a virtual assessment (telephone or video) was similar in 2025 to 2026 compared to 2022 to 2023.
In 2025 to 2026, 49% of UC and ESA claimants assessed face-to-face were categorised as LCWRA or SG, compared to 58% and 63% of claimants assessed through a telephone or video assessment respectively.
Because different types of claimant are more likely to experience different modes of assessment, it is likely that at least some of the difference between different modes of assessment is due to differences in composition, and not as a result of the assessment mode itself. This is most obvious with paper-based assessments, where the functional impairment and entitlement is much clearer from the paper documentation, and therefore likely to be predominantly claimants with more severe impairments. Paper-based assessments therefore have a consistently very high LCWRA/SG award rate.
Source: ODS Tables
Figure 3 shows 4 sets of bar charts labelled paper, face-to-face, telephone, and video. Each set has 4 bars representing the percentage of all WCA decisions that results in an LCWRA or SG outcome for each of the years 2022 to 2023, 2023 to 2024, 2024 to 2025 and 2025 to 2026. The chart shows that paper-based assessments had a consistently very high LCWRA/SG award rate, the proportion of LCWRA and SG decisions following a face-to-face assessment decreased between 2022 to 2023 and 2025 to 2026, while the proportion of LCWRA/SG decisions following both telephone and video assessments increased between 2022 to 2023 and 2024 to 2025 and then decreased between 2024 to 2025 and 2025 to 2026.
WCA decisions by channel and gender
Throughout all assessment modes and years captured in the data, male claimants of UC had a higher likelihood of an LCWRA decision compared to female claimants, and female claimants of ESA had a higher likelihood of an SG decision compared to male claimants.
In UC, this difference was miniscule for paper-based, small for face-to-face and video, and slightly larger for telephone consultations. In ESA the difference was small for paper-based but substantial across all three consultation channels with the largest differences in face-to-face assessments.
Comparing across channels, the proportion of those with an LCWRA or SG decision is lower for face-to-face than remote channels for both genders with the difference increasing year-on-year and being slightly higher for males than females.
However, as more women than men were assessed through each mode of assessment, overall more women had LCWRA or SG decisions than men across the full period of April 2022 to March 2026.
Table 1: UC or ESA claims that resulted in an LCWRA or SG decision as a proportion of all claims assessed through a specific consultation channel by the gender of the claimant, April 2022 to March 2026 by financial year
| Percentage | 2022 to 2023 | 2023 to 2024 | 2024 to 2025 | 2025 to 2026 | |
|---|---|---|---|---|---|
| Paper-based | UC female claimants | 100.0 | 99.9 | 100.0 | 100.0 |
| Paper-based | UC male claimants | 100.0 | 100.0 | 100.0 | 100.0 |
| Face to face | UC female claimants | 60.7 | 58.6 | 57.7 | 49.0 |
| Face to face | UC male claimants | 61.0 | 59.3 | 58.2 | 49.7 |
| Telephone | UC female claimants | 59.8 | 60.2 | 65.3 | 56.6 |
| Telephone | UC male claimants | 61.6 | 62.7 | 67.9 | 59.1 |
| Video | UC female claimants | 63.4 | 63.8 | 66.4 | 62.1 |
| Video | UC male claimants | 63.8 | 66.2 | 68.6 | 62.8 |
| Paper-based | ESA female claimants | 98.5 | 99.2 | 98.6 | 99.0 |
| Paper-based | ESA male claimants | 96.8 | 97.9 | 97.1 | 97.3 |
| Face to face | ESA female claimants | 64.2 | 68.2 | 64.8 | 54.4 |
| Face to face | ESA male claimants | 58.7 | 58.4 | 56.5 | 45.1 |
| Telephone | ESA female claimants | 64.8 | 69.6 | 69.6 | 61.7 |
| Telephone | ESA male claimants | 57.1 | 61.6 | 62.4 | 53.4 |
| Video | ESA female claimants | 68.7 | 73.8 | 71.1 | 66.8 |
| Video | ESA male claimants | 61.0 | 66.4 | 65.5 | 62.0 |
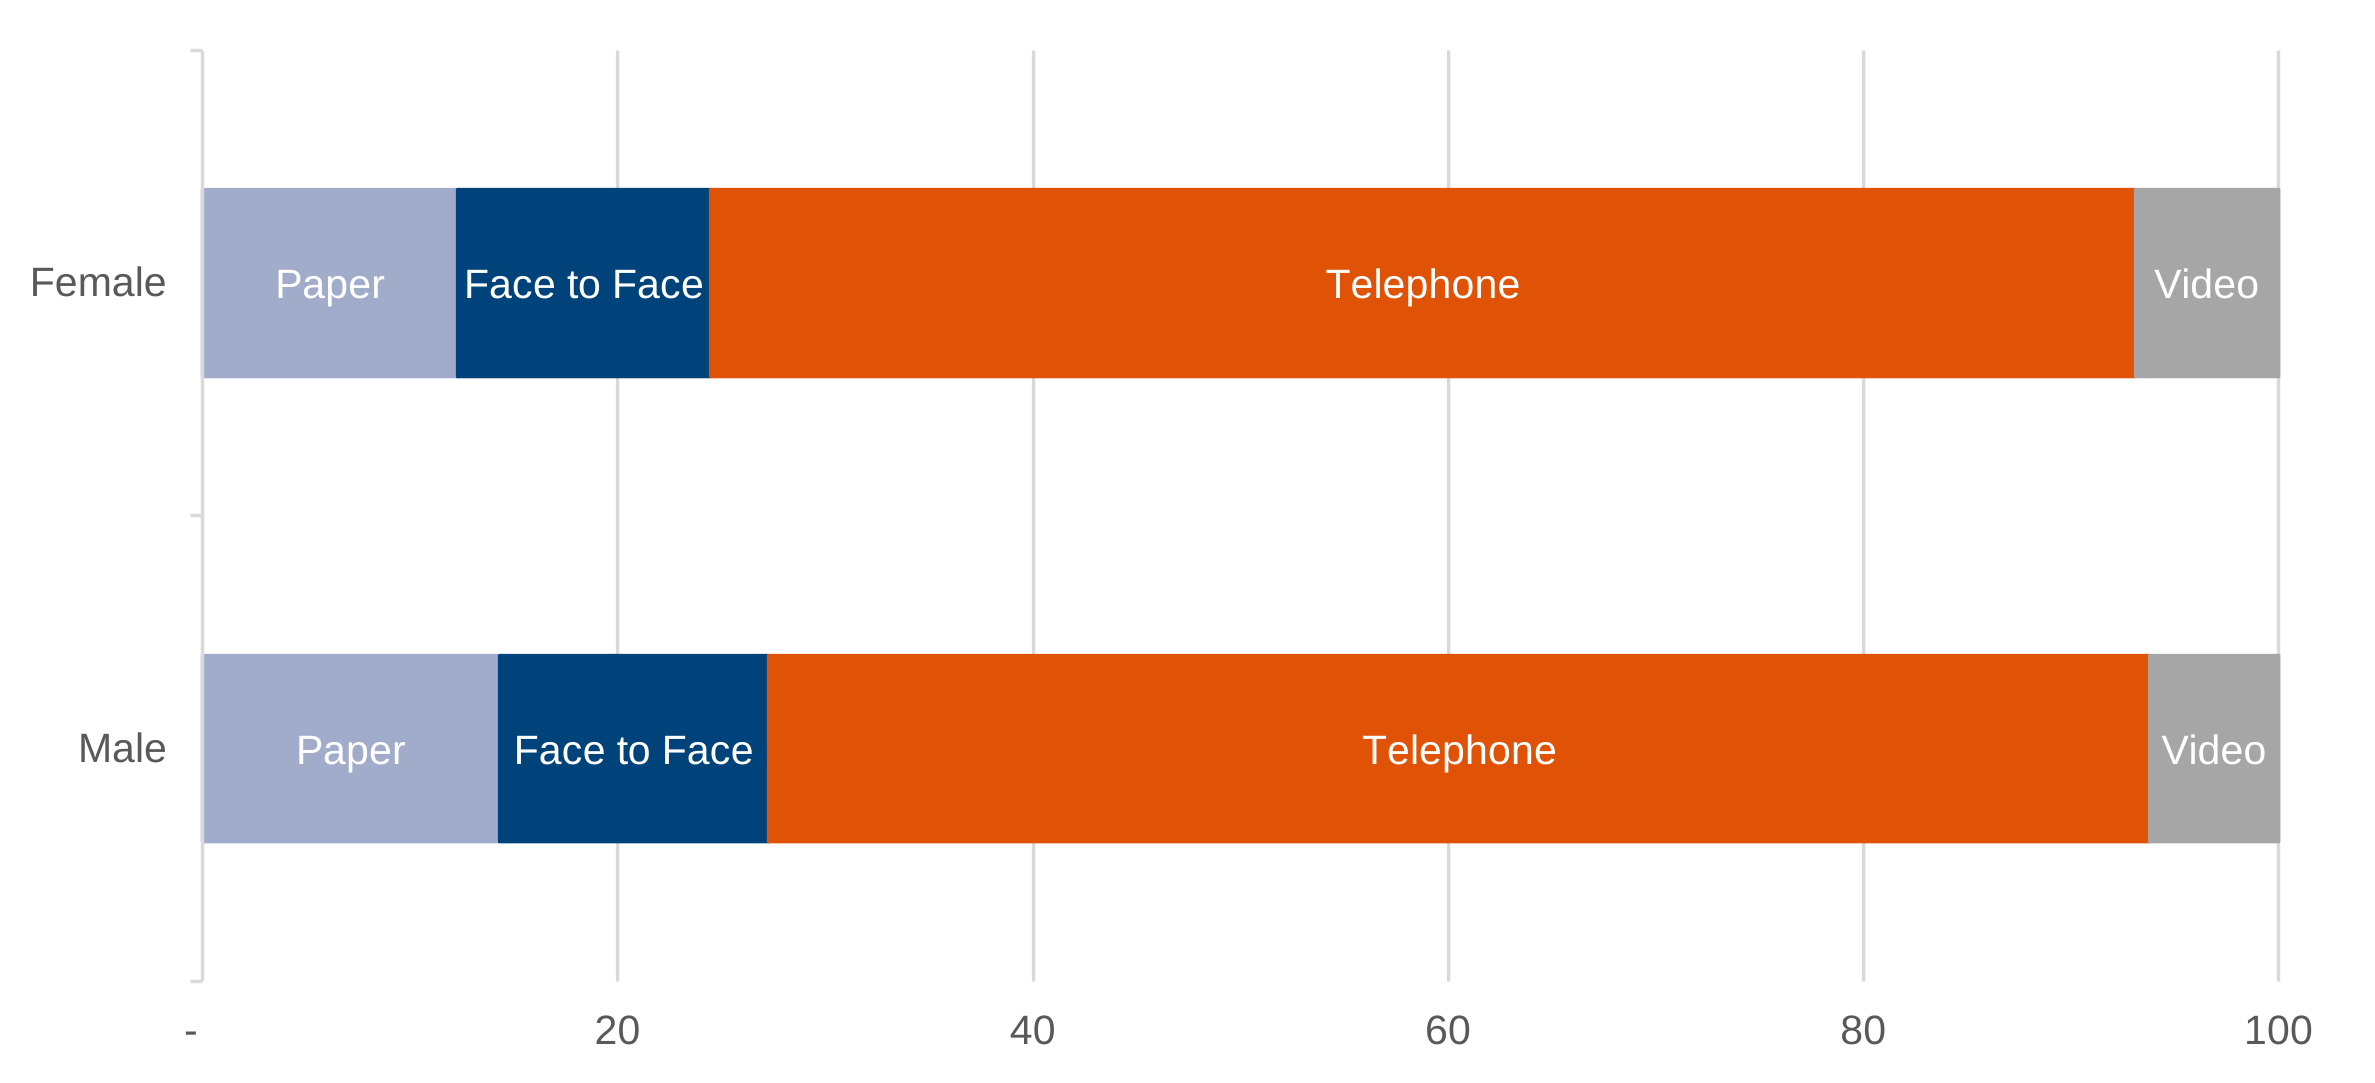
Figure 4: WCA decisions by assessment mode and gender, April 2022 to March 2026
Overall males are slightly more likely to have paper-based and face-to-face assessments than females, at 14% and 13% respectively for males and both at 12% for females.
Source: ODS Tables
Figure 4 shows 2 stacked bar charts, 1 for female and 1 for male. Each has 4 sections representing the proportion of WCA decisions for each gender that were paper, face-to-face, telephone, and video assessments. The chart shows that males had slightly more paper-based and face-to-face assessments than females over the time period April 2022 to March 2026.
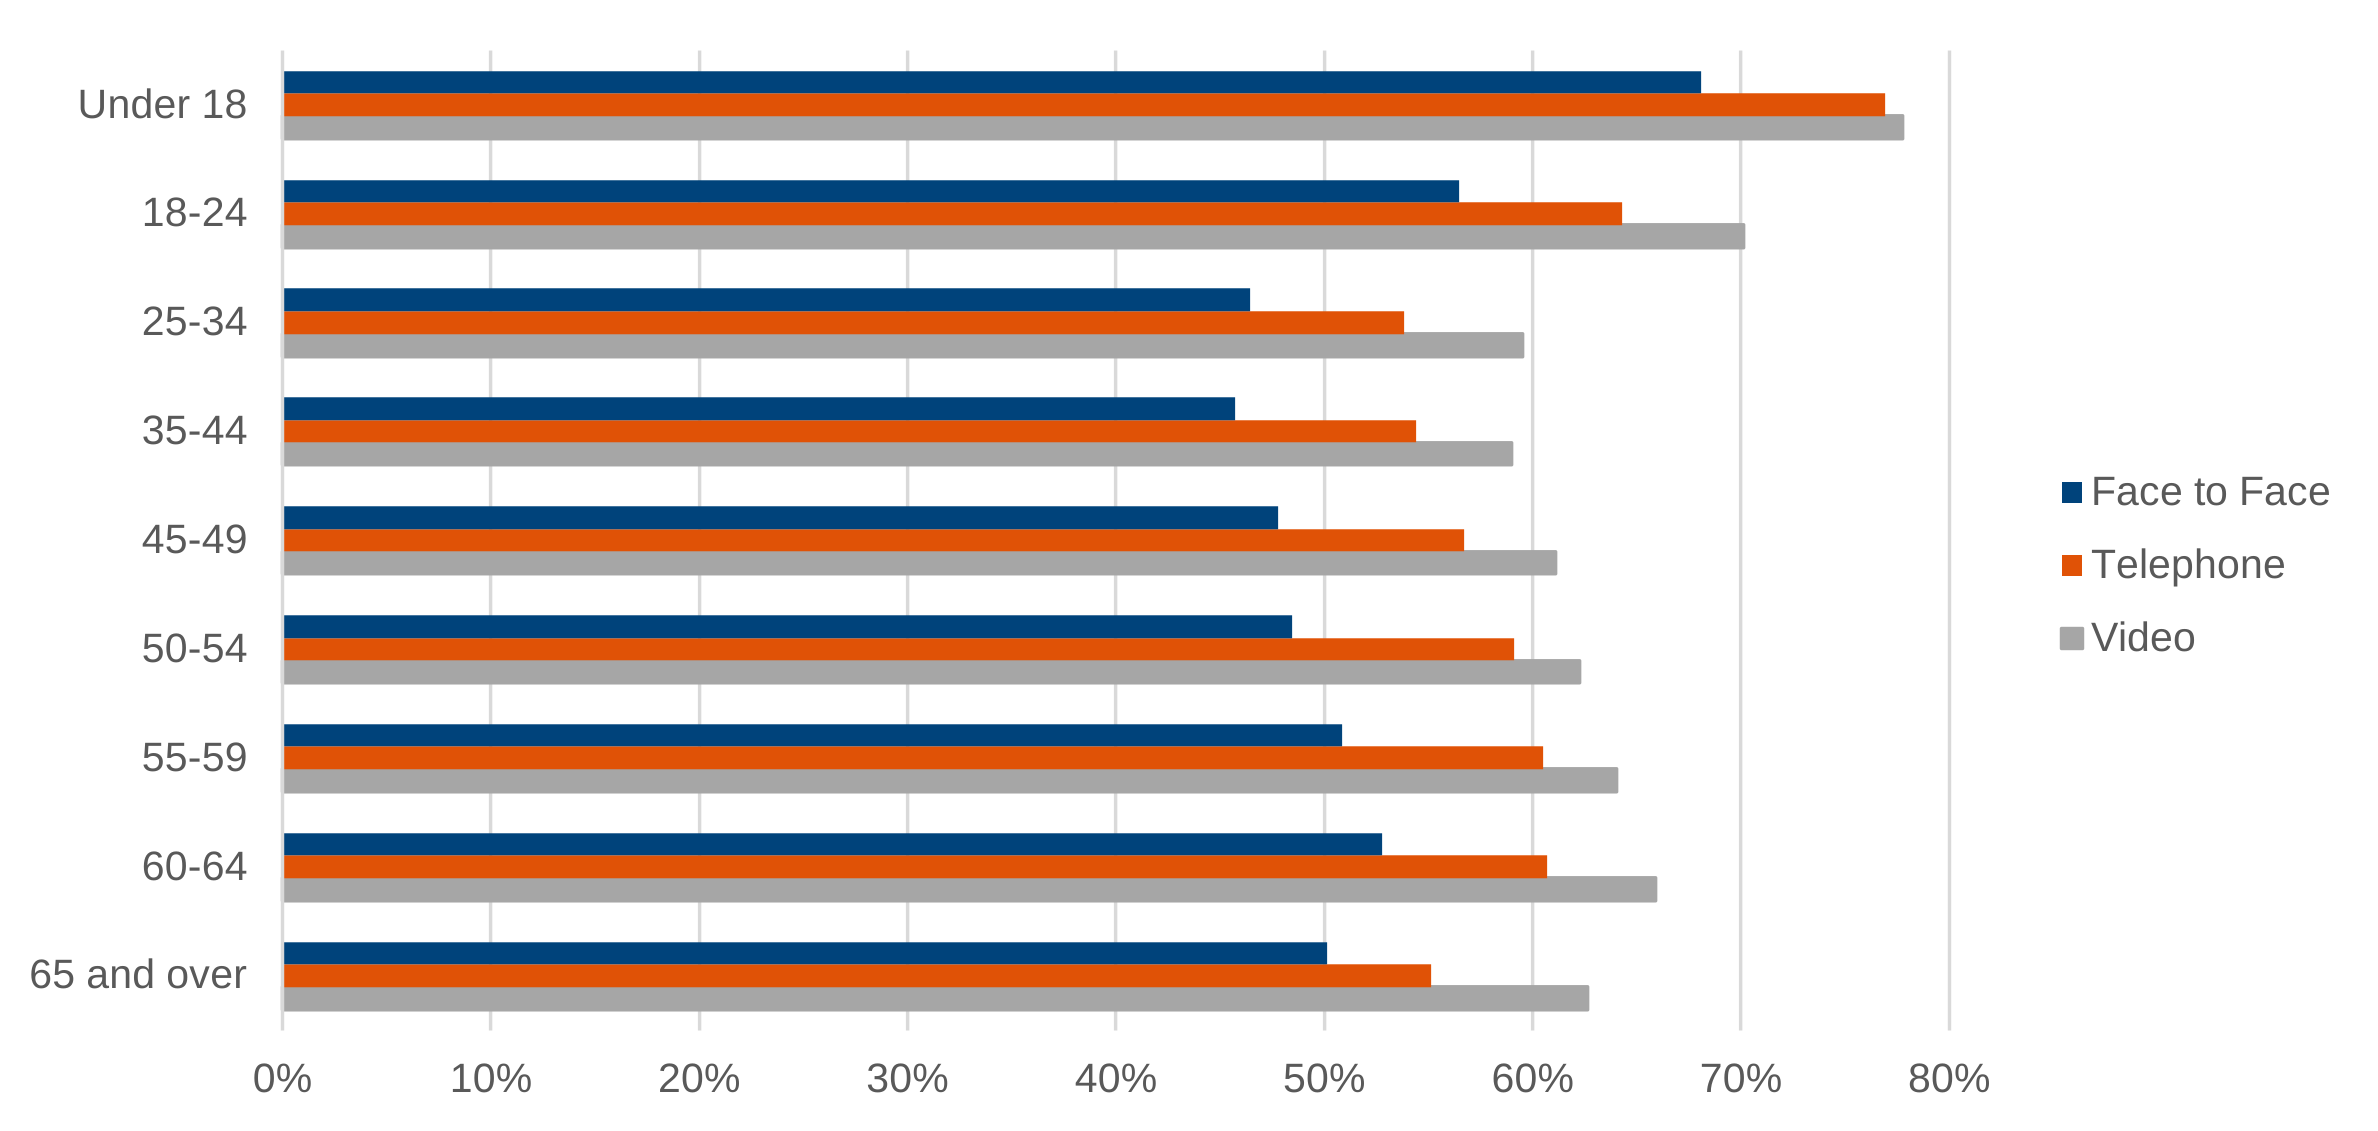
Figure 5: UC LCWRA decisions out of all UC WCA consultations by age, April 2025 to March 2026
Whilst face-to-face assessments have the lowest LCWRA decision rate across all age groups, the difference between that and the other consultation types is largest in the 50 to 54 and 55 to 59 age groups.
Source: ODS Tables
Figure 5 shows 9 sets of bars for each of the age groups from Under 18 to 65 and over. Each set has 3 bars representing the percentage of UC WCA decisions that results in an LCWRA outcome for each of the consultation channels – face-to-face, telephone, and video. The chart shows that face-to-face assessments have the lowest LCWRA decision rate across all age groups, while video assessments have the highest rate across all age groups.
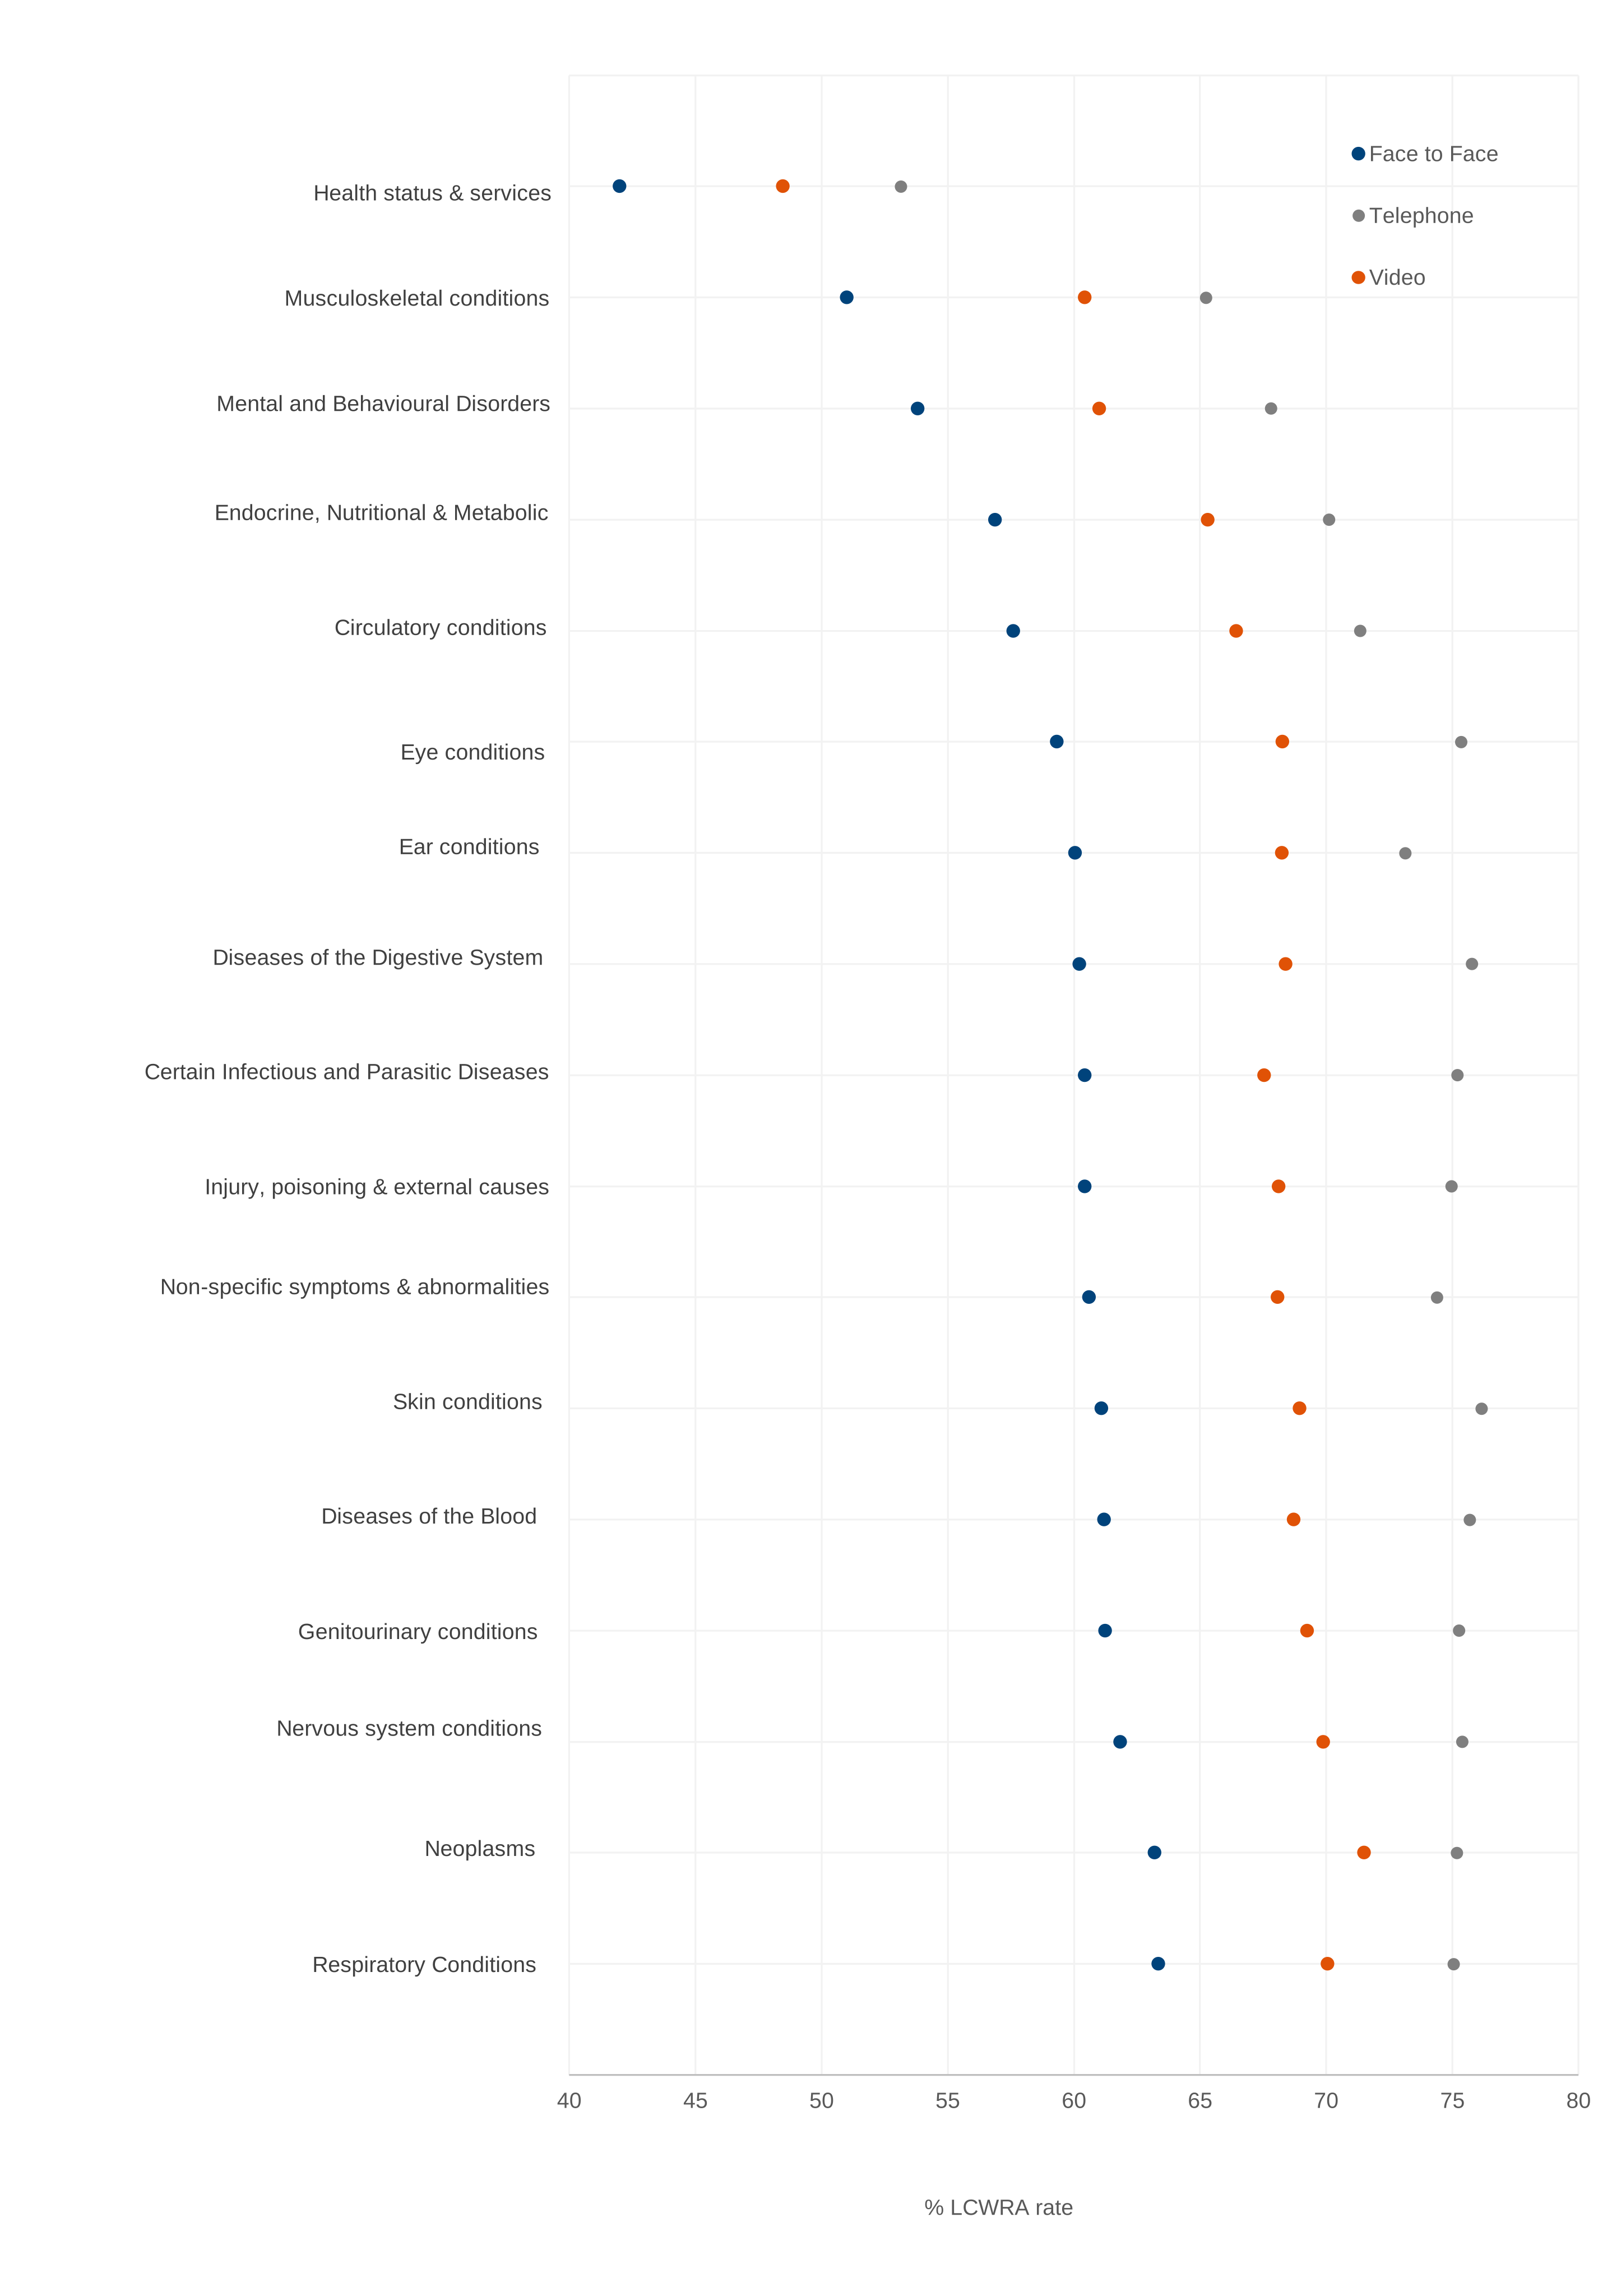
Figure 6: UC LCWRA decision rates by the medical condition (ICD summary group) recorded at assessment and the consultation channel through which they were assessed, April 2025 to March 2026
Across all medical condition groups for UC in the latest year, a higher proportion of LCWRA decisions were made for remote channels than face-to-face, with the largest variation occurring for the groups ‘eye conditions’ and ‘diseases of the digestive system’ with face-to-face rates of 59% and 60% and telephone rates of 75% and 76% respectively.
Source: ODS Tables
Figure 6 shows a categorical scatter plot with 17 rows for different medical condition categories. Each row has 3 dots representing the percentage of UC WCA decisions that results in an LCWRA outcome for each of the consultation channels – face-to-face, telephone, and video. The chart shows that in the latest year April 2025 to March 2026, a higher proportion of LCWRA decisions were made for remote channels than face-to-face across all medical condition groups.
About this analysis
The figures presented in this release are based on internal analysis using published UC and ESA statistics and UC and ESA data. As these are outturn figures, using 100% of decisions following a WCA, the level of statistical uncertainty in the analysis is low. However, the results may not match exactly the totals released as UC Health and ESA Official WCA Decisions statistics due to methodological and rounding differences, particularly as ESA transition claimants were excluded from the UC tables.
Statement of application of the Code of Practice for Statistics
The Code of Practice for Statistics (the Code) is built around 3 main concepts, or pillars:
-
trustworthiness – is about having confidence in the people and organisations that publish statistics
-
quality – is about using data and methods that produce statistics
-
value – is about publishing statistics that support society’s needs
The following explains how we have applied the pillars of the Code in a proportionate way.
Trustworthiness
DWP analysts work to a professional competency framework and Civil Service core values of integrity, honesty, objectivity, and impartiality. Analysts have produced these statistics and conducted rigorous quality assurance in line to the standards usually applied to ad hoc releases. Background and methodology information is also included in the release.
The analysis has been signed off by the expert Lead Analyst and the Department’s Chief Statistician/Head of Profession for Statistics. The publication was approved through DWP’s statistical governance process, including review of the rationale for publication, quality assurance arrangements and compliance with the Code of Practice for Statistics. The timing of the publication was pre-announced.
Care has been taken to ensure only those who needed to see the analysis prior to publication had access to it.
Quality
The data which underpins this information is taken directly from departmental systems, which are relied upon by DWP for the administration and operation of UC and ESA.
Quality assurance has taken place in line with the standards usually applied to DWP ad hoc releases, with an internal check that the results shown are robust and checked against published data.
Value
Releasing this information serves the public interest regarding channels.
Contact information
Press enquiries should be directed to the DWP Press Office.