Weekly all-cause mortality surveillance (week 41 report, up to week 37 data)
Updated 7 September 2023

© Crown copyright 2023
This publication is licensed under the terms of the Open Government Licence v3.0 except where otherwise stated. To view this licence, visit nationalarchives.gov.uk/doc/open-government-licence/version/3 or write to the Information Policy Team, The National Archives, Kew, London TW9 4DU, or email: psi@nationalarchives.gov.uk.
Where we have identified any third party copyright information you will need to obtain permission from the copyright holders concerned.
This publication is available at https://www.gov.uk/government/statistics/weekly-all-cause-mortality-surveillance-2022-to-2023/weekly-all-cause-mortality-surveillance-week-41-report-up-to-week-37-data
In week 37 of 2022, no statistically significant excess all-cause mortality by week of death was observed overall in England through the EuroMOMO algorithm. In the devolved administrations, no statistically significant excess all-cause mortality for all ages was observed for Northern Ireland, Wales or Scotland in week 37.
Note that level 3 heat-health alerts were issued for 17 to 18 June, 11 to 21 July, and 9 to 16 August 2022, and a level 4 heat-health alert was issued for 18 to 19 July 2022.
Excess all-cause (EuroMOMO) mortality in subpopulations, UK
In week 37 of 2022 in England, no statistically significant excess mortality by week of death above the 2 z-score threshold was seen overall, by age group or by region after correcting General Register Office (GRO) disaggregate data for reporting delay with the standardised EuroMOMO algorithm (Figure 1).
In the devolved administrations, no statistically significant excess all-cause mortality for all ages was observed for Northern Ireland, Wales or Scotland in week 37.
This data is provisional due to the time delay in registration, so numbers may vary from week to week.
Data presented in this week’s report supersedes data presented in reports from previous weeks.
Figure 1: Weekly observed and expected number of all-cause deaths in all ages, with the dominant circulating respiratory virus, England, 2017 to week 37, 2022
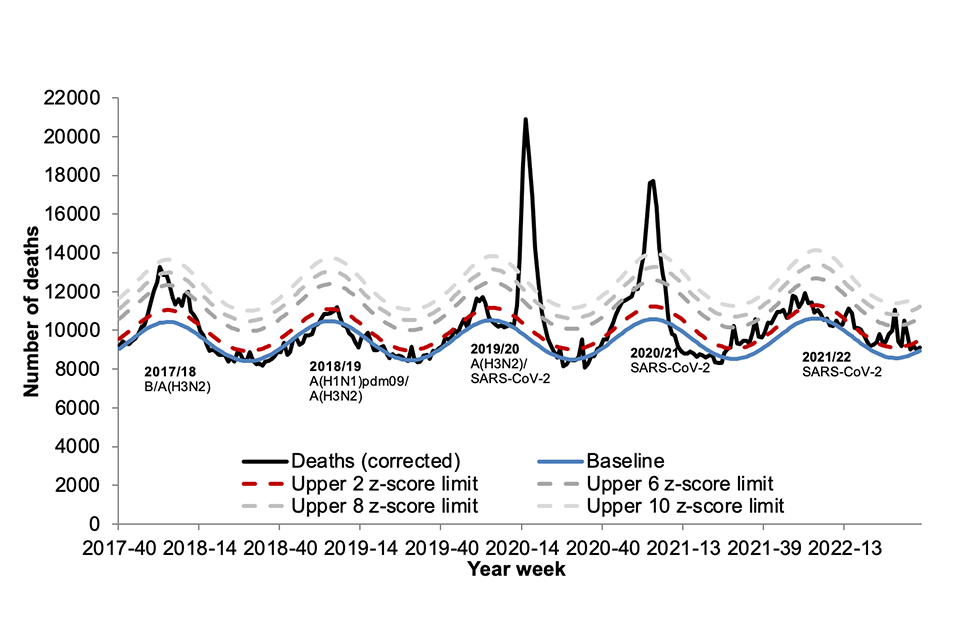
Note: the recent weeks’ data are estimates which may be subject to registration delay corrections and therefore should be interpreted with caution. These estimates may differ substantially from future reports as more deaths are registered.
Table 1: Excess mortality by age group, England*
| Age group (years) | Excess detected in week 37, 2022? | Weeks with excess in 2021 to 2022 |
|---|---|---|
| <5 | No | 48, 24, 29 |
| 5 to 14 | No | NA** |
| 15 to 64 | No | 40 to 2, 25, 27 to 29, 32 to 33, 35 |
| 65+ | No | 40 to 45, 48 to 49, 51 to 52, 2, 13 to 18, 24 to 30, 32 to 33 |
Table 2: Excess mortality by UK country, for all ages*
| Country | Excess detected in week 37, 2022? | Weeks with excess in 2021 to 2022 |
|---|---|---|
| England | No | 40 to 2, 13 to 15, 17 to 18, 23 to 33 |
| Wales | No | 40, 42 to 43, 45, 29, 32 |
| Northern Ireland | No | 43 to 44, 46 to 50, 52, 29 |
| Scotland | No | 40 to 41, 45, 47 to 49, 52, 2 |
*Excess mortality is calculated as the observed minus the expected number of deaths in weeks above threshold.
**NA refers to no excess seen.
Note: separate total and age-specific models are run for England, which may lead to discrepancies between tables 1 and 2.
All-cause death registrations (ONS), England and Wales
The provisional number of weekly deaths registered in England and Wales is published online by the Office for National Statistics (ONS).
Data interpretation and further information
Seasonal mortality is seen each year in England and Wales, with a higher number of deaths in winter months compared to the summer. Additionally, peaks of mortality above this expected higher level typically occur in winter, most commonly the result of factors such as cold snaps and increased circulation of respiratory viruses, in particular influenza and in summer occasionally because of heatwaves.
This weekly mortality surveillance aims to detect and report acute significant weekly excess mortality above normal seasonal levels in a timely fashion. Excess mortality is defined as a significant (above the upper 2 z-score threshold) number of deaths reported over that expected for a given point in the year, allowing for weekly variation in the number of deaths. A z-score is a statistical measure of how many standard deviations above the baseline threshold the number of deaths were. For example, a z-score of 2 means that the number of deaths were 2 standard deviations above the baseline threshold.
The coronavirus (COVID-19) pandemic period is excluded from the baseline thresholds calculation. Excess mortality triggers further investigation of spikes and informs any public health responses.
The aim is not to assess general mortality trends or precisely estimate the excess attributable to different factors, although some end-of-winter estimates and more in-depth analyses (by age, geography, and so on) are undertaken.
Separate to the calculations presented in this report, excess winter deaths (EWD), comparing the number of deaths in the winter period compared to the non-winter period, are calculated by the ONS.
Other measures of excess mortality published by the UK Health Security Agency (UKHSA) or the Office for Health Improvement and Disparities (OHID) are the Fingertip excess mortality in England report, which uses ONS death registration data, and the UKHSA daily GRO mortality model which is published in the weekly influenza and COVID-19 surveillance report.