Vehicle speed compliance statistics for Great Britain: April to June 2021
Published 7 September 2021

© Crown copyright 2021
This publication is licensed under the terms of the Open Government Licence v3.0 except where otherwise stated. To view this licence, visit nationalarchives.gov.uk/doc/open-government-licence/version/3 or write to the Information Policy Team, The National Archives, Kew, London TW9 4DU, or email: psi@nationalarchives.gov.uk.
Where we have identified any third party copyright information you will need to obtain permission from the copyright holders concerned.
This publication is available at https://www.gov.uk/government/statistics/vehicle-speed-compliance-statistics-for-great-britain-april-to-june-2021/vehicle-speed-compliance-statistics-for-great-britain-april-to-june-2021
We are providing our statistics releases in HTML format and we would like to hear your comments. If you have any feedback on our use of this format, please contact vehicle speed compliance statistics (see contact details).
About this release
This quarterly statistical release presents estimates of car compliance with speed limits in free-flowing conditions on roads in Great Britain.
This is being produced in addition to the annual vehicle speeds compliance release, which covers other vehicle types.
These are based on speed data from a sample of Department for Transport’s Automatic Traffic Counters (ATCs), chosen to exclude locations where external factors might restrict driver behaviour (e.g. junctions, hills, sharp bends and speed cameras).
The statistics provide insights into speeds at which drivers choose to travel when free to do so, but are not estimates of average speeds across the whole network, which are available separately.
The proportion of cars exceeding the speed limit during April to June 2021 was lower than during the same period in 2020, which was affected by the first national lockdown, but similar to the same period in 2019.
Figure 1: Proportion of cars exceeding the speed limit in Great Britain, from 2019
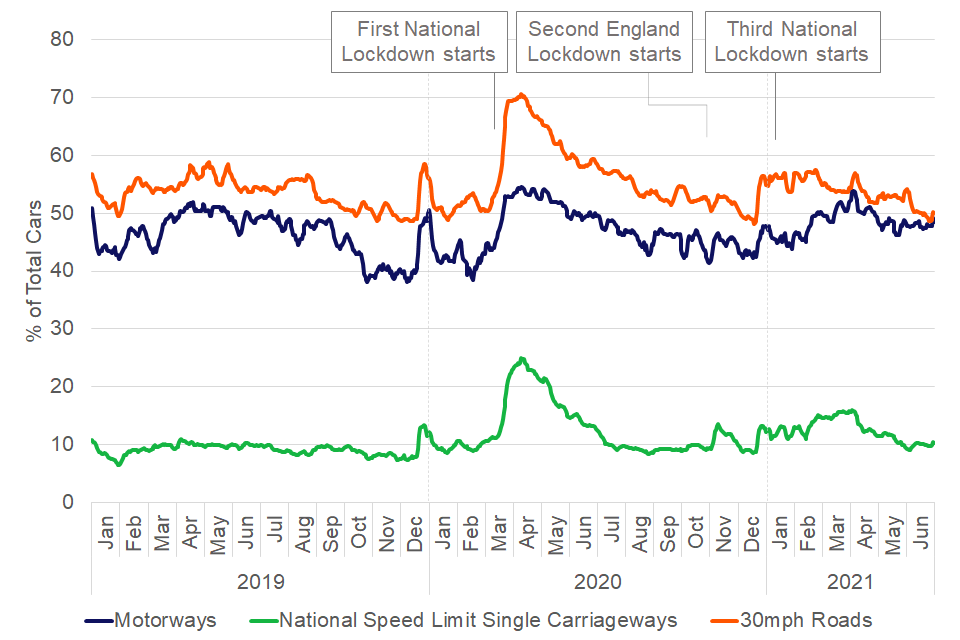
All road types saw a sharp increase in speeding in March 2020 which quickly started returning to normal levels. A smaller increase is seen in December 2020 but speed compliance had returned to similar levels to previous years by April 2021.
In April to June 2021, 51% of cars in free-flowing conditions exceeded the speed limit on motorways. On National Speed Limit (NSL) single carriageways with a car speed limit of 60mph, 11% of cars exceeded the speed limit, while on 30 mph roads, 53% of cars exceeded the speed limit. These figures are lower when compared to the same period in 2020 but are similar to figures seen in April to June 2019 indicating that, alongside the return of overall traffic levels to those seen before the pandemic, speed compliance activity is also in line with trends seen prior to the pandemic.
Context
The annual speed compliance statistics normally show very little variation in compliance with the speed limit from year to year so, without the coronavirus pandemic, we would expect speed limit compliance to have remained in line with previous years. Statistics for 2019 are included to provide comparisons to the trend prior to the pandemic period.
In late March 2020, the UK entered its first national lockdown. There was an immediate large drop in daily traffic levels, which particularly affected April to June 2020, this can be seen in Figure 2. Traffic levels recovered slowly, before declining again in the autumn, when further local and national restrictions were seen due to the pandemic.
January 2021 saw England enter a third national lockdown and Scotland a second national lockdown while Wales continued its third national lockdown, which had begun in December 2020. These lockdowns again significantly reduced daily traffic levels, however, traffic levels remained higher than those seen in April to June 2020. By June 2021, overall road traffic levels had returned to levels close to those seen before the pandemic.
The trends in speed limit compliance presented in this report can often be seen to coincide with these exceptional changes in road traffic. Generally, during periods of reduced traffic, speed limit exceedances have been higher, though it should be noted that other factors, such as changes in season and weather, may also have been having an impact.
Figure 2: Daily car use on roads in Great Britain, since March 2020
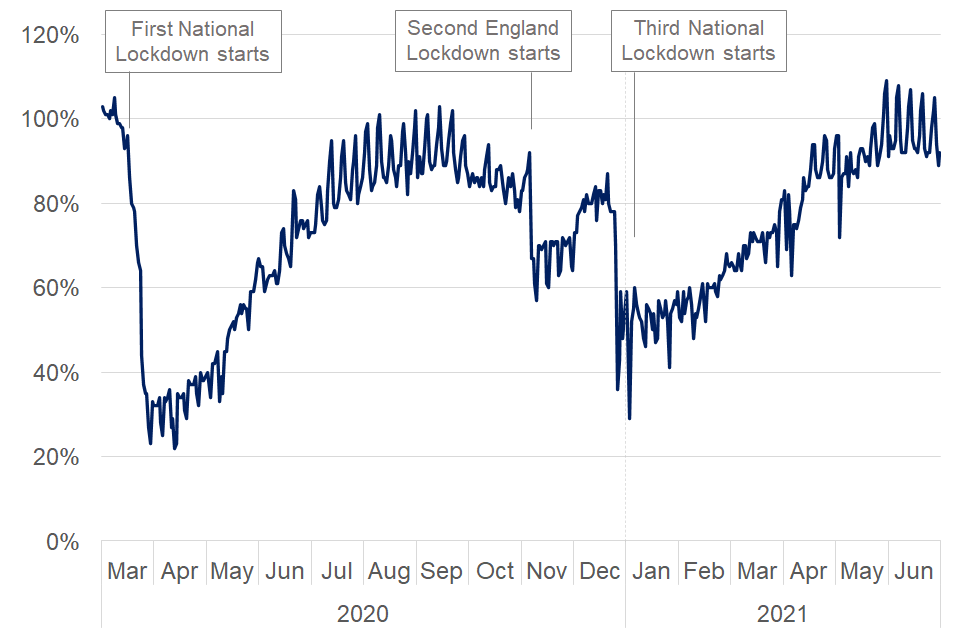
In March 2020, there was a sudden drop in car levels which recovered slowly. A drop is also seen in November but this was not as large, with a slightly larger drop seen again in January. This also recovered slowly.
For more information, see transport use during the coronavirus pandemic.
Key Dates
Table 1: Key dates during the coronavirus pandemic
| Date of introduction | Coronavirus events |
|---|---|
| 23 March 2020 | UK enters first national lockdown |
| 30 June 2020 | UK introduces first local lockdown |
| 14 October 2020 | England introduces 3 tier system |
| 23 October 2020 | Wales introduces fire-break lockdown, ends 9 November |
| 2 November 2020 | Scotland introduces 5 tier system |
| 5 November 2020 | England enters second national lockdown, ends 2 December |
| 19 December 2020 | Tier 4 introduced for London, South East and East of England |
| 20 December 2020 | Wales enters third national lockdown |
| 26 December 2020 | Large parts of England enter tier 4 |
| 5 January 2021 | England enters third national lockdown. Scotland enters second national lockdown |
| 29 March 2021 | ‘Stay at home’ order in England ends, but people encouraged to stay local |
| 12 April 2021 | England’s non-essential retail, hairdressers, public buildings reopen |
| 21 June 2021 | All legal limits on social contact removed in England |
Understanding and interpreting these statistics
What do free flow speeds tell us?
- free flow speeds reflect the speeds drivers may travel at when free to do so
- they are not representative of the level of speeding across the whole road network, which we would expect to be lower
What roads are covered?
Only sites where the road conditions are free flowing and there are no junctions, hills, sharp bends, speed enforcement cameras or other traffic calming measures. The statistics do not cover roads where the road layout or traffic calming measures are likely to constrain vehicle speeds. This includes smart motorways.
Comparing data between years
Only broad-scale comparisons of patterns in compliance and speeds over time periods of 5 or more years can be made confidently, unless the changes are large and the context is clear. This release covers April to June 2021 and therefore cannot be directly compared to annual publications. Quarterly statistics in 2019 and 2020 are provided throughout the release for comparative purposes.
Comparing data between quarters
Comparisons should generally be made with the same quarter of previous years, otherwise seasonal factors such as differences in light or weather conditions may distort the result.
Comparisons with a different quarter of the year may be biased by seasonal patterns. If a difference between quarters was the same in other years, this is likely down to the seasons.
Key terms
Exceeding the speed limit
Vehicles travelling at a speed higher than their applicable speed limit are defined as “exceeding the speed limit”.
Free flow speed
Free flow speeds are observed in locations where external factors which might restrict driver behaviour (for example, junctions, hills, sharp bends and speed enforcement cameras) are not present.
Speed limits
Speed limits for cars are 70 mph on Motorways and 60 mph on National Speed Limit Single Carriageways. A complete breakdown of national speed limits can be found on the speed limits webpage.
Distribution of car speeds by road type
In April to June 2021, the proportion of cars exceeding the speed limit was lower than the same period in 2020 and similar to the same period in 2019 across all 3 road types (see Table 2).
On motorways:
- 51% of cars exceeded the speed limit compared to 53% in 2020 and 52% in 2019
On NSL single carriageways (60mph limit):
- 11% of cars exceeded the speed limit compared to 17% in 2020 and 10% in 2019
On 30 mph roads:
- 53% of cars exceeded the speed limit compared to 63% in 2020 and 56% in 2019
In April to June 2021, the proportion of cars exceeding the speed limit by 10 mph or more was lower than the same period in 2020 and similar to the same period in 2019 across all 3 road types (see Table 2).
Figure 3: Distribution of car speeds by road type in Great Britain, April to June 2019, 2020 and 2021
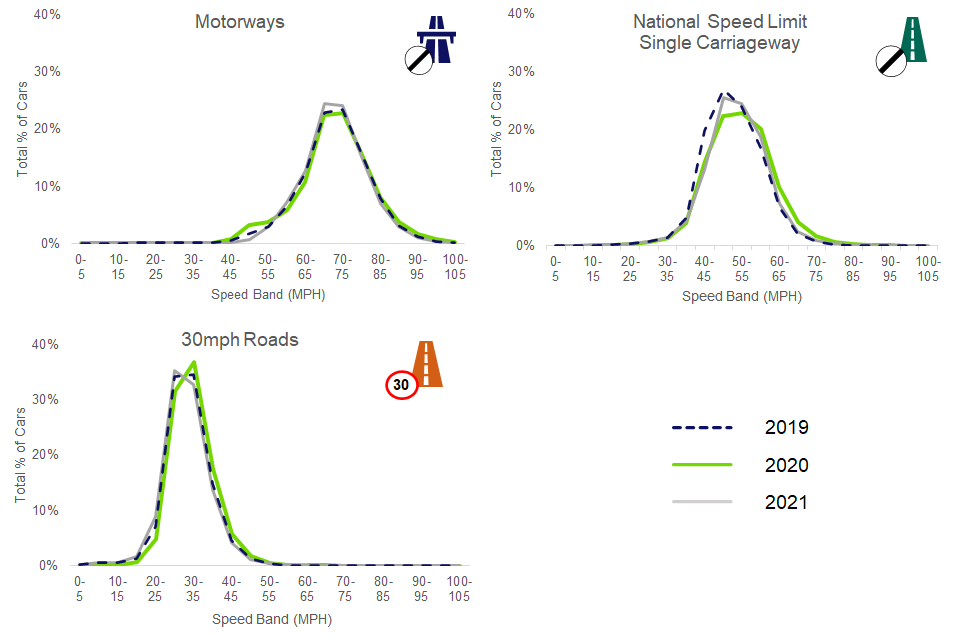
On motorways and 30mph roads, 2021 showed similar speed distributions to 2019 and 2020. On National Speed Limit Single Carriageways, 2021 showed similar speed distributions to 2019, with 2020 showing a higher proportion of cars speeding.
Table 2: Percentage of cars exceeding the speed limit by road type (Table SPE2501)
| Road type | Speed limit exceedance | 2019 Q1 | 2019 Q2 | 2019 Q3 | 2019 Q4 | 2020 Q1 | 2020 Q2 | 2020 Q3 | 2020 Q4 | 2021 Q1 | 2021 Q2 |
|---|---|---|---|---|---|---|---|---|---|---|---|
| Motorways | Exceeding speed limit | 48 | 52 | 50 | 44 | 46 | 53 | 49 | 47 | 50 | 51 |
| Motorways | Exceeding speed limit by 10mph and over | 11 | 13 | 12 | 9 | 10 | 15 | 11 | 11 | 12 | 12 |
| NSL Single Carriageways | Exceeding speed limit | 9 | 10 | 9 | 9 | 10 | 17 | 9 | 10 | 13 | 11 |
| NSL Single Carriageways | Exceeding speed limit by 10mph and over | 1 | 1 | 1 | 1 | 1 | 3 | 1 | 1 | 2 | 1 |
| 30mph roads | Exceeding speed limit | 54 | 56 | 54 | 51 | 53 | 63 | 55 | 52 | 56 | 53 |
| 30mph roads | Exceeding speed limit by 10mph and over | 6 | 6 | 6 | 5 | 6 | 8 | 6 | 6 | 6 | 6 |
Compliance with the speed limit by time of day
In April to June 2021, the proportion of cars exceeding the speed limit during the day (between 6am and 5pm) was lower in the same period in 2020 and 2019 across all 3 road types.
On motorways:
- 47% of cars exceeded the speed limit during the day compared to 50% in 2020 and 48% in 2019
On NSL single carriageways:
- 10% of cars exceeded the speed limit during the day compared to 16% in 2020 and 9% in 2019
On 30 mph roads:
- 52% of cars exceeded the speed limit during the day compared to 63% in 2020 and 55% in 2019
Comparing April to June 2021 with April to June 2020:
- the proportion of cars exceeding the speed limit during the early hours of the morning was slightly lower
- on motorways, the reduction in speed limit exceedance usually seen during the morning and evening rush hour periods returned to levels seen in 2019
Across all road types, the proportion of cars exceeding the speed limit throughout the day in the third national lockdown did not reach levels seen during the first national lockdown in April to June 2020. On 30 mph roads, it was also lower than the proportion seen in April to June 2019 (see Table SPE2502).
Figure 4: Proportion of cars exceeding the speed limit by time of day in Great Britain, April to June 2019, 2020 and 2021
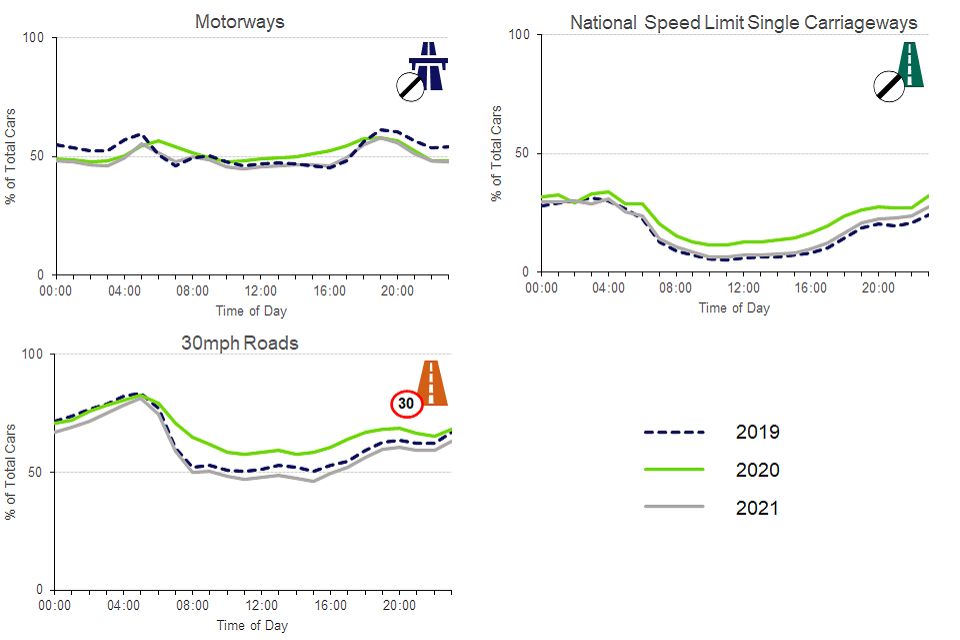
On all road types, 2021 saw a return of a drop in speeding at morning and evening rush hour periods. This drop was largely absent in 2020. Speeding remained highest in the early hours of the morning and lowest during the day.
Compliance with the speed limit by day of week
In April to June 2021:
- on motorways, the proportion of cars exceeding the speed limit on weekdays was lower than the same period in 2020 and similar to the same period in 2019
- on NSL single carriageways, the proportion of cars exceeding the speed limit on weekdays and weekends was lower than the same period in 2020 and similar to the same period in 2019
- on 30 mph roads, the proportion of cars exceeding the speed limit on weekdays and weekends was lower when compared to the same periods in 2020 and 2019
On all road types, the proportion of cars exceeding the speed limit remained higher on weekends than on weekdays. Sundays saw the highest proportion of cars exceeding the speed limit of any day of the week.
Figure 5: Proportion of cars exceeding the speed limit by day of week in Great Britain, April to June 2019, 2020 and 2021
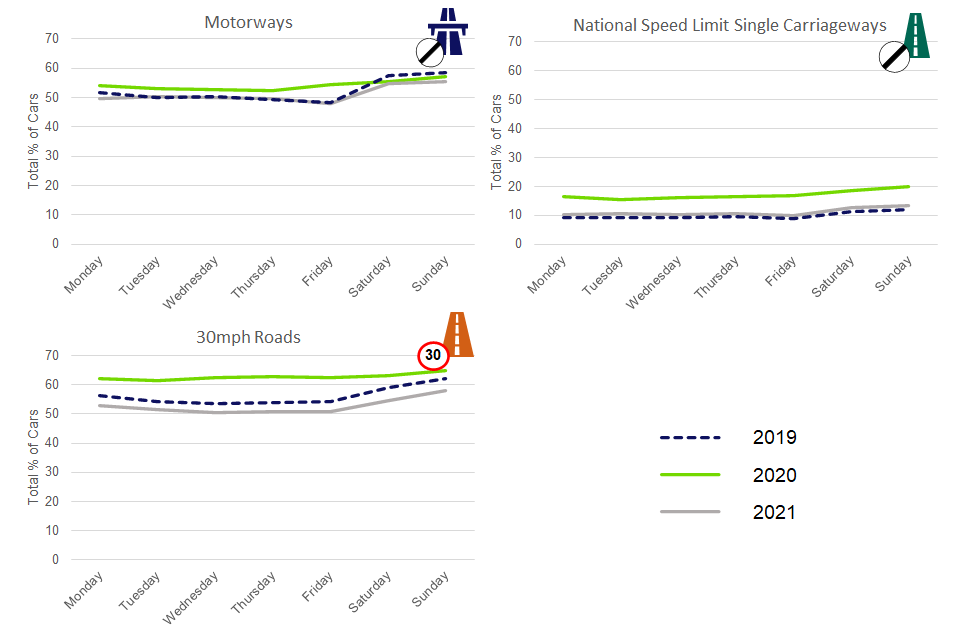
On motorways and National Speed Limit Single Carriageways, 2021 was very similar to 2019 and lower than 2020. On 30mph roads, 2021 was lower than 2019 and 2020. On all road types, speeding was slightly higher at the weekend.
Although seasonal differences may play a role as demonstrated in the charts below, weekday speed limit exceedance during April to June 2021 did not rise to levels seen in the first national lockdown. Weekend speed limit exceedance levels were more similar to those seen in the first national lockdown on motorways but were lower on NSL single carriageways and 30mph roads.
Figure 6: Proportion of cars exceeding the speed limit on weekdays and weekends in Great Britain from 2019 (Table SPE2503)
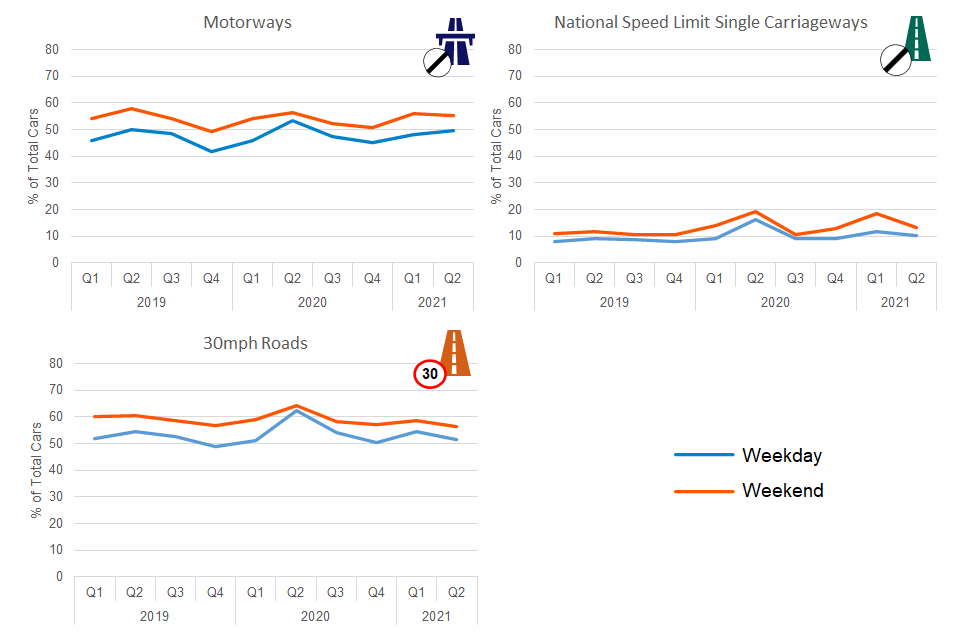
On all road types, there was an increase in speeding on weekdays and weekends during April to June 2020 and January to March 2021. On National Speed Limit Single Carriageways, the rise in weekday speeding in January to March 2021 was minimal.
Background information
What’s included in this release
This release has been produced in addition to the annual publication, published every summer. It provides a quarterly breakdown of car speed compliance statistics during periods covering the coronavirus pandemic, to investigate car speed compliance trends during the pandemic period.
This fifth quarterly release covers the period April to June 2021. It looks at car speed limit compliance on motorways, National Speed Limit single carriageways and 30 mph roads.
A daily time series analysis of car speed limit exceedance between April to June is provided. A separate daily time series chart of car usage on roads is included to provide additional context.
Vehicle definitions
Car: Includes cars, car derived vans and dual purpose vehicles.
Sources, strengths and weaknesses of the data
Following an annual sample review, these estimates are based on traffic speed data collected from a current sample of 78 Automatic Traffic Counters (ATCs) operated by the Department for Transport. In some cases (for example motorways), 2 ATCs may be covering different directions of traffic flow at the same location. The number of individual cars observed in the production of the April to June 2021 statistics was 63 million. The breakdown for each year is shown in Table 1.
Table 1: Number of Automatic Traffic Counters and vehicles used to produce free flow vehicle speed statistics for Great Britain, 2011 to 2021
| Year | Automatic Traffic Counters Used | Vehicles used (millions) | Significant proportion of data removed from (number of sites) |
|---|---|---|---|
| 2011 | 99 | 685 | 3 motorways |
| 2012 | 99 | 702 | 3 motorways |
| 2013 | 98 | 605 | 3 motorways |
| 2014 | 105 | 567 | 3 motorways |
| 2015 | 107 | 743 | 3 motorways |
| 2016 | 107 | 725 | 0 |
| 2017 | 92 | 637 | 0 |
| 2018 | 102 | 655 | 0 |
| 2019 | 79 | 510 | 0 |
| 2020 January to June | 78 | 91 (cars only) | 1 motorway |
| 2020 July to September | 77 | 66 (cars only) | 1 30 mph road |
| 2020 October to December | 77 | 50 (cars only) | 0 |
| 2021 January to March | 78 | 32 (cars only) | 0 |
| 2021 April to June | 78 | 63 (cars only) | 0 |
The ATC technology used to collect this data can experience technical failures and produce output data which is incorrect and not representative of the traffic passing the counter. The methodology accounts for these occasions and removes any data which is not accurate. The ATCs classify vehicles using the number of axles, the axle spacing and the length of the vehicle.
Full guidance on the sources and methods used to compile these statistics, plus information on speed limits, can be found on the guidance page.
Average speed statistics for both local authority managed ‘A’ roads and the Strategic Road Network are available online as part of a suite of travel time measures from the road congestion and reliability statistics series. Note that this series also uses the term “free flow speed” but this is calculated in a different way (for example ‘capped’ at national speed limits) and using a different data source to the statistics presented in this release. The data for this release has been recorded consistently well during times when traffic volumes are abnormally low or high.
Next update
The July to September 2021 quarterly release is due to be published in November 2021. We are continuing to review methodologies and the coverage of these statistics and further changes may be reflected in the next publication. We welcome feedback on this publication including content, timing and format (see contact details).
National Statistics
National Statistics are produced to high professional standards set out in the National Statistics Code of Practice. They undergo regular quality assurance reviews to ensure they meet customer needs.
Free flow vehicle speed statistics were assessed by the UK Statistics Authority against the Code of Practice and were designated as National Statistics in February 2013.
Details of Ministers and officials who receive pre-release access to these statistics up to 24 hours before release can be found on the pre-release access page.
Department for Transport (DfT) statistics Twitter feed
To hear more about DfT statistics publications as they are released, please follow us on Twitter.
Instructions for printing and saving
Depending on which browser you use and the type of device you use (such as an mobile or laptop) these instructions may vary.
You will find your print and save options in your browser’s menu. You may also have other options available on your device. Tablets and mobile device instructions will be specific to the make and model of the device.
How to search
Select Ctrl and F on a Windows laptop or Command and F on a Mac
This will open a search box in the top right-hand corner of the page. Type the word you are looking for in the search bar and press enter.
Your browser will highlight the word, usually in yellow, wherever it appears on the page. Press enter to move to the next place it appears.
Contact details
Road traffic and vehicle speed compliance statistics
Email roadtraff.stats@dft.gov.uk
Media enquiries 0300 7777 878