Use of Discretionary Housing Payments: analysis of end-of-year returns from local authorities, data for April 2020 to March 2021
Published 8 July 2021
Applies to England and Wales

© Crown copyright 2021
This publication is licensed under the terms of the Open Government Licence v3.0 except where otherwise stated. To view this licence, visit nationalarchives.gov.uk/doc/open-government-licence/version/3 or write to the Information Policy Team, The National Archives, Kew, London TW9 4DU, or email: psi@nationalarchives.gov.uk.
Where we have identified any third party copyright information you will need to obtain permission from the copyright holders concerned.
This publication is available at https://www.gov.uk/government/statistics/use-of-discretionary-housing-payments-financial-year-2020-to-2021/use-of-discretionary-housing-payments-analysis-of-end-of-year-returns-from-local-authorities-data-for-april-2020-to-march-2021
The latest release of these statistics can be found in the collection of Discretionary Housing Payments statistics.
1. Main stories
Here are the main headlines about the use of Discretionary Housing Payments for the financial year ending March 2021, based on information received from 327 out of 336 Local Authorities:
-
Local Authorities spent £171m on Discretionary Housing Payments, including any additional funding they provided
- this expenditure represented 98% of their allocated funding and compares to 103% in the previous financial year:
- this varied between Local Authorities, with nearly half (48%) of Local Authorities spending between 95% and 105% of their allocated funding. 38% spent less than 95% and 13% spent more than 105% (figures do not sum to 100% due to rounding)
- for Local Authorities that submitted awards data, the total number of DHP awards given out in the financial year was 251,667
- excluding any additional funding they provided, Local Authorities spent 94% of their allocated funding, compared to 98% the previous financial year
- just below two-thirds (63%) of DHP expenditure was recorded as being related to a welfare reform, with Removal of the Spare Room Subsidy (RSRS) accounting for the greatest share of expenditure (25%)
- over a quarter (27%) of DHP expenditure was recorded as being related to moving to alternative accommodation
2. What you need to know
Discretionary Housing Payments (DHPs) can be paid to those entitled to Housing Benefit or the housing element of Universal Credit who face a shortfall in meeting their housing costs. To be considered for a DHP, a claimant applies to their Local Authority. The Local Authority decides whether to give a DHP, how much will be paid and for how long the claimant will receive the payment. A DHP might cover a rent shortfall, a rent deposit for a claimant that needs to move home, or another housing cost.
The government provides funding to Local Authorities for DHPs. For the financial year ending March 2021, the government provided £179.5m of funding, an increase of £40m from the year ending March 2020. This funding was allocated between English and Welsh Local Authorities.
A Local Authority might spend less than their allocation of funding, or they might spend more by contributing their own funding (up to a spending limit of two-and-a-half times their allocation). Since Local Authorities are encouraged to manage their DHP budget, the level of DHP spending does not necessarily reflect the level of demand for DHPs.
These statistics cover the financial year ending March 2021. This means that the findings are likely to be affected by the COVID-19 pandemic, which means that caution should be taken when comparing them to the previous year. The findings are based on returns from 327 out of 336 Local Authorities.
Further guidance on these statistics is provided in the More information section of this publication and in the background information and methodology document.
3. How much of their DHP funding did Local Authorities spend?
Total funding provided for all Local Authorities for the financial year ending March 2021 was £179.5m. The 327 Local Authorities that these findings are based on were given £175m of this funding.
In the financial year ending March 2021, Local Authorities who provided information had spent £164m on DHPs. This figure excludes any additional funding Local Authorities provided. This means that DHP expenditure represented 94% of the Local Authorities’ combined funding for the financial year. This level of spending was similar for both English (94%) and Welsh (98%) Local Authorities.
In the previous financial year, ending March 2020, expenditure excluding additional funding was £125m and represented 98% of the combined allocations for Local Authorities that submitted a return. Expenditure in both years should not be directly compared as there was a different number of returns from Local Authorities in each year and total funding was £40m lower in the financial year ending March 2020 (£139.5m).
When additional funding from Local Authorities is included, Local Authorities spent £171m on DHPs in the financial year ending March 2021. This represented 98% of their combined allocations. In the previous year, Local Authorities spent £132m (103%) of their allocated funding, including additional funding. For the same reasons as above, direct comparisons should not be made between the two years.
There were 251,667 awards made to claimants in the financial year ending March 2021. For Local Authorities that gave the details of the benefits claimed by their DHP recipients, over half (55%) of DHP awards were made to Universal Credit claimants. 250,360 awards were reported in the previous year.
Nearly half of Local Authorities spent between 95% and 105% of their allocation
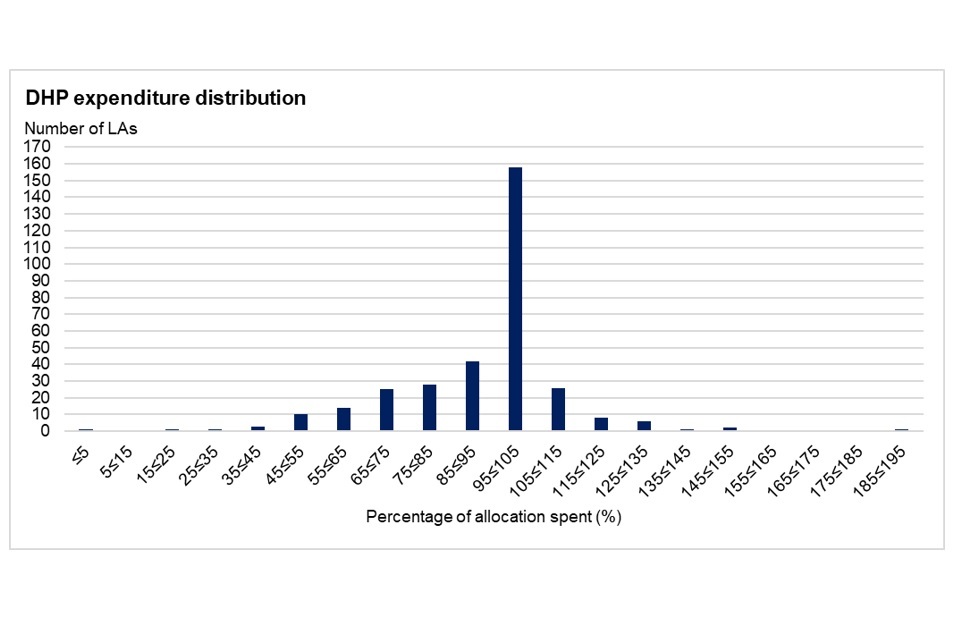
Nearly half of Local Authorities (48%) spent between 95% and 105% of their allocated funding: that is, they spent slightly more or slightly less than their allocated funding. Over a third (38%) spent less than 95% of their allocated funding, while 13% spent more than 105%. These percentages do not sum to 100% due to rounding. In the previous financial year, Local Authorities spent higher proportions of their allocated funding: 19% spent under 95%,16% spent over 105% and 65% spent between 95% and 105%.
3 in 10 Local Authorities spent between 99% and 101% of their allocation
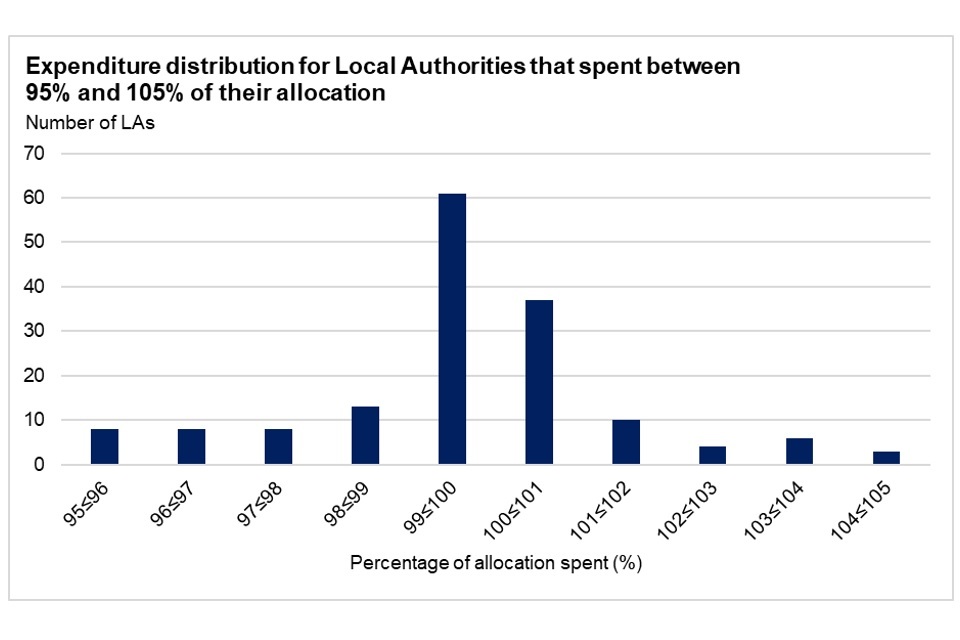
When looking more closely at Local Authorities that spent between 95% and 105% of their allocations, 98 of them spent between 99% and 101% (i.e. very close to 100% of their allocation). This is three in ten (30%) of all Local Authorities that provided a return. Of these,13 Local Authorities reported spending exactly 100% of their allocation.
Local Authorities in London spent the most of their allocations, Local Authorities in East Midlands spent the least
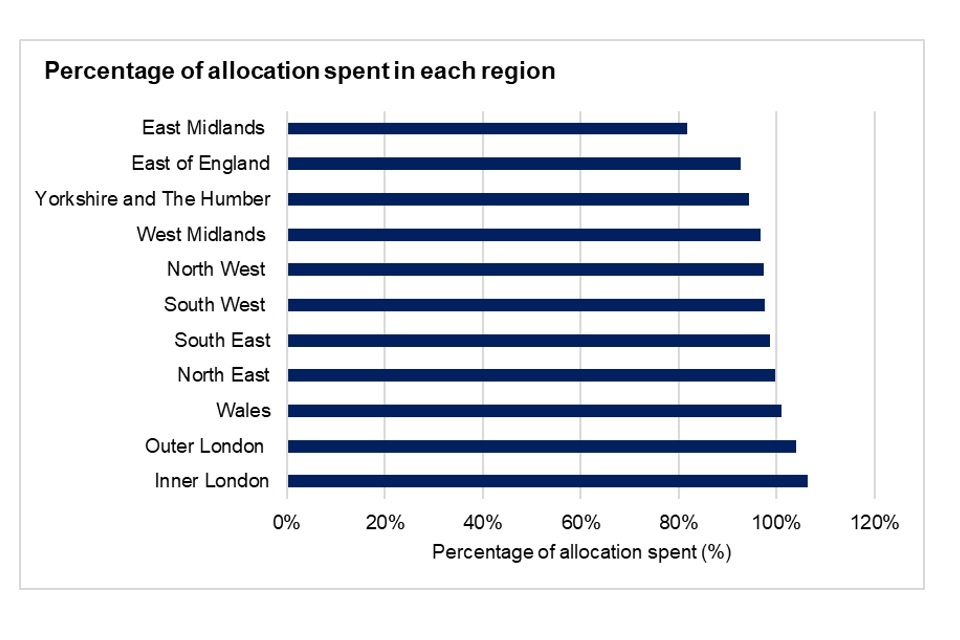
Local Authorities in London spent the greatest proportion of their combined allocations: those in Inner London spent 106% of their allocations and those in Outer London spent 104%. Local Authorities in the East Midlands spent the lowest proportion of their combined allocations (82%). In the financial year ending March 2020, the regional variation was different, with Local Authorities in the North East spending the highest proportion of their combined allocations (107%) and Local Authorities in the South West spending the lowest (96%).
4. How much was spent on each welfare reform
Nearly two-thirds of DHP expenditure was related to welfare reforms

Nearly two-thirds (63%) of DHP expenditure was recorded as related to welfare reforms (the percentages in the chart above do not add up to this due to rounding). Of the individual welfare reforms, Removal of the Spare Room Subsidy (RSRS) was recorded as being responsible for the largest proportion of DHP expenditure (25%), followed by the Benefit Cap (17%) and Local Housing Allowance reforms (14%). 37% of DHP expenditure was unrelated to welfare reforms.
In the previous year, a similar proportion (64%) of DHP expenditure was recorded as being related to welfare reforms.
5. What DHPs were awarded for
Over a quarter of expenditure was related to moving to alternative accommodation

Just over a quarter (27%) of DHP expenditure was recorded as being related to moving to alternative accommodation. 17% was to help with short-term rental costs while the claimant sought employment, while 2% went towards costs for disabled people in adapted accommodation and 1% went to supporting on-going rental costs for a foster carer.
We have less information on the remainder of the DHP expenditure, which is categorised under “ongoing rental costs for any other reason”. 53% of DHP expenditure was recorded as being given for this purpose.
Expenditure in the previous year was similar, with 28% of DHP expenditure recorded as relating to moving to alternative accommodation and 15% recorded as helping with short-term rental costs while the claimant sought employment.
6. More information
DHP Government Funding
Funding for DHPs has historically been split into four streams (Core, Local Housing Allowance, Removal of the Spare Room Subsidy and Benefit Cap) for DWP’s calculation purposes, although Local Authorities are not required to take account of these streams in allocating their funding. Total DHP funding for the financial year ending March 2021 was £179.5m. This was an increase of £40m compared to the previous year, the increase being distributed on the basis of Local Housing Allowance shortfalls. More information about funding levels over time can be found in table 1 in the data tables document accompanying this statistics release.
Welfare Reforms
Since the welfare reforms in 2011, the government has significantly increased its contribution to DHPs. This is so that Local Authorities can support those affected by the Benefit Cap, Removal of the Spare Room Subsidy (RSRS) and reforms to the Local Housing Allowance (LHA). The background information and methodology document provides more detail on what the welfare reforms are.
Data Source
At the end of each financial year, Local Authorities provide details of their DHP expenditure for financial accounting purposes, which they are legally required to do. 327 out of 336 Local Authorities provided this information in time for inclusion within these statistics. Of these 327 Local Authorities, 318 gave information about the number of DHP awards they gave out in the financial year.
In addition to financial information, Local Authorities are also asked, at the mid-point and end of each financial year, to provide additional monitoring information, which is voluntary. Since this is voluntary, not all Local Authorities supply some or all of the information requested. Of the 327 Local Authorities that submitted a return, 314 provided a breakdown of expenditure by welfare reform and 304 provided a breakdown of expenditure by purpose of DHP. More information about both the financial information and monitoring information provided in returns can be found in the background information and methodology document.
Release Schedule
These Official Statistics are released biannually. This current statistical release presents a summary of the end-of-year final claim forms that include both financial and monitoring information. They cover the financial year ending March 2021.
The next release in this series will be based on mid-year returns covering April 2021 to September 2021. It will be published in December 2021.
Status
These statistics have not been assessed by the UK Statistics Authority and have not been designated as National Statistics.
7. Where to find out more
These statistics are released as part of a series of Discretionary Housing Payment statistics.
Read information about Discretionary Housing Payments, including how to claim them.
Read the background information and methodology document for this release.
8. Contact information
Responsible Analyst: Graham Walmsley
Email: Graham.Walmsley1@dwp.gov.uk
Author: Isaac Holliday
Email: Isaac.Holliday@dwp.gov.uk
DWP Press Office: 0203 267 5144
Comments/Feedback is welcome
Published 8 July 2021
Next edition December 2021