Use of Discretionary Housing Payments: analysis of mid-year returns from local authorities, April 2020 to September 2020
Published 17 December 2020
Applies to England and Wales

© Crown copyright 2020
This publication is licensed under the terms of the Open Government Licence v3.0 except where otherwise stated. To view this licence, visit nationalarchives.gov.uk/doc/open-government-licence/version/3 or write to the Information Policy Team, The National Archives, Kew, London TW9 4DU, or email: psi@nationalarchives.gov.uk.
Where we have identified any third party copyright information you will need to obtain permission from the copyright holders concerned.
This publication is available at https://www.gov.uk/government/statistics/use-of-discretionary-housing-payments-april-to-september-2020/use-of-discretionary-housing-payments-analysis-of-mid-year-returns-from-local-authorities-april-2020-to-september-2020
The latest release of these statistics can be found in the collection of Discretionary Housing Payments statistics.
1. Main stories
Main headlines about the use of Discretionary Housing Payments for mid-year 2020 to 2021:
- Halfway through the financial year 2020 to 2021, Local Authorities had spent 40% of their allocations for the year, compared to 49% at the same point in 2019 to 2020:
- this varied between Local Authorities, with 29% of LAs spending less than 30% of their allocation and 11% spending over half
- about two-thirds of DHP expenditure was related to a welfare reform, with removal of the spare room subsidy (RSRS) accounting for the greatest share of expenditure (26%)
- over a quarter (27%) of DHP expenditure was related to moving accommodation, while 18% was used for short-term rental costs while seeking employment
2. What you need to know
Discretionary Housing Payments (DHPs) can be paid to those entitled to Housing Benefit or the housing element of Universal Credit who face a shortfall in meeting their housing costs. These payments are very flexible and can be considered where, in the Local Authority’s opinion, further financial assistance towards housing costs is required.
To be considered for a DHP, a claimant applies to their Local Authority (LA). The LA decides whether to give a DHP, how much will be paid and for how long the claimant will receive the payment. A DHP might cover a rent shortfall, a rent deposit for a claimant that needs to move home, or another housing cost.
The government provides funding to LAs towards DHPs. For the financial year 2020 to 2021, the government provided £179.5m of funding, an increase of £40m from financial year 2019 to 2020. This funding was allocated between English and Welsh LAs.
An LA might spend less than their allocation of funding or they might spend more, by contributing their own funding (up to a spending limit of two-and-a-half times their allocation). Since LAs are encouraged to manage their DHP budget, the level of DHP spending does not necessarily reflect the level of demand for DHPs.
Since the welfare reforms in 2011, the government has significantly increased its contribution to DHPs. This is so that LAs can support those affected by the benefit cap, removal of the spare room subsidy (RSRS) and reforms to the Local Housing Allowance (LHA). See the more information section for details on this funding.
At the end of each financial year, Local Authorities provide details of their DHP expenditure for financial purposes in a “financial return”, which they are legally required to provide. They are also asked, at the mid-point and end of each financial year, to provide additional details in a “monitoring return”, which is voluntary.
These statistics cover the period April to September 2020 (that is, the first half of the financial year 2020 to 2021). This means that the findings are likely to be affected by the COVID-19 pandemic. The findings are based on monitoring returns from 264 out of 336 LAs.
3. How much of their DHP funding did Local Authorities spend?
Halfway through 2020 to 2021, the LAs who provided information had spent £61m on DHPs. This represented 112,923 awards made to claimants. Just over half (53%) of DHP awards were made to Universal Credit claimants, in Local Authorities that gave details of the benefit claimed by DHP recipients.
The Local Authorities who provided information had spent 40% of their combined allocations for this financial year. This figure was similar both for English (40%) and Welsh (38%) LAs. It compares to 49% at the same point in 2019/20.
However, Local Authorities varied in the proportion of their DHP allocation that they had spent. Over a quarter (29%) of the LAs who responded had spent less than three-tenths of their allocation, while one in nine (11%) had spent over half of their allocation. One LA had spent more than its financial allocation for the year. This pattern of spending is similar to that from 2019 to 2020, although the peak in 2019 to 2020 was in the band between 40 to 50%.
Over a quarter of LAs spent less than three-tenths of their allocation, while one in nine spent over half of their allocation.

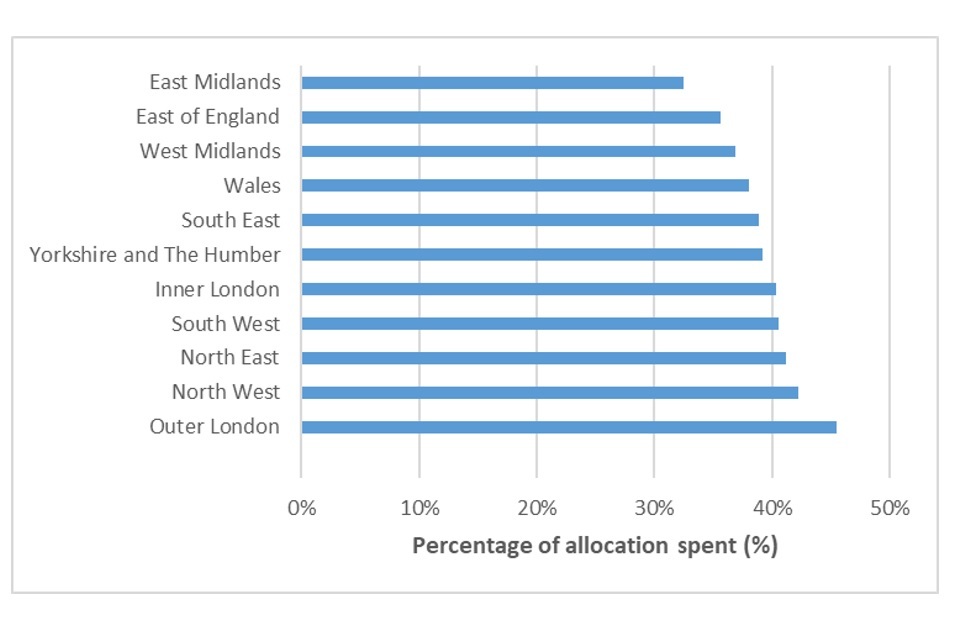
There was some variation by region, with LAs in Outer London spending the greatest proportion of their combined allocations (46%) and LAs in the East Midlands spending the least (32%). In 2019, there was also variation by region: North West spent the highest proportion of their allocation (58%) and East of England spent the least (42%).
There was some variation in expenditure by region, with percentage of allocation spent ranging from 32% up to 46%.
4. How much was spent on each welfare reform
About two-thirds (65%) of DHP expenditure was related to welfare reforms. Of the individual welfare reforms, RSRS was responsible for the largest proportion of DHP expenditure (26%), followed by the Benefit Cap (18%) and LHA reforms (15%).
Just over a third (35%) of DHP expenditure was unrelated to welfare reforms.
Around two-thirds of DHP expenditure was related to welfare reforms.

5. What DHPs were awarded for
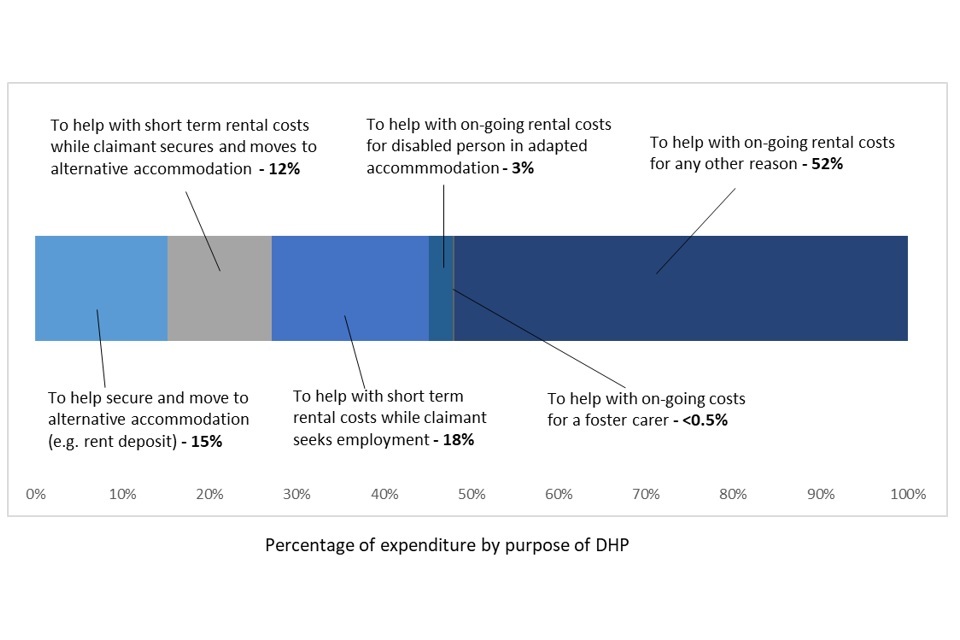
Over a quarter (27%) of DHP expenditure was related to moving to alternative accommodation. 18% was to help with short-term rental costs while the claimant sought employment, while 3% went towards costs for disabled people in adapted accommodation.
Around half (52%) of DHP expenditure was given to help with ongoing rental costs, for a reason unrelated to the above.
Around half of DHP expenditure was given to help with ongoing rental costs, and over a quarter of expenditure was related to moving to alternative accommodation.
6. More information
Table 1 shows how government funding has changed since 2011, when welfare reforms began to be introduced.
As the table shows, funding for DHPs has historically been split into four streams (Core, Local Housing Allowance, RSRS and Benefit Cap) for DWP’s calculation purposes, although LAs are not required to take account of these streams in allocating their funding.
Table 1: DHP government funding (£ million)
| DHPs | 2011/12 (Great Britain) | 2012/13 (Great Britain) | 2013/14 (Great Britain) | 2014/15 (Great Britain) | 2015/16 (Great Britain) | 2016/17 (Great Britain) | 2017/18 (England & Wales) | 2018/19 (England & Wales) | 2019/20 (England & Wales) | 2020/21 (England & Wales) |
|---|---|---|---|---|---|---|---|---|---|---|
| Core | 20 | 20 | 20 | 20 | 15 | 20 | 18 | 18 | 18 | 18 |
| Local Housing Allowance | 10 | 40 | 40 | 40 | 25 | 30 | 27 | 27 | 27 | 67 |
| RSRS | - | - | 55 | 60 | 60 | 60 | 54 | 54 | 40.5 | 40.5 |
| Benefit cap | - | - | 65 | 45 | 25 | 40 | 67.5 | 54 | 54 | 54 |
| Total | 30 | 60 | 180 | 165 | 125 | 150 | 166.5 | 153 | 139.5 | 179.5 |
| Additional over Core | 10 | 40 | 160 | 145 | 110 | 130 | 148.5 | 135 | 121.5 | 161.5 |
These Official Statistics are released biannually. This current statistical release presents a summary of the mid-year monitoring returns that cover the first half of the financial year from April 2020 to September 2020. Monitoring returns contain details of Local Authority expenditure on DHPs, including a further breakdown by reform and intended purpose of DHP. They are voluntary, so not all LAs complete them and not all of them supply all the information requested. More information about the monitoring returns can be found in the ‘Background information and methodology’ document published alongside this release.
The next release in this series will be based on end-of-year monitoring and financial returns covering April 2020 to March 2021.
These statistics have not been assessed by the UK Statistics Authority, and have not been designated as National Statistics.
7. Where to find out more
These statistics are released as part of a series of Discretionary Housing Payment statistics.
Read more about Discretionary Housing Payments, including how to claim them.
8. Contact information
Responsible Analyst: Graham Walmsley
Email: graham.walmsley1@dwp.gov.uk
Author: Isaac Holliday
Email: isaac.holliday@dwp.gov.uk
DWP Press Office: 0203 267 5144
Comments? Feedback is welcome
Next edition July 2021