Universal Credit Low Income statistics, May 2025 to May 2026
Published 17 November 2026

© Crown copyright 2026
This publication is licensed under the terms of the Open Government Licence v3.0 except where otherwise stated. To view this licence, visit nationalarchives.gov.uk/doc/open-government-licence/version/3 or write to the Information Policy Team, The National Archives, Kew, London TW9 4DU, or email: psi@nationalarchives.gov.uk.
Where we have identified any third party copyright information you will need to obtain permission from the copyright holders concerned.
This publication is available at https://www.gov.uk/government/statistics/universal-credit-low-income-ucli-statistics-may-2026/universal-credit-low-income-statistics-may-2025-to-may-2026--2
The Universal Credit Low Income (UCLI) statistics are new, quarterly statistics labelled as official statistics in development. They will be published each February, May, August and November alongside the Universal Credit (UC) Official Statistics. These latest statistics cover each quarter from May 2025 to May 2026.
The Households Below Average Income (HBAI) statistics provide the official poverty estimates for the UK and the Children in Low Income Families (CiLIF) statistics provide child poverty rates at sub-national level. Overall child poverty rates are higher in HBAI and CiLIF than UCLI as they also include children in low income who are living in families not receiving UC. Please see Section 2 for more detailed guidance on when to use the various statistics.
The UCLI statistics show numbers and proportions of children and adults in families in Great Britain who are receiving UC and who live in a family with income below 60% of the UK median income. They provide low income numbers and rates for people receiving UC as follows:
- numbers of individuals (broken down into children and adults) in families receiving UC who are in low income
- percentage of individuals (broken down into children and adults) in families receiving UC who are in low income
- under-16s in families receiving UC and who are in low income expressed as a percentage of all under-16s
The first percentage measure shows the proportion of people in families receiving UC who are in low income. This measure is reported for all individuals, all adults, all dependent children and all dependent children under the age of 16.
The second percentage measure shows the proportion of the overall population who are both in low income and in families receiving UC. This measure is only reported for children under the age of 16.
The second measure places low income among UC recipients in the context of the wider population and will typically be lower because it uses all under-16s in the population as the denominator. Users should ensure they are comparing like-for-like measures when interpreting trends and differences between areas.
Example: if an area has 1,000 under-16s in families receiving UC and 500 are in low income, the first measure is 50% (500/1,000). If the area has 2,500 under-16s overall, the second measure is 20% (500/2,500).
Since there are individuals in low income who live in families not receiving UC, neither of these UCLI percentages are overall poverty rates.
The poverty lines come from Households Below Average Income (HBAI), the UK’s primary source of income and poverty data, with the poverty lines for financial year ending (FYE) 2025 uprated to the quarters required for UCLI. The absolute poverty line is projected forward using the Consumer Prices Index (CPI) so that it continues to be 60% of the FYE 2025 median uprated for inflation. The relative poverty line is projected forward using a measure of average earnings growth (average earnings excluding bonuses and arrears, smoothed over a 3-month period). Historically, median income and hence the relative poverty line has tended to increase broadly in line with earnings.
For the May 2026 UCLI figures, the absolute After Housing Costs (AHC) poverty line for the UK was estimated to be £395 pw (£1,715 per month) and the relative AHC poverty line £400 pw (£1,737 per month).
The figures cover Great Britain and are broken down by country, region, local authority and Westminster parliamentary constituency.
Whilst still official statistics, the UCLI statistics are undergoing further development in the following areas:
-
Imputation of housing costs (mortgage interest payments) for families who are owner-occupiers. Currently, no housing costs are attributed to such families. See the Background Information and Methodology (BIM) report for more details.
-
Improvements to geo-coding to reduce the number of cases with an ‘Unknown’ region, local authority or Westminster parliamentary constituency identifier.
-
Extension to lower-level geographies, particularly wards and neighbourhood areas (Census lower super output areas and data zones), and aggregation of local authority figures into combined authorities.
-
Development of annual revisions process following release of the annual HBAI statistics which will provide the latest official poverty lines for the UK. See the BIM report for more details.
We welcome feedback on these new statistics, including how this data may be used to inform your work. Please contact us via email: stats.consultation-2018@dwp.gov.uk.
1. Main stories
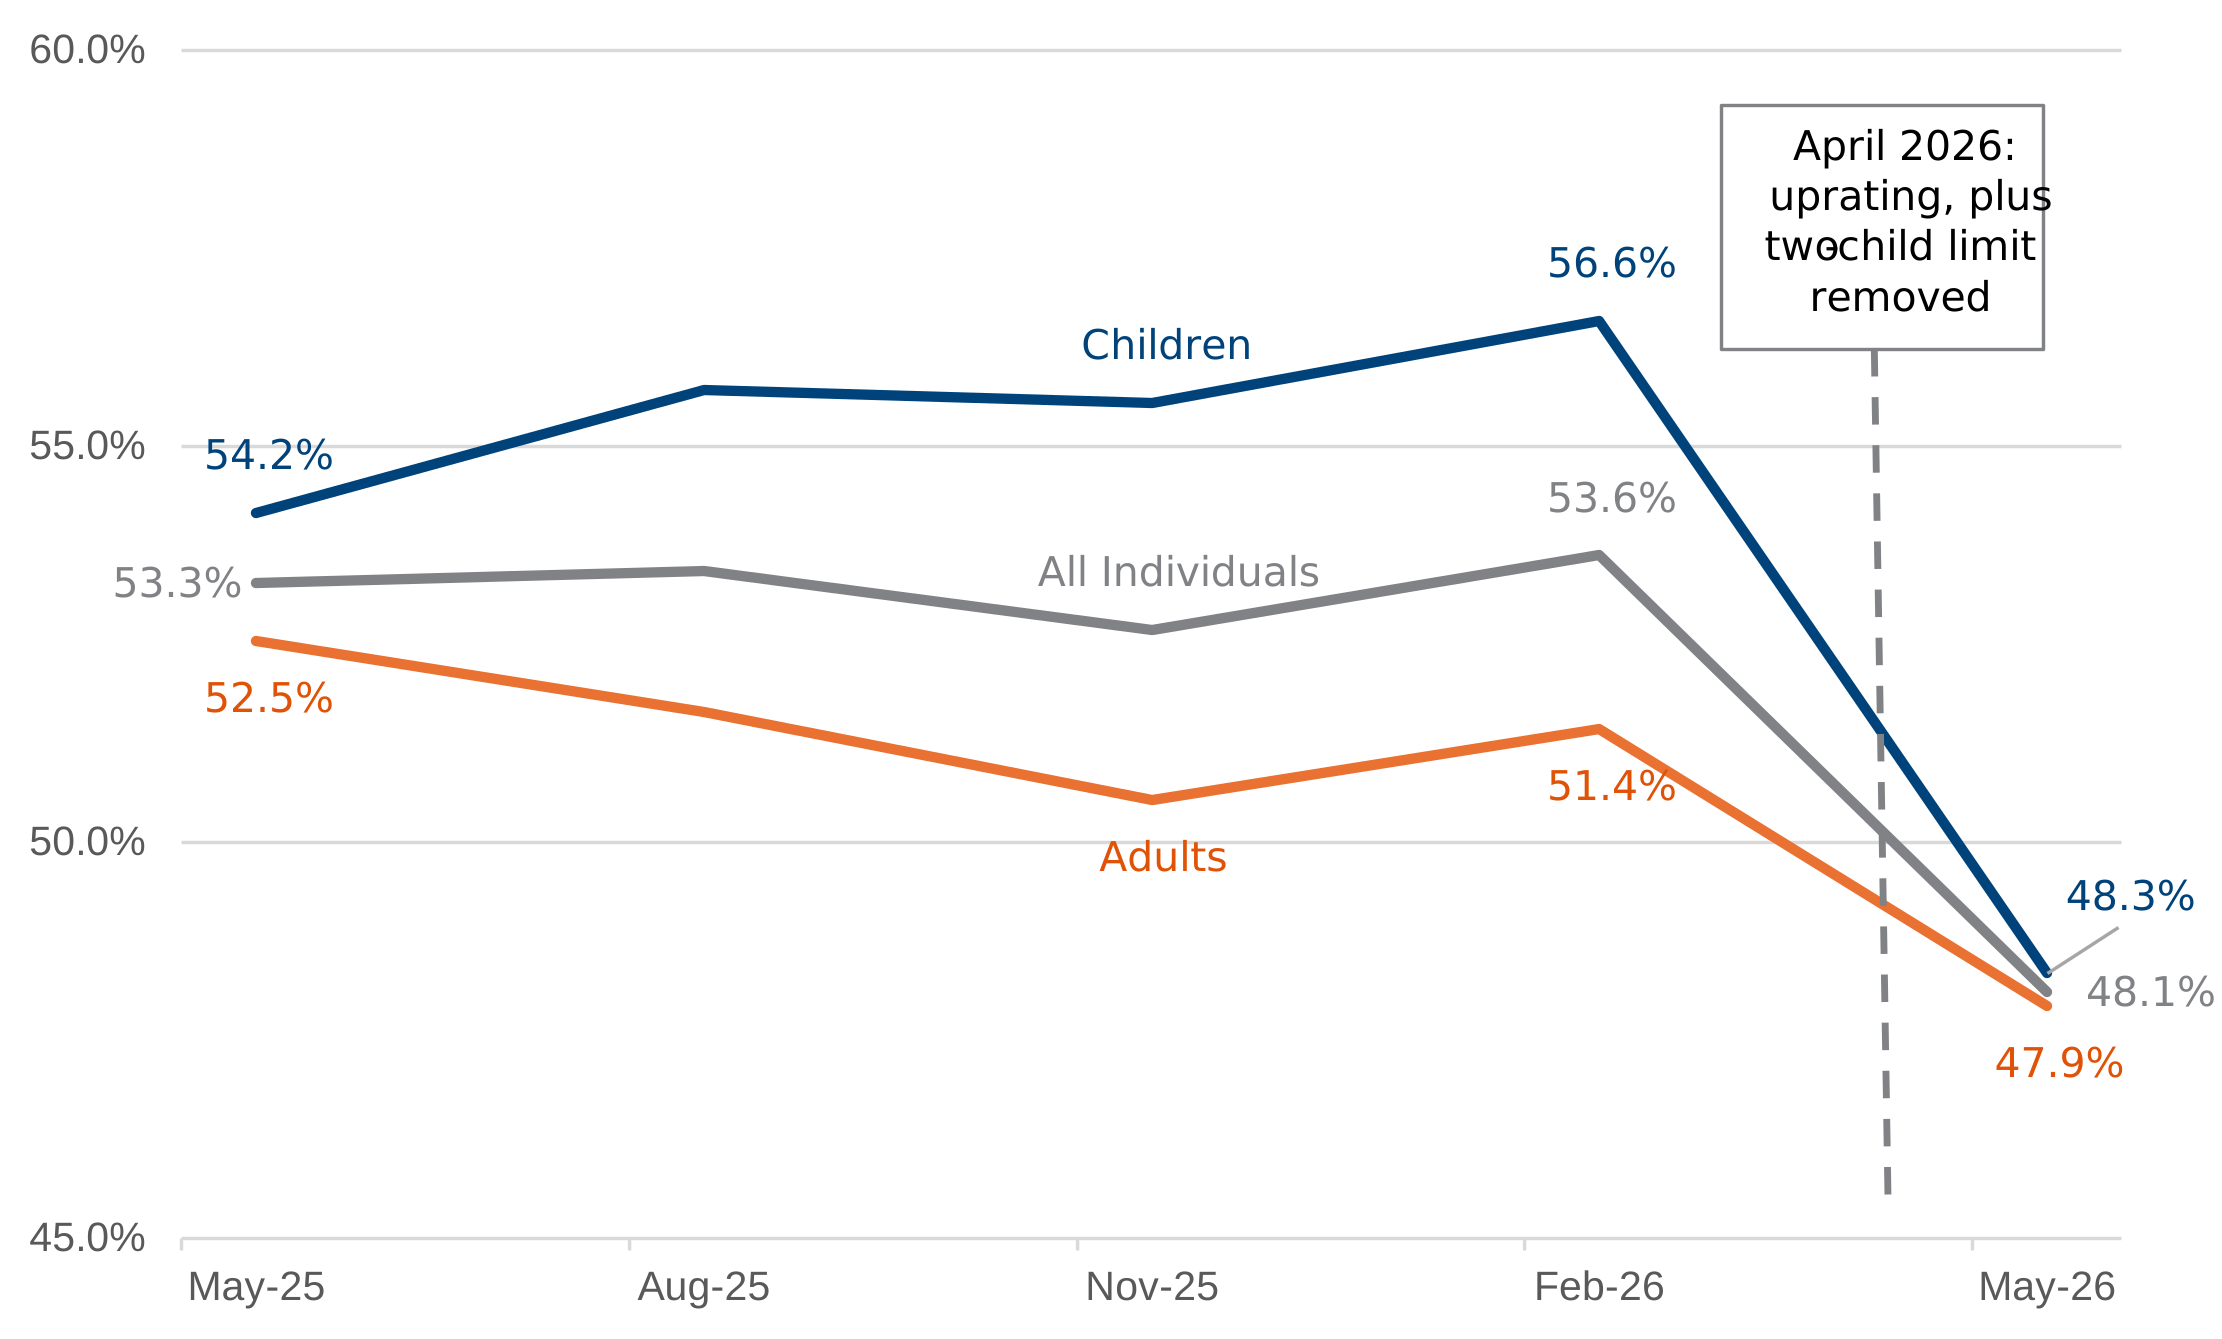
Chart 1: A smaller proportion of UC claimants are in relative low income AHC in May 2026 than in previous quarters
Proportion of UC claimants in relative low income in Great Britain, May 2025 to May 2026.
-
The number of people in families receiving UC who are also in relative low income AHC increased slightly between May 2025 (7 million individuals; 53.3% of all UC recipients) and February 2026 (7.3 million individuals; 53.6% of all UC recipients). This increase was largely due to the final stages of the Move to UC programme increasing the total number of families receiving UC rather than a change in the risk of families receiving UC being in low income.
-
The proportion of people in families receiving UC who are in relative low income AHC decreased markedly from 53.6% (7.3 million individuals) in February 2026 to 48.1% (6.6 million individuals) in May 2026. For adults, the rate decreased from 51.4% to 47.9% between February and May 2026 whilst for children it decreased even more markedly, from 56.6% to 48.3%. This decrease coincides with the removal of the 2-child limit on top of annual uprating (which included an above-inflation increase to the UC standard allowance) in April 2026. Further information is available in a DWP ad hoc statistics publication which isolates the immediate impact of the removal of the 2-child limit.
Chart 2: A smaller proportion of under-16s in families receiving UC were in relative low income AHC in May 2026 than in previous quarters
Proportion of under-16s in families receiving UC and in relative low income, May 2025 to May 2026.
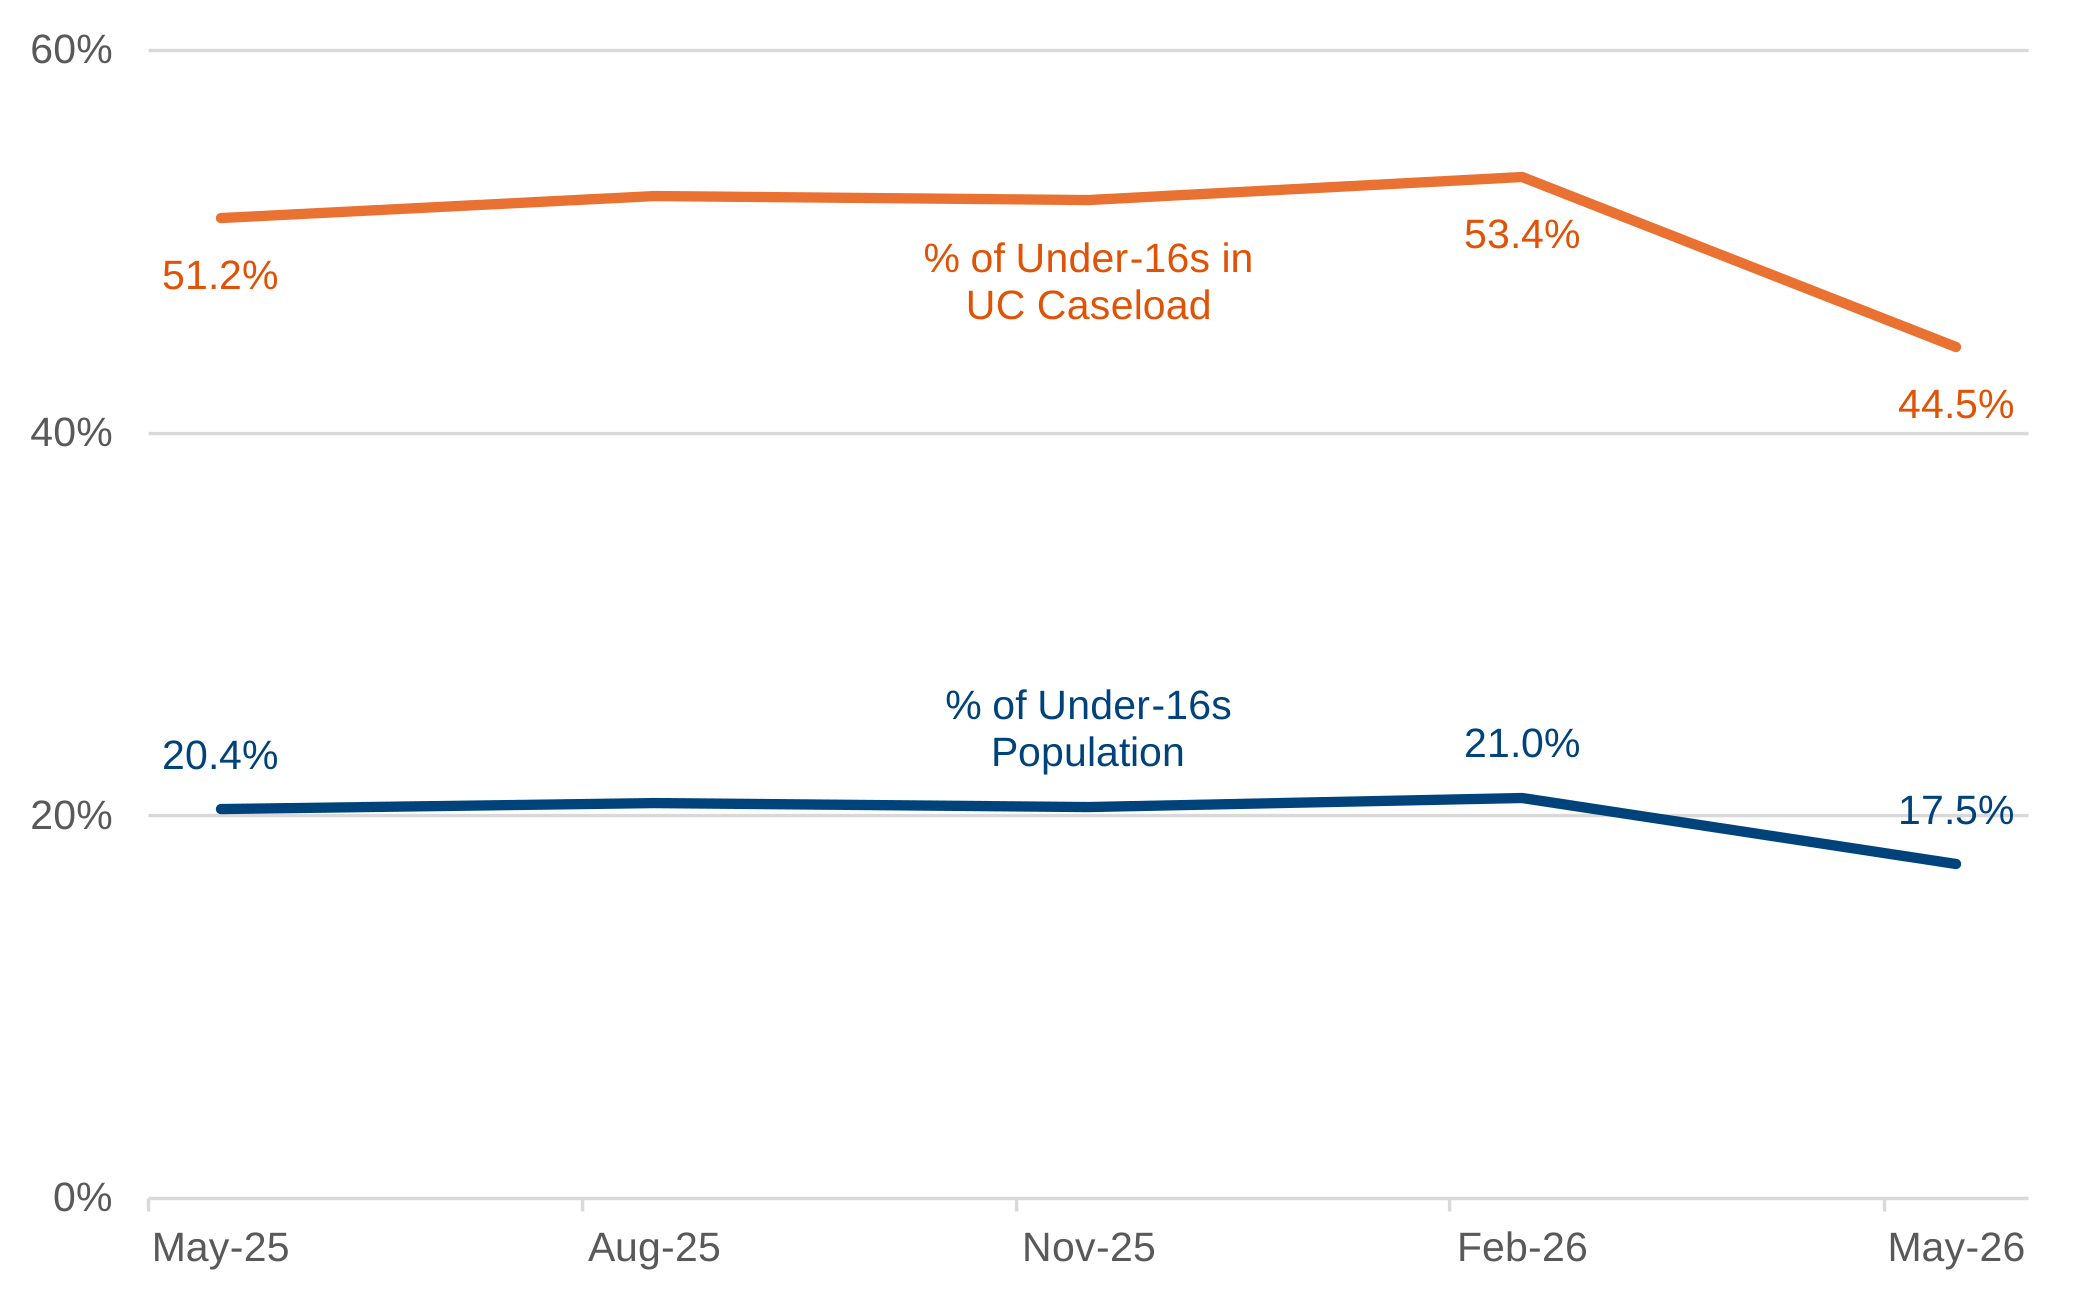
- In May 2025, 20.4% of all under-16s in Great Britain were in families receiving UC and were also in relative low income AHC. This rose to 21.0% in February 2026 before falling to 17.5% in May 2026. As above, this fall coincides with the removal of the 2-child limit on top of annual uprating (which included an above-inflation increase to the UC standard allowance).
- Absolute low income AHC numbers and rates were very slightly lower than their equivalent relative low income equivalents between May 2025 and May 2026. This is because the absolute poverty line was the same as the relative poverty line for FYE 2025 (60% of the UK household median) and was only very slightly lower for the period May 2025 to May 2026.
2. What you need to know
The UCLI statistics are new quarterly statistics in development.
Why have these statistics been developed?
The existing primary DWP statistics providing numbers in low income and rates of low income are:
Households Below Average Income (HBAI) – statistics on the number and percentage of people living in low-income households in the UK. They provide annual figures back to FYE 1995 and are produced from Family Resources Survey (FRS) data. They provide the official measures of poverty for the UK government, including the headline metrics used to measure the progress of the Child Poverty Strategy.
Children in Low Income Families (CiLIF) – statistics on the number and proportion of children living in low-income families for local areas of the UK. They provide annual figures back to FYE 2022. Figures are calibrated to HBAI survey estimates but provide more granular local area data using ‘RAPID’ (Registration and Population Interaction Database) administrative data.
The UCLI statistics are not intended to replace the HBAI and CiLIF statistics, whether in the short or long-term. Rather, they are intended to complement them and add further value, particularly in regard to families receiving UC and regarding the timeliness and frequency of the low income data available. This is summarised in the following table.
Table 1: Main characteristics of HBAI, CiLIF and UCLI statistics
| HBAI | CiLIF | UCLI | |
|---|---|---|---|
| Designation | Accredited Official Statistics | Official Statistics | Official Statistics in Development |
| Data source | Survey data (FRS), with administrative data-linking to improve accuracy of benefit data | Administrative data (RAPID), calibrated to HBAI total numbers of children in low income | Administrative data for UC claimants |
| Covers children? | Yes | Yes | Yes, where in families receiving UC |
| Covers working age adults? | Yes | No | Yes, where in families receiving UC |
| Covers pensioners? | Yes | No | No |
| National and regional coverage | UK | UK | Great Britain |
| National and regional coverage | England/Scotland/Wales/Northern Ireland, English regions (3-year averages provided below UK level) | England/Scotland/Wales/Northern Ireland, English regions | E/S/W, English regions |
| Local area coverage | National and regional only | Local authorities and parliamentary constituencies and lower-level geographies | Local authorities and parliamentary constituencies |
| Frequency | Annual (covering a financial year) | Annual (covering a financial year) | Quarterly (covering a point in time, that is each February, May, August and November) |
| Timeliness of publication | 12 months after end of reference period for example FYE 2027 figures (covering April 2026 to March 2027 period) will be published in March 2028 | 12 months after end of reference period for example FYE 2027 figures (covering April 2026 to March 2027 period) will be published in March 2028 | 6 months after reference period for example May 2026 figures published in November 2026 |
The main reasons for developing the UCLI statistics are therefore:
- Frequency and timeliness. For example, to understand what is happening in early FYE 2027, the relevant HBAI and CiLIF statistics (FYE 2027) will be published in March 2028. In the meantime, UCLI statistics for May 2026 will be published in November 2026 and then quarterly thereafter. This enables earlier monitoring of trends and policy impacts and, similarly, should also facilitate more responsive policy development.
- Local area coverage. As with CiLIF, the UCLI statistics will provide figures for local authorities and Westminster parliamentary constituencies, with the intention to extend this to lower-level geographies. Given these statistics will also be available sooner and more frequently than CiLIF (see frequency and timeliness section above), it is this combination of timeliness, frequency and local area coverage that gives the UCLI statistics their unique value. This may particularly assist devolved governments, combined authorities and local authorities in understanding policy impacts and developing new policies for their areas.
- Trend analysis. Although each quarterly release is a cross-sectional snapshot of UC recipients at that point in time, it covers all UC cases rather than a sample. This means changes between periods can be easily explained by following the large number of cases who are in receipt of UC from one period to the next. In contrast, this is not possible with outputs produced from cross-sectional surveys which pick up different cases from one period to the next.
Guidance on use
The main strengths of these statistics are:
- the timeliness, frequency and local-level granularity of the data compared with survey-based estimates
- the absence of sampling variation from one period to the next
This means that the data can be used to compare trends in low income for local areas over recent quarters, as well as make timely comparisons between local areas.
The main limitations are that the UCLI statistics:
- only cover families receiving UC
- do not currently fully capture all income sources and housing costs
- measure income at the benefit unit rather than household level
This means that they are not as comprehensive as the HBAI statistics, and are not directly comparable with HBAI levels.
The table below summarises data availability in respect of HBAI, CiLIF and UCLI.
Table 2: Geographic and other breakdowns available in HBAI, CiLIF and UCLI statistics.
| Demographic | HBAI | CiLIF | UCLI | |
|---|---|---|---|---|
| National and regional | Children | Yes (figures below UK level are 3-year averages) | Yes, but use HBAI | Yes, but only in respect of families receiving UC |
| National and regional | Working Age | Yes (figures below UK level are 3-year averages) | No | Yes, but only in respect of families receiving UC |
| National and regional | Pensioners | Yes (figures below UK level are 3-year averages) | No | No |
| Local authority and parliamentary constituency | Children | No | Yes | Yes, but only in respect of families receiving UC |
| Local authority and parliamentary constituency | Working Age | No | No | Yes, but only in respect of families receiving UC |
| Local authority and parliamentary constituency | Pensioners | No | No | No |
| Areas below local authority and parliamentary constituency for example wards and super output areas/ data zones | Children | No | Yes | Currently being developed for families receiving UC |
| Areas below local authority and parliamentary constituency for example wards and super output areas/ data zones | Working Age | No | No | Currently being developed for families receiving UC |
| Areas below local authority and parliamentary constituency for example wards and super output areas/ data zones | Pensioners | No | No | No |
| Breakdowns by age, family type, work status, disability, housing tenure | Children | Yes, at national and regional level | Limited range of breakdowns | No |
- HBAI should be used to provide national poverty estimates
- CiLIF should be used to provide child poverty estimates at sub-national level
- UCLI should be used to provide more frequent and timely indicators of levels and trends but cannot provide overall poverty rates because it does not cover children and adults in low income who are not in families receiving UC
Worked Example 1 - what is the child poverty rate in [insert area] for example Hartlepool local authority?
Figures below are according to the data available in the UCLI statistics published on 17 November 2026.
Suggested answer:
[HBAI statistics do not provide figures below region level].
- According to the latest CiLIF statistics, in FYE 2025, 31.9% of children aged under 16 living in Hartlepool were in relative low income AHC.
[UCLI statistics can be used to provide further context but not in place of the CiLIF statistics where overall child poverty rates or numbers are required].
- More recent UCLI statistics can also be used to provide an early indication of the latest trends in child poverty in an area, but because the number of children in poverty only reflects children whose families are receiving UC, they are not overall child poverty rates for the area and should not be used in place of HBAI or CiLIF rates. According to the latest UCLI statistics, in May 2026, 23.4% of children aged under-16 living in Hartlepool were in families receiving UC and in relative low income AHC. This is a fall from 28.1% in February 2026.
[The UCLI figures should be considered as providing early indicators of how child poverty rates are changing in an area, particularly in regard to families receiving UC. They may also be used to compare local areas at a point in time or indeed over time on a like-with-like basis. They are intended to complement rather than replace the HBAI and CiLIF statistics].
Worked Example 2 – is child poverty rising or falling in [insert area], for example Hartlepool local authority?
Suggested answer:
[HBAI statistics do not provide figures below region level]
- The most recent data covers children in families receiving UC and shows that, in May 2026, 23.4% of children aged under 16 living in Hartlepool were in families receiving UC and in relative low income AHC. This is a fall from 28.1% in February 2026.
- However, please note that the number of children in poverty only reflects children whose families are receiving UC, and therefore these percentages are not overall child poverty rates for the area.
- CiLIF statistics provide complete child poverty rates. The latest CiLIF statistics show that, in FYE 2025, 31.9% of children aged under 16 living in Hartlepool were in relative low income AHC. This is a fall from 33.8% in FYE 2024.
Data Source
Family incomes for UC claimants have been produced from UC administrative data. Claim details for each assessment period provide income from the UC award, employment, self-employment and other benefits where data is collected to assist in the calculation of the UC award, for example Adult Disability Payment (ADP), Disability Living Allowance (DLA) and Personal Independence Payment (PIP). Housing costs for renters and the demographic details of family members are also directly available. Income from additional benefits such as Child Benefit, Scottish Child Payment, Child Disability Payment (CDP) and Child Disability Living Allowance (Child DLA) is also imputed to provide a measure of family income after housing costs (AHC) covering most income sources and housing costs. Some income sources and costs are not fully captured. Gaps include income from child maintenance payments for separated families, discretionary support that may be paid out by local authorities (for example Discretionary Housing Payments or payments under the Crisis and Resilience Fund) and housing costs from mortgage interest payments (MIPs). Development work is ongoing to improve the statistics further.
Income measures
As noted above, family income is calculated on an AHC basis. Family income is then equivalised using the standard equivalisation factors also used for the Households Below Average Income (HBAI) and Children in Low Income Families (CiLIF) statistics in order to compare different family sizes and types. More details regarding equivalisation are available in the UCLI Background Information and Methodology report.
3. Numbers and proportions of Universal Credit claimants living in low income
Two distinct trends are evident in these UCLI statistics. First, between May 2025 and February 2026, the number of people in low income increased slightly as the UC caseload grew during the final stages of the Move to UC programme, while low-income rates remained broadly stable. Second, between February and May 2026, low-income rates and numbers fell markedly, coinciding with the removal of the 2-child limit and the April 2026 uprating of UC.
All Individuals
Chart 3: The number of people receiving UC increased during 2025. Low income rates then fell between February and May 2026
Numbers of individuals in families receiving UC who were in relative low income and not in relative low income AHC, with the number in relative low income as a proportion of all those receiving UC, Great Britain, May 2025 to May 2026
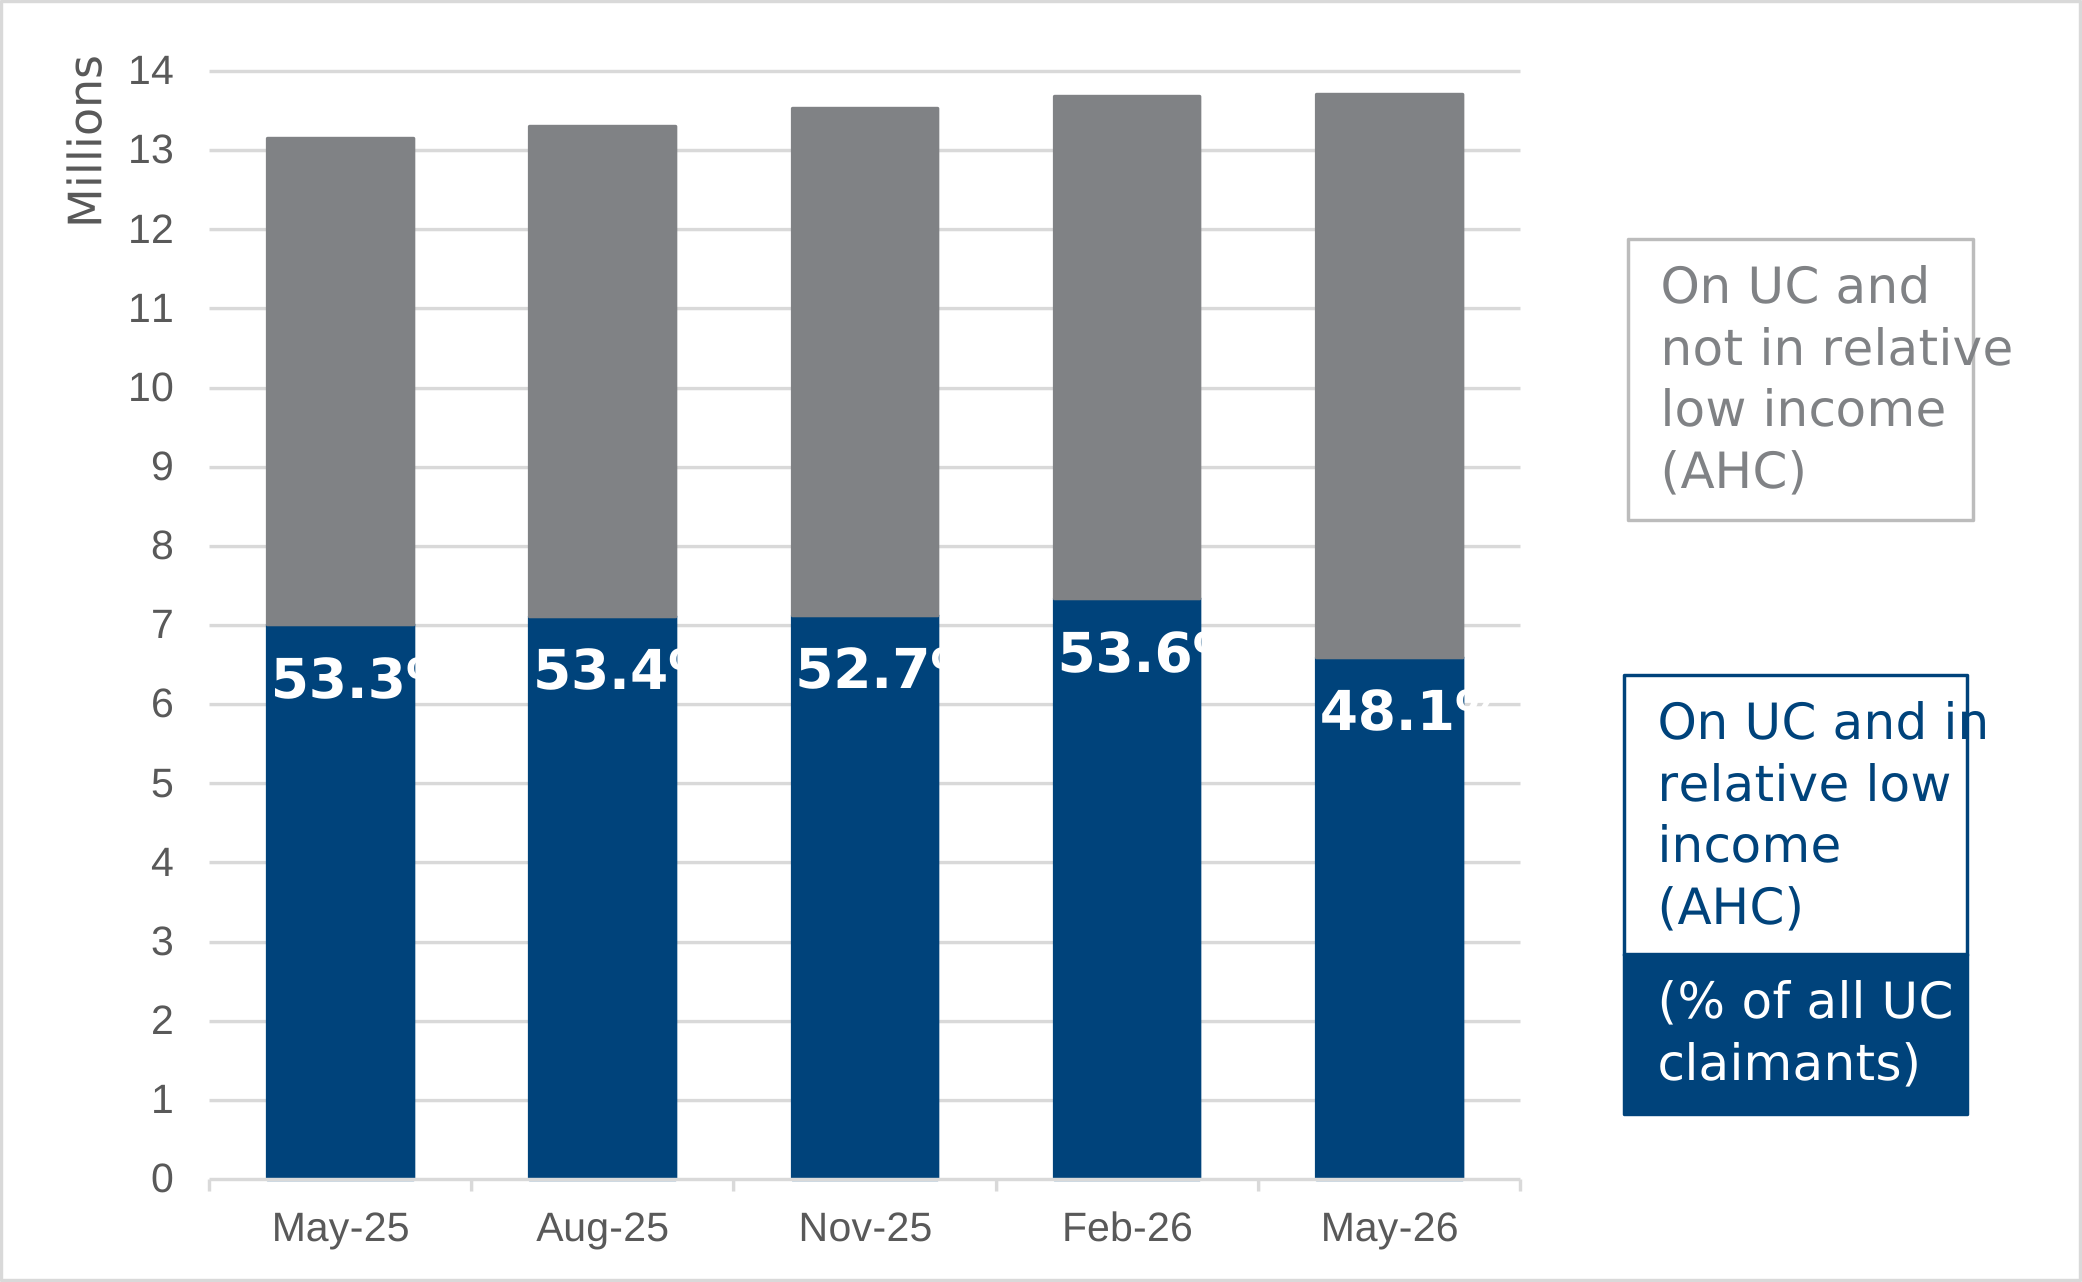
Between May 2025 and February 2026, the proportion of individuals in families receiving UC who were in relative low income AHC remained broadly stable, increasing slightly from 53.3% to 53.6%. Over the same period, the number of individuals in relative low income AHC increased from 7 million to 7.3 million, which coincided with the final stages of the Move to Universal Credit programme and the associated increase in caseload.
Between February and May 2026, low-income rates fell markedly. The relative low-income AHC rate fell from 53.6% to 48.1%, while the number of people in families receiving UC and who are in relative low income AHC fell from 7.3 million in February 2026 to 6.6 million in May 2026.
Adults
Chart 4: Adult low-income numbers rose slightly during UC rollout before falling in May 2026
Numbers of adults in families receiving UC who were in relative low income and not in relative low income AHC, with the number in relative low income as a proportion of all those receiving UC, Great Britain, May 2025 to May 2026.
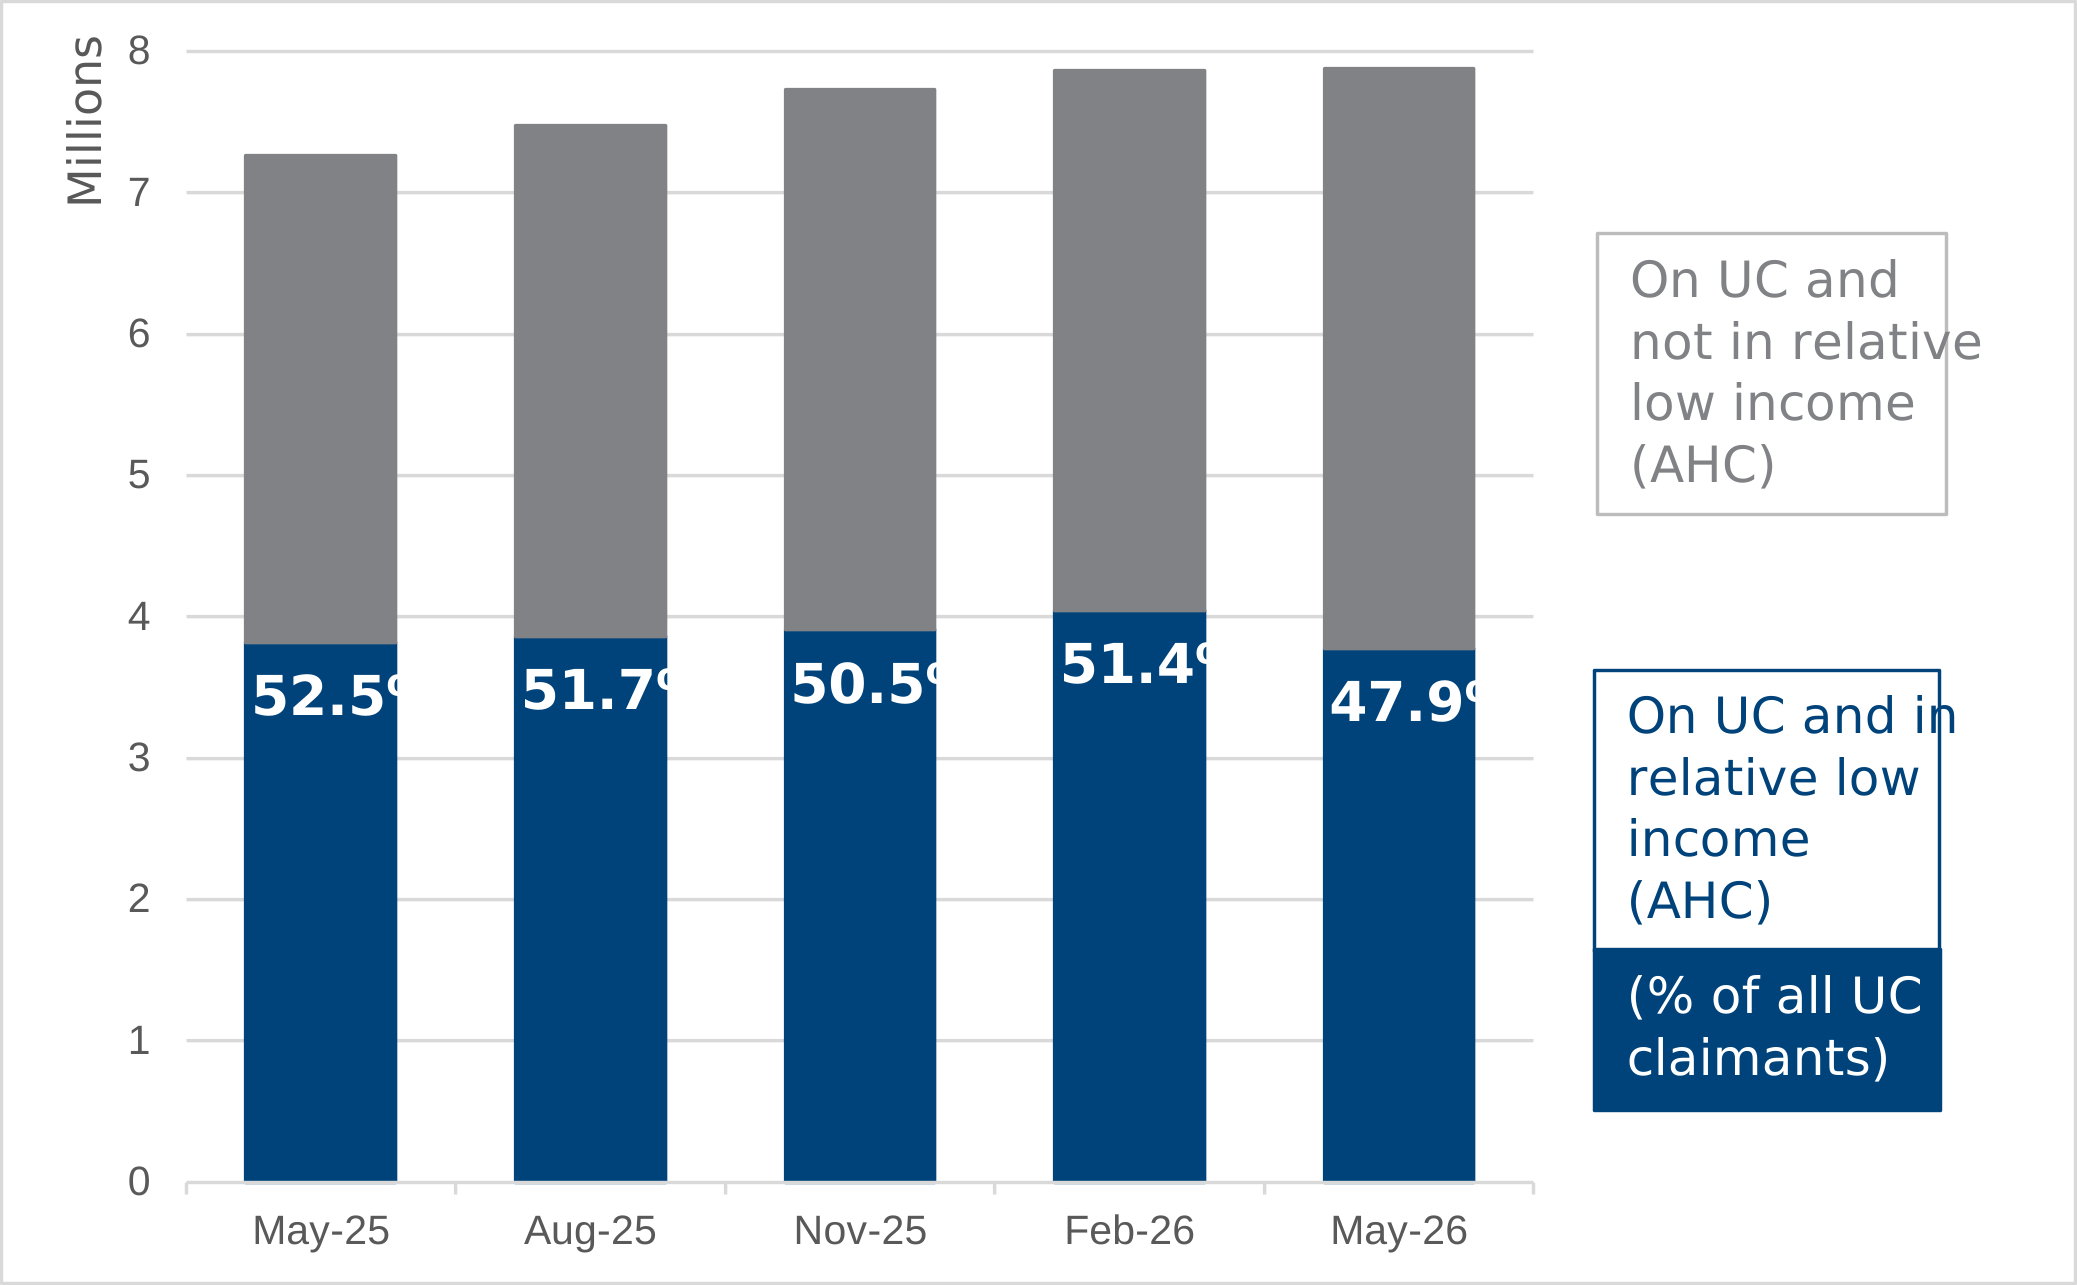
During 2025 and into early 2026, the number of people receiving UC increased as the final stages of the Move to Universal Credit programme brought more families onto UC; the increase was particularly pronounced for adults. Although the number of adults in families receiving UC and in relative low income increased slightly over this period, from 3.8 million to 4 million, the increase in the overall adult UC caseload was larger. As a result, the proportion of adults in families receiving UC who were in relative low income fell from 52.5% in May 2025 to 51.4% in February 2026. In other words, a lower proportion of the additional adults joining UC during the final stages of rollout were in relative low income when compared with the existing adult UC caseload, reducing the overall low-income rate among adult UC recipients.
For adults in families receiving UC, between February and May 2026, the proportion in relative AHC low income fell from 51.4% to 47.9%, whilst the number of adults in families receiving UC and in relative AHC low income fell by 300,000 to 3.8 million.
Children
Chart 5: Child low-income numbers were broadly stable before falling sharply in May 2026
Numbers of children in families receiving UC who were in relative low income and not in relative low income AHC, with the number in relative low income as a proportion of all those receiving UC, Great Britain, May 2025 to May 2026.
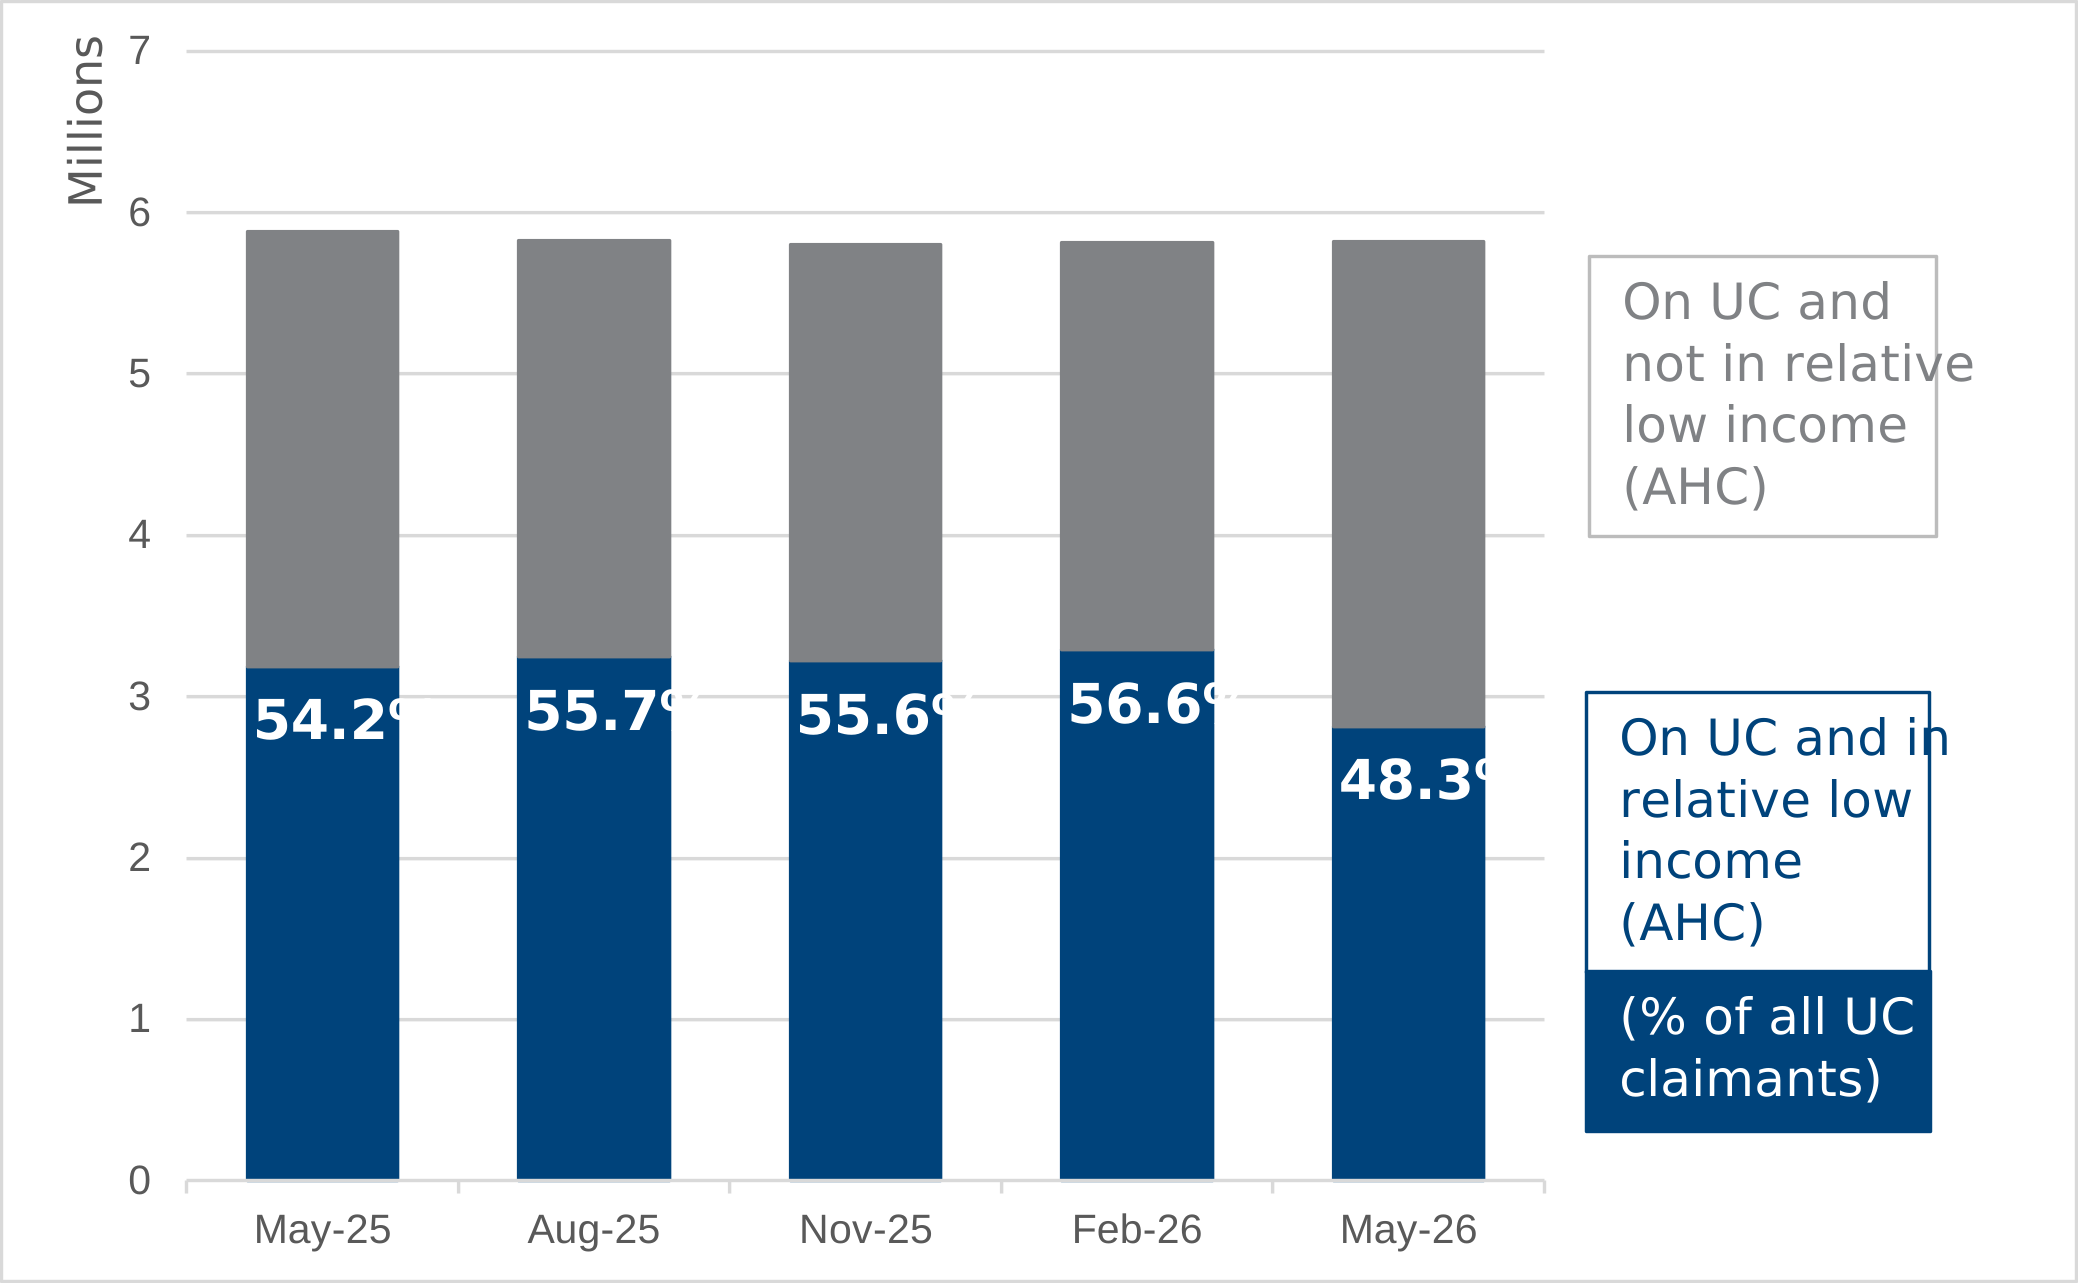
The number of children who were in families receiving UC changed relatively little between May 2025 and February 2026, while the proportion in relative low income increased from 54.2% to 56.6%.
For children in families receiving UC, between February and May 2026, the proportion in relative AHC low income fell from 56.6% to 48.3%. The number of children in families receiving UC and in relative AHC low income fell by 500,000 to 2.8 million. The greater reduction for children compared with adults coincides with the removal of the 2-child limit in April 2026 benefitting a greater number of children on UC than adults.
Under-16s
Chart 6: The proportion of under-16s in low income receiving UC fell in May 2026
Number of under-16s by UC receipt and relative low income status (AHC), with the number in relative low income as a proportion of the total population, Great Britain, May 2025 to May 2026.
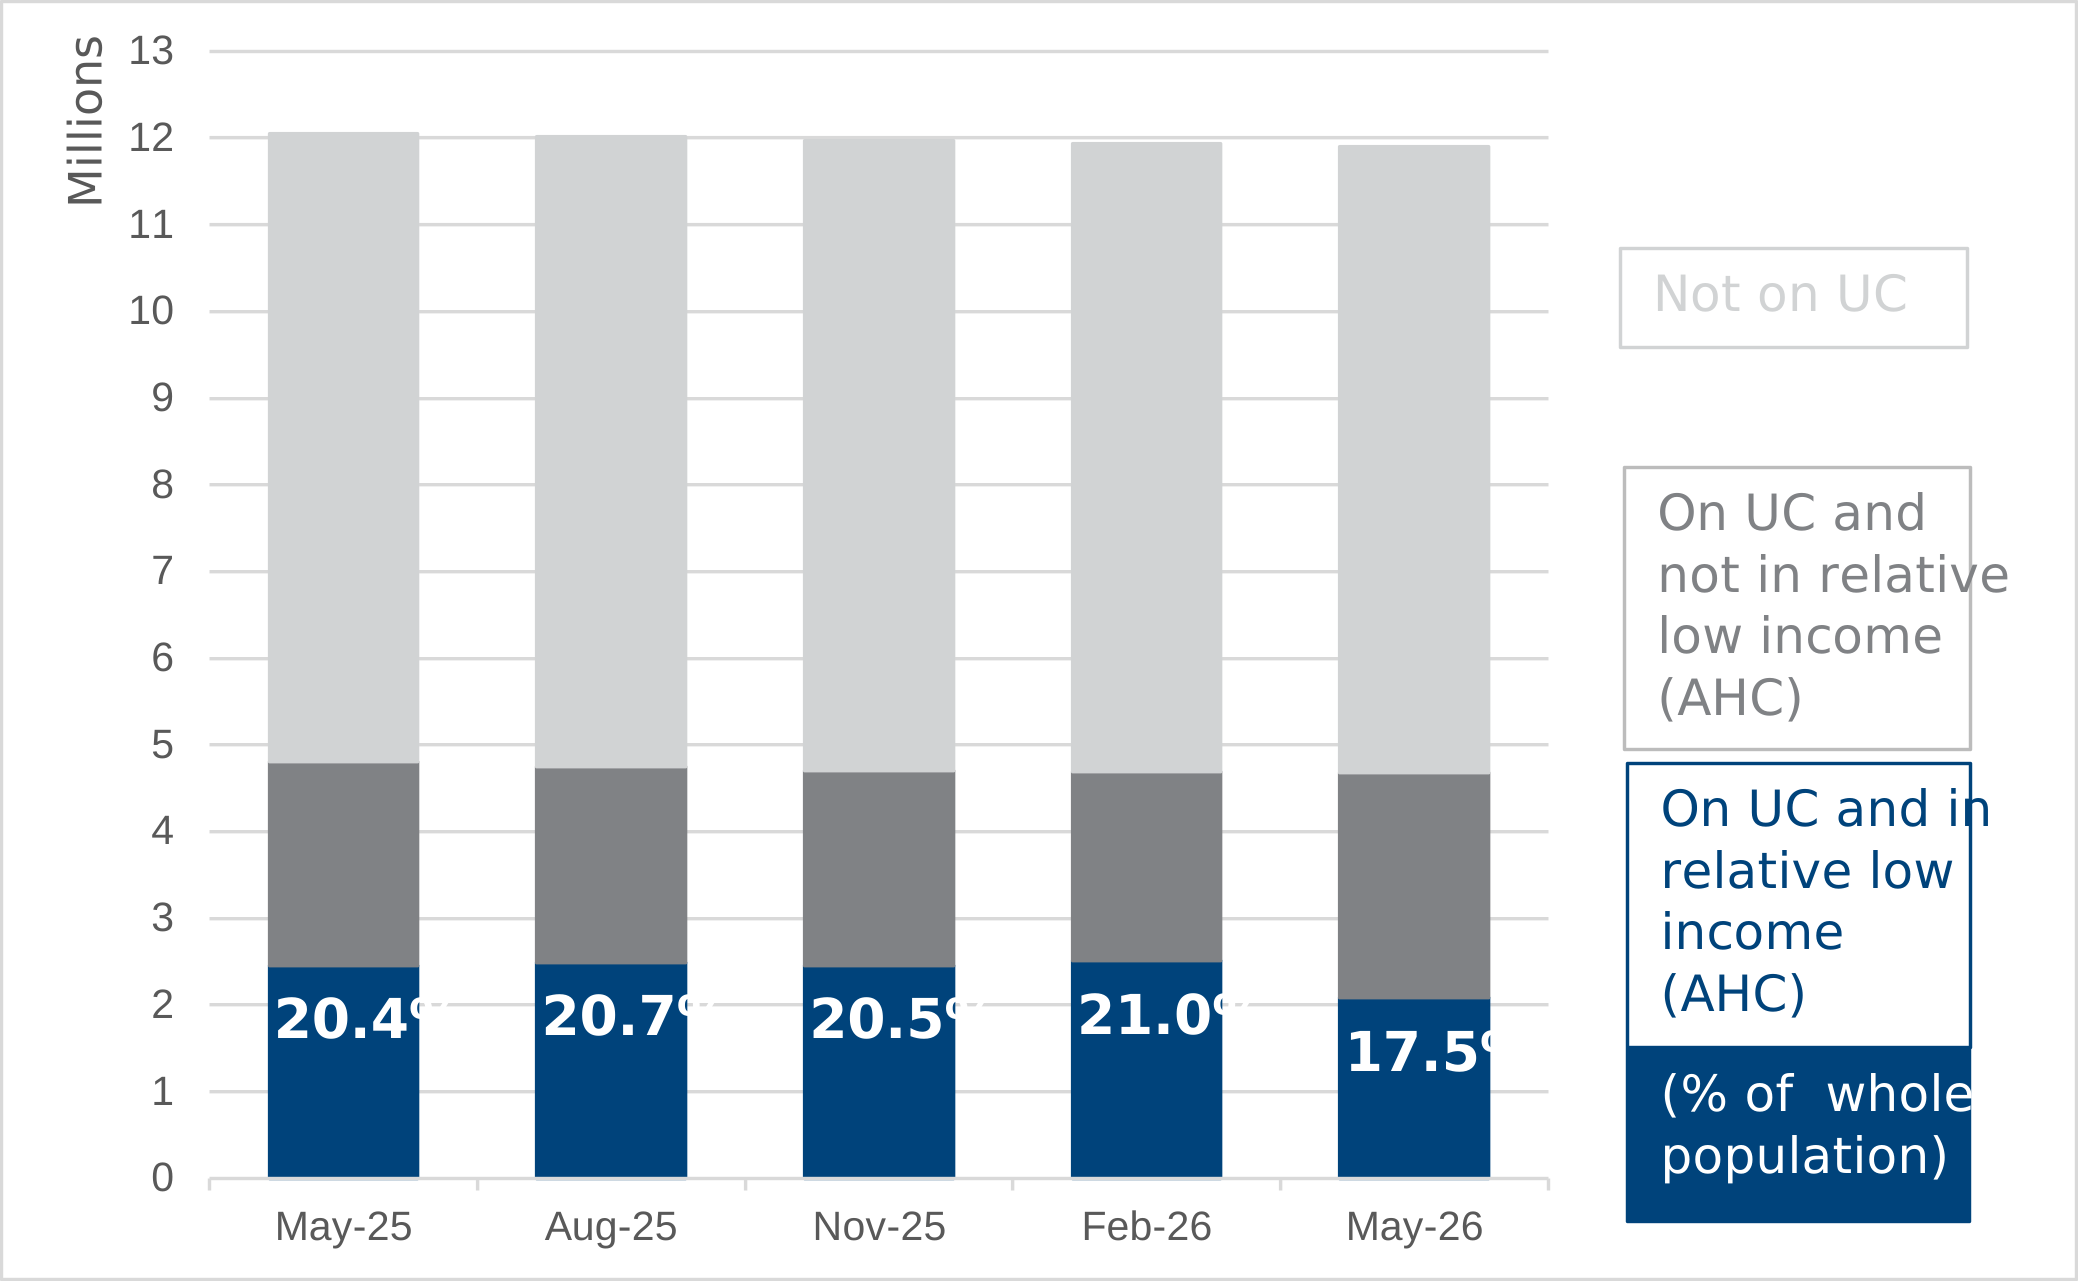
For children in families receiving UC who are in low income, numbers are also expressed as a percentage of all under-16s in the population. Whilst not all children in low income are in families receiving UC – therefore these percentages are not overall child poverty rates – these percentages place UC child low income volumes in their wider context.
In May 2026, 17.5% of under-16s in Great Britain were in families receiving UC and in relative AHC low income, a fall from 21.0% in February 2026. Again, this fall coincides with the removal of the 2-child limit in addition to the above-inflation uprating of the UC standard allowance in April 2026.
Absolute low income rates
Chart 7: Relative and absolute low income rates among UC claimants remained very similar between May 2025 and May 2026
Proportion of UC claimants in relative and absolute low income AHC in Great Britain, May 2025 to May 2026
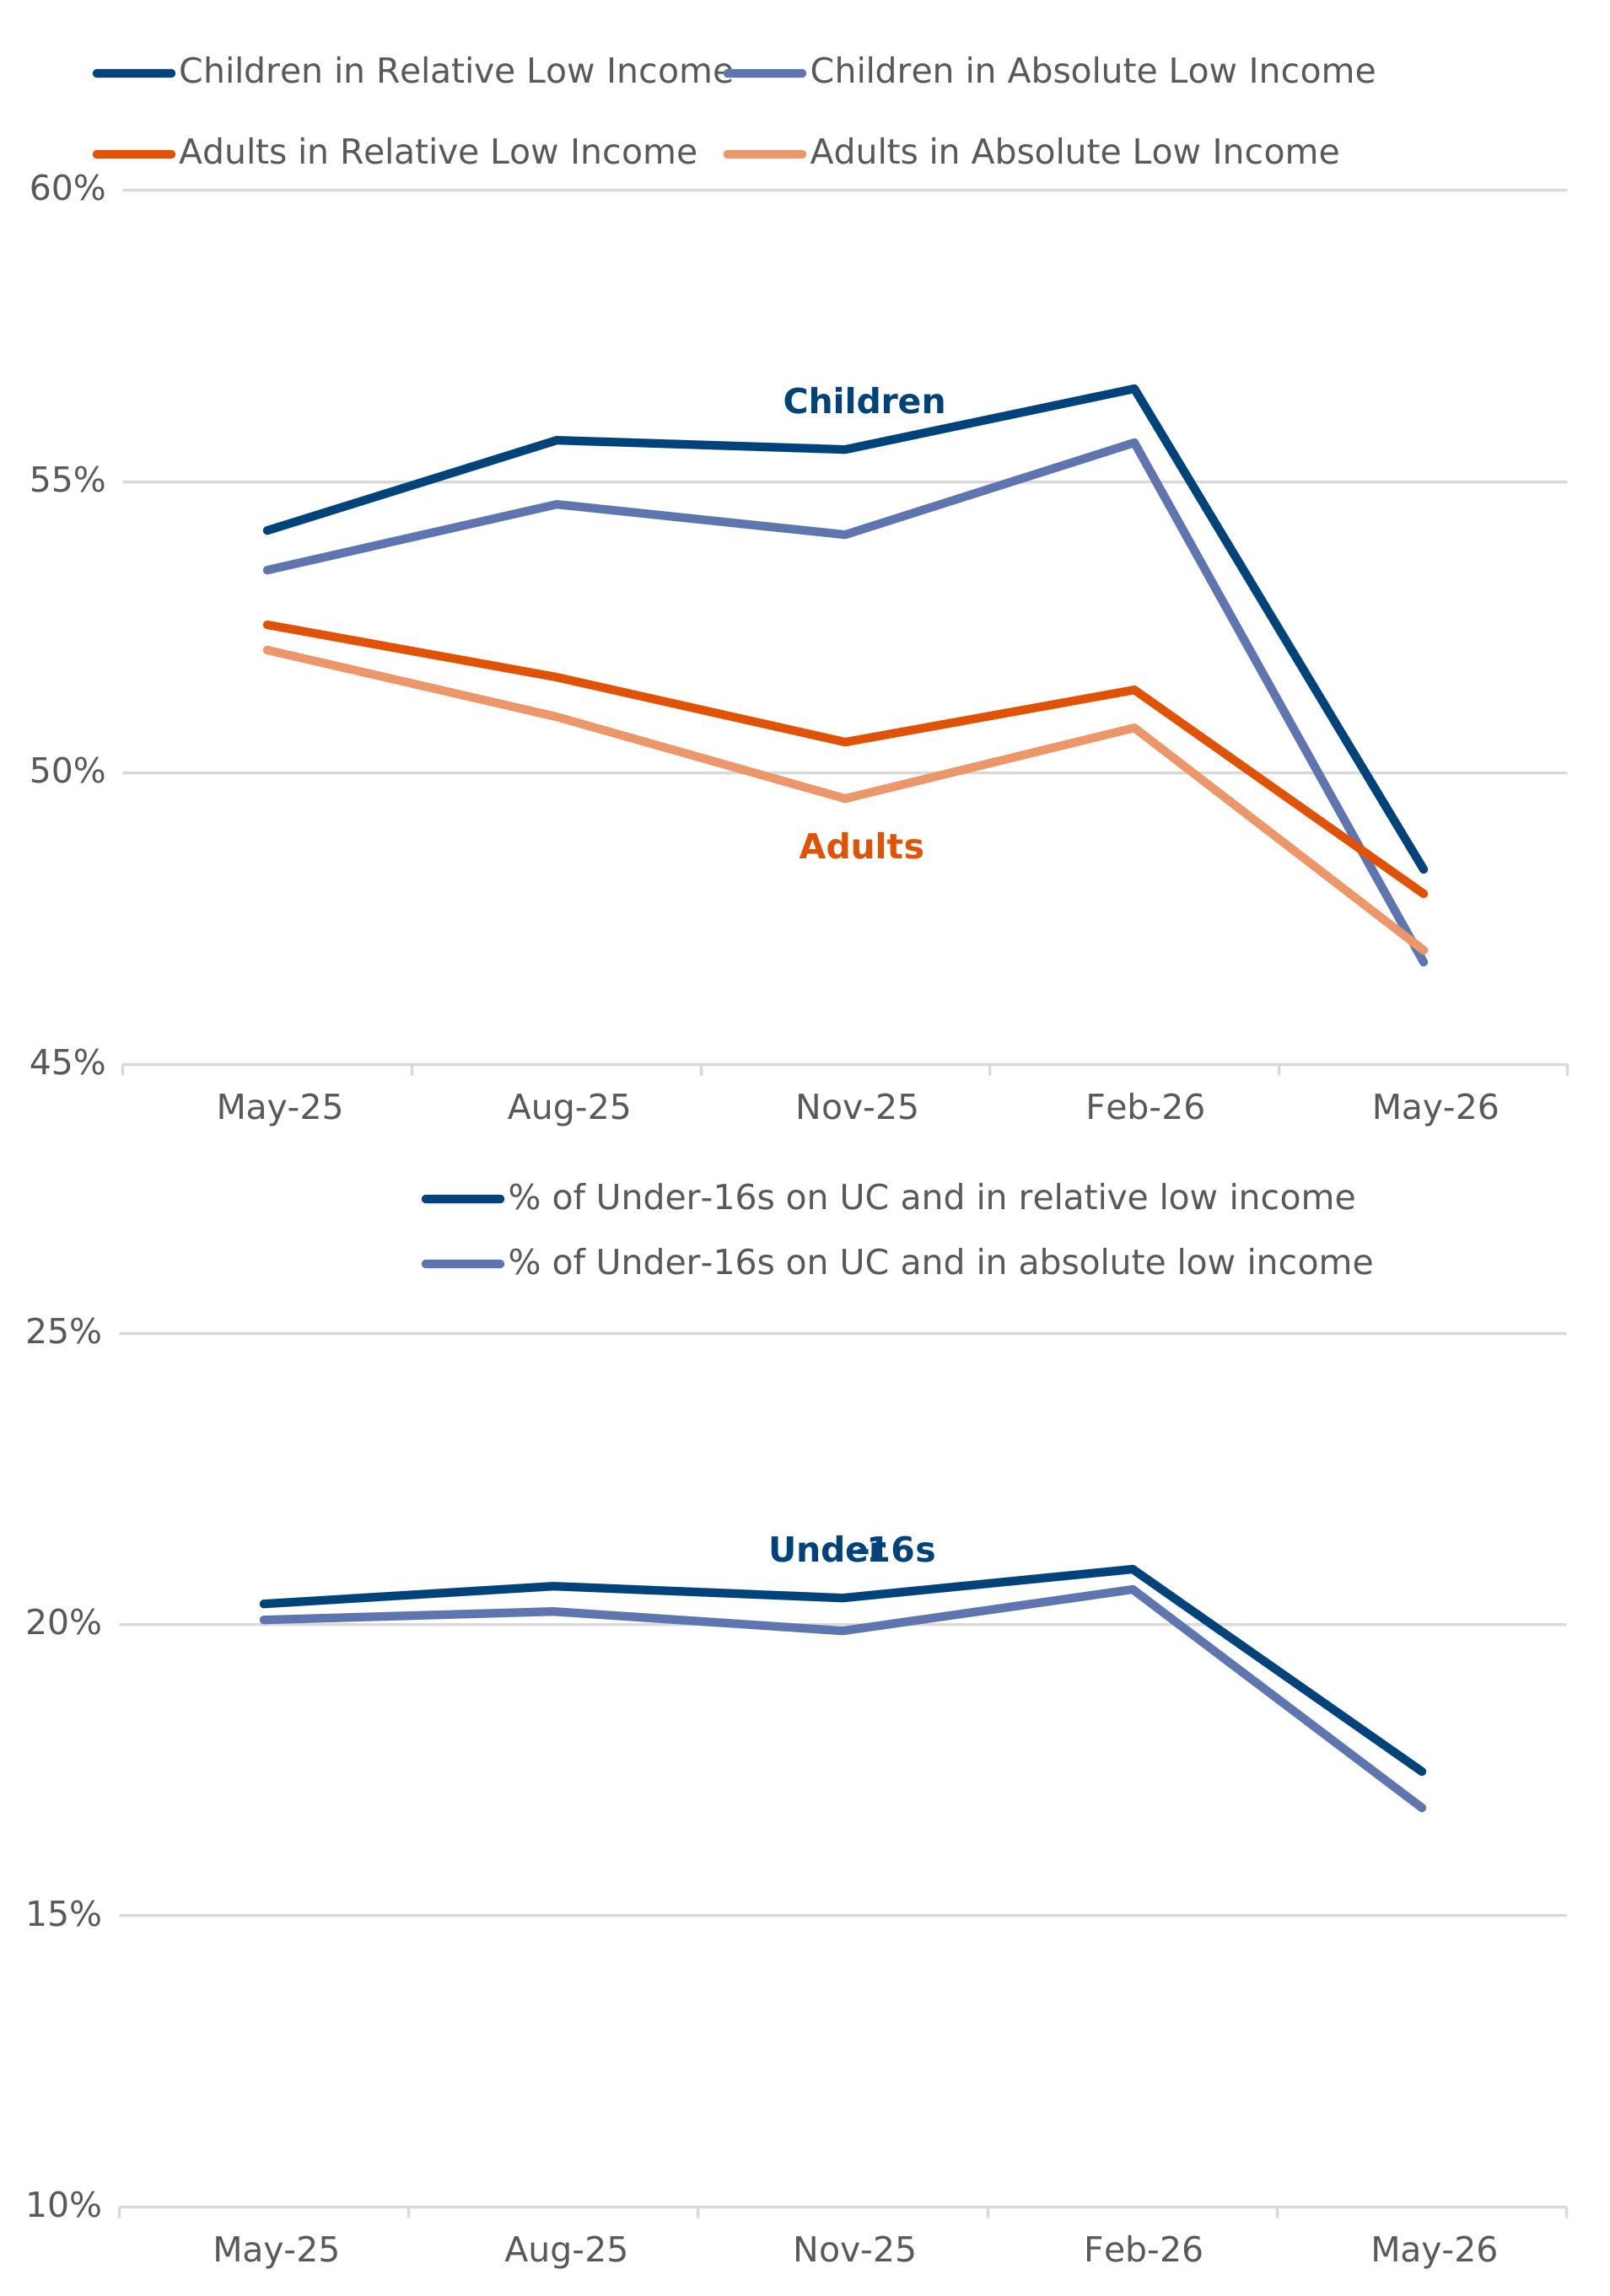
Absolute low income followed a broadly similar pattern to relative low income. Between May 2025 and February 2026, the absolute low-income AHC rate remained slightly lower than the relative low income AHC rate, increasing from 52.9% to 53.1%, with the number of individuals in absolute low income AHC increasing from 7 million to 7.2 million. Between February and May 2026, the absolute low-income AHC rate fell from 53.1% to 46.7%, with the number of individuals in absolute low income AHC falling from 7.2 million to 6.4 million.
The 2 measures remained close, with the absolute low-income rate 0.9 percentage points lower for adults, and 1.5 percentage points lower for children than the relative low-income rate in May 2026. This is because the absolute poverty line was the same as the relative poverty line for FYE 2025 (60% of the UK household median) and was only very slightly lower for the period May 2025 to May 2026. The difference between the measures may become more pronounced as the relative and absolute poverty thresholds diverge over time.
4. At a country level
All individuals
Chart 8: England had the highest proportion of people in families receiving UC who were in low income AHC in May 2026, whilst Scotland had the lowest rate
Proportion of people in families receiving UC and in relative low income AHC by country, May 2026.
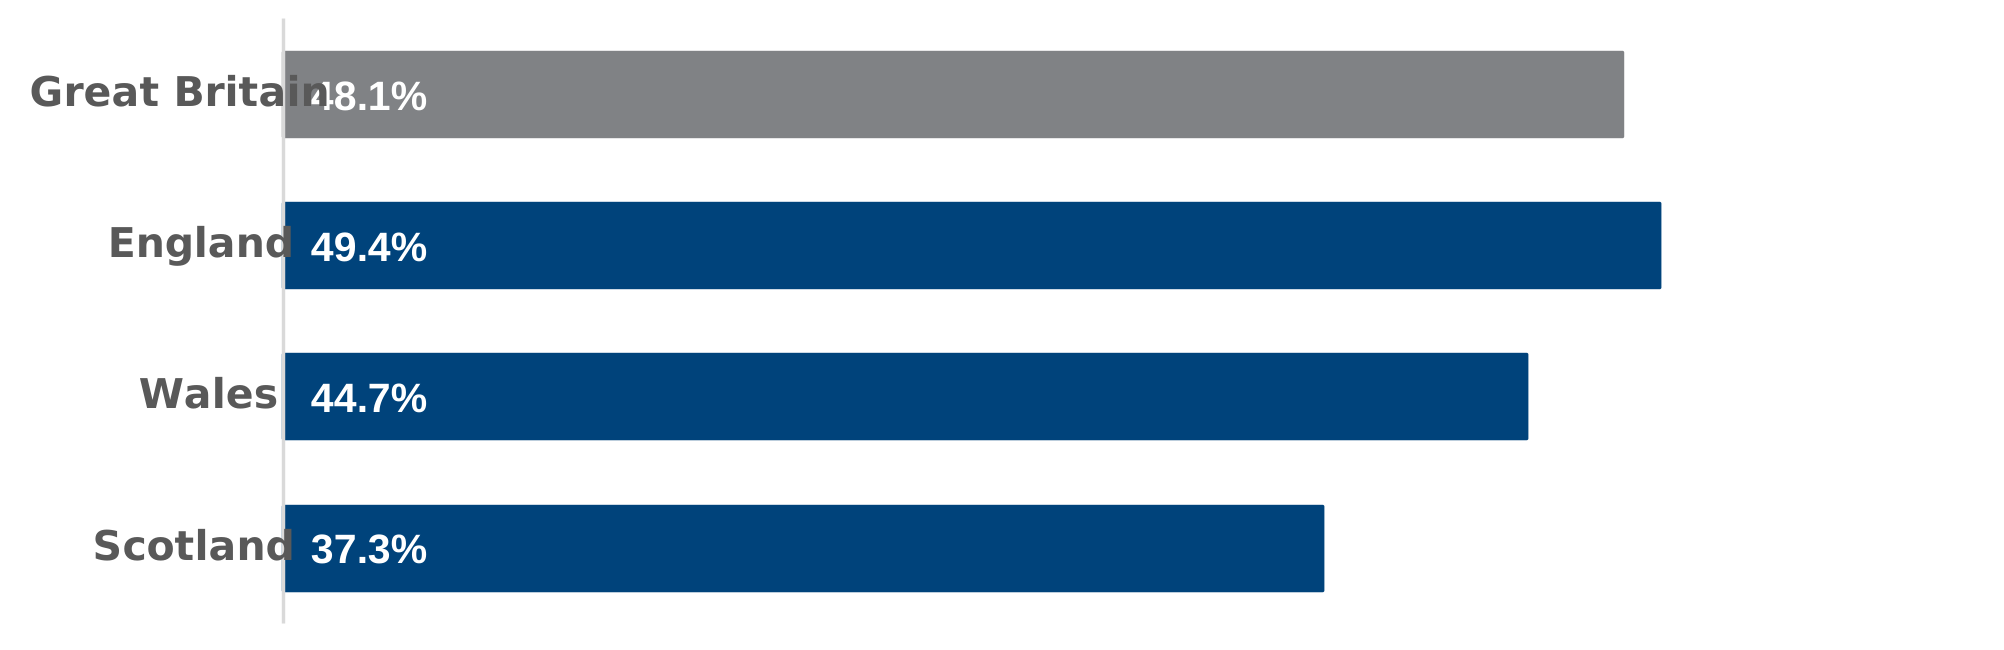
In May 2026, England had the highest proportion (49.4%) of people in families receiving UC who were also in relative low income AHC. England also had the highest rate in each quarter since May 2025. Wales had a lower proportion (44.7%) whilst Scotland had the lowest proportion in May 2026 (37.3%) and in each quarter since May 2025.
Under-16s
Chart 9: England had the highest rate of under-16s in families receiving UC and in low income AHC as a percentage of all under-16s in May 2026, whilst Scotland had the lowest rate
Under-16s in families receiving UC and in relative low income AHC by country as a percentage of all under-16s in the population, May 2026.
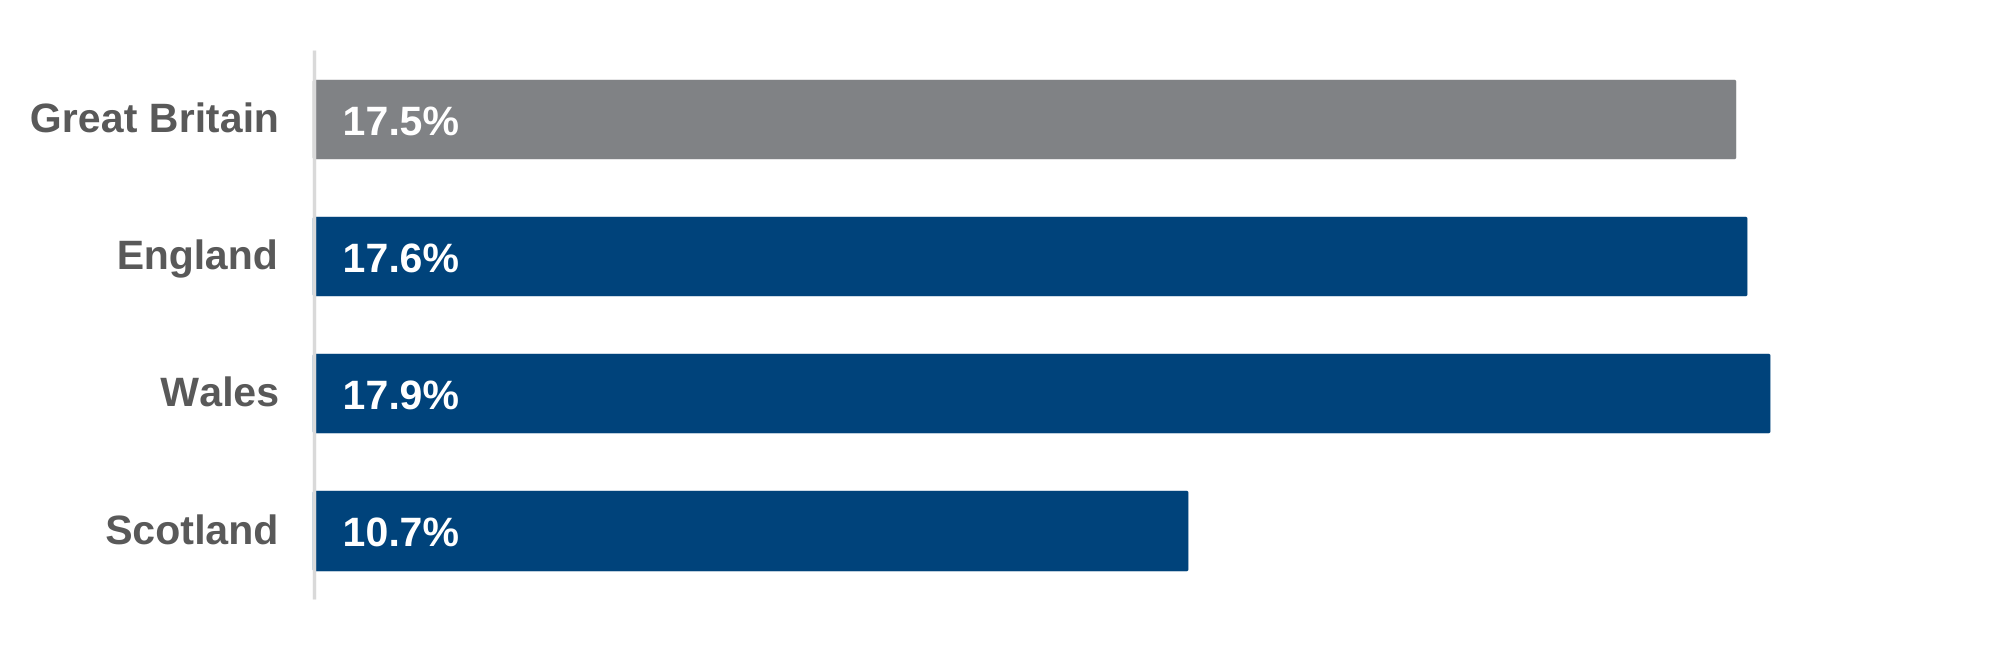
When considering under-16s in families receiving UC who are also in relative low income AHC as a proportion of all under-16s in the population; Wales and England had very similar rates in May 2026 (17.9% for Wales and 17.6% for England), whilst Scotland had the lowest (10.7% in May 2026).
5. At an English region level
All individuals
Chart 10: London had the highest proportion of people in families receiving UC who were in low income AHC in May 2026, whilst the South West had the lowest rate
Proportion of people in families receiving UC and in relative low income AHC by English region, May 2026.
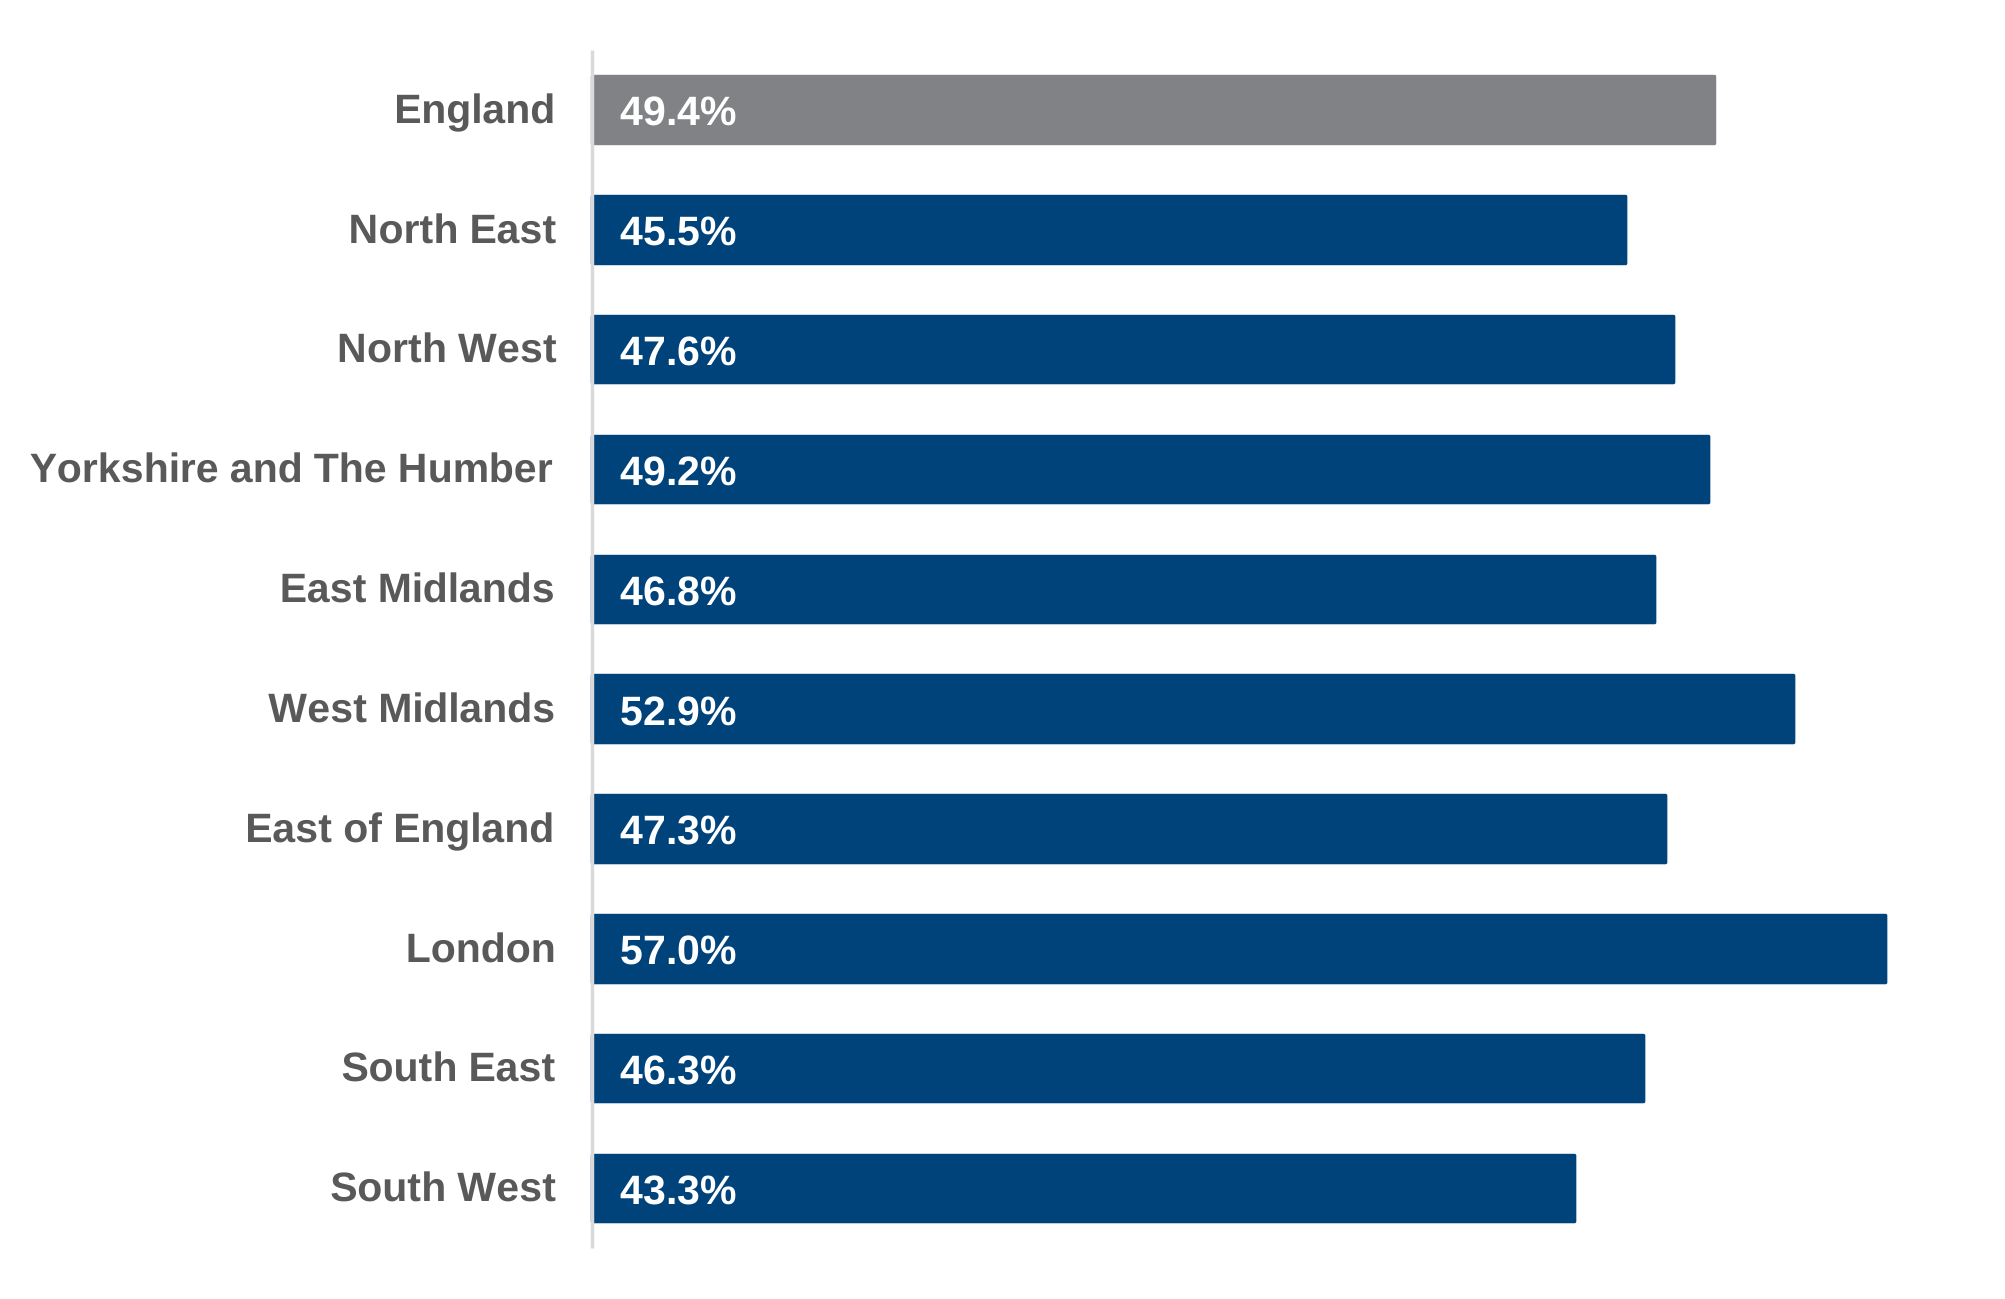
In May 2026, London had the highest proportion (57.0%) of people in families receiving UC who were also in relative low income AHC. London had also had the highest rate in each quarter since May 2025. Conversely, the South West had the lowest proportion in May 2026 (43.3%).
Under-16s
Chart 11: London had the highest rate of under-16s in families receiving UC and in low income AHC as a percentage of all under-16s in May 2026, whilst the South East had the lowest rate
Under-16s in families receiving UC and in relative low income AHC by English region as a percentage of all under-16s in the population, May 2026.
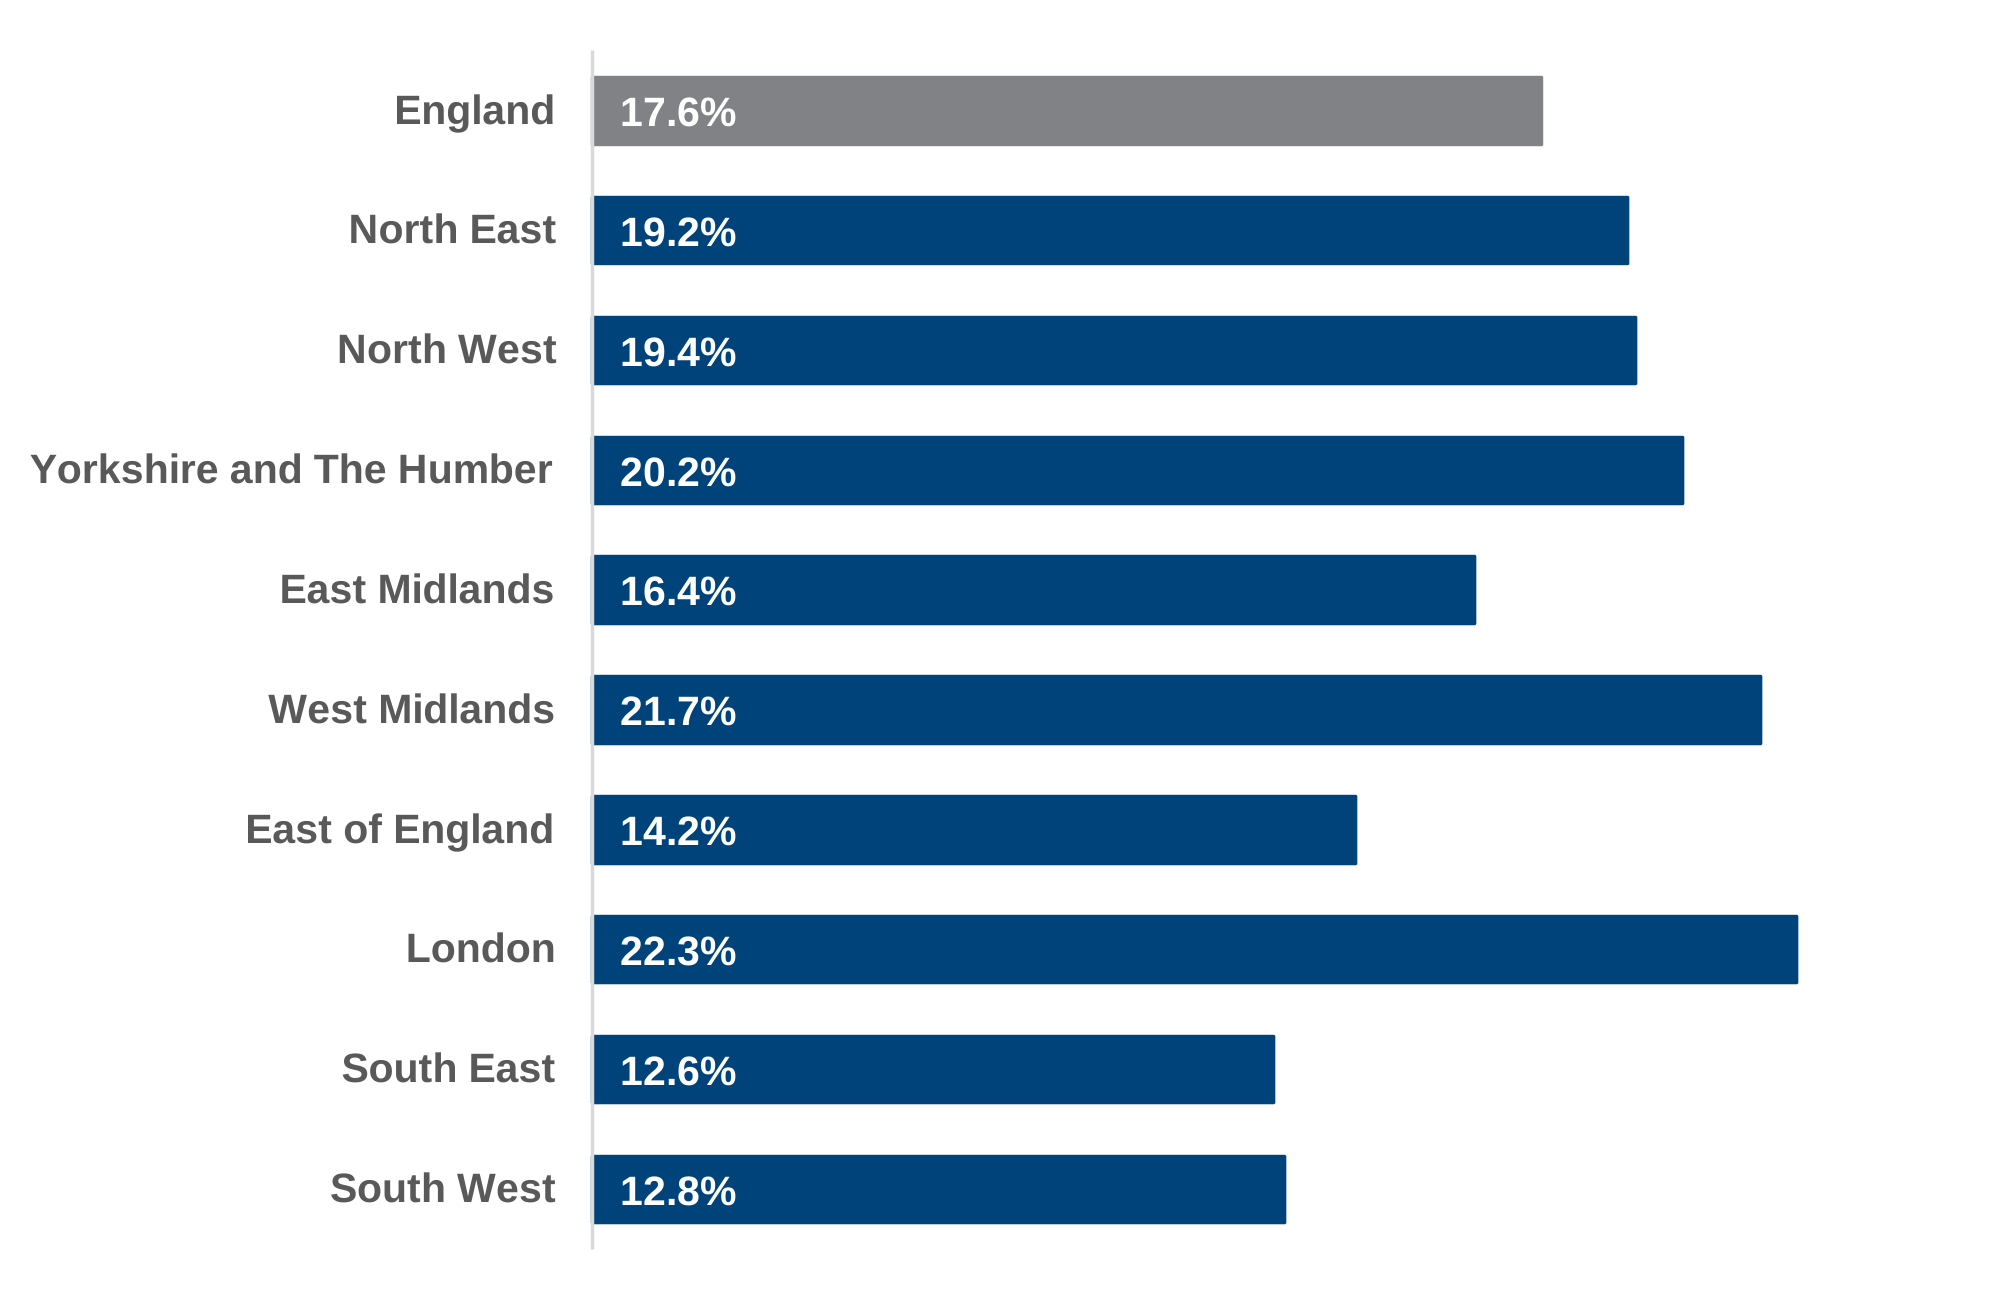
When considering under-16s in families receiving UC who are also in relative low income AHC as a proportion of all under-16s in the population; London had the highest rate in each quarter (for example 22.3% in May 2026). Conversely, the South East (12.6%) and the South West (12.8%) had the lowest rates.
6. At a local authority level
All individuals
In May 2026, the proportion of people in families receiving UC who were also in relative low income AHC varied substantially across local authorities. Among local authorities, Redbridge had the highest proportion at 64.7%, followed by Harrow (62.9%), Newham (62.7%), Ealing (62.4%) and Luton (62.0%). By contrast, several Scottish local authorities recorded the lowest proportions, including Shetland Islands (27.5%), Orkney Islands (30.0%), Midlothian (31.1%) and Perth and Kinross (31.5%).
Many of the local authorities with the highest proportions are located in London and other urban areas with relatively high housing costs, though of course there may be other relevant factors as well. Conversely, the lowest rates were predominantly found in Scotland, with relatively low housing costs in some areas and families receiving UC also benefitting from the Scottish Child Payment.
Despite these differences in levels, the trend between February and May 2026 was consistent across Great Britain, with every local authority recording lower rates of low income following the removal of the 2-child limit and the April 2026 uprating of UC.
Under-16s
Considering the 2 measures available regarding under-16s in families receiving UC:
- under-16s in families receiving UC and in relative low income AHC as a proportion of under-16s in families receiving UC
with
- under-16s in families receiving UC and in relative low income AHC as a proportion of all under-16s in the population
The first measure describes the risk of low income for an under-16 within the UC population, whilst the second looks at the risk in the broader context of all under-16s in the area. The areas with the highest proportion of UC recipients in low income (first metric) are not always the same as those with the highest proportion of UC recipients in relative low income within the context of the broader population of the area. For example, an area with high housing costs but a relatively low proportion of families receiving UC may have a high percentage of UC recipients in low income (first metric). However, the number of under-16s in families receiving UC as a proportion of all under-16s in the area may be quite low (second metric).
For example, while Redbridge had the highest proportion of under-16s in UC families living in relative low income AHC in May 2026 (62.4%), Tower Hamlets had the highest proportion of all under-16s in the local population who were living in relative low income and in families receiving UC (37.9%). Birmingham (32.8%), Newham (31.6%), Enfield (31.2%), Manchester (30.9%) and Hackney (30.4%) also recorded particularly high rates on this measure.
Table 3: The 10 local authorities with the highest proportions of under-16s in families receiving UC who were in relative low income AHC, and the 10 local authorities with the highest proportion of under-16s with UC receipt and in relative low income AHC as a proportion of all under-16s in the population, Great Britain, May 2026
| Rank | Country or region | Local authority | In low income and UC as a proportion of under-16s in families on UC | Rank | Country/Region | Local authority | In low income and UC as a proportion of under-16s in the population |
|---|---|---|---|---|---|---|---|
| 1 | London | Redbridge | 62.4% | 1 | London | Tower Hamlets | 37.9% |
| 2 | London | Harrow | 60.5% | 2 | West Midlands | Birmingham | 32.8% |
| 3 | East of England | Luton | 60% | 3 | London | Newham | 31.6% |
| 4 | London | Newham | 58.9% | 4 | London | Enfield | 31.2% |
| 5 | London | Ealing | 57.7% | 5 | North West | Manchester | 30.9% |
| 6 | West Midlands | Birmingham | 57.6% | 6 | London | Hackney | 30.4% |
| 7 | London | Brent | 57.5% | 7 | London | Brent | 30.3% |
| 8 | London | Tower Hamlets | 57.3% | 8 | London | Barking and Dagenham | 29.0% |
| 9 | London | Barking and Dagenham | 56.7% | 9 | North West | Oldham | 28.9% |
| 10 | London | Enfield | 56.1% | 10 | East Midlands | Nottingham | 28.8% |
Table 4: The 10 local authorities with the lowest proportions of under-16s in families receiving UC who were in relative low income AHC, and the 10 local authorities with the lowest proportion of under-16s with UC receipt and in relative low income AHC as a proportion of all under-16s in the population, Great Britain, May 2026
| Rank | Country or region | Local authority | In low income and UC as a proportion of under-16s in families on UC | Rank | Country or region | Local authority | In low income and UC as a proportion of under-16s in the population |
|---|---|---|---|---|---|---|---|
| 1 | Scotland | Shetland Islands | 22.1% | 1 | Scotland | Shetland Islands | 4.8% |
| 2 | Scotland | Na h-Eileanan Siar | 22.3% | 2 | Scotland | East Renfrewshire | 4.9% |
| 3 | Scotland | Midlothian | 23.0% | 3 | Scotland | East Dunbartonshire | 5.2% |
| 4 | Scotland | Perth and Kinross | 23.5% | 4 | Scotland | Orkney Islands | 5.4% |
| 5 | Scotland | Orkney Islands | 23.9% | 5 | Scotland | Na h-Eileanan Siar | 5.4% |
| 6 | Scotland | Dumfries and Galloway | 24.3% | 6 | Scotland | Aberdeenshire | 5.9% |
| 7 | Scotland | Argyll and Bute | 25.1% | 7 | South East | Wokingham | 6.4% |
| 8 | Scotland | South Lanarkshire | 25.3% | 8 | East Midlands | Rushcliffe | 6.4% |
| 9 | Scotland | East Dunbartonshire | 25.4% | 9 | South East | Waverley | 6.4% |
| 10 | Scotland | Moray | 25.6% | 10 | South East | Hart | 7.1% |
Chart 12: Compared with the rest of Great Britain, Scottish local authorities have low proportions of under-16s on UC who are also in low income AHC. They also have lower proportions when expressed as a percentage of all under-16s in the population, although not quite to the same extent.
Under-16s in families receiving UC in relative low income AHC, as a proportion of all under-16s in families receiving UC, and as a proportion of all under-16s in the population, by local authority, May 2026.
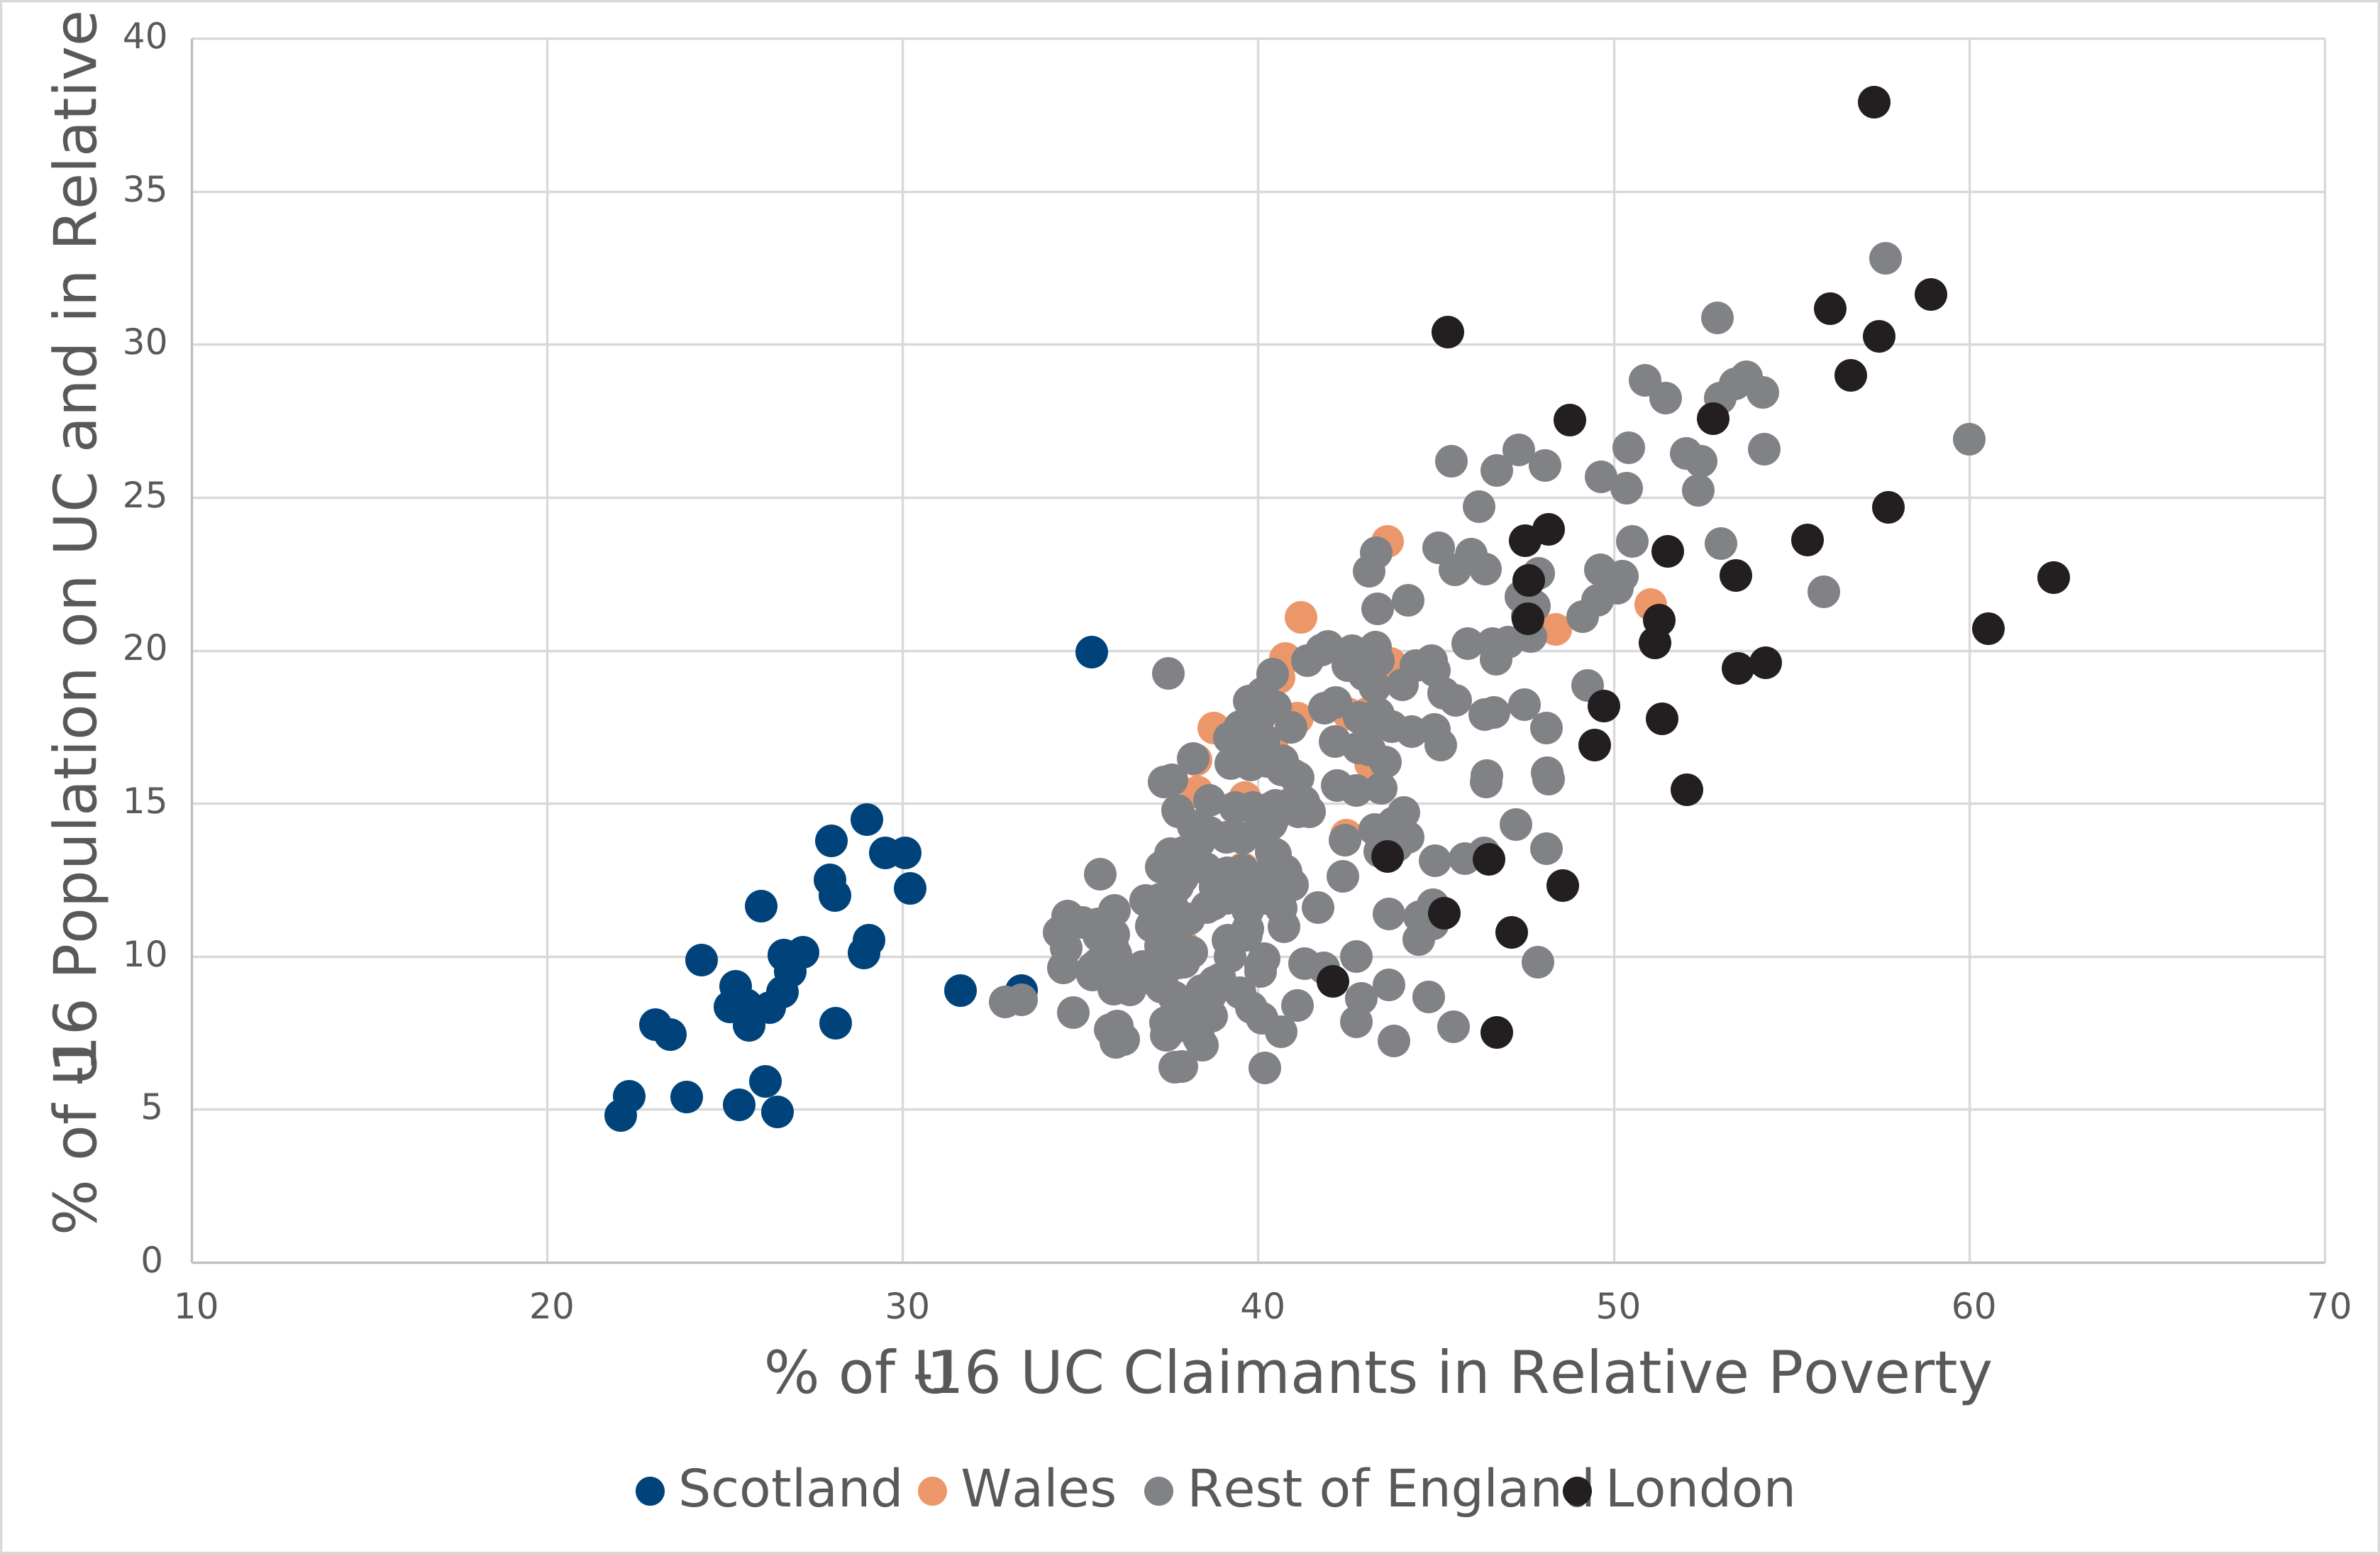
As the scatter plot shows, local authorities with a high rate on one metric tend to also have a high rate on the other metric and vice-versa. For example, Newham had the fourth highest rate (58.9%) regarding under-16s in families receiving UC who are in relative low income AHC (58.9%) and the third highest rate (31.6%) when this is expressed as a proportion of all under-16s in Newham. Conversely, the Shetland Islands had the very lowest percentages for each metric (excluding local authorities with less than 100 people in families receiving UC). However, there are some exceptions to this broad pattern, for example Richmond upon Thames which had 46.7% of under-16s in families receiving UC in relative low income AHC, which is slightly higher than the Great Britain average (44.5%). However, it had a very low rate (7.5%) when this is expressed as a proportion of all under-16s in the area. The explanation is that relatively few under-16s in Richmond upon Thames are in families receiving UC. However, for those that are, the risk of being in low income is slightly higher than the national average, potentially driven by high housing costs in this area.
7. At a Westminster parliamentary constituency level
All individuals
Regarding Westminster parliamentary constituency breakdowns, in May 2026, Birmingham Ladywood had the highest proportion of individuals in families receiving UC who were in relative low income AHC (68.4%), whilst Orkney and Shetland had the lowest proportion (28.7%).
Under-16s
In terms of children under-16 in families receiving UC and in relative low income AHC, expressed as a percentage of the under-16 population, Birmingham Ladywood also had the highest rate on this metric (44.8%) whilst Mid Dunbartonshire had the lowest rate (4.1%).
Table 5: The 10 Westminster parliamentary constituencies with the highest proportions of under-16s in families receiving UC who were in relative low income AHC, and the 10 constituencies with the highest proportion of under-16s with UC receipt and in relative low income AHC as a proportion of all under-16s in the population, Great Britain, May 2026
| Rank | Country or region | Constituency | In low income and UC as a proportion of under-16s in families on UC | Rank | Country or region | Constituency | In low income and UC as a proportion of under-16s in the population |
|---|---|---|---|---|---|---|---|
| 1 | West Midlands | Birmingham Ladywood | 65.1% | 1 | West Midlands | Birmingham Ladywood | 44.8% |
| 2 | London | Ilford South | 64.0% | 2 | London | Bethnal Green and Stepney | 41.1% |
| 3 | London | East Ham | 63.6% | 3 | West Midlands | Birmingham Perry Barr | 38.5% |
| 4 | West Midlands | Birmingham Perry Barr | 63.4% | 4 | West Midlands | Birmingham Hodge Hill and Solihull North | 36.6% |
| 5 | West Midlands | Birmingham Hall Green and Moseley | 62.1% | 5 | London | Tottenham | 36.4% |
| 6 | London | Harrow East | 61.5% | 6 | London | Poplar and Limehouse | 36.3% |
| 7 | London | Ilford North | 61.1% | 7 | North West | Liverpool Riverside | 36.2% |
| 8 | East of England | Luton South and South Bedfordshire | 60.4% | 8 | Yorkshire and The Humber | Bradford East | 36.0% |
| 9 | Yorkshire and The Humber | Bradford West | 60.3% | 9 | London | Brent East | 35.5% |
| 10 | North West | Manchester Rusholme | 60.2% | 10 | Yorkshire and The Humber | Bradford West | 35.3% |
Table 6: The 10 Westminster parliamentary constituencies with the lowest proportions of under-16s in families receiving UC who were in relative low income AHC, and the 10 constituencies with the lowest proportion of under-16s with UC receipt and in relative low income AHC as a proportion of all under-16s in the population, Great Britain, May 2026
| Rank | Country or region | Constituency | In low income and UC as a proportion of under-16s in families on UC | Rank | Country or region | Constituency | In low income and UC as a proportion of under-16s in the population |
|---|---|---|---|---|---|---|---|
| 1 | Scotland | Na h-Eileanan an Iar | 22.3% | 1 | Scotland | Mid Dunbartonshire | 4.1% |
| 2 | Scotland | Orkney and Shetland | 22.9% | 2 | Scotland | West Aberdeenshire and Kincardine | 4.3% |
| 3 | Scotland | Midlothian | 23.0% | 3 | Yorkshire and The Humber | Sheffield Hallam | 4.5% |
| 4 | Scotland | East Kilbride and Strathaven | 23.4% | 4 | Scotland | East Renfrewshire | 4.9% |
| 5 | Scotland | Dumfries and Galloway | 24.3% | 5 | Scotland | Orkney and Shetland | 5.1% |
| 6 | Scotland | Angus and Perthshire Glens | 24.3% | 6 | East of England | Harpenden and Berkhamsted | 5.1% |
| 7 | Scotland | Dumfriesshire, Clydesdale and Tweeddale | 24.4% | 7 | Scotland | Gordon and Buchan | 5.2% |
| 8 | Scotland | Inverness, Skye and West Ross-shire | 24.4% | 8 | Scotland | Edinburgh West | 5.3% |
| 9 | Scotland | Perth and Kinross-shire | 24.8% | 9 | Scotland | Na h-Eileanan an Iar | 5.4% |
| 10 | Scotland | Argyll, Bute and South Lochaber | 25.3% | 10 | Yorkshire and The Humber | Wetherby and Easingwold | 5.6% |
Chart 13: Compared with the rest of Great Britain, Scottish constituencies have low proportions of under-16s on UC who are also in low income AHC. They also have lower proportions when expressed as a percentage of all under-16s in the population, although not quite to the same extent
Under-16s in families receiving UC in relative low income AHC, as a proportion of all under-16s in families receiving UC, and as a proportion of all under-16s in the population, by Westminster Parliamentary Constituency, May 2026.
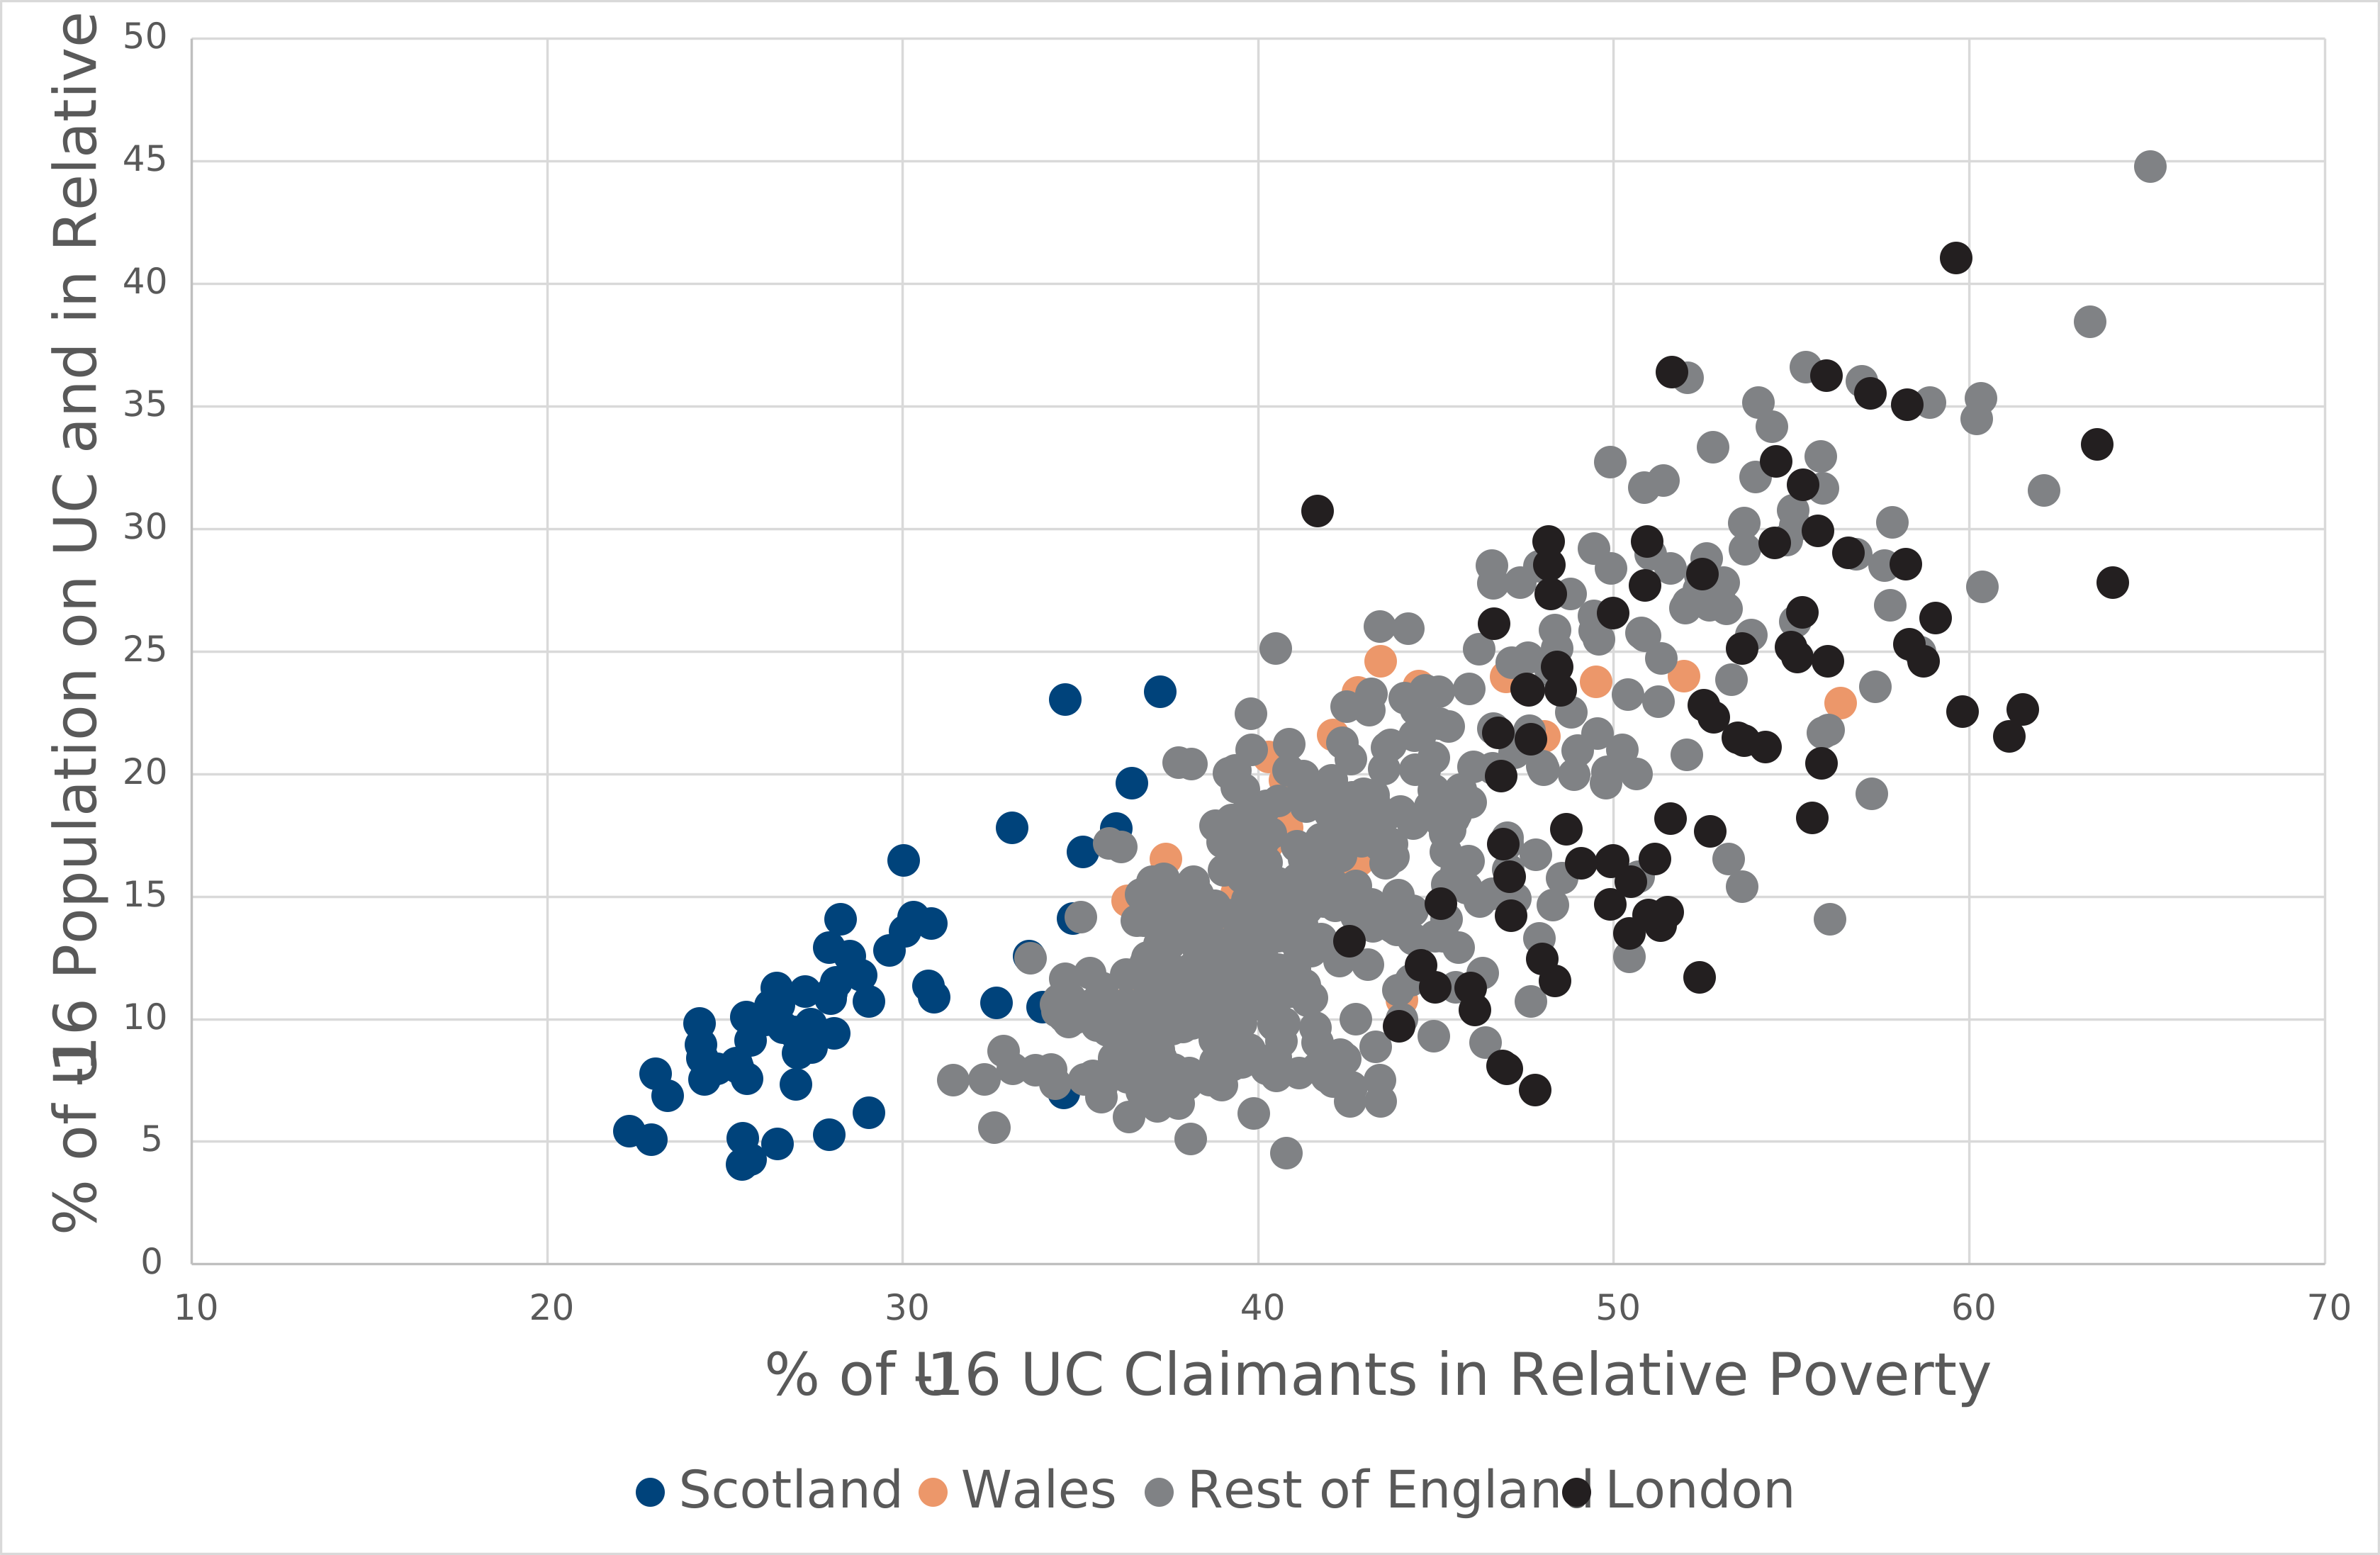
As with local authorities, parliamentary constituencies with a high proportion of under-16s in families receiving UC who are in relative low income AHC also tend to have a high proportion of all under-16s in low income. This highlights the different perspectives provided by the 2 measures: one reflects the risk of low income among children in UC families, while the other reflects the prevalence of low income across the wider child population. However, there are some notable exceptions. In Sheffield Hallam, 40.8% of under-16s in families receiving UC were in relative low income AHC, but this represented a comparatively low proportion (4.5%) of all under-16s in the constituency; conversely, Hackney North and Stoke Newington had a similar proportion (41.7%) of under-16s in families receiving UC in relative low income AHC, but a much higher rate comparatively when expressed as a proportion of all under-16s in the constituency (30.7%).
8. Strengths and limitations
The main strengths and limitations of these statistics are set out in Section 2. In addition, please note the following:
Limited coverage of families in low income. The UCLI statistics, by definition only include individuals living in families receiving UC. They do not include individuals in low income whose families are not receiving UC, such as:
- families who are ineligible for UC either because they have no recourse to public funds (NRPF), all adults are above state pension age, the family has too much capital (above £16,000) or other reasons
- families who may be eligible but do not claim
- families with high mortgage costs or very high housing costs, who may have income before housing costs (BHC) which is too high to receive UC, but once the housing costs are considered would be in low income AHC
- other family situations where earnings are high enough to float the family off UC but their overall equivalised AHC income is still below the poverty line
Household level versus family level data: HBAI calculates incomes at household level in line with international standards for income measurement, whereas UCLI only calculates incomes at family (benefit unit) level. For example, where a household is comprised of a couple (benefit unit 1) and adult child (benefit unit 2), HBAI calculates the income for the whole household whereas UCLI would only calculate the income at benefit unit level for whichever benefit unit or benefit units were receiving UC. This also means that UCLI is calculating family level incomes and comparing them with household-level poverty lines sourced from HBAI, albeit the effect on results is minor.
9. About these statistics
This release is classed as official statistics in development. The methodologies are in the testing phase and changes are likely to be made. This includes an expected annual revisions process that is likely to occur with the May release of these quarterly statistics, that is, the release after the publication of the annual HBAI statistics showing the UK poverty lines for the latest year.
These UCLI statistics are being developed and tested with users, in line with the standards of Trustworthiness, Quality, and Value in the Code of Practice for Statistics. The strengths and limitations of these statistics are explained in the strengths and limitations section above and also in the background information and methodology document.
These statistics are being published now to engage with current and potential users in the developments and make improvements that meet user needs. You can send your comments by email to stats.consultation-2018@dwp.gov.uk.
More information about official statistics in development is provided by the Office for Statistics Regulation.
As these are newly developed statistics, we are still testing the methodology to deliver improvements and make sure it is robust. The first section of this report gives an idea of our planned developments. We also plan to gather user views to guide our developments for at least the first 4 quarterly releases.
The status of these statistics will be reviewed in December 2027 following these first 4 quarterly releases.
10. Related statistics
Households Below Average Income (HBAI) provides estimates of numbers in low income and low-income rates for children, working age adults and pensioners. Figures are provided both BHC and AHC, across the United Kingdom and back to FYE 1995.
Children in Low Income Families (CiLIF) provides data on the number and proportion of children living in low-income families BHC and AHC, across the United Kingdom by local area.
Ad hoc statistics for May 2026 showing the impact of the removal of the 2-child limit.
See Annex 1 of the Background Information and Methodology report for a full list of related statistics.
Details of other Accredited and Official Statistics produced by the Department for Work and Pensions can be found on the Statistics at DWP page with a schedule of statistical releases over the next 12 months and a list of the most recent releases.
What do you think?
We are constantly aiming to improve this report and its associated commentary. We would welcome any feedback you might have and would also be particularly interested in knowing how you make use of this data to inform your work. Please contact us via email: stats.consultation-2018@dwp.gov.uk.