UK trade with Trade Agreement Continuity (TAC) countries: statistical ad hoc release
Updated 4 December 2019

© Crown copyright 2019
This publication is licensed under the terms of the Open Government Licence v3.0 except where otherwise stated. To view this licence, visit nationalarchives.gov.uk/doc/open-government-licence/version/3 or write to the Information Policy Team, The National Archives, Kew, London TW9 4DU, or email: psi@nationalarchives.gov.uk.
Where we have identified any third party copyright information you will need to obtain permission from the copyright holders concerned.
This publication is available at https://www.gov.uk/government/statistics/uk-trade-agreement-continuity-statistics-and-analysis/uk-trade-with-trade-agreement-continuity-tac-countries-statistical-ad-hoc-release
Summary
1. This release provides key numbers on UK trade agreements. These statistics do not estimate the value or impact of the trade agreements themselves. They provide, for context, the overall value of the UK’s trade with countries covered by these agreements. These countries are sometimes referred to as ‘Trade Agreement Continuity’ (TAC) countries.
Key statistics
2. The government is seeking continuity for our existing EU trade agreements as we leave the European Union (see methodology note 1).
3. UK trade with countries party to trade agreements with which we are seeking continuity accounted for £146.6 billion or 11.1% of UK’s total trade (goods and services) in 2018.
4. Agreements have now been signed with countries that account for 74.6% of the UK’s trade in 2018 with countries with which we’re seeking continuity.
5. This means we have already secured continuity on £109.4 billion of UK trade. That has moved from £40.9 billion since March.
Chart 1: UK Trade Agreements in the context of total UK trade (goods and services)
Percentage (%) of total UK trade (£1,322 billion in 2018 data period)
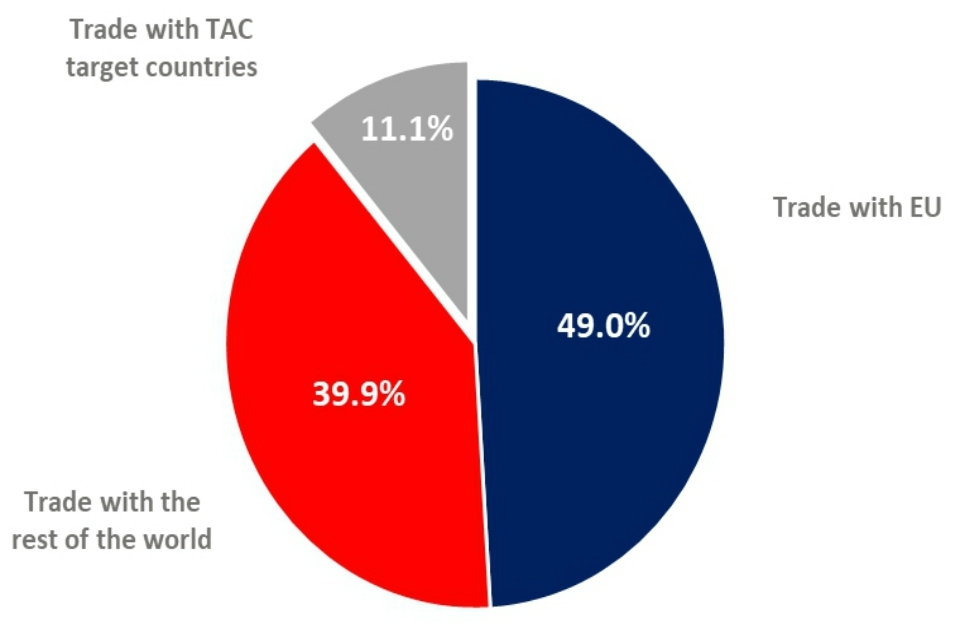
Pie chart showing: trade with EU 49.0%, trade with the rest of the world 39.9% and trade with TAC target countries 11.1%.
Note: The 11.1% excludes Turkey, San Marino and Andorra, which are part of a customs union with the EU, and excludes Japan, as the economic partnership agreement only came into force on 1 February 2019.
Table 1: Trade with TAC target countries party to UK signed trade agreements and those agreed in principle, 2018 data, £ million
| Countries | UK agreements | Total UK trade with countries | Share of UK trade with all TAC countries (%) | Goods trade | Services trade | Total exports | Total imports | Share of total UK trade (%) | Share of total UK exports (%) |
|---|---|---|---|---|---|---|---|---|---|
| UK trade with TAC countries signed or agreed in principle | 109,387 | 74.6 | 65,621 | 43,766 | 52,506 | 56,881 | 8.3 | 8.2 | |
| UK trade with all TAC target countries | 146,639 | 100 | 89,694 | 56,945 | 72,499 | 74,140 | 11.1 | 11.3 | |
| UK trade with world | 1,322,189 | NA | 832,001 | 490,188 | 642,230 | 679,959 | 100.0 | 100.0 | |
| Switzerland, Liechtenstein | Switzerland, Switzerland-Liechtenstein | 32,438 | 22.1 | 13,379 | 19,059 | 20,274 | 12,164 | 2.5 | 3.2 |
| Iceland, Norway | Iceland-Norway | 30,613 | 20.9 | 24,900 | 5,713 | 7,578 | 23,035 | 2.3 | 1.2 |
| South Korea | South Korea | 14,806 | 10.1 | 10,730 | 4,076 | 9,479 | 5,327 | 1.1 | 1.5 |
| Botswana, Lesotho, Mozambique, Namibia, South Africa, Eswatini (Swaziland) | Southern Africa Customs Union and Mozambique | 10,258 | 7.0 | 5,712 | 4,546 | 4,996 | 5,262 | 0.8 | 0.8 |
| Israel | Israel | 4,211 | 2.9 | 2,256 | 1,955 | 2,404 | 1,807 | 0.3 | 0.4 |
| CARIFORUM (see note 2) | CARIFORUM | 3,707 | 2.5 | 1,007 | 2,700 | 1,806 | 1,901 | 0.3 | 0.3 |
| Peru, Colombia, Ecuador | Andean countries | 3,380 | 2.3 | 1,724 | 1,656 | 1,014 | 2,366 | 0.3 | 0.2 |
| Morocco | Morocco | 2,471 | 1.7 | 1,512 | 959 | 1,214 | 1,257 | 0.2 | 0.2 |
| Chile | Chile | 2,004 | 1.4 | 1,551 | 453 | 941 | 1,063 | 0.2 | 0.1 |
| Madagascar (see note 1), Mauritius, Seychelles, Zimbabwe | Eastern and Southern Africa | 1,994 | 1.4 | 525 | 1,469 | 870 | 1,124 | 0.2 | 0.1 |
| Costa Rica, El Salvador, Guatemala, Honduras, Nicaragua, Panama | Central America | 1,166 | 0.8 | 856 | 310 | 474 | 692 | 0.1 | 0.1 |
| Lebanon | Lebanon | 762 | 0.5 | 391 | 371 | 608 | 154 | 0.1 | 0.1 |
| Tunisia | Tunisia | 542 | 0.4 | 336 | 206 | 235 | 307 | 0.0 | 0.0 |
| Jordan | Jordan | 448 | 0.3 | 286 | 162 | 387 | 61 | 0.0 | 0.1 |
| Faroe Islands | Faroe Islands | 252 | 0.2 | 249 | 3 | 44 | 208 | 0.0 | 0.0 |
| Fiji, Papua New Guinea | Pacific states | 163 | 0.1 | 114 | 49 | 57 | 106 | 0.0 | 0.0 |
| Georgia | Georgia | 123 | 0.1 | 76 | 47 | 96 | 27 | 0.0 | 0.0 |
| Palestinian Authority | Palestinian Authority | 41 | 0.0 | 9 | 32 | 22 | 19 | 0.0 | 0.0 |
| Kosovo | Kosovo | 8 | 0.0 | 8 | - | 7 | 1 | 0.0 | 0.0 |
Note 1: Countries are approved in principle and expected to sign soon.
Note 2: The CARIFORUM countries are: Barbados, Belize, Commonwealth of Dominica, Grenada, The Republic of Guyana, Jamaica, St Christopher and Nevis, St Lucia, St Vincent and the Grenadines, Republic of Trinidad and Tobago, Dominican Republic, Antigua and Barbuda, Commonwealth of Bahamas, Republic of Suriname (see note 1).
Table 2: UK Trade with TAC target countries party to agreements still to be agreed, 2018 data, £ million
| Countries | EU agreements | Total UK trade with countries | Share of UK trade with all TAC countries (%) | Goods trade | Services trade | Total exports | Total imports | Share of total UK trade (%) | Share of total UK exports (%) |
|---|---|---|---|---|---|---|---|---|---|
| UK trade with TAC countries still to be agreed | 37,252 | 25.4 | 24,073 | 13,179 | 19,993 | 17,259 | 2.8 | 3.1 | |
| UK trade with all TAC target countries | 146,639 | 100.0 | 89,694 | 56,945 | 72,499 | 74,140 | 11.1 | 11.3 | |
| UK trade with world | 1,322,189 | NA | 832,001 | 490,188 | 642,230 | 679,959 | 100.0 | 100.0 | |
| Canada | CETA | 18,996 | 13.0 | 11,903 | 7,093 | 11,000 | 7,996 | 1.4 | 1.7 |
| Mexico | Mexico | 4,663 | 3.2 | 2,846 | 1,817 | 2,399 | 2,264 | 0.4 | 0.4 |
| Egypt | Egypt | 3,130 | 2.1 | 2,052 | 1,078 | 1,919 | 1,211 | 0.2 | 0.3 |
| Algeria | Algeria | 2,794 | 1.9 | 2,600 | 194 | 492 | 2,302 | 0.2 | 0.1 |
| North Macedonia | North Macedonia | 1,505 | 1.0 | 947 | 558 | 1,281 | 224 | 0.1 | 0.2 |
| Kenya | Kenya | 1,522 | 1.0 | 834 | 688 | 785 | 737 | 0.1 | 0.1 |
| Ukraine | Ukraine | 1,358 | 0.9 | 1,081 | 277 | 681 | 677 | 0.1 | 0.1 |
| Ghana | Ghana | 1,349 | 0.9 | 816 | 533 | 686 | 663 | 0.1 | 0.1 |
| Moldova | Moldova | 486 | 0.3 | 85 | 401 | 62 | 424 | 0.0 | 0.0 |
| Serbia | Serbia | 631 | 0.4 | 422 | 209 | 286 | 345 | 0.0 | 0.0 |
| Côte d’Ivoire | Côte d’Ivoire | 371 | 0.3 | 293 | 78 | 158 | 213 | 0.0 | 0.0 |
| Cameroon | Cameroon | 189 | 0.1 | 96 | 93 | 135 | 54 | 0.0 | 0.0 |
| Bosnia and Herzegovina | Bosnia and Herzegovina | 132 | 0.1 | 48 | 84 | 64 | 68 | 0.0 | 0.0 |
| Montenegro | Montenegro | 76 | 0.1 | 24 | 52 | 18 | 58 | 0.0 | 0.0 |
| Albania | Albania | 50 | 0.0 | 26 | 24 | 27 | 23 | 0.0 | 0.0 |
Methodology and quality notes
The department provides additional notes on the quality of the data in this release under the following headings:
1. Relevance: The statistics indicate progress towards securing continuity of existing trade agreements. The agreements covered in this release exclude Turkey, San Marino and Andorra, which are part of a customs union with the EU, and excludes Japan, as the economic partnership agreement only came into force on 1 February 2019. Find out more about UK trade agreements.
2. Content: The statistics estimate the value of UK trade with countries who are party to trade agreements. Data covers the period 2018. All trade values within this release are taken from the most recent published Office for National Statistics (ONS) statistics on UK total trade: all countries, non-seasonally adjusted April to June 2019. Please note that this publication incorporates routine data revisions. As a result, 2018 trade values differ from those in the previous release.
3. Completeness: These statistics do not estimate the value or impact of the trade agreements themselves, they provide, for context, the overall value of the UK’s trade with countries covered by these agreements. In particular these statistics cover the UK’s bilateral trade with partner countries covering all exports and imports of goods and services.
4. Geographical coverage: This analysis was conducted for the UK and countries party to trade agreements for which we are seeking continuity (see Relevance). The UK geographical coverage for Office for National Statistics (ONS) statistics is defined on a balance of payments basis.
5. User needs: This release provides contextual information for policy makers, parliamentarians, businesses, the media and the wider public, and to contribute to the wider government transparency agenda.
6. Accuracy: The accuracy of results is dependent on the accuracy of the data sources used. UK trade values are sourced from published Office for National Statistics (ONS) statistics. Find out more about methodology and quality on the ONS website.
7. Uncertainty and bias: Trade data is volatile and frequently revised. The use of annual figures in this release provides greater stability than using quarterly figures.
8. Timeliness and punctuality: This is an ad hoc release. It should be noted that the underlying statistics from the Office for National Statistics can be revised on a quarterly basis. The policy context underlying this release is also subject to change (see Relevance and Content).
9. Accessibility and clarity: All the statistics provided in this release are based on publicly available information (see Relevance and Content).
10. Coherence and comparability: Trade statistics have been provided from a single source for all countries, so that values are comparable.
11. Performance cost and respondent burden: Not applicable.
12. Security, confidentiality and transparency: All statistics released are calculated based on previously published information (see Relevance and Content).
Further information and feedback
Contact the DIT Statistics Team if you have any questions or comments about this release.
Email: statistics@trade.gov.uk
Please use ‘UK trade with Trade Agreement Continuity (TAC) Countries’ as your subject line.
Responsible statistician: Christina Barfoot