UK House Price Index Scotland: June 2019
Published 14 August 2019
Applies to Scotland

© Crown copyright 2019
This publication is licensed under the terms of the Open Government Licence v3.0 except where otherwise stated. To view this licence, visit nationalarchives.gov.uk/doc/open-government-licence/version/3 or write to the Information Policy Team, The National Archives, Kew, London TW9 4DU, or email: psi@nationalarchives.gov.uk.
Where we have identified any third party copyright information you will need to obtain permission from the copyright holders concerned.
This publication is available at https://www.gov.uk/government/statistics/uk-house-price-index-scotland-june-2019/uk-house-price-index-scotland-june-2019
1. Headline statistics for June 2019
the average price of a property in Scotland was
£151,891
the annual price change of a property in Scotland was
1.3%
the monthly price change of a property in Scotland was
0.7%
the index figure for Scotland (January 2015 = 100) was
112.5
Estimates for the most recent months are provisional and are likely to be updated as more data is incorporated into the index. Read the revision policies.
Next publication of UK HPI
The July 2019 UK HPI will be published at 9.30am on Wednesday 18 September 2019. See the calendar of release dates.
Glasgow City and North Lanarkshire local authority boundary change
On 1 April 2019, an area of land was transferred from Glasgow City local authority area to North Lanarkshire. See the Glasgow City Council Area and North Lanarkshire Council Area (Cardowan by Stepps) Boundaries Amendment Order 2018 for more information.
2. Economic statement
Scotland house prices increased by 1.3% in the year to June 2019, down from 1.5% in the year to May 2019. Scotland house prices were growing faster than the UK annual rate of 0.9% in the year to June 2019. On a non-seasonally adjusted basis average house prices in Scotland increased by 0.7% between May 2019 and June 2019, compared with a rise of 0.9% during the same period a year earlier (May 2018 and June 2018). On a seasonally adjusted basis, average house prices in Scotland increased by 0.3% between May 2019 and June 2019.
The UK Property Transaction Statistics showed that on a non-seasonally adjusted basis, in the 3 months to June 2019 the estimated number of transactions on residential properties with a value of £40,000 or greater in Scotland was 24,640. This is down 7.4% compared with the 3 months to June 2018.
In Scotland, all property types showed an increase in average prices in June 2019 when compared with the same month in the previous year. Terraced houses showed the biggest increase, rising by 2.0% in the year to June 2019 to £127,000. The smallest increase of all property types was for detached houses, with an increase of 0.1% in the year to June 2019 to £254,000.
House prices increased over the last year in 20 out of 32 local authority areas. The biggest average price increase was in Stirling, where prices increased by 6.4% in the year to June 2019 to £190,000. The biggest fall was recorded in South Ayrshire, where average prices fell over the year by 5.3% to £131,000.
As with other indicators in the housing market, which typically fluctuate from month to month, it is important not to put too much weight on one month’s set of house price data.
3. Price change
3.1 Annual price change
Annual price change for Scotland over the past 5 years
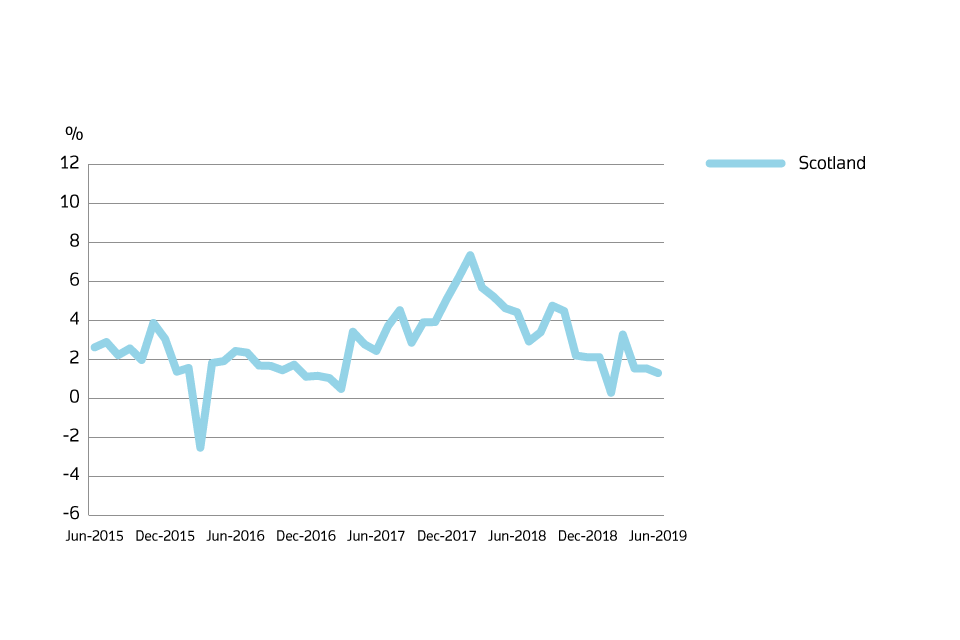
A chart showing the annual price change for Scotland over the past 5 years.
Download this chart’s data (CSV, 1KB)
In Scotland, average prices increased by 1.3% in the year to June 2019 (down from 1.5% in the year to May 2019).
Annual price change by local authority for Scotland
Low numbers of sales transactions in some local authorities, such as Orkney Islands, Na h-Eileanan Siar and Shetland Islands, can lead to volatility in the series.
While we make efforts to account for this volatility, the change in price in these local levels can be influenced by the type and number of properties sold in any given period.
Geographies with low number of sales transactions should be analysed in the context of their longer-term trends rather than focusing on monthly movements.
| Local authorities | June 2019 | June 2018 | Difference |
|---|---|---|---|
| Aberdeenshire | £187,402 | £189,637 | -1.2% |
| Angus | £141,627 | £142,620 | -0.7% |
| Argyll and Bute | £138,627 | £140,520 | -1.3% |
| City of Aberdeen | £152,877 | £158,562 | -3.6% |
| City of Dundee | £128,178 | £123,602 | 3.7% |
| City of Edinburgh | £263,233 | £255,612 | 3.0% |
| City of Glasgow | £134,162 | £129,370 | 3.7% |
| Clackmannanshire | £129,087 | £123,544 | 4.5% |
| Dumfries and Galloway | £126,454 | £121,786 | 3.8% |
| East Ayrshire | £94,765 | £92,766 | 2.2% |
| East Dunbartonshire | £210,842 | £205,748 | 2.5% |
| East Lothian | £221,060 | £221,456 | -0.2% |
| East Renfrewshire | £235,221 | £221,585 | 6.2% |
| Falkirk | £124,612 | £121,706 | 2.4% |
| Fife | £133,359 | £133,782 | -0.3% |
| Highland | £168,468 | £162,629 | 3.6% |
| Inverclyde | £107,126 | £106,443 | 0.6% |
| Midlothian | £182,697 | £180,788 | 1.1% |
| Moray | £156,539 | £152,053 | 3.0% |
| Na h-Eileanan Siar | £115,770 | £103,096 | 12.3% |
| North Ayrshire | £108,803 | £106,155 | 2.5% |
| North Lanarkshire | £106,938 | £107,132 | -0.2% |
| Orkney Islands | £159,573 | £148,188 | 7.7% |
| Perth and Kinross | £189,844 | £182,977 | 3.8% |
| Renfrewshire | £121,375 | £123,064 | -1.4% |
| Scottish Borders | £148,799 | £150,210 | -0.9% |
| Shetland Islands | £142,909 | £186,589 | -23.4% |
| South Ayrshire | £130,917 | £138,213 | -5.3% |
| South Lanarkshire | £127,453 | £125,668 | 1.4% |
| Stirling | £190,076 | £178,714 | 6.4% |
| West Dunbartonshire | £103,304 | £103,503 | -0.2% |
| West Lothian | £159,723 | £158,905 | 0.5% |
| Scotland | £151,891 | £149,960 | 1.3% |
Download this table’s data (CSV, 1KB)
Average price by local authority for Scotland
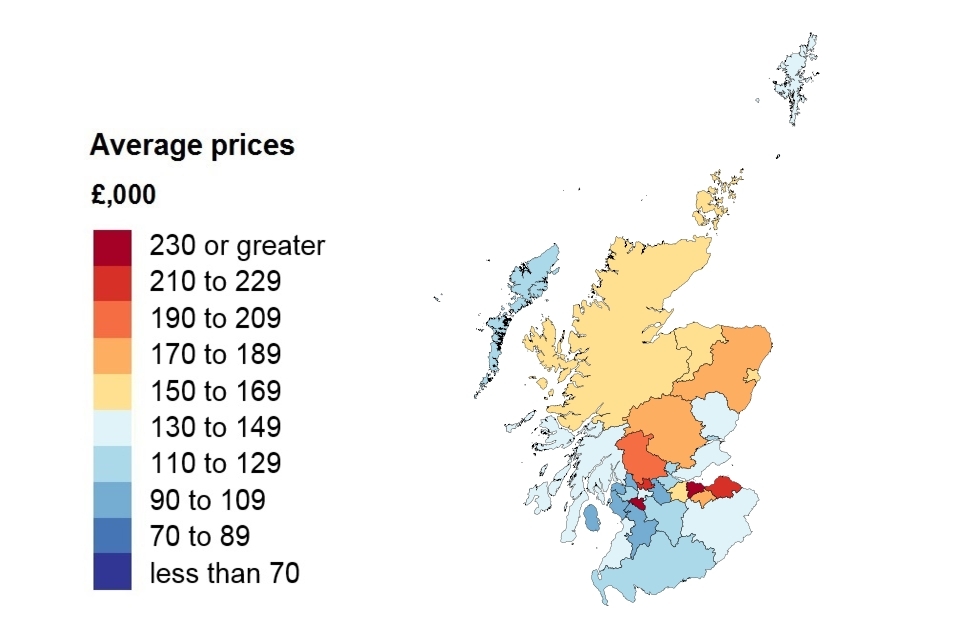
A heat map showing the average price by local authority for Scotland.
In June 2019, the most expensive area to purchase a house was City of Edinburgh, where the average cost of a house was £263,000. In contrast, the cheapest area to purchase a house was East Ayrshire, where the average cost of a house was £95,000.
3.2 Average price change by property type
Average price change by property type for Scotland
| Property type | June 2019 | June 2018 | Difference |
|---|---|---|---|
| Detached | £253,901 | £253,695 | 0.1% |
| Semi-detached | £159,516 | £156,573 | 1.9% |
| Terraced | £126,953 | £124,473 | 2.0% |
| Flat or maisonette | £110,950 | £109,531 | 1.3% |
| All | £151,891 | £149,960 | 1.3% |
Download this table’s data (CSV, 1KB)
4. Sales volumes
The amount of time between the sale of a property and the registration of this information varies. It typically ranges between 2 weeks and 2 months but can be longer. Volume figures for the most recent 2 months are not yet at a reliable level for reporting, so they are not included in the report. Published transactions for recent months will increase as later registered transactions are incorporated into the index.
Sales volume data is also available by property status (new build and existing property) and funding status (cash and mortgage) in our downloadable data tables. Transactions involving the creation of a new register, such as new builds, are more complex and require more time to process. Read Revisions to the UK HPI data for more information.
4.1 Sales volumes by local authority
Sales volumes for Scotland by local authority
| Local authorities | April 2019 | April 2018 |
|---|---|---|
| Aberdeenshire | 324 | 332 |
| Angus | 141 | 138 |
| Argyll and Bute | 158 | 125 |
| City of Aberdeen | 291 | 324 |
| City of Dundee | 220 | 193 |
| City of Edinburgh | 892 | 793 |
| City of Glasgow | 875 | 827 |
| Clackmannanshire | 70 | 64 |
| Dumfries and Galloway | 192 | 178 |
| East Ayrshire | 157 | 169 |
| East Dunbartonshire | 147 | 119 |
| East Lothian | 194 | 186 |
| East Renfrewshire | 113 | 109 |
| Falkirk | 233 | 236 |
| Fife | 588 | 544 |
| Highland | 311 | 325 |
| Inverclyde | 94 | 93 |
| Midlothian | 153 | 158 |
| Moray | 134 | 119 |
| Na h-Eileanan Siar | 26 | 26 |
| North Ayrshire | 189 | 169 |
| North Lanarkshire | 450 | 407 |
| Orkney Islands | 31 | 29 |
| Perth and Kinross | 206 | 245 |
| Renfrewshire | 282 | 277 |
| Scottish Borders | 146 | 163 |
| Shetland Islands | 14 | 18 |
| South Ayrshire | 183 | 177 |
| South Lanarkshire | 526 | 500 |
| Stirling | 120 | 102 |
| West Dunbartonshire | 106 | 112 |
| West Lothian | 246 | 238 |
| Scotland | 7,812 | 7,495 |
Note: The ‘Difference’ column has been removed from this table as the latest month’s data are not yet complete.
The estimate for April 2019 is calculated based on around 85% of the final registered transactions. The number of property transactions for April 2019 will increase as more transactions are incorporated into the index.
Comparing the provisional volume estimate for April 2018 with the provisional estimate for April 2019, volume transactions increased by 6.0% in Scotland.
UK Property Transaction Statistics published by HM Revenue & Customs (which differ in coverage but are more complete for this period) report that on a non-seasonally adjusted basis, volume transactions increased by 6.1% in Scotland in the year to April 2019.
Download this table’s data (CSV, 1KB)
4.2 Sales volumes
Sales volumes for Scotland over the past 5 years
| Date | Sales volumes for Scotland |
|---|---|
| April 2015 | 7,936 |
| April 2016 | 6,820 |
| April 2017 | 8,139 |
| April 2018 | 7,495 |
| April 2019 | 7,812 |
Download this chart’s data (CSV, 1KB)
5. Property status
Transactions involving the creation of a new register, such as new builds, are more complex and need more time to process. This means they can take longer to appear in the land registers. The volume of new build transactions for the most recent two months are not at a reliable level for reporting the breakdown between new build and existing resold property, so they are not included in the report.
New build and existing resold property for Scotland
| Property status | Average price April 2019 | Monthly change | Annual change |
|---|---|---|---|
| New build | £209,455 | 0.6% | 2.7% |
| Existing resold property | £148,124 | 0.9% | 1.4% |
Download this chart’s data (CSV, 1KB)
Note: since the October 2017 release, amendments have been made to our estimation model when calculating our provisional estimate. Find out further information and the impact of this change in methods used to produce the UK HPI.
6. Buyer status
First time buyer and former owner occupier for Scotland
| Type of buyer | Average price June 2019 | Monthly change | Annual change |
|---|---|---|---|
| First time buyer | £124,127 | 1.1% | 1.5% |
| Former owner occupier | £179,725 | 0.1% | 1.0% |
Download this chart’s data (CSV, 1KB)
7. Funding status
Cash and mortgage indicator for Scotland
| Funding status | Average price June 2019 | Monthly change | Annual change |
|---|---|---|---|
| Cash | £140,495 | 1.0% | 1.5% |
| Mortgage | £157,169 | 0.5% | 1.2% |
Download this chart’s data (CSV, 1KB)
8. Access the data
Download the data as CSV files or access it with our UK HPI tool.
Data revisions
View any revisions to previously published data in the data downloads or find out more about revisions in our guidance About the UK HPI.
9. About the UK House Price Index
The UK House Price Index (UK HPI) is calculated by the Office for National Statistics and Land & Property Services Northern Ireland. Find out about the methodology used to create the UK HPI.
Data for the UK House Price Index is provided by HM Land Registry, Registers of Scotland, The Land & Property Services/Northern Ireland Statistics & Research Agency and the Valuation Office Agency.
Find out more about the UK House Price Index.
10. Contact for Scotland queries
Garreth Jones, Land & Property Data Team, Registers of Scotland
Email Garreth.Jones@ros.gov.uk
Telephone 0131 378 4114