
UK House Price Index Scotland: May 2026
Updated 31 July 2026

© Crown copyright 2026
This publication is licensed under the terms of the Open Government Licence v3.0 except where otherwise stated. To view this licence, visit nationalarchives.gov.uk/doc/open-government-licence/version/3 or write to the Information Policy Team, The National Archives, Kew, London TW9 4DU, or email: psi@nationalarchives.gov.uk.
Where we have identified any third party copyright information you will need to obtain permission from the copyright holders concerned.
This publication is available at https://www.gov.uk/government/statistics/uk-house-price-index-for-may-2026/uk-house-price-index-scotland-may-2026
1. Headline statistics for May 2026
The average price of a property in Scotland was £196,000
The annual price change of a property in Scotland was 4.4%
The monthly price change of a property in Scotland was 1.5%
The index figure for Scotland (January 2023 = 100) was 111.7
Estimates for the most recent months are provisional and are likely to be updated as more data is incorporated into the index. Read the revision policies.
Next publication of UK HPI
The June 2026 UK HPI will be published at 9.30am on Wednesday 19 August 2026. See the calendar of release dates for more information.
2. Economic statement
Total transaction volumes and new build volumes available to calculate UK HPI estimates have increased recently. HM Land Registry has processed over 40% of HM Revenue & Customs’ provisional sales estimate for UK HPI’s first estimate in recent months, though transaction volumes for older periods and new build volumes remain lower than historical averages. Users should be aware that revisions may be larger than historically and should note the greater uncertainty around new build prices.
Users should be aware that revisions may be larger than historically and should note the greater uncertainty around new build prices.
On 20 August 2025, ONS introduced an improvement to HPI’s imputation method for Great Britain, which reduces initial over-estimation of new build estimates in provisional estimates. Since this methods improvement increases the accuracy of our initial estimates, we expect overall revisions between provisional (1st) and final revised (13th) UK HPI estimates to be smaller moving forwards. More detail about this methods improvement is available in section 4.9 of HMLR’s About the UK House Price Index document.
ONS will continue to monitor revisions and identify potential further methods improvements in the future. Further information is available in HM Land Registry’s UK House Price Index summary.
Average house prices in Scotland increased by 4.4% in the 12 months to May 2026, to £196,000 (provisional estimate). This is higher than the revised estimate of 3.2% in the 12 months to April 2026 and was higher than the average UK house price annual inflation of 2.7% (provisional estimate) in the 12 months to May 2026.
On a non-seasonally adjusted basis, average house prices in Scotland increased by 1.5% between April 2026 and May 2026 compared with an increase of 0.3% in the same period 12 months ago. On a seasonally adjusted basis, average house prices in Scotland increased by 1.0% between April 2026 and May 2026.
Comparing the provisional UK HPI volume estimate for May 2025 with the provisional UK HPI volume estimate for May 2026, the volume of transactions increased by 2.1% in Scotland and decreased by 36.7% in the UK.
In Scotland, detached houses had the highest annual percentage change out of all property types, increasing by 6.9% in the 12 months to May 2026 to £369,000. Flats and maisonettes had the lowest annual percentage change, which increased by 1.3% in the 12 months to May 2026 to an average price of £135,000.
In Scotland, 27 of the 32 local authority areas showed an increase in average house prices in the 12 months to May 2026. The highest annual percentage change was in Moray and South Ayrshire, where average house prices increased by 10.7% in the 12 months to May 2026 to £210,000 and £171,000 respectively. The lowest annual percentage change was in the City of Aberdeen, where average house prices decreased by 3.3% in the 12 months to May 2026, to £135,000.
As with other indicators in the housing market, which typically fluctuate from month to month, it is important not to put too much weight on one month’s set of house price data.
3. Price change
3.1 Annual price change
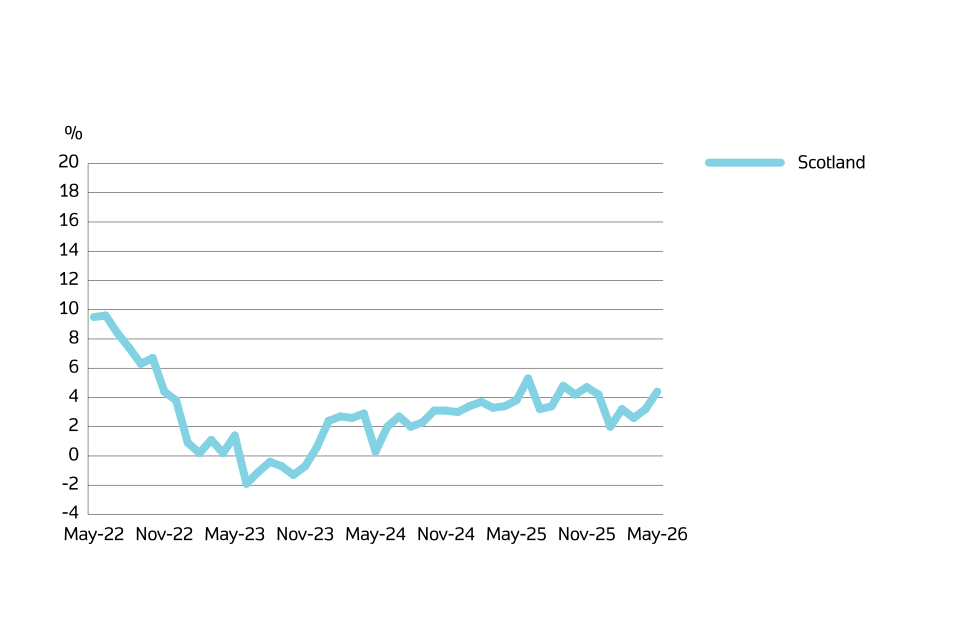
Annual price change for Scotland over the past 4 years
Download this chart’s data (CSV, 1KB)
In Scotland, average prices increased by 4.4% in the 12 months to May 2026 (provisional estimate), up from 3.2% in the 12 months to April 2026 (revised estimate).
Annual price change by local authority for Scotland
Low numbers of sales transactions in some local authorities, such as Orkney Islands, Na h-Eileanan Siar and Shetland Islands, can lead to volatility in the series.
While we make efforts to account for this volatility, the change in price in these local levels can be influenced by the type and number of properties sold in any given period.
Geographies with low number of sales transactions should be analysed in the context of their longer-term trends rather than focusing on monthly movements.
| Local authorities | May 2026 | May 2025 | Difference |
|---|---|---|---|
| Aberdeenshire | £197,722 | £198,351 | -0.3% |
| Angus | £172,638 | £166,936 | 3.4% |
| Argyll and Bute | £183,508 | £180,172 | 1.9% |
| City of Aberdeen | £134,507 | £139,089 | -3.3% |
| City of Dundee | £140,878 | £141,238 | -0.3% |
| City of Edinburgh | £296,471 | £289,587 | 2.4% |
| City of Glasgow | £189,448 | £184,858 | 2.5% |
| Clackmannanshire | £164,170 | £163,670 | 0.3% |
| Dumfries and Galloway | £166,678 | £162,466 | 2.6% |
| East Ayrshire | £134,530 | £123,855 | 8.6% |
| East Dunbartonshire | £274,687 | £249,259 | 10.2% |
| East Lothian | £291,237 | £279,749 | 4.1% |
| East Renfrewshire | £283,624 | £280,800 | 1.0% |
| Falkirk | £172,412 | £164,671 | 4.7% |
| Fife | £174,496 | £164,893 | 5.8% |
| Highland | £219,659 | £212,072 | 3.6% |
| Inverclyde | £108,689 | £105,423 | 3.1% |
| Midlothian | £280,952 | £272,827 | 3.0% |
| Moray | £209,866 | £189,508 | 10.7% |
| Na h-Eileanan Siar | £149,252 | £138,846 | 7.5% |
| North Ayrshire | £136,435 | £129,746 | 5.2% |
| North Lanarkshire | £156,327 | £148,705 | 5.1% |
| Orkney Islands | £214,237 | £220,129 | -2.7% |
| Perth and Kinross | £227,904 | £221,386 | 2.9% |
| Renfrewshire | £159,417 | £154,129 | 3.4% |
| Scottish Borders | £183,147 | £180,618 | 1.4% |
| Shetland Islands | £200,201 | £204,782 | -2.2% |
| South Ayrshire | £171,288 | £154,757 | 10.7% |
| South Lanarkshire | £181,586 | £172,670 | 5.2% |
| Stirling | £230,509 | £226,494 | 1.8% |
| West Dunbartonshire | £124,444 | £118,620 | 4.9% |
| West Lothian | £226,203 | £217,368 | 4.1% |
| Scotland | £195,543 | £187,312 | 4.4% |
Download this table’s data (CSV, 1KB)
Average price by local authority for Scotland
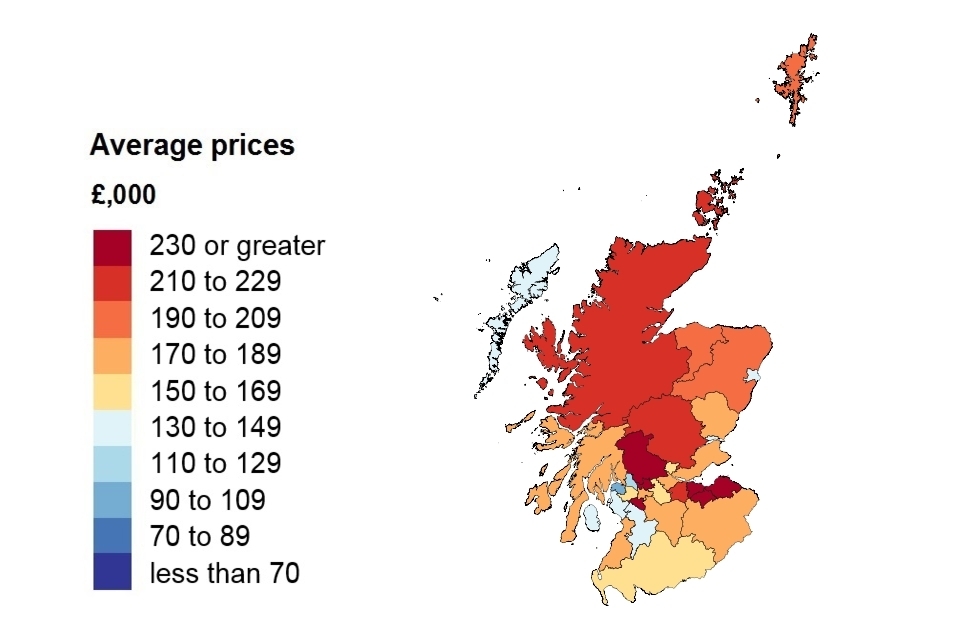
In May 2026, the most expensive area to purchase a property was The City of Edinburgh, where the average cost was £296,000. In contrast, the cheapest area to purchase a property was Inverclyde, where the average cost was £109,000.
3.2 Average price change by property type
Average price change by property type for Scotland
| Property type | May 2026 | May 2025 | Difference |
|---|---|---|---|
| Detached | £369,160 | £345,219 | 6.9% |
| Semi-detached | £224,519 | £210,540 | 6.6% |
| Terraced | £180,534 | £170,949 | 5.6% |
| Flat or maisonette | £135,153 | £133,470 | 1.3% |
| All | £195,543 | £187,312 | 4.4% |
Download this table’s data (CSV, 1KB)
4. Sales volumes
The amount of time between the sale of a property and the registration of this information varies. It typically ranges between 2 weeks and 2 months but can be longer. Volume figures for the most recent 2 months are not yet at a reliable level for reporting, so they are not included in the report. Published transactions for recent months will increase as later registered transactions are incorporated into the index.
Sales volume data is also available by property status (new build and existing property) and funding status (cash and mortgage) in our downloadable data tables. Transactions involving the creation of a new register, such as new builds, are more complex and require more time to process. Read Revisions to the UK HPI data for more information.
4.1 Sales volumes by local authority
Comparing the provisional volume estimate for the current month with the revised volume estimate for the corresponding month in the previous year.
Sales volumes for Scotland by local authority
| Local authorities | March 2026 | March 2025 |
|---|---|---|
| Aberdeenshire | 319 | 352 |
| Angus | 132 | 154 |
| Argyll and Bute | 128 | 161 |
| City of Aberdeen | 409 | 395 |
| City of Dundee | 233 | 187 |
| City of Edinburgh | 803 | 849 |
| City of Glasgow | 820 | 786 |
| Clackmannanshire | 56 | 57 |
| Dumfries and Galloway | 235 | 165 |
| East Ayrshire | 161 | 195 |
| East Dunbartonshire | 126 | 120 |
| East Lothian | 208 | 180 |
| East Renfrewshire | 107 | 97 |
| Falkirk | 201 | 196 |
| Fife | 460 | 488 |
| Highland | 312 | 353 |
| Inverclyde | 79 | 122 |
| Midlothian | 166 | 155 |
| Moray | 117 | 112 |
| Na h-Eileanan Siar | 29 | 26 |
| North Ayrshire | 221 | 212 |
| North Lanarkshire | 428 | 421 |
| Orkney Islands | 15 | 20 |
| Perth and Kinross | 238 | 244 |
| Renfrewshire | 270 | 247 |
| Scottish Borders | 149 | 167 |
| Shetland Islands | 12 | 18 |
| South Ayrshire | 167 | 165 |
| South Lanarkshire | 493 | 509 |
| Stirling | 124 | 113 |
| West Dunbartonshire | 129 | 94 |
| West Lothian | 308 | 276 |
| Scotland | 7,655 | 7,636 |
Note: The ‘Difference’ column has been removed from this table as the latest month’s data are not yet complete.
Note: The number of property transactions for March 2026 will increase as more transactions are incorporated into the index. See our Revisions Policy for more information.
Comparing provisional UK HPI volume estimates for March 2025 with the provisional UK HPI volume estimate for March 2026, volume transactions increased by 2.1% in Scotland.
UK Property Transaction Statistics published by HM Revenue & Customs (which differ in coverage but are more complete for this period) report that in the 12 months to March 2026, on a non-seasonally adjusted basis, HMRC volume transactions increased by 1.0% in Scotland.
Download this table’s data (CSV, 1KB)
4.2 Sales volumes
Sales volumes for Scotland over the past 5 years
| Date | Sales volumes for Scotland |
|---|---|
| March 2022 | 8,199 |
| March 2023 | 8,146 |
| March 2024 | 7,797 |
| March 2025 | 7,636 |
| March 2026 | 7,655 |
Download this chart’s data (CSV, 1KB)
5. Property status
Transactions involving the creation of a new register, such as new builds, are more complex and need more time to process. This means they can take longer to appear in the land registers. The volume of new build transactions for the most recent 2 months are not at a reliable level for reporting the breakdown between new build and existing resold property, so they are not included in the report.
New build and existing resold property for Scotland
| Property status | Average price March 2026 | Monthly change | Annual change |
|---|---|---|---|
| New build | £318,371 | 2.7% | 8.9% |
| Existing resold property | £176,188 | -0.2% | 2.0% |
Download this chart’s data (CSV, 1KB)
Note: As set out in Section 2, users should be aware that revisions may be larger than historically and should note the greater uncertainty around new build prices. Since the October 2017 release, amendments have been made to our estimation model when calculating our provisional estimate. Find out further information and the impact of this change in methods used to produce the UK HPI.
6. Buyer status
First time buyer and former owner occupier for Scotland
| Type of buyer | Average price May 2026 | Monthly change | Annual change |
|---|---|---|---|
| First time buyer | £158,895 | 0.9% | 3.5% |
| Former owner occupier | £246,540 | 1.9% | 5.3% |
Download this chart’s data (CSV, 1KB)
We have identified an error in the calculation of first-time buyer and former owner occupier prices prior to January 2026. We advise caution when comparing breakdowns for first time buyers and former owner occupiers before and after the January 2026 estimates.
7. Funding status
Cash and mortgage indicator for Scotland
| Funding status | Average price May 2026 | Monthly change | Annual change |
|---|---|---|---|
| Cash | £180,158 | 1.3% | 3.9% |
| Mortgage | £203,590 | 1.6% | 4.7% |
Download this chart’s data (CSV, 1KB)
8. Access the data
Download the data as CSV files or access it with our UK HPI tool.
Data revisions
View any revisions to previously published data in the data downloads or find out more about revisions in our guidance About the UK HPI.
9. About the UK House Price Index
The UK House Price Index (UK HPI) is calculated by the Office for National Statistics and Land & Property Services Northern Ireland. Find out about the methodology used to create the UK HPI.
Data for the UK House Price Index is provided by HM Land Registry, Registers of Scotland, The Land & Property Services/Northern Ireland Statistics & Research Agency and the Valuation Office Agency.
Find out more about the UK House Price Index.
10. Contact for Scotland queries
Garreth Jones, Land & Property Data Team, Registers of Scotland
Email garreth.jones@ros.gov.uk
Telephone 0131 378 4114