UK House Price Index summary: April 2016
Published 14 June 2016

© Crown copyright 2016
This publication is licensed under the terms of the Open Government Licence v3.0 except where otherwise stated. To view this licence, visit nationalarchives.gov.uk/doc/open-government-licence/version/3 or write to the Information Policy Team, The National Archives, Kew, London TW9 4DU, or email: psi@nationalarchives.gov.uk.
Where we have identified any third party copyright information you will need to obtain permission from the copyright holders concerned.
This publication is available at https://www.gov.uk/government/statistics/uk-house-price-index-april-2016/uk-house-price-index-april-2016
1. Headline statistics
For April 2016:
- the average price of a property in the UK was £209,054
- the annual price change for a property in the UK was 8.2%
- the monthly price change for a property in the UK was 0.6%
- the monthly index figure for the UK was 109.6 (January 2015 = 100)
2. Economic statement
Continuing price pressures in the housing market have coincided with strong demand indicators relative to supply indicators in recent months. However following higher rates of Stamp Duty Land Tax and Land and Buildings Transaction Tax on additional properties in England, Wales, Northern Ireland and Scotland, there are indications of a cooling in the market in April 2016.
The timing of the stamp duty tax seems to have cooled demand on the month, but this follows a period of increases in activity. Following six months of consecutive increases, the volume of lending approvals for house purchases fell by 5.8% in April 2016 compared to the previous month, to its lowest level since May 2015. The number of UK home sales continued to grow in the three months to April 2016 (February to April): rising by 8.3% relative to the preceding three months (November to January), although sales fell by 45.2% in April 2016 compared with March 2016. Data from the Royal Institution of Chartered Surveyors (RICS) also suggests that in April 2016, buyer demand contracted for the first time following continuous growth since March 2015.
Indicators of supply in the housing market were more mixed. The Bank of England’s Agents’ Summary of Business Conditions for May 2016 reported a shortage of secondary market housing supply, while RICS reported that general supply (new instructions to sell) continued to fall in April. However, the latest ONS Output in the Construction Industry release indicated that new-build housing output increased by 3.4% in the previous three months (January to March) compared to the same period a year earlier.
3. Price changes
3.1 Annual price change
Annual price change for UK by country over the past five years
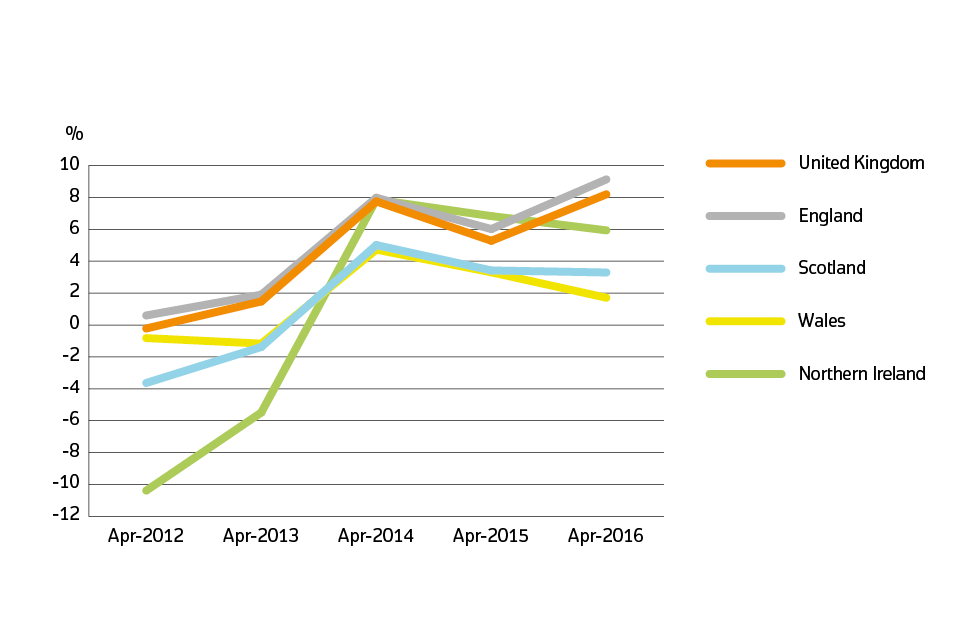
Annual price change 2011 to 2016 by country
3.2 Average price by country and government office region
Price, monthly change and annual change by country and government office region
| Country and government office region | Price | Monthly change | Annual change |
|---|---|---|---|
| Northern Ireland (Quarter 1 - 2016) | £117,524 | -1.0% | 5.9% |
| Scotland | £138,445 | 1.5% | 3.3% |
| Wales | £139,385 | -1.9% | 1.7% |
| England | £224,731 | 0.7% | 9.1% |
| North West | £145,149 | 2.3% | 5.8% |
| East Midlands | £167,762 | 1.6% | 7.8% |
| Yorkshire and The Humber | £146,712 | 1.6% | 6.0% |
| East of England | £263,420 | 1.2% | 13.6% |
| South East | £301,689 | 0.3% | 12.3% |
| South West | £227,404 | -2.8% | 6.0% |
| London | £470,025 | 0.6% | 14.5% |
| West Midlands Region | £173,321 | 2.2% | 7.1% |
| North East | £121,719 | -0.9% | 0.1% |
Price changes by country and government office region
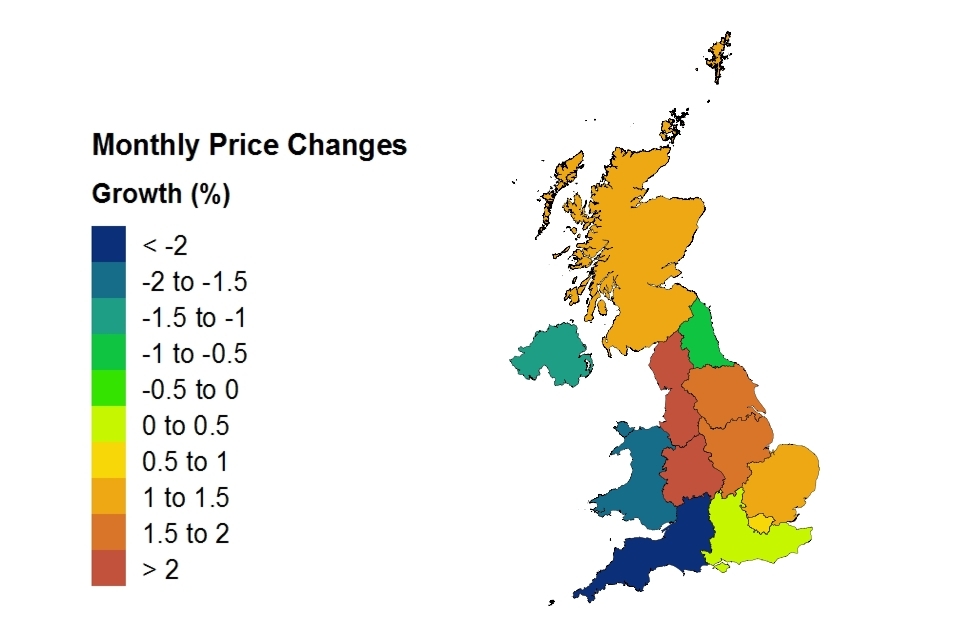
Price changes by country and government office region
3.3 Average price by property type
Average monthly price by property type
| Property type | April 2016 | April 2015 | Difference |
|---|---|---|---|
| Detached | £310,364 | £290,900 | 6.7% |
| Semi-detached | £197,168 | £181,200 | 8.8% |
| Terraced | £171,298 | £157,103 | 9.0% |
| Flat or maisonette | £187,793 | £173,968 | 8.0% |
| All | £209,054 | £193,225 | 8.2% |
4. Sales volumes
Due to a period of 2 to 8 weeks between completion and registration of sales, volume figures for the most recent two months are not yet complete, so they are not included in the report.
4.1 Sales volumes: February 2016
Number of sales by country
| Country | February 2016 | February 2015 | Difference |
|---|---|---|---|
| England | 56,884 | 56,261 | 1.1% |
| Northern Ireland (Quarter 1 - 2016) | 5,272 | 4,555 | 15.7% |
| Scotland | 5,507 | 5,113 | 7.7% |
| Wales | 2,796 | 2,686 | 4.1% |
4.2 Sales volumes for the UK over the past 5 years
Sales volumes for 2012 to 2016 by country: February 2016
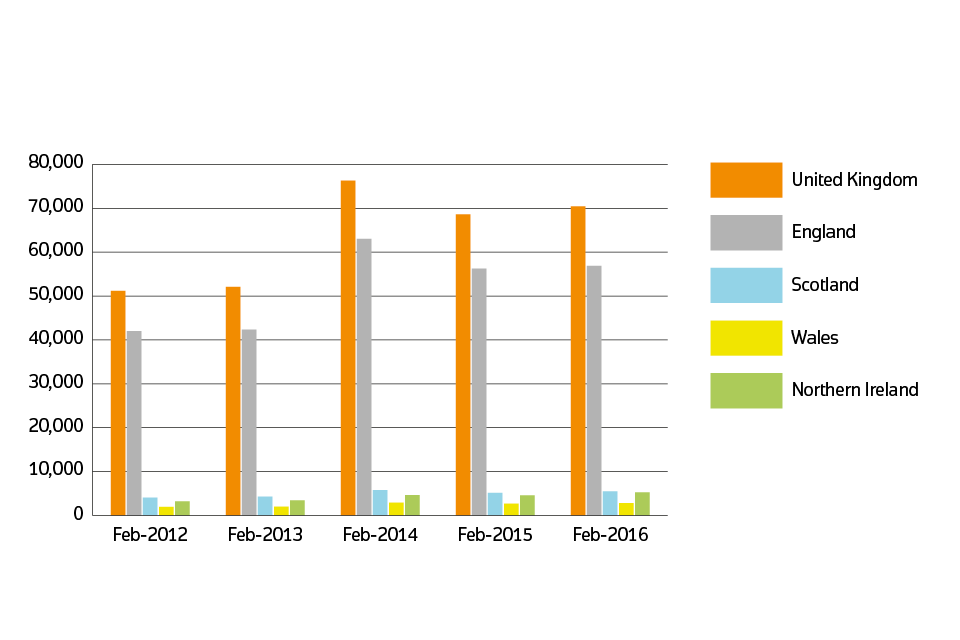
Sales volumes for 2011 to 2016 by country: February 2016
5. Property status for UK
New build and existing resold property
| Property Status | Average price | Monthly change | Annual change |
|---|---|---|---|
| New build | £254,604 | 4.6% | 10.2% |
| Existing resold property | £205,914 | 0.3% | 8.0% |
6. Buyer status
First time buyer and former owner occupier
For Great Britain only, Northern Ireland data is not available for buyer status.
| Type of buyer | Average price | Monthly change | Annual change |
|---|---|---|---|
| First time buyer | £176,773 | 0.9% | 8.2% |
| Former owner occupier | £242,109 | 0.4% | 8.4% |
7. Funding status for Great Britain
Cash and mortgage
For Great Britain only, Northern Ireland data is not available for funding status.
| Funding status | Average price | Monthly change | Annual change |
|---|---|---|---|
| Cash | £198,492 | 0.0% | 7.3% |
| Mortgage | £218,490 | 0.9% | 8.8% |
8. About the UK House Price Index
The UK House Price Index (UK HPI) is calculated by the Office for National Statistics and Land & Property Services Northern Ireland. Find out about the methodology used to create the UK HPI.
Data for the UK House Price Index is provided by Land Registry, Registers of Scotland, Land & Property Services Northern Ireland and the Valuation Office Agency.
Find out more about the UK House Price Index.
9. Access the data
Download the data as CSV files or access it with our UK HPI tool.
10. Contact
Eileen Morrison, Data Services Team Leader, HM Land Registry
Email eileen.morrison@landregistry.gov.uk
Telephone 0300 006 5288
Ian Boreham, Head of Housing Market Indices, Office for National Statistics
Email ian.boreham@ons.gov.uk
Telephone 01633 456228
Ciara Cunningham, Statistician for the Northern Ireland HPI
Email ciara.cunningham@finance-ni.gov.uk
Telephone 028 90 336035