UK Business Data Survey 2021: detailed findings
Published 17 May 2022

© Crown copyright 2022
This publication is licensed under the terms of the Open Government Licence v3.0 except where otherwise stated. To view this licence, visit nationalarchives.gov.uk/doc/open-government-licence/version/3 or write to the Information Policy Team, The National Archives, Kew, London TW9 4DU, or email: psi@nationalarchives.gov.uk.
Where we have identified any third party copyright information you will need to obtain permission from the copyright holders concerned.
This publication is available at https://www.gov.uk/government/statistics/uk-business-data-survey-2021/uk-business-data-survey-2021-detailed-findings
1. Summary
This release follows the UKBDS 2020 summary report published in May 2021 and contains further measures and breakdowns from the survey. It is accompanied by Excel tables containing almost all questions (subject to sample sizes) broken down by business size, sector and UK ITL 1 region.
Key findings:
- Most businesses with 10 or more employees collect some form of digitised data.
- Excluding data collected from employees, 65% of UK businesses collect personal data and 50% collect non-personal data.
Among businesses that collect digitised data:
- 12% either send data internationally or receive data from outside of the UK (equivalent to 10% of all UK Businesses).
- 65% have heard of the Information Commissioner’s Office (ICO).
Among businesses that collect digitised personal or employee data:
- 18% say they share personal data to businesses outside of their organisation
- 17% collect data classified as ‘Special Category’ data
- 64% have a privacy management framework or data protection strategy in place
- 58% agreed that the introduction of GDPR had led to increased awareness of data protection at a senior level
Among businesses that transfer data internationally:
- 47% have either a great deal or a fair amount of knowledge about the legal compliance necessarily to transfer personal data outside of the UK
- 51% transfer both personal data and non-personal data
- 76% transfer data to Europe, and 62% transfer to North America
Demographic trends:
- Larger businesses tended to have greater levels of data use than sole traders and micro businesses (for example, they were more likely to share personal data, transfer data internationally, to use data for internal R&D or to improve marketing or sales performance).
- Businesses in the Finance and Insurance sector were more likely to share personal data than other sectors and businesses in the information and communication sector were more likely to transfer data internationally than businesses in other sectors.
- There were very few statistically significant differences in data use across UK regions.
2. Introduction
2.1 Code of practice for statistics
The UK Business Data Survey (UKBDS) is an official statistic and has been produced to the standards set out in the Code of Practice for Statistics.
2.2 Background
The Department for Digital, Culture, Media and Sport (DCMS) commissioned the UK Business Data Survey to help the Department understand the significance of data to industry, what it is used for and how it drives the economy. It also seeks to develop the evidence base around the international flow of data and difficulties encountered, as well the understanding amongst industry of the relevant regulatory framework.
This first survey was carried out by IFF Research. It covers:
- use of digitised data
- awareness and attitudes towards data protection and the ICO
- international movement of data
- differences by size, sector and region
2.3. Methodology
DCMS commissioned IFF Research to carry out a questionnaire-based telephone survey of 4,500.
UK businesses from 10 November 2020 to 29 January 2021.
The samples were selected to provide robust coverage by UK region, business size.
(number of employees) and sector. Weighting by Industry sector and number of employees was applied to the data to ensure that the results reflect the UK business population.
Many questions were asked to a subsection of the overall sample. Where this is the case, it has been indicated in the supporting text.
A screening and question routing process was employed to minimise occasions when businesses initially said they do not collect or use data but in fact do. It was helpful to define what is meant by ‘data’ for the purposes of this research, and the definition given to respondents at the beginning of the interviews was as follows:
Digitised information that your organisation may hold, for example things such as financial records and names and addresses of employees and customers. All businesses use data in some form, and we are interested in speaking with all businesses even if you only deal with a small amount of digitised data.
The survey focussed on digitised data since, although non-digitised personal data (such as paper records) is covered by data protection legislation, it is thought that digitised data is by far the more prevalent form, and increasingly so. As such, it was considered better to concentrate the limited sample on businesses that use digital data.
More technical details and a copy of the questionnaire are available in the Technical Report published separately.
2.3.1 How to interpret the data
The survey results are estimates and subject to margins of error, which vary with the size of the sample and the percentage figure concerned. Percentage results, and subgroup differences by size and sector, have been highlighted only where statistically significant (at the 95% confidence level).
In some of the charts that show breakdowns by business size, there appears to be a linear relationship between the result and business size. However, this cannot be inferred as the categories have different widths (and the ‘large’ category is open-ended).
2.3.2 Subgroup definitions and conventions
For businesses, analysis by size splits the population into:
- sole traders (0 employees)
- micro businesses (1 to 9 employees)
- small businesses (10 to 49 employees)
- medium businesses (50 to 249 employees)
- large businesses (250 employees or more)
3. General data use
All businesses were asked whether they collect digitised data in any form, in order to understand how widespread digitised data use is among businesses in the UK. A distinction was also made between whether they handle data from their employees, other forms of personal data and other forms of non-personal data. Each question in the report will specify which subgroup of businesses were asked each question.
Those who only handled non-digitised data were not included in the figures for overall data use, and are not included in further measures in this report after this chapter. They were asked a small number of follow up questions, such as reasons for not using digitised data, and figures for these questions can be found in the accompanying data tables.
An estimated 81% of UK businesses handle digitised personal data, digitised non-personal data, or both, and almost all businesses with ten or more employees do. Use of digitised data is consistently high (over 90%) amongst all employers. Sole traders show a lower rate of digitised data use, even when compared with micro businesses (1 to 9 employees). This split suggests that handling digitised data may be driven in part by the need to maintain employee records.
Figure 1: Percentage of businesses that said they handle any form of digitised data
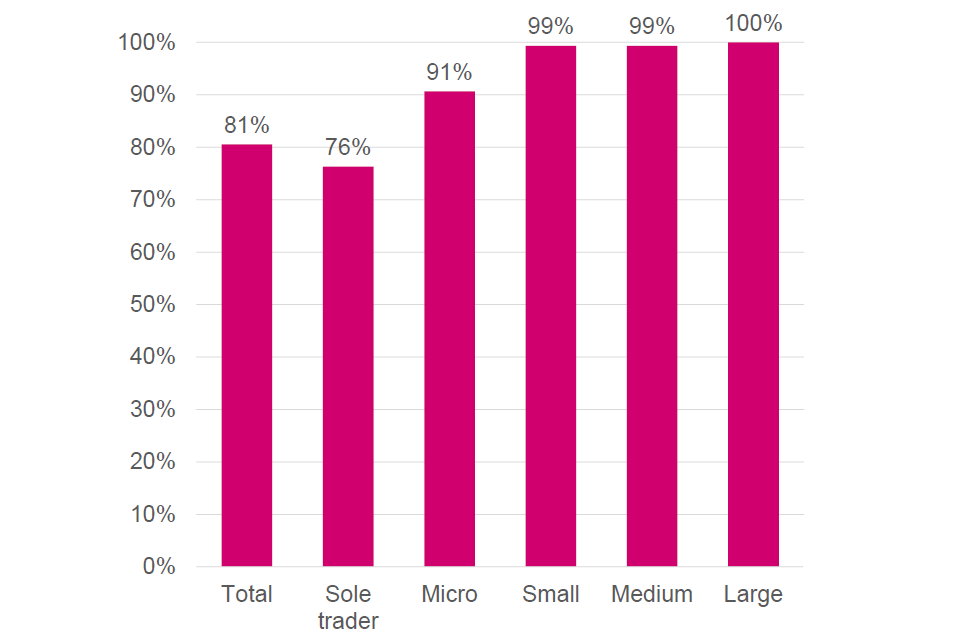
Base: 4,500 UK businesses
The data tables published alongside this release show this information broken down by sector and UK region. Across sectors, digitised data use in the Finance and Insurance sector is higher, with 3% not using digitised data. It is likely that different sectors may have different needs and uses for digitised data services.
When looking at types of data collected from sources other than employees, 65% of businesses collect personal data and 50% collect non-personal data.
Figure 2: Types of data collected by UK businesses from sources other than employees
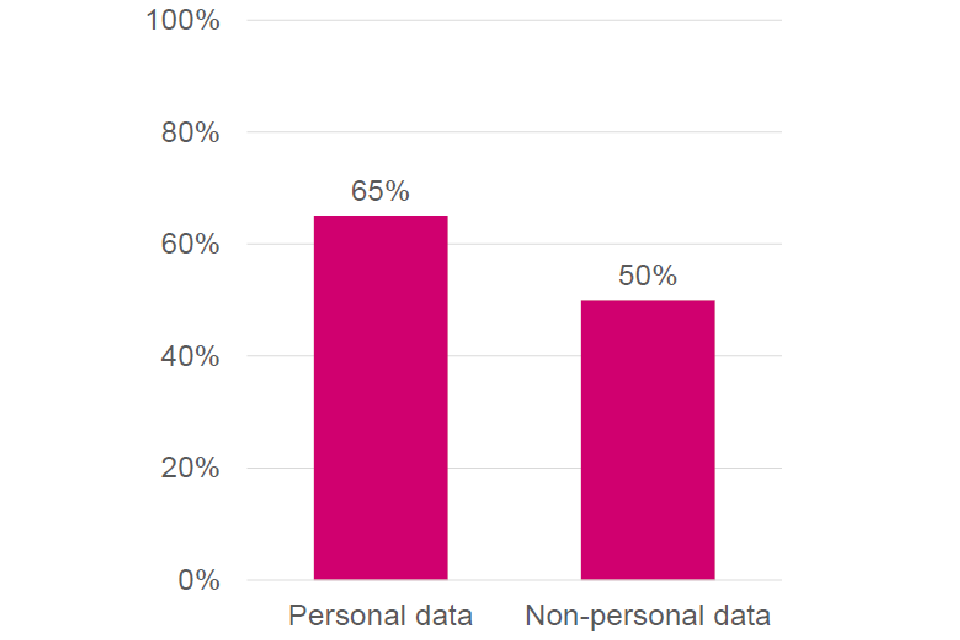
Base: 4,500 UK businesses. These figures include both firms that (1) responded that they use digital data when asked directly, and (2) initially indicated they did not but confirmed they used digitised data later in the survey. A previous bulletin on these survey findings published in May 2021 presented these statistics only including the first group — businesses that said directly they handle digitised data — giving 63% and 48% of businesses rather than 65% and 50% as presented above.
4. How businesses use data
The following section explores how businesses use data. In 2020, the Department for Digital, Culture, Media and Sport published the National Data Strategy outlining 5 key missions. Mission 1 aims to ‘unlock the value of data across the economy’, through the actions outlined in the Mission 1Policy Framework published in November 2021. This includes a focus on promoting availability, access and use of data amongst businesses to support innovation and growth, and overcoming barriers to data-sharing in the private sector. This chapter outlines levels of data-sharing among businesses in 2020, as well as how data is acquired and used amongst businesses.
The chapter explores:
- how both personal and non-personal data is acquired by businesses
- businesses’ use of data, including for purposes such as improving marketing and sales performance or for internal R&D
- main sources from which businesses receive personal data
- importance of data to businesses, based on their dependence on data and nature of the sector
- use of personal and non-personal data by businesses to generate insight
- types of sensitive personal data processed by businesses
- types of consent sought from the customers to collect, store and share R&D
4.1 Where businesses receive personal data
Businesses that collect digitised personal or employee data were asked about the sources from which they receive this data. The majority of these businesses (an estimated 85%) receive personal data from employees, customers or other individuals. These estimates are broadly consistent across business size, ranging from 83% of sole traders to 91% of large businesses. However, amongst all business sizes this was the most common way of acquiring personal data.
Overall, 25% of businesses received personal data from other businesses, and this figure ranged from between 25% and 28% for businesses with fewer than 50 employees, to 51% of large businesses.
Figure 3: Sources from which businesses receive personal data
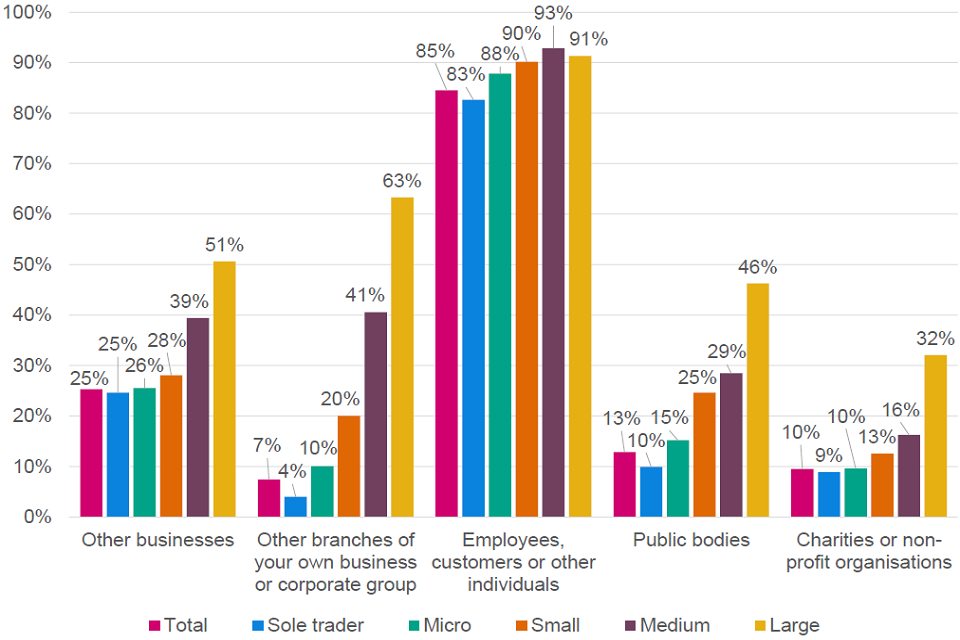
Base: 3,630 UK businesses that collect digitised personal or employee data; 1,216 Sole trader, 1,200 Micro, 738 Small, 315 Medium, 150 Large.
4.2 How businesses acquire personal data
Businesses with employees almost universally collect personal data from them, and so it is helpful to distinguish between personal data collected from employees and that collected from other sources. Most businesses (93%) that collect personal data (other than just from employees) do so through individuals volunteering information, a pattern consistent across businesses of all sizes.
Figure 4: Acquisition of personal data
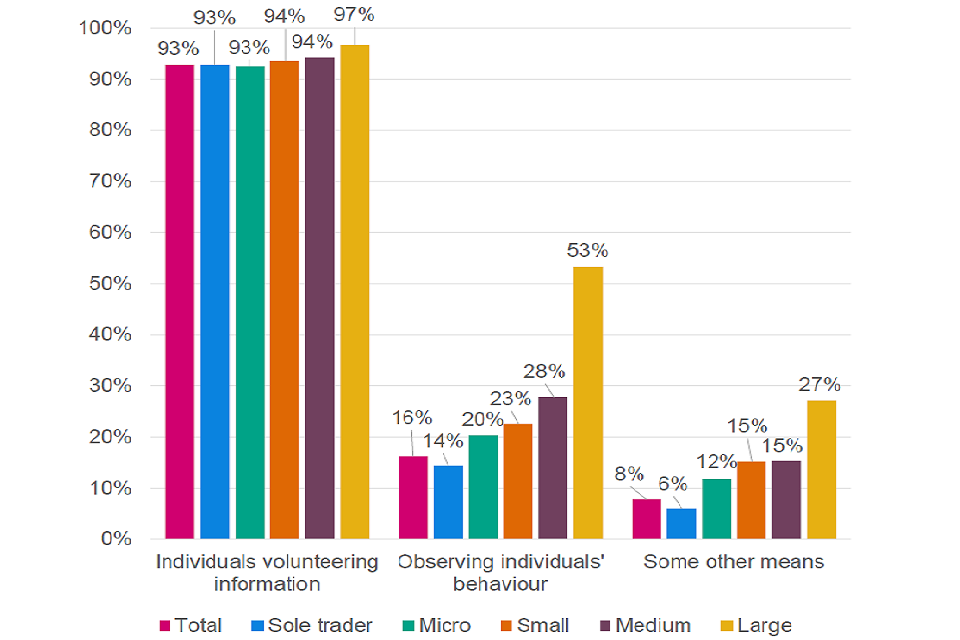
Base: 3,136 UK Businesses that process personal data other than employee data; 1,216 Sole trader, 960 Micro, 554 Small, 258 Medium, 137 Large.
A smaller percentage (16%) acquire personal data from individuals through observing their behaviour (for example, their actions on the business’s website), however this figure rises to 53% for large businesses.
4.3 Sharing of personal data
An estimated 18% of businesses that handle digitised personal data (other than just from their employees) share personal data with other organisations or businesses. There are, however, differences between business sizes, with 62% of large businesses sharing personal data compared with between 15% and 40% of other businesses.
Figure 5: Percentage of businesses that process personal data that share personal data with other organisations by business size
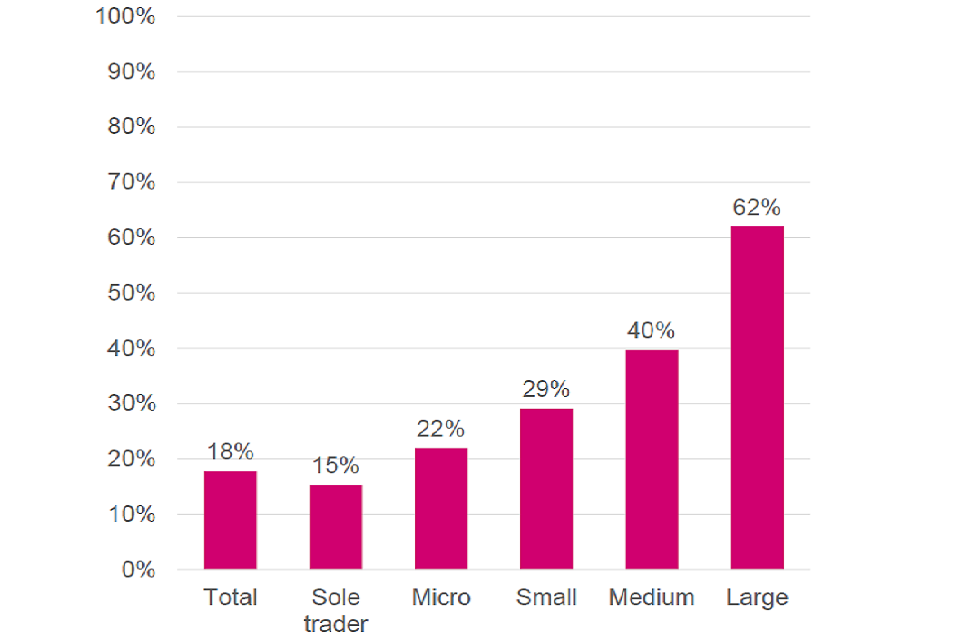
Base: 3,136 UK Businesses that handle personal data other than employee data; 1,216 Sole trader, 960 Micro, 554 Small, 258 Medium, 137 Large.
The two sectors most likely to say they share personal data with other organisations are Finance and Insurance (59%) and Real Estate (39%).
Figure 6: Percentage of businesses that process personal data that share personal data with other organisations by sector
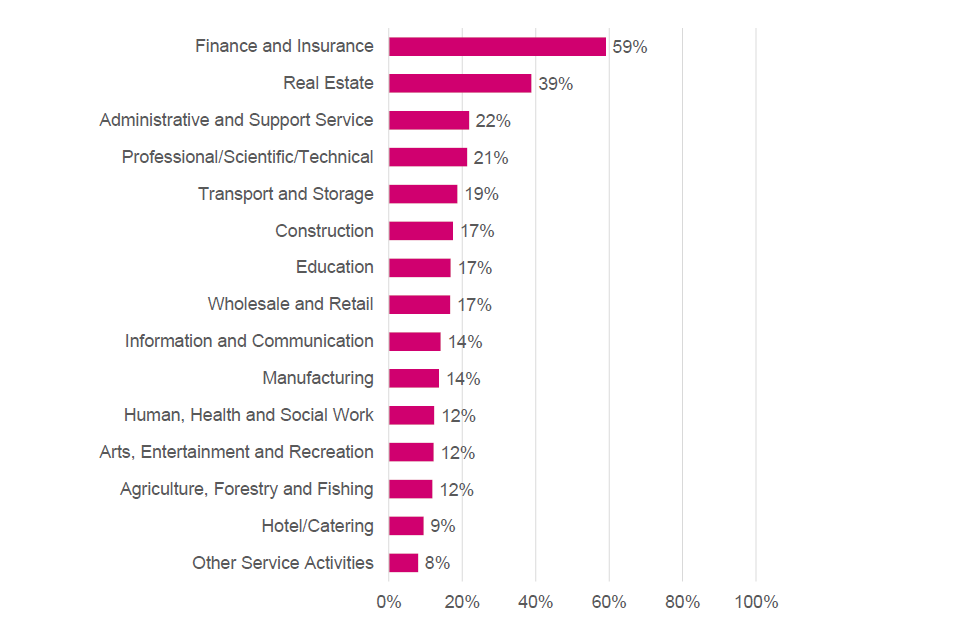
Base: 3,136 UK Businesses that handle personal data other than employee data.
4.4 Processing of non-personal data
Businesses that handle digitised non-personal data were asked if they generate or acquire this data, and if they share it externally. An estimated 47% of these businesses said they acquire or generate non-personal data, and 8% said they share non-personal data externally. In both cases, the figures were higher for large businesses. This is particularly notable for non-personal data sharing, with 32% of large businesses sharing externally, compared with between 7% and 17% of other businesses.
Figure 7: Acquisition and sharing of non-personal data by businesses
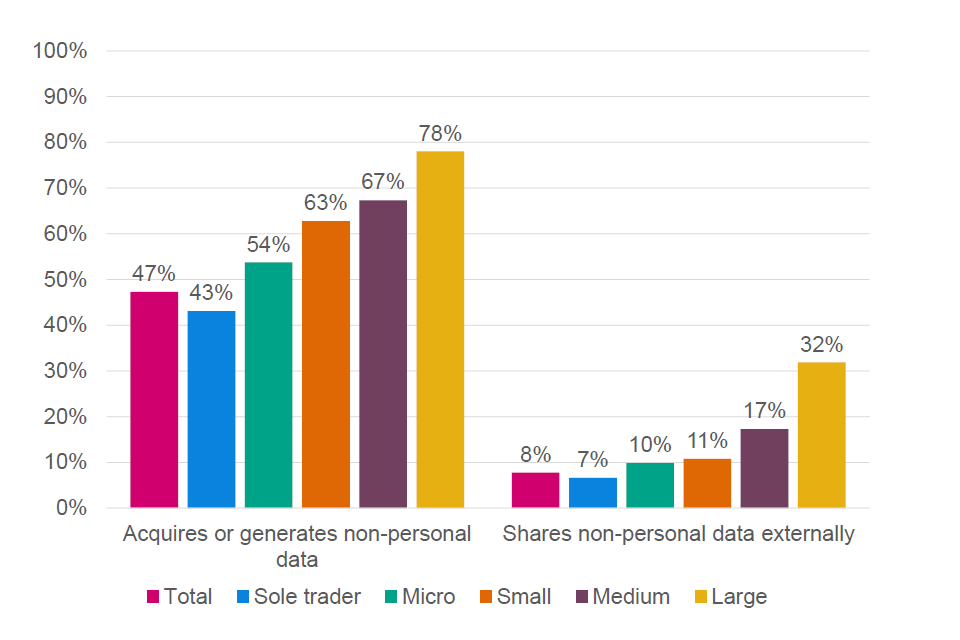
Base: 2,600 UK Businesses that handle non-personal data other than employee data; 909 Sole trader, 795 Micro , 517 Small, 241 Medium, 132 Large.
4.5 Analysing data to generate insights or knowledge
Those businesses that process both personal and non-personal data were asked if they analyse data to generate insight and knowledge. About a quarter (26%) of businesses among that subgroup analyse data for this purpose, with large businesses being more likely to do this than other businesses.
Figure 8: Percentage of businesses using personal and non-personal data to generate insights or knowledge
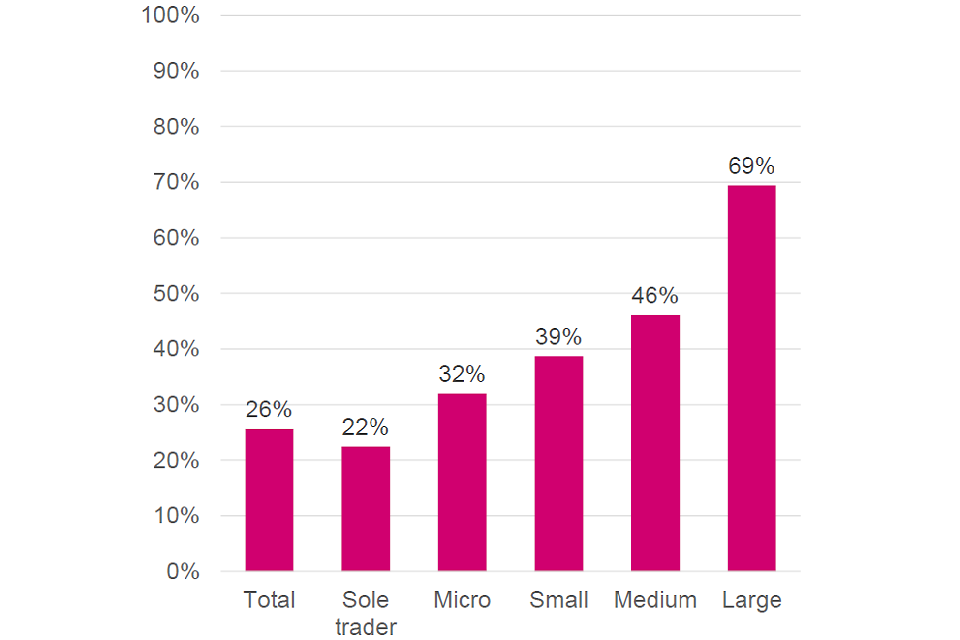
Base: 3,685 UK Businesses that process personal and non-personal data other than employee data; 1,464 Sole trader, 1,134 Micro, 641 Small, 290 Medium, 145 Large.
4.6 Employment of staff for data-focussed roles
Businesses that handle personal data and that employ staff were asked about the staff they employ. Of those businesses, 41% employ staff responsible for data use to improve marketing and sales performance and 37% employ someone to lead on the use of data for internal research and development.
When comparing different sized businesses, there is a greater tendency for large businesses to employ people into these roles than micro businesses, which may be expected due to the larger number of staff they employ overall. There does not appear to be a significant difference in the likelihood of businesses employing either of the two roles among any business size group.
Figure 9: Percentage of businesses that handle digitised personal data and that employ staff responsible for using data to improve sales performance and/or for internal R&D (excludes sole traders)
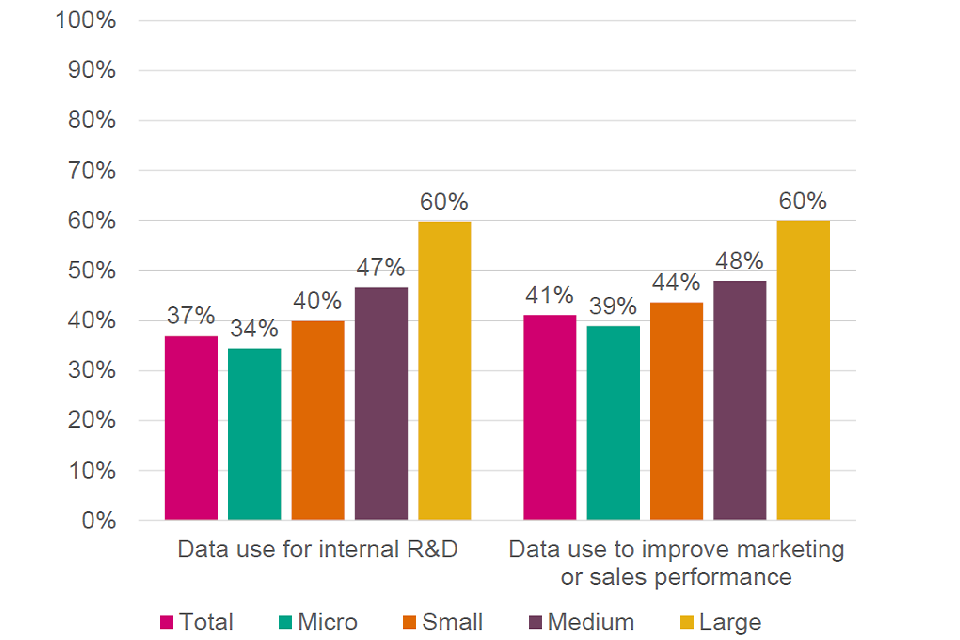
Base: 1,909 responses from businesses that collect digitised personal data and employ staff; 960 Micro, 554 Small, 258 Medium, 137 Large.
4.7 Processing sensitive data
Businesses that handle personal data were asked if they collect certain types of data that are considered sensitive (for example, data on children, health or criminal records). An estimated 16% of businesses that handle personal data collect personal data on children and young people (those under 18), 17% collect ‘Special Category’ data and 11% collect data on criminal convictions and offences.
‘Special Category’ includes, for example, data revealing information on health, racial or ethnic origin, and political opinions.
Figure 10: Types of sensitive personal data processed by businesses
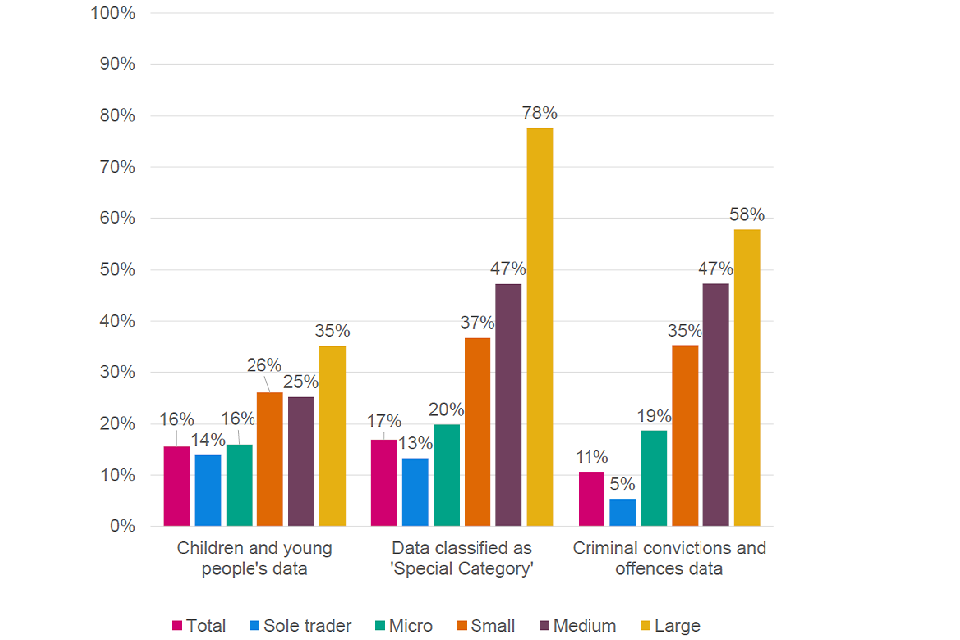
Base: 3,136 businesses that handle personal data other than employee data; 1,216 Sole trader, 960 Micro, 554 Small, 258 Medium, 137 Large.
Large businesses were generally more likely to collect all forms of these types of data than sole traders or micro businesses. Large businesses were more likely to collect Special Category data than data on children or criminal convictions.
There are some differences across sectors which are perhaps unsurprising, and likely to relate to the nature of those businesses. For example, the Education sector (60%) was more likely to collect data on children and young people than the other sectors.
Figure 11: Processing of types of personal data that are classified as especially sensitive
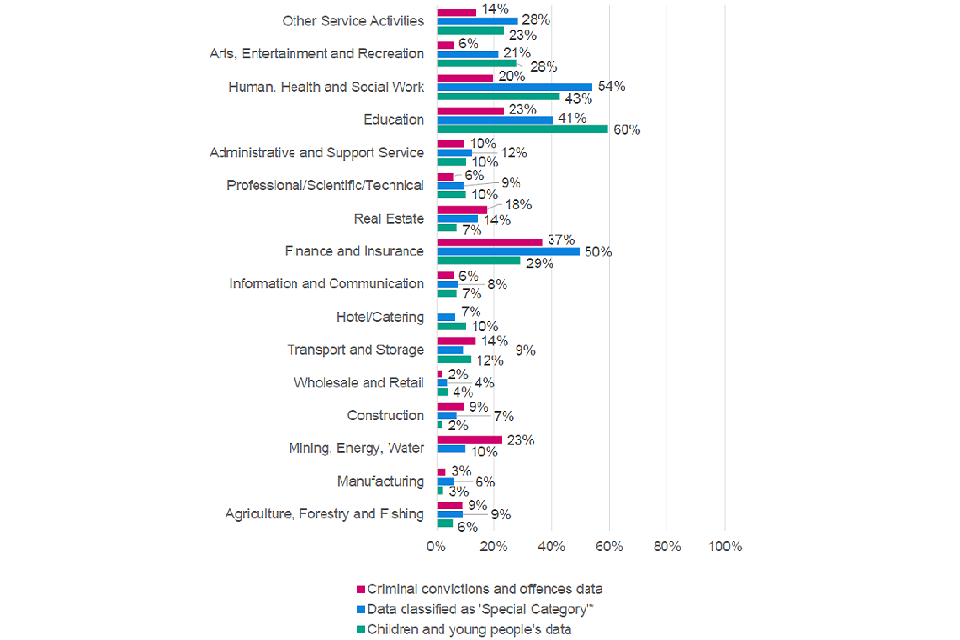
Base: 3,136 businesses that handle personal data other than employee data.
Individual data types have been excluded from some sectors due to low numbers of businesses selecting these options.
4,8 Seeking consent for personal data use
UK GDPR outlines six lawful bases for collecting personal data. The lawful bases for processing are set out in Article 6 of the UK GDPR. At least one of these must apply whenever a business processes personal data. Consent is one of the lawful bases for collecting personal data, whereby personal data can be collected through the individual giving consent, however there are cases where consent is not required. Where consent is used, there are certain standards required in order to meet the requirements under GDPR.
Businesses that handle personal data (other than only employee data) were asked about consent mechanisms used to collect and store personal data, or to share personal data externally with third parties.
43% said they use signed consent forms, 40% verbal agreements and 36% use opting out via email. Large businesses are more likely to use signed consent forms than verbal agreements, and businesses generally tended to be less likely to use opt out by unchecking a tick box than other mechanisms.
Figure 12: Types of consent sought from customers to collect, store or share personal data externally with third parties
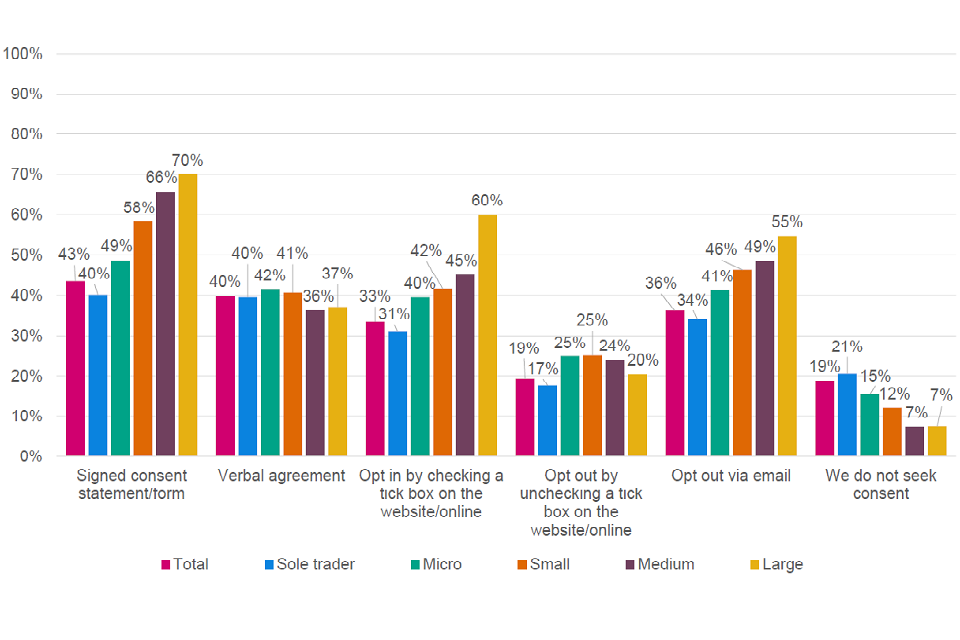
Base: 3,136 businesses that handle personal data other than employee data.
Large businesses were more likely to use opt in via tick box on a website than businesses with fewer than 50 employees.
5. Transfer of data internationally by businesses
This section explores transfers of data (both sending and receiving) with organisations or people outside the UK, and the factors that assist businesses or impede their international data transfers.
The survey provides a breakdown by size and sector of businesses transferring some form of data, and those that do not. It further explores the elements that support or restrict businesses from transferring data, and provides an overview of the business landscape.
5.1 Businesses that transfer data internationally
The survey identified that 12% of businesses that handle digitised data transfer personal or non-personal data with businesses or people based outside the UK (this is 10% of all businesses, because 81% of all businesses handle digitised data). Figure 13 below shows that large businesses that handle digitised data (47%) are more likely to transfer data internationally than other businesses.
Figure 13: Percentage of businesses that handle digitised data that transfer (send or receive) data with other organisations or people based outside of the UK, by business size
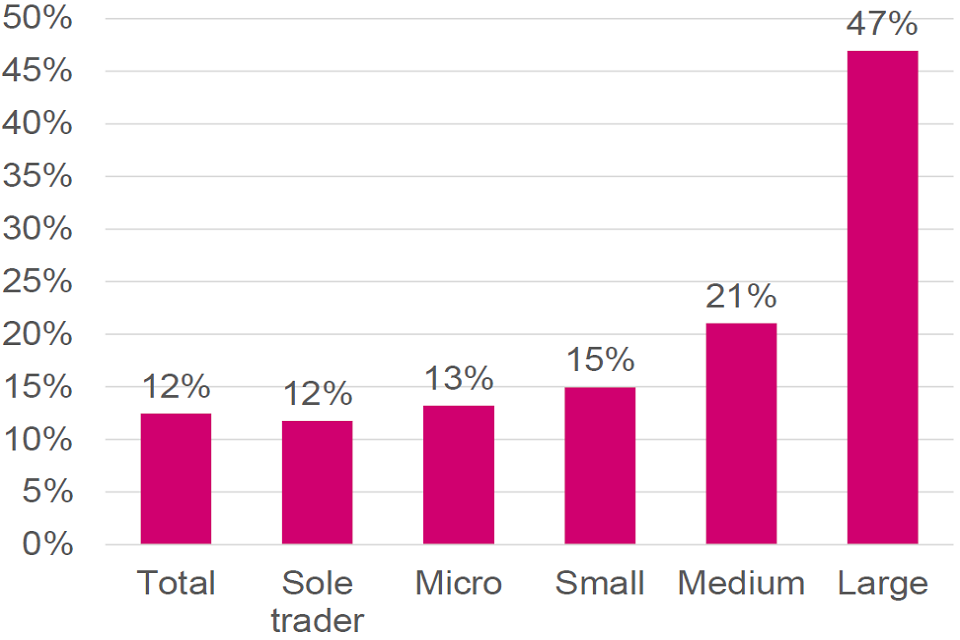
Base: 3,945 businesses that handle any digitised data; 1,464 Sole trader, 1,259 Micro, 745 Small, 316 Medium, 150 Large.
Figure 14 below shows 5% of businesses in the Construction and Agriculture, Forestry and Fishing sectors mentioned transferring data internationally, compared with 28% of businesses in the Information and Communication sector and 18% of the Professional/Scientific/Technical sector. Rates were broadly similar amongst most other sectors.
Figure 14: Percentage of businesses that handle digitised data that transfer (send or receive) data with other organisations or people based outside of the UK, by sector
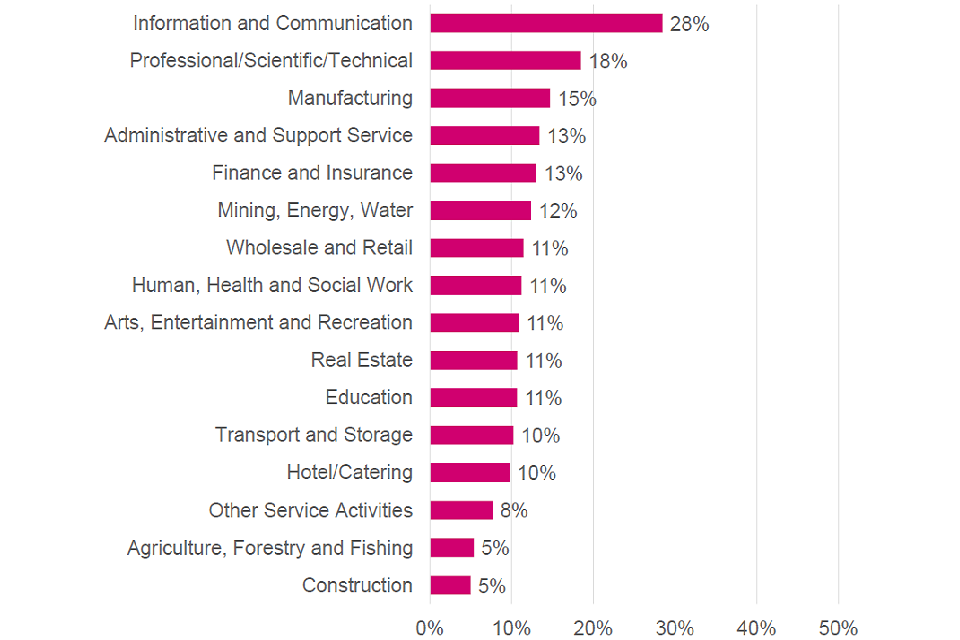
Base: 3,945 businesses that handle digitised data.
5.2 Reasons for not transferring data internationally
A large proportion of businesses (86%) do not transfer any data outside the UK.
The businesses that handle digitised data but that do not transfer any data internationally were further asked to identify the reasons for not transferring data. The findings suggest the two major reasons being: no need to share data internationally (92%); and not operating internationally (78%).
Over a quarter of businesses (28%) that handle digitised data but that don’t transfer it internationally also mentioned lack of resources to share data internationally; with about 18% of businesses giving concerns around legal risks and uncertainty as another reason. Finally, 6% of businesses said they had experienced concerns or barriers relating to GDPR and DPA 2018.
Figure 15: Reasons for businesses not sharing data internationally
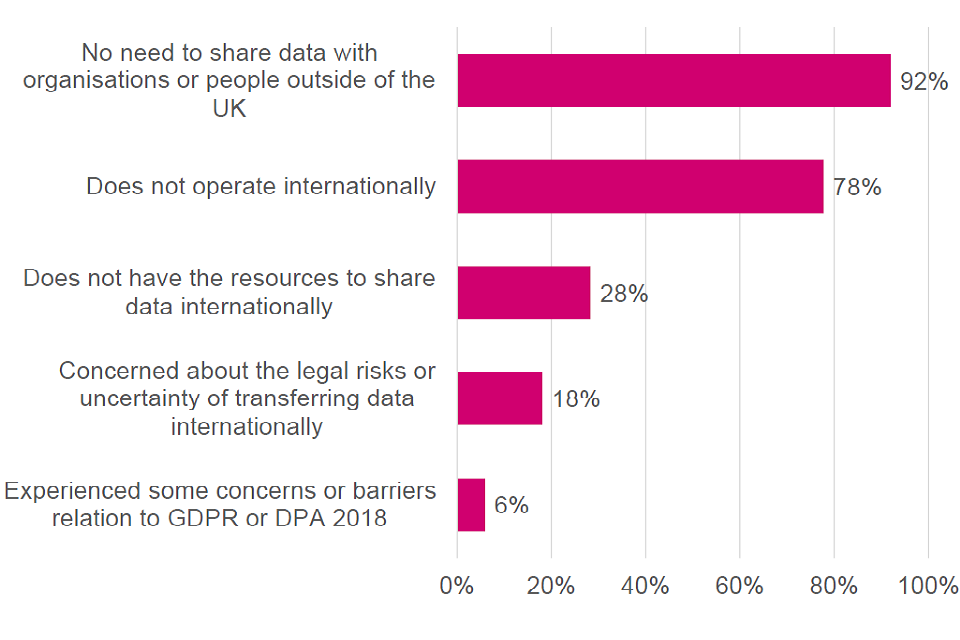
Base: 3,245 businesses that handle digitised data but do not send or receive data from outside the UK.
The data suggests that almost a third (31%) of sole traders that do not transfer data internationally consider lack of resources as a barrier, and were more likely to cite this as a barrier than concern around legal risks. Large businesses were more likely than businesses of other sizes to cite concerns about legal risks as a reason for not transferring data internationally.
Figure 16: Barriers to transferring data internationally, by size of business
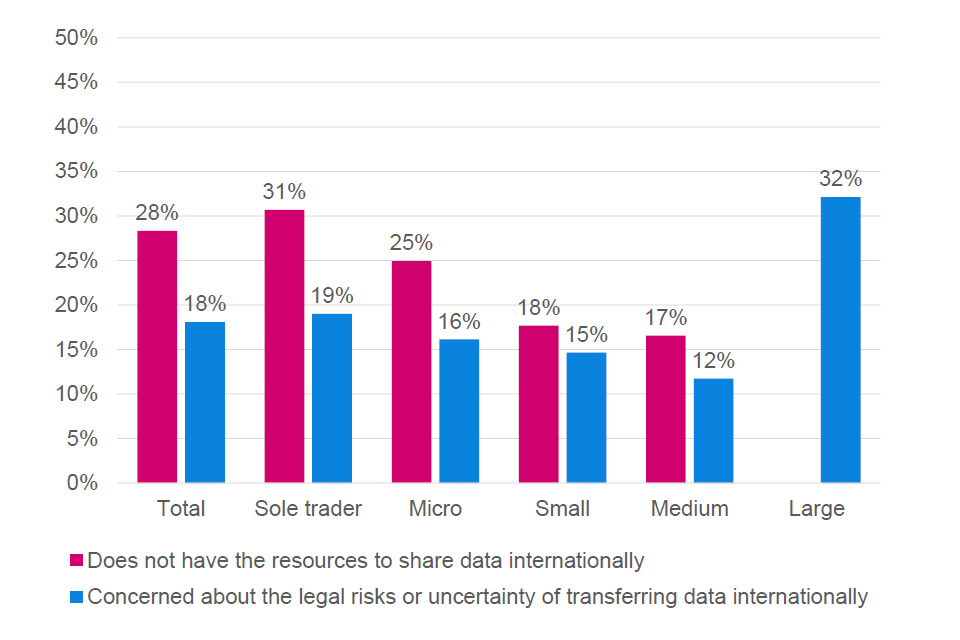
Base: 3,245 businesses that process digitised data but do not send or receive data from outside the UK; 1,262 Sole traders, 1,056 Micro, 608 Small, 238 Medium, 72 Large. Results for not having resources are suppressed for large businesses due to small sample size.
5.3 Awareness of legal compliance for international transfers
47% of businesses that transfer data internationally are either aware a fair amount (37%) or a great deal (10%) of the legal compliance necessary to transfer personal data. It should be noted that this question was asked of businesses that transfer or receive any type of data internationally, not just those who send personal data.
Figure 17: Businesses knowledge about the legal compliance necessary to transfer personal data with organisations or people based outside of the UK
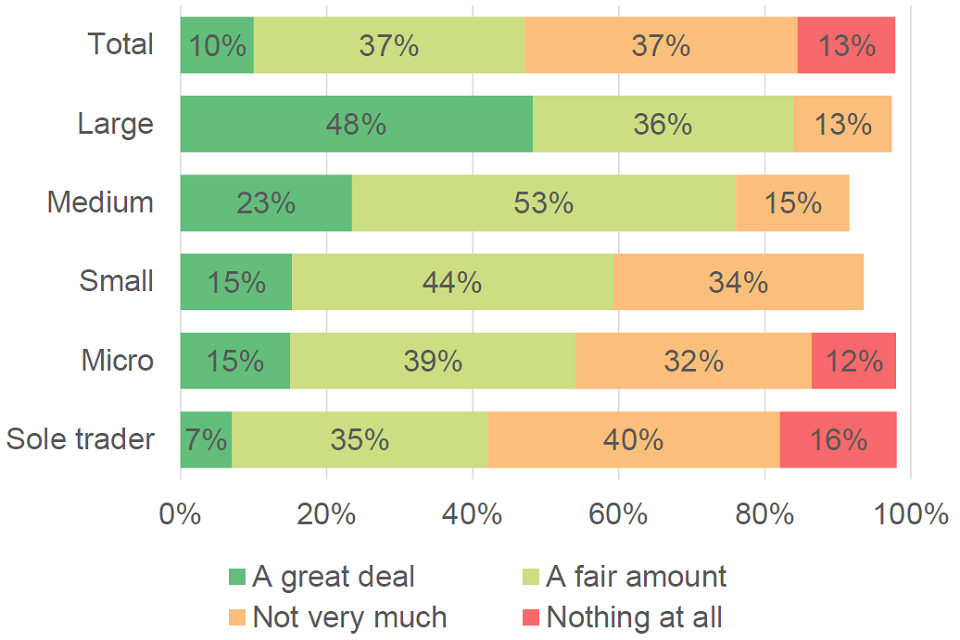
Base: 624 businesses that either send data to, or receive data from, outside the UK, 180 Sole traders, 179 Micro, 124 Small, 68 Medium, 71 large; ‘Nothing at all’ excluded for small, medium and large due to low number of responses.
The results suggest that large businesses are more likely to understand the legal compliance requirements ‘a great deal’ when transferring data outside the UK when compared to businesses with fewer than 50 employees.
5.4 Type of data transferred
Those businesses that transfer data internationally (12% of businesses that handle digitised data) were further asked the type of data they transfer. Over half (51%) of those businesses that transfer data internationally transfer both personal and non-personal data. An estimated 25% of businesses transfer only non-personal data, and 19% of businesses transfer personal data only.
Figure 18: Percentage split between businesses that share personal data only, non-personal data only or both, internationally, by business size
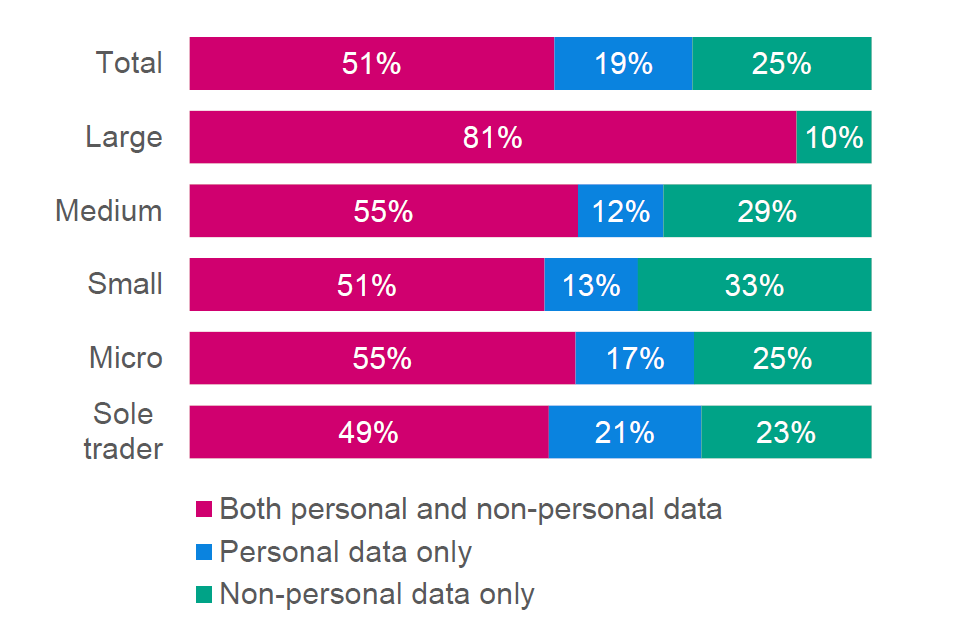
Base: 624 businesses that either send data to, or receive data from, outside the UK; 180 Sole traders, 179 Micro, 124 Small, 68 Medium, 71 Large.
Further breakdown of the responses by business size shows that 81% of large businesses that transfer data internationally, transfer both types of data - a higher percentage than for sole traders (49%), micro (55%), small (51%) and medium (55%) businesses.
5.5 Sharing data outside the UK
The distribution of interactions between UK businesses and the rest of the world is illustrated below. 10% of businesses said they share data (send or receive) with organisations outside the UK. Figure 19 below shows the proportion of these businesses that said they share data with each major world region. Most businesses that share data outside the UK share data with Europe and/or North America (of which by far the predominant country is the US, in terms of the extent to which UK businesses share data). Around a third (32%) share data with the Asia-Pacific region (which includes Australia and New Zealand), and a relative minority share data with the Middle East (20%), South America (15%) and Africa (15%). Please note that there is no statistically significant difference between these three regions.
Figure 19: Region where data is shared (sent or received)
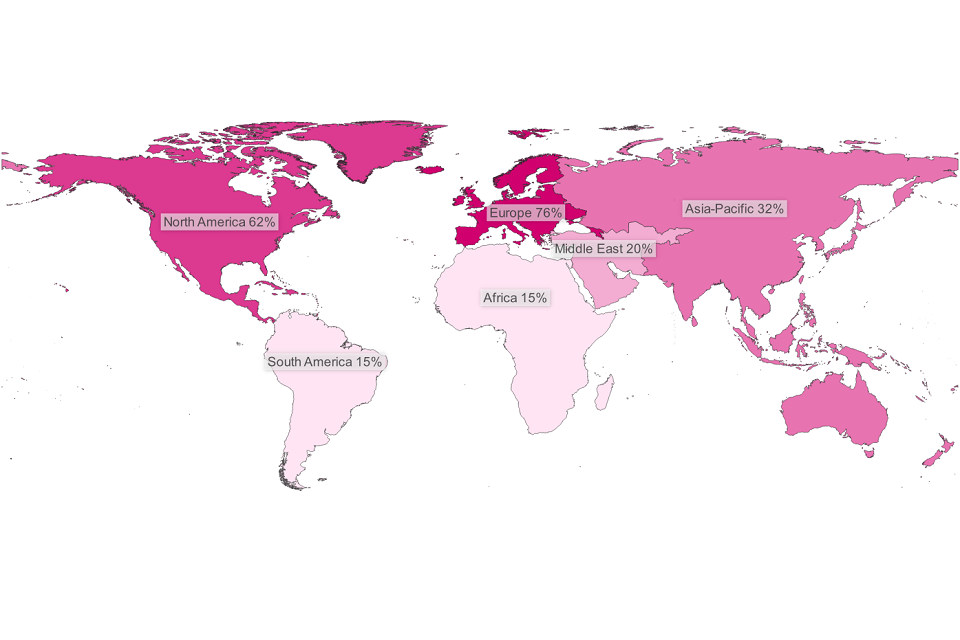
Base: 624 businesses that transfer data internationally.
Breaking down the region map above to the country level means that data for many countries is excluded due to low sample sizes. However, it is possible to show the eleven countries mentioned most often (not including the UK, which is also shown on the map as a number of businesses mentioned it), shown in Figure 20 below. Note that businesses were asked to list the top three countries, with the expectation that some businesses share data with more than three.
On the basis of UK services exports, this correlates with the general scale of trade. 76 other countries were also mentioned.
On average, fewer than 1% of businesses mentioned these other countries. This all indicates that UK data-sharing is broadly spread across the globe yet highly concentrated toward the UK’s main trading partners.
Figure 20: Top 11 countries (plus the UK) where data is shared (sent or received)
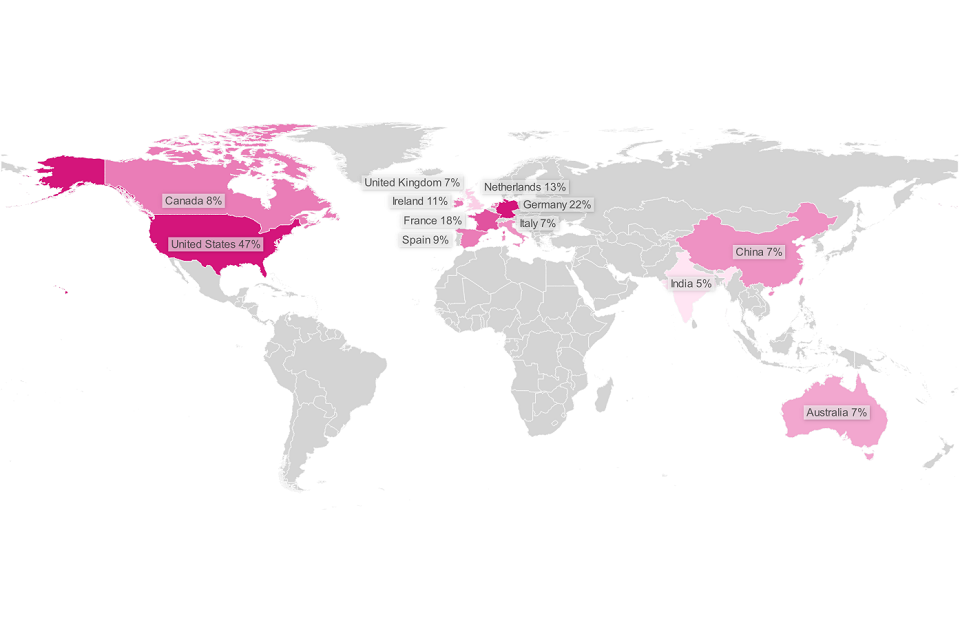
Base: 592 businesses that mentioned up to three countries with which they share data.
Breaking down the information shown in the map in Figure 20 by size of business in Figure 21 below, one can see that the ranking of the world regions follows the same order for each size category (for all sizes, the lines become thinner as you look at the continents from left to right).
Figure 21: Region where data is shared (sent or received), by size of (UK) business
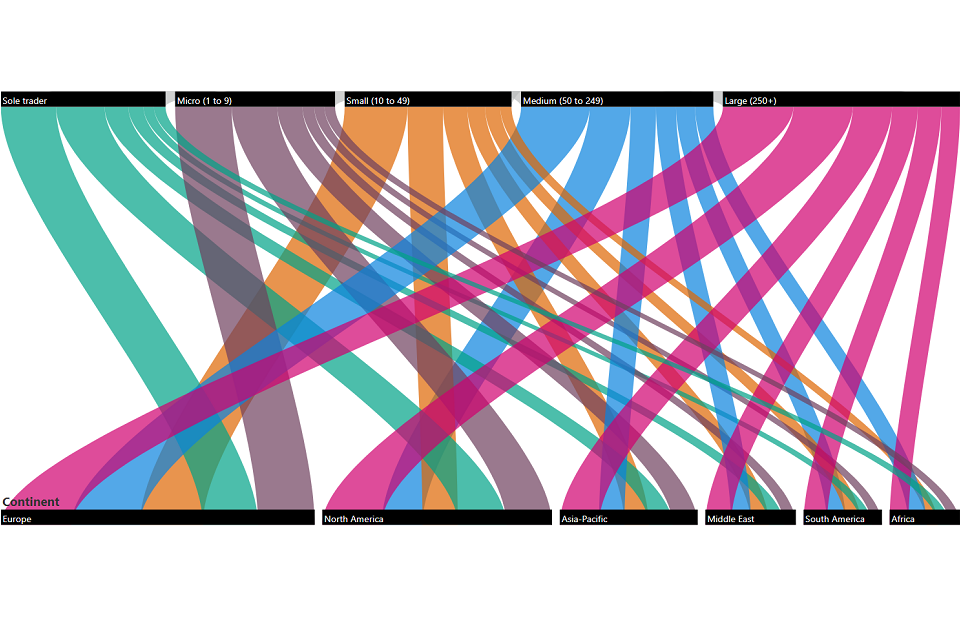
Base: 624 businesses that were asked with which region they share data.
Of the businesses that said they share data internationally, around 4% said that they had been prevented from sharing data with organisations or people internationally due to barriers regarding the transfer of personal data. Although businesses were asked with which countries they encountered these barriers, and for more detail on what those barriers were, this is too small a sample to be able to report those details.
6. Data Protection Act 2018 and UK General Data Protection Regulation (GDPR)
The DPA 2018 sets out the framework for data protection law in the UK. It updates and replaces the Data Protection Act 1998, and came into effect on 25 May 2018. It was amended on 1 January 2021 by regulations under the European Union (Withdrawal) Act 2018, to reflect the UK’s status outside the EU.
It sits alongside and supplements the UK GDPR - for example by providing exemptions. The UK GDPR came into effect on 1 January 2021. It sets out the key principles, rights and obligations for most processing of personal data in the UK, except for law enforcement and intelligence agencies. It is based on the EU GDPR which applied in the UK before that date, with some changes to make it work more effectively in a UK context.
This chapter explores:
- how many businesses have Data Protection strategy or a privacy framework in place;
- businesses that have someone leading on data protection compliance, and those that have a data protection strategy in place;
- businesses that understand and have confidence in applying GDPR regulations and DPA 2018.
6.1 Employment of data protection professionals
Excluding sole traders, amongst businesses collecting digitised personal data, almost three quarters (73%) employ someone whose job role includes leading on data protection. The vast majority of large businesses (99%) have, and two-thirds (67%) of micro businesses have an employee in this role.
Figure 22: Percentage of businesses that employ someone leading on data protection compliance, by size
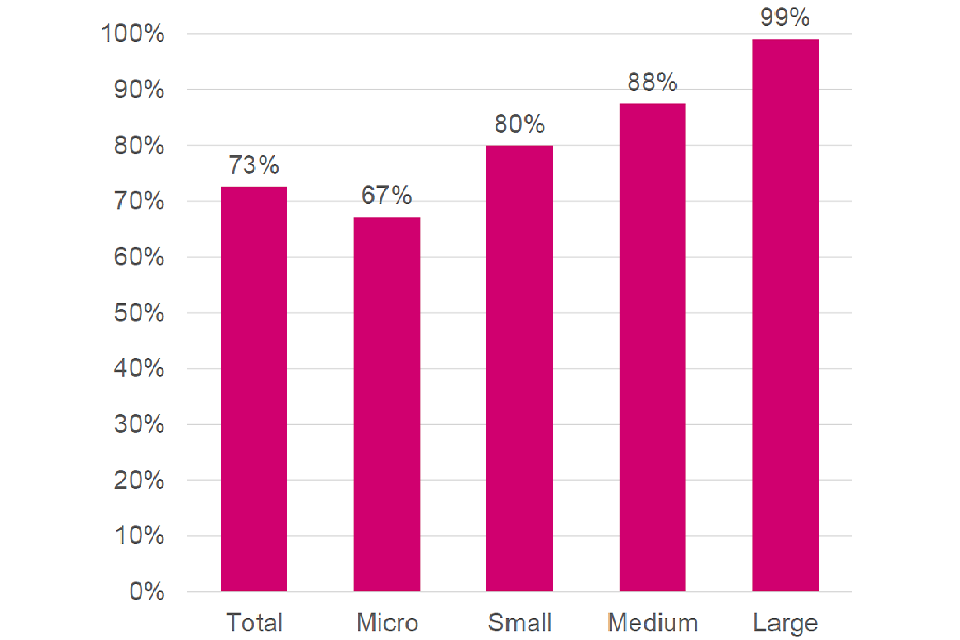
Base: 1,909 responses from businesses that handle digitised personal data and employ staff, 960 Micro, 554 Small, 258 Medium, 137 Large.
Comparing sectors, the data suggests employment to lead on data protection compliance is broadly comparable across most sectors. However, the Finance and Insurance, Human, Health and Social Work and Education sectors are more likely to employ someone leading on data protection compliance when compared to Construction or Wholesale and Retail.
Figure 23: Percentage of businesses that employ someone leading on data protection compliance, by sector
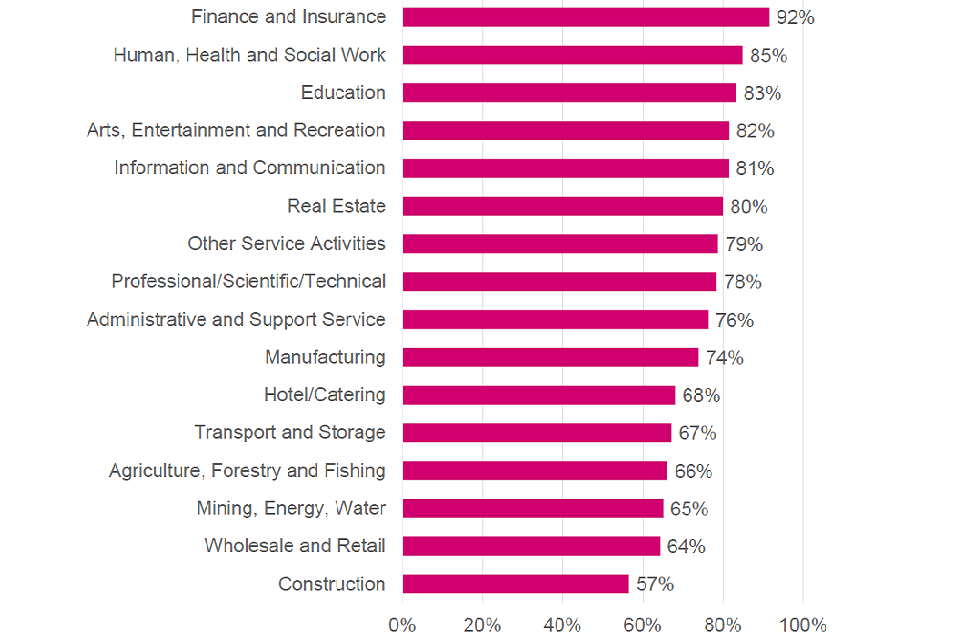
Base: 1,909 businesses that handle digitised personal data and employ staff.
6.2 Confidence in staff’s handling of personal data
Amongst businesses that employ staff and handle digitised personal data, the majority (93%) felt confident that their employees were proficient in handling personal data.
The level of overall confidence (quite confident and very confident) is broadly consistent across business sizes. Looking at figures for ‘very confident’, this is slightly lower for large businesses than for micro ones.
Figure 24: Businesses’ confidence that their employees are proficient in handling personal data by business size
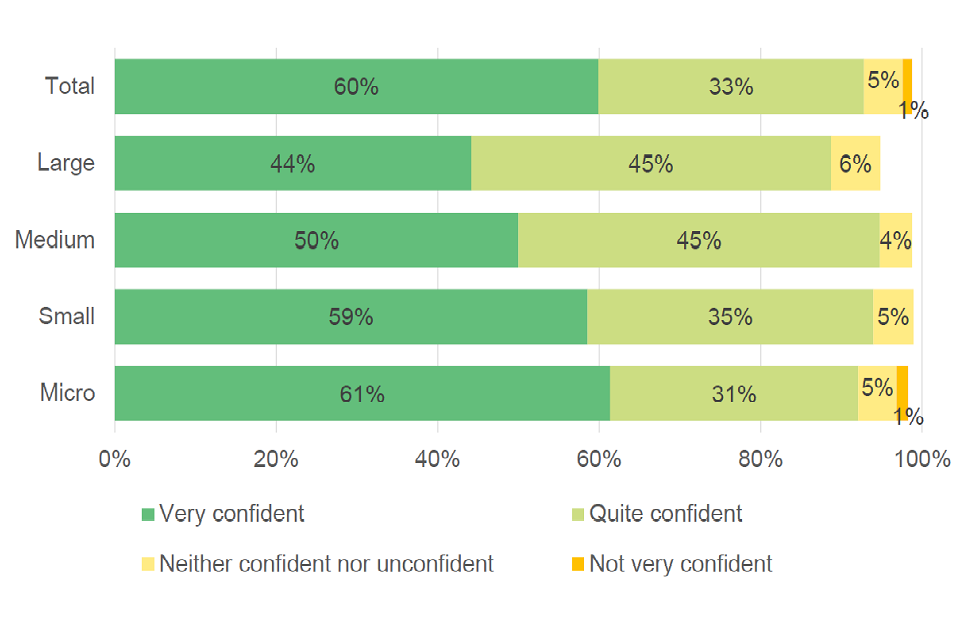
Base: 1,909 responses from businesses that handle digitised personal data and employ staff; 960 Micro, 554 Small, 258 Medium, 137 Large. The option ‘Not at all confident’ excluded due to small sample size.
Most sectors had a majority of respondents saying they felt confident in their employees’ proficiency in handling personal data. The percentage saying they were ‘very confident’ ranged from 41% (Agriculture, Forestry and Fishing) to 90% (Finance and Insurance).
6.3 Businesses’ confidence in complying with subject access rights
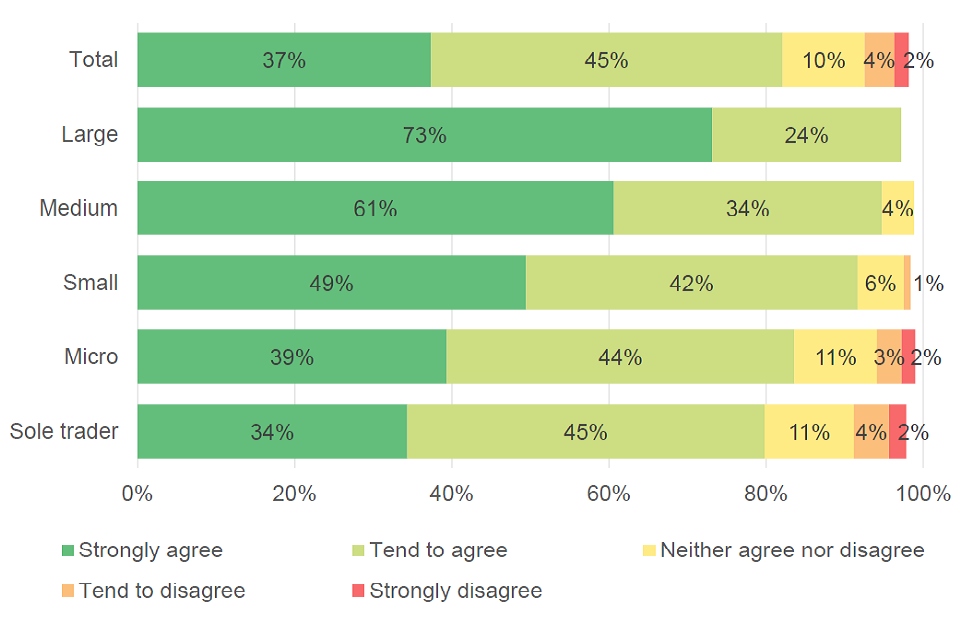
The majority (85%) of businesses that handle digitised personal data tend to agree or strongly agree to feeling confident that their business is complying with data subjects’ rights under GDPR and DPA 2018 and 5% either tend to disagree or strongly disagree.
Figure 25: Percentage of businesses that feel confident in complying with data subjects’ rights under GDPR and DPA 2018 (for example Subject Access Requests)
Base: 3,630 businesses that collect digitised personal or employee data; 1,216 Sole traders, 1,200 Micro, 738 Small, 315 Medium, 150 Large. Some response categories are excluded due to low response numbers.
Confidence is fairly high across all business sizes, although large businesses were more likely to strongly agree than businesses with fewer than 50 employees.
Confidence (both tend to and strongly agree combined) is also high across sectors, ranging from 76% (Construction) to 98% (Finance and insurance).
6.4 Business understanding of GDPR and DPA 2018
Businesses were asked to what extent they agree or disagree that their business understands its requirements under the GDPR regulation and DPA 2018.
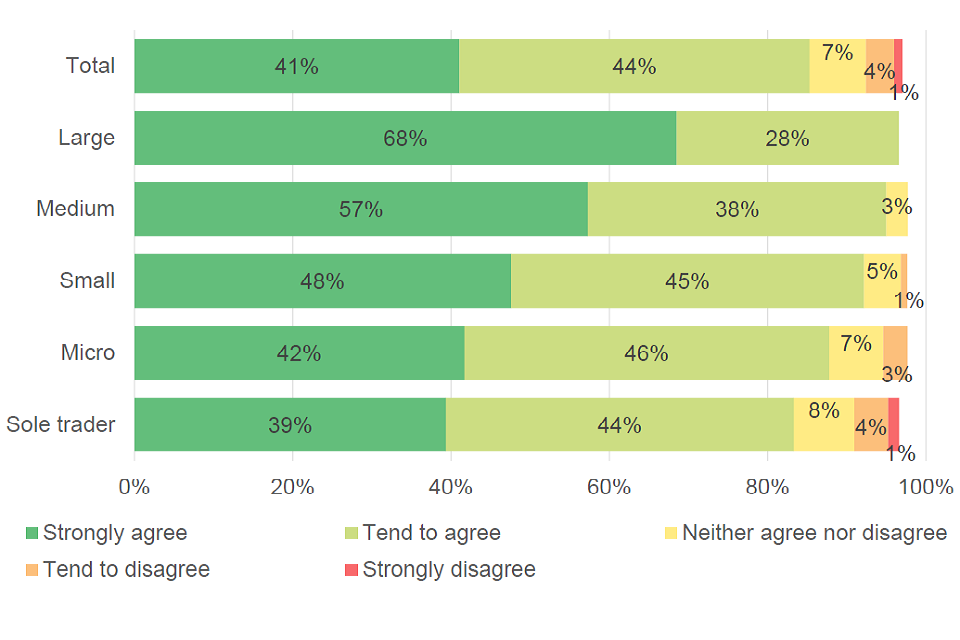
An estimated 82% of businesses that handle digitised personal data said they either tended to or strongly agreed that they understand the requirements under GDPR and DPA 2018.
Figure 26: Percentage of businesses that agree that their business understands what is required under GDPR and DPA 2018 by business size
Base: 3,630 businesses that handle digitised personal or employee data; 1,216 Sole traders, 1,200 Micro, 738 Small, 315 Medium, 150 Large. Some response categories are excluded due to low response numbers.
An estimated 73% of large businesses that handle digitised personal or employee data strongly agreed that they understand GDPR regulations and DPA 2018, compared to 34% of sole traders and 39% of micro businesses.
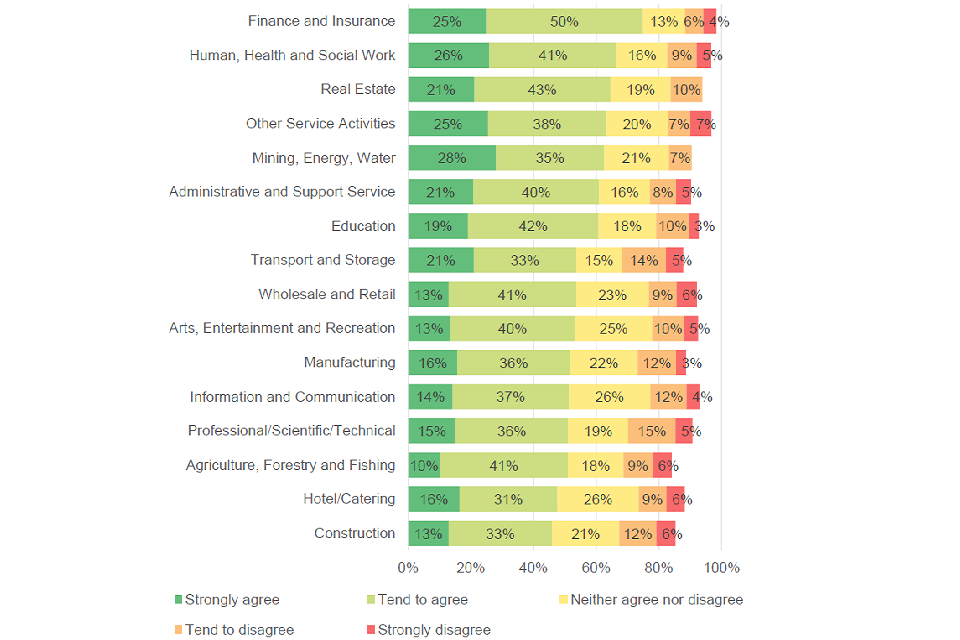
Over half of businesses across each sector tend to agree or strongly agree that they understand the GDPR regulations and DPA 2018. Levels of agreement (total of tend to and strongly agree) were higher among the Finance and Insurance and Education sectors, compared with Professional/Scientific/Technical, Agriculture, Forestry and Fishing, Wholesale and Retail, Transport and Storage, Manufacturing and Construction sectors.
Figure 27: Percentage of businesses that agree that their business understands what is required under GDPR and DPA 2018 by sector
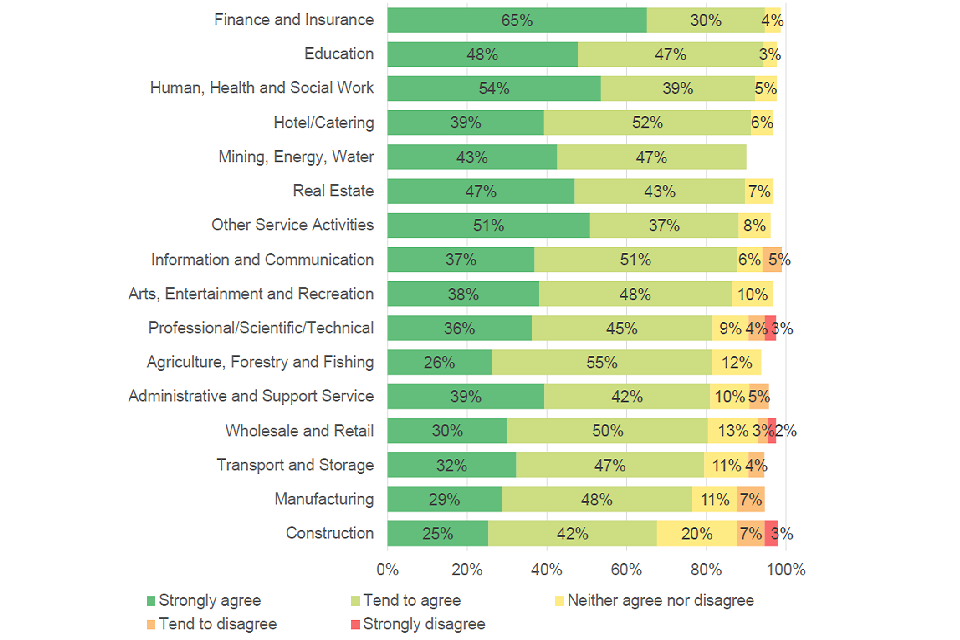
Base: 3,630 businesses that handle digitised personal or employee data. Some response categories are excluded due to low response numbers.
6.5 Understanding of guidance around data protection
An estimated 55% of businesses that handle personal or employee data agreed (strongly or tend to agree) that they found the regulatory guidance published by the ICO clear and easy to understand. 80% of large businesses that handle personal or employee data tend to agree or strongly agree compared to 51% of sole traders and 59% of micro businesses (figures may not exactly equal the sum of their component percentages in Figure 28 due to rounding). This is in line with the finding that sole traders are less likely to agree that they understand the requirements of GDPR. However, it is not possible to draw conclusions regarding any causal links from these findings.
Figure 28: Percentage of businesses that handle digitised personal or employee data that find the regulatory guidance GDPR and DPA 2018 guidance published by the ICO clear and easy to understand, by business size
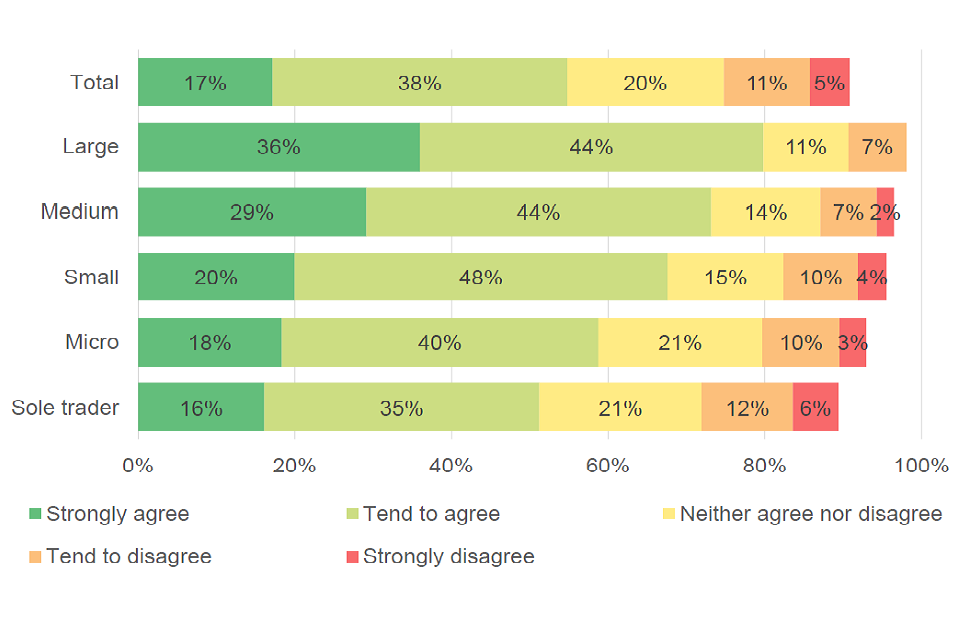
Base: 3,630 businesses that handle digitised employee or personal data; 1,216 Sole traders, 1,200 Micro, 738 Small, 315 Medium, 150 Large. Some response categories are excluded due to low response numbers.
The proportion of businesses that strongly agree that the ICO’s guidance is easy and clear and easy to understand is broadly consistent across sectors. When looking at the combined tend to and strongly agree figures, Finance and Insurance, and Human, Health and Social Work sectors were more likely to agree than the Hotel/Catering, Construction or Professional/Scientific/Technical sectors.
Figure 29: Percentage of businesses that handle digitised personal or employee data that agree that the regulatory guidance published by the ICO are clear and easy to understand, by sector
Base: 3,630 Businesses that handle digitised personal or employee data. Some response categories are excluded due to low response numbers.
6.6 Experiences of businesses not finding legislative guidelines clear and easy to understand
Those businesses that did not find the guidance clear and easy to understand were further asked of their experiences as a result of it. Of these businesses, 53% highlighted disproportionate time spent working out the requirements of GDPR and/or DPA, and 17% of businesses also mentioned outsourced compliance with data protection regulation to specialist staff. 40% of businesses said they had not experienced any of the consequences listed. However, it is not possible to state if this implies that they did not experience any negative consequences as a result of unclear guidance, or if there were other consequences not captured within the survey question.
6.7 Business views on potential clarifications of GDPR
All businesses that handled digitised data were asked about the elements they felt required more clarity. The lawful bases that allow data processing (i.e. not personal data), and data protection impact assessments came up as the elements that required more clarity. It should be noted that businesses were asked this question regardless of whether they handle personal data, so businesses that responded will have a varying range of specific elements of the legislation.
Figure 30: Elements of GDPR which businesses felt required more clarity
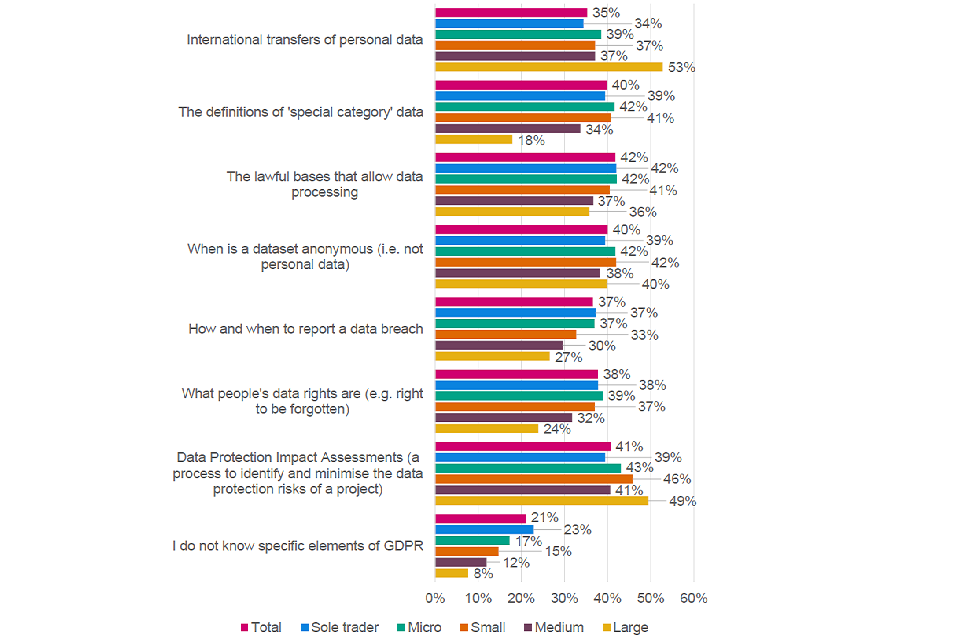
Base: 3,945 businesses that handle digitised data; 1,464 Sole trader, 1,259 Micro, 745 Small, 316 Medium, 150 Large.
An estimated 53% of large businesses suggested elements surrounding international transfers of data could be clearer compared to 34% of sole traders, which may be due to the increased likelihood that they transfer data internationally (see chapter 2).
A greater proportion of micro businesses requested clarity on what people’s data rights are (39%), and how and when to report a data breach (37%) than large businesses, which could possibly be linked to their decreased likelihood of employing staff who are responsible for data protection compliance (see chapter 1).
The need for greater clarity on the definitions of ‘Special Category’ data was greater amongst sole traders, micro and small businesses than for large businesses.
6.8 Measures implemented as a result of GDPR and DPA 2018
The top four main measures adopted by businesses that handle digitised personal or employee data as a result of the GDPR and DPA 2018 are:
- rewritten or introduced privacy advice
- introducing new processes to implement data protection measures
- rewritten terms and conditions
- introducing opt-in consent mechanisms across all businesses
Figure 31: Measures adopted by businesses as a result of the GDPR and DPA 2018
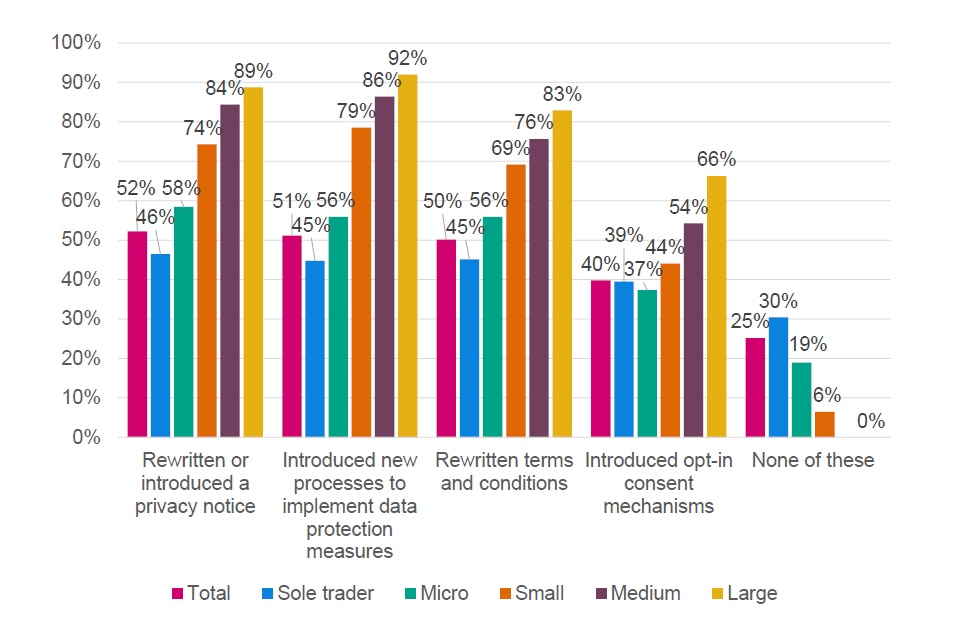
Base: 3,630 businesses that handle digitised personal or employee data; 1,216 Sole trader, 1,200 Micro, 738 Small, 315 Medium, 150 Large.
Large businesses tended to be more likely to say they had implemented any of these measures than sole traders, micro or small businesses.
6.9 Privacy management and data protection strategy
Almost two thirds (64%) of those businesses that process digitised personal data or employee data had a privacy management framework in place. This figure ranges from 59% among sole traders to 95% among large and medium businesses.
Figure 32: Percentage of businesses that process personal digitised data with a privacy management framework or data protection strategy in place, by business size
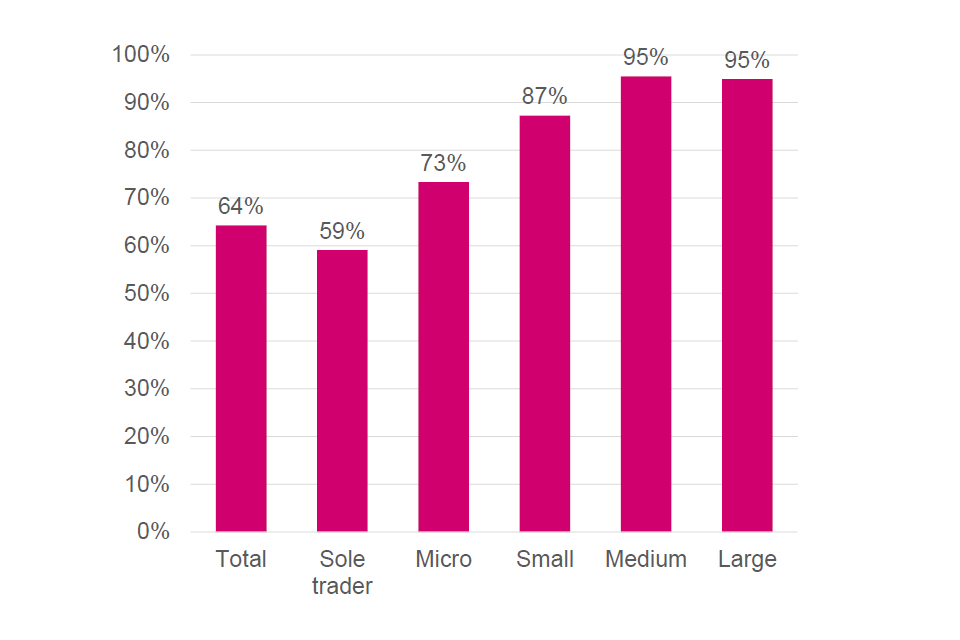
Base: 3,136 businesses that process personal data other than employee data, 1,216 Sole trader, 960 Micro, 554 Small, 258 Medium, 137 Large.
The findings vary across sectors. The data suggests that more than 90% of businesses in the Finance and Insurance and Human, Health and Social Work sectors that process personal or employee data have a privacy framework in place, compared with 45% in the Agriculture, Forestry and Fishing sector.
Figure 33: Proportion of businesses with a privacy framework in place, by sector
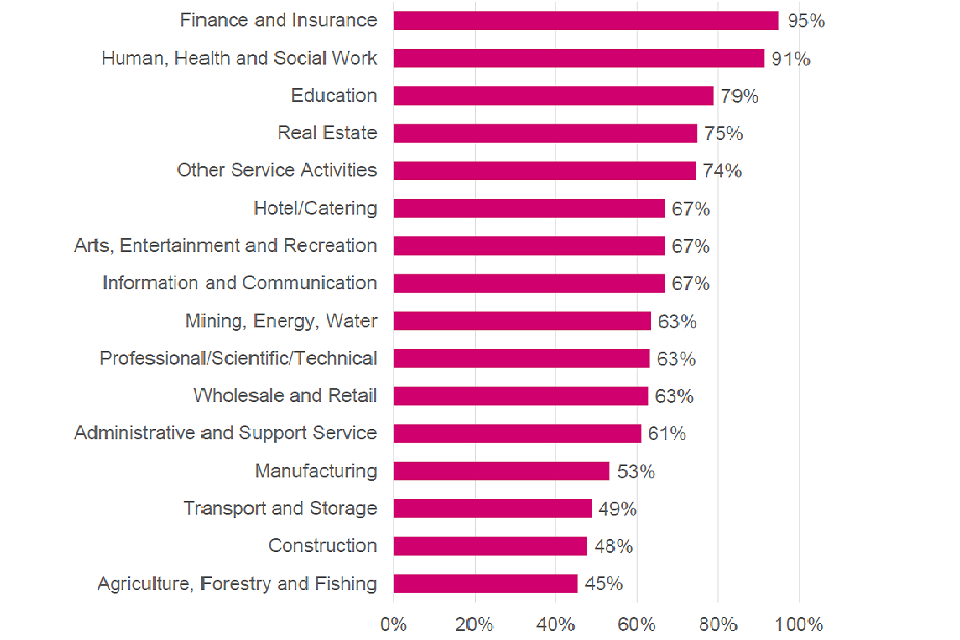
Base: 3,136 businesses that process personal data other than employee data.
6.10 Benefits of data protection laws
Businesses that process personal or employee data were asked about possible benefits of the introduction of GDPR and DPA 2018. The three main potential benefits businesses highlighted were that it resulted in increased awareness of data protection at senior level (58%), increased accountability (44%), and improved awareness of data as a business asset (45%). However, nearly a quarter of businesses said there had been no benefits.
29% of sole traders said there had been no benefits from GDPR and DPA 2018 compared to 6% of medium businesses.
Figure 34: Potential benefits of GDPR and the DPA 2018 experienced by businesses
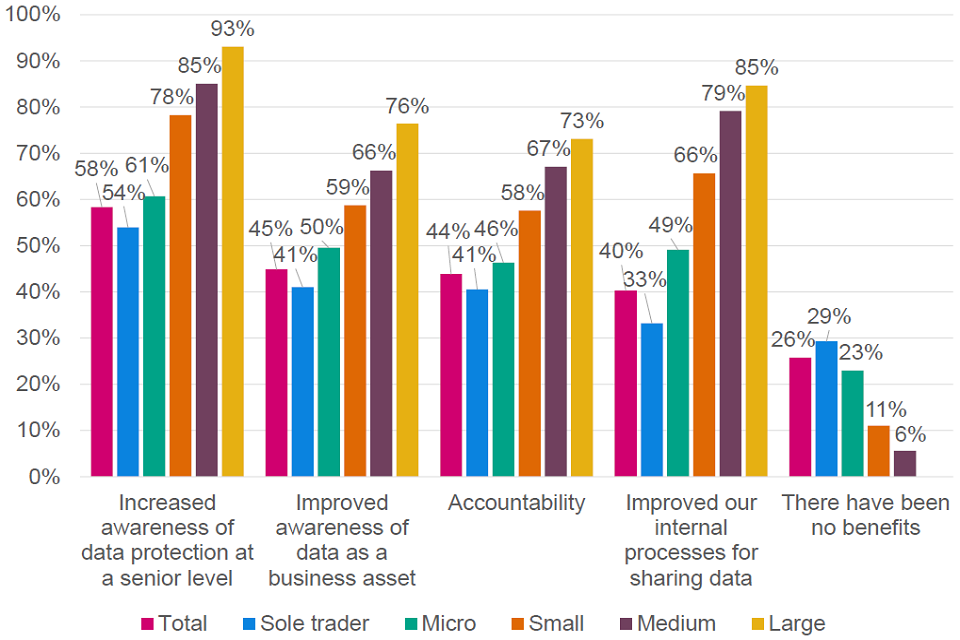
Base: 3,630 businesses that handle digitised personal or employee data; 1,216 Sole traders, 1,200 Micro, 738 Small, 315 Medium, 150 Large. Some results are suppressed due to a small number of responses.
7. Awareness of Information Commissioner’s Office and its services
This chapter explores the awareness of the Information Commissioner’s Officer (ICO) and its services across businesses, broken down into different sized businesses and from different sectors.
7.1 Percentage of businesses that have heard of ICO
The chart below illustrates businesses’ awareness of the ICO, similarly to Chapter 4 of the Summary Report. However, this separates sole traders from the micro business category, and so it can be seen that awareness amongst sole traders is lower than other micro businesses.
Figure 35: Percentage of businesses that have heard of the ICO or not
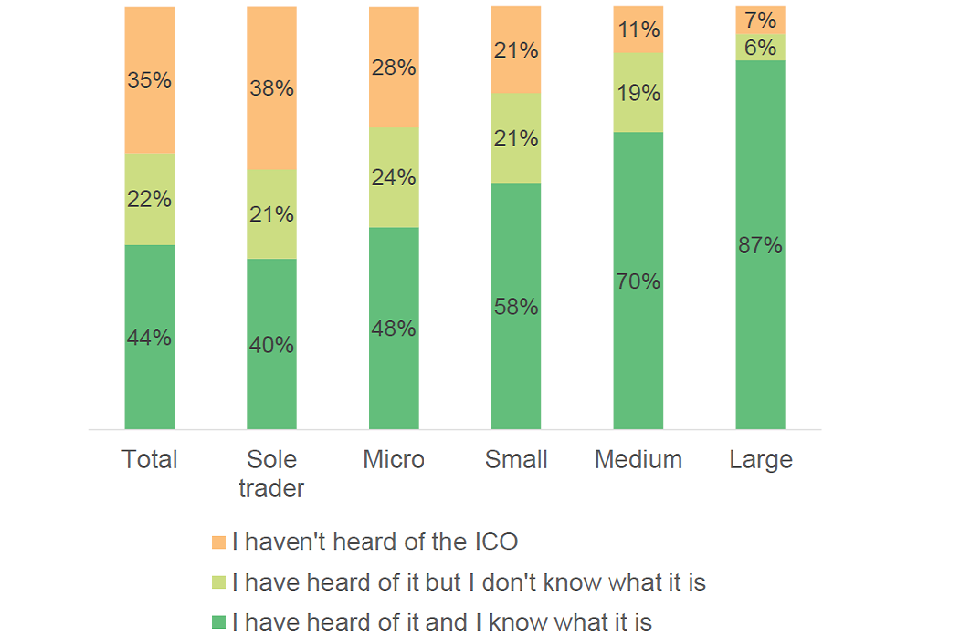
Base: 3,945 UK business that handle digitised data.
The findings across different sectors suggest that Finance and insurance, and Real Estate are more likely to be aware of ICO than most other sectors (with the exception of Human Health and Social work or Information and Communication where the difference is not statistically significant).
Figure 36: Proportion of business that have heard of the ICO, by sector
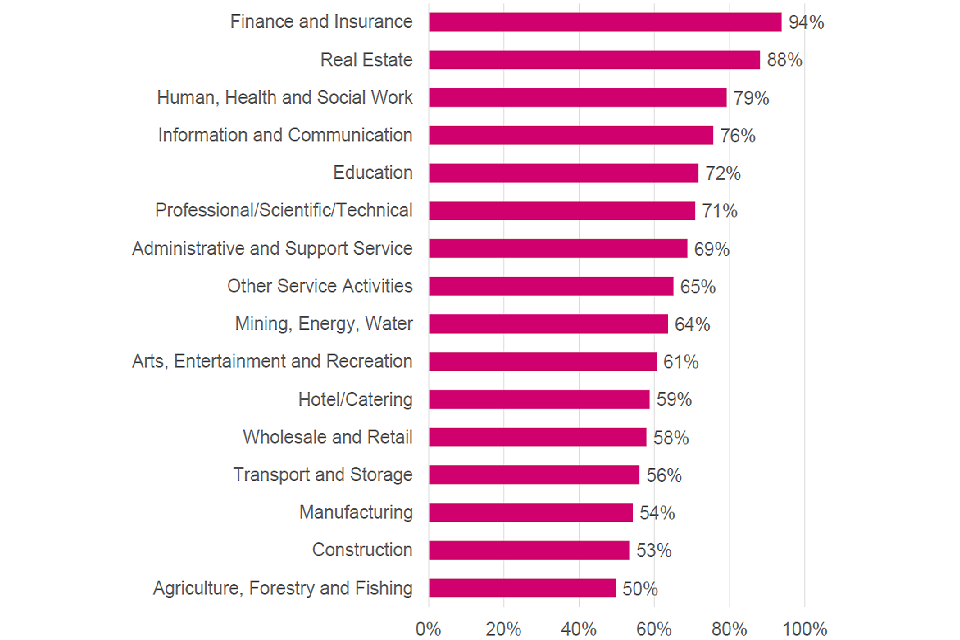
Base: 3,945 businesses that handle digitised data.
Businesses that have heard of the ICO, irrespective of whether or not they know what it does (i.e. the sum of the bottom two parts of the total bar in Figure 35) were split between whether or not they have a privacy framework in place (businesses that were asked about a privacy framework are a subset of those that were asked about their awareness of the ICO). Businesses that have heard of the ICO are around twice as likely to have a privacy framework in place.
Figure 37: Proportion of businesses that have a privacy framework in place, by whether or not they have heard of the ICO
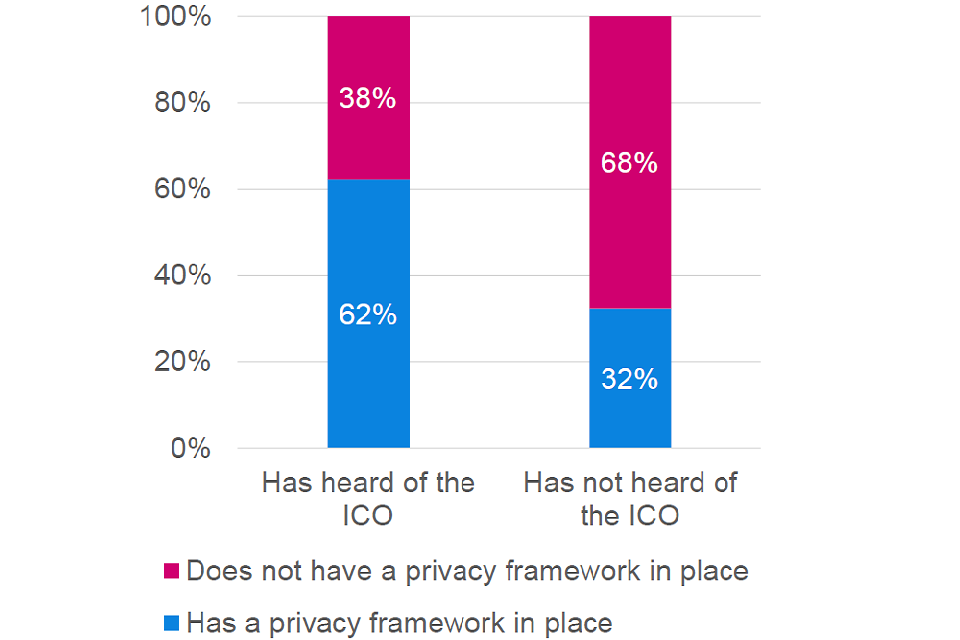
Base: 3,945 businesses that handle digitised data (2,884 businesses that have heard of the ICO and 1,061 that have not).
8. Geographical analysis
The survey contained a number of questions about the regions and countries with which businesses share data, as well as data from the sampling frame on the region of the UK in which they are based.
This section explores:
- variations across the UK
- the distribution of UK data-sharing across the world
8.1 Looking across the UK
81% of all businesses surveyed said they handle digitised personal data, digitised non-personal data, or both. There is very little statistically significant variation between the twelve ITL 1 UK regions.
A number of other questions were selected that were expected to be most susceptible to variation across the major regions of the UK:
- Has the business recruited or tried to recruit relevant staff?
- Does the business have someone leading on data protection compliance, data use for internal R&D and/or data for marketing/sales?
- Are they confident in their business’ proficiency in handling personal data?
- Do they understand the data protection requirements?
- Is the ICO guidance clear?
- Are they aware of the ICO and what it does?
Very few statistically significant differences were found. This is partly due to sample sizes but may also suggest that the intangible, online-based nature of data-use, regulation and access to the necessary skills is largely agnostic to location.
Note that although few results are presented here, the region breakdowns are available in the tables published alongside this report.