National quarterly report of tuberculosis in England: quarter 2, 2026, provisional data
Updated 30 July 2026
Applies to England

© Crown copyright 2026
This publication is licensed under the terms of the Open Government Licence v3.0 except where otherwise stated. To view this licence, visit nationalarchives.gov.uk/doc/open-government-licence/version/3 or write to the Information Policy Team, The National Archives, Kew, London TW9 4DU, or email: psi@nationalarchives.gov.uk.
Where we have identified any third party copyright information you will need to obtain permission from the copyright holders concerned.
This publication is available at https://www.gov.uk/government/statistics/tuberculosis-in-england-national-quarterly-reports/national-quarterly-report-of-tuberculosis-in-england-quarter-2-2026-provisional-data
This report includes data for the most recent quarter of this calendar year and compares with data from up to the 3 previous calendar years.
Main points
In April to June (quarter 2) of 2026:
- there were 1,361 people notified with tuberculosis (TB), a decrease of 7.7% compared with the same period in 2025
- in the first 2 quarters of 2026, notifications decreased by 5.7% compared with the first 2 quarters of 2025
- numbers for the first 2 quarters of 2026 compared with the same period in 2025 increased in 2 UK Health Security Agency (UKHSA) regions (West Midlands 11.0% increase and North West, 6.5% increase), remained similar in one (South East, 2.5% increase) and declined in all other regions (East of England 5.5%, London, 6.1%, Yorkshire and Humber 14.0%, South West 17.7%, East Midlands 28.3% and North East 30.1% decreases); the largest percentage decreases were in regions with lower incidence
- the proportion of people with at least one social risk factor was 15.9% in the first 2 quarters of 2026 which is similar to the same period in 2025 with 17.0%
- fewer people (64) were diagnosed with rifampicin resistant or multidrug-resistant (RR or MDR) TB in the most recent 4 quarters (starting from quarter 3 2025) than in the previous 4 quarters (77); however, this number is likely to rise as more culture results become available for quarter 2 2026
Overall numbers and geographical distribution
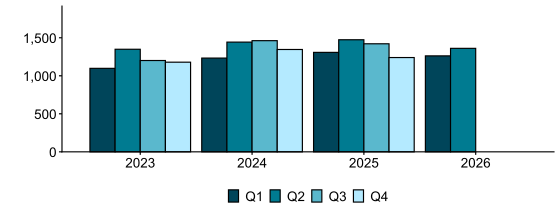
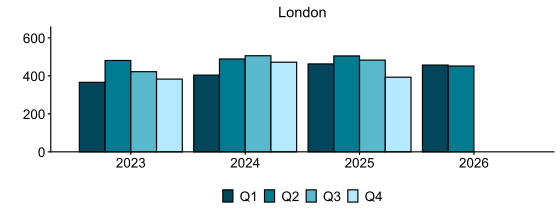
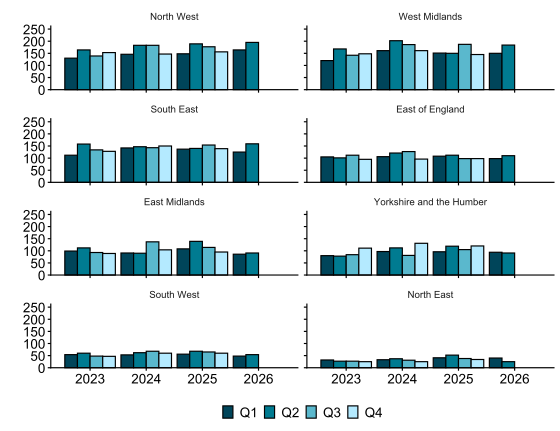
The number of TB notifications per quarter for the last 3 years for England is shown in Figure 1. The number of notifications per quarter by UKHSA region is shown in Figures 2a and 2b. Exact numbers per quarter by UKHSA region and in total are shown in (Table 1 of the supplementary data tables). Due to the seasonality of TB notifications, the most recent quarter is compared with the same quarter in the previous year rather than with the previous quarter.
In April to June (quarter 2) of 2026, 1,361 people were notified with TB in England. This is 7.7% lower than April to June (quarter 2) of 2025 (1,474).
Figure 1. Number of TB notifications in England, January to March (quarter 1) of 2023 to April to June (quarter 2) of 2026
For the data behind this chart see Table 1 of the supplementary data tables.
When analysed by UKHSA region, in April to June (quarter 2) of 2026 compared with April to June (quarter 2) of 2025 the number of people notified with TB:
- increased in the South East (13.6% increase) and West Midlands (22.7% increase)
- remained similar in the East of England (1.8% decrease) and North West (3.2% increase)
- decreased in the East Midlands (34.5% decrease), London (10.5% decrease), North East (51.9% decrease), South West (20.6% decrease) and Yorkshire and the Humber (23.5% decrease)
Figure 2a. Number of TB notifications in London, England, January to March (quarter 1) of 2023 to April to June (quarter 2) 2026
For the data behind this chart see Table 1 of the supplementary data tables.
Figure 2b. Number of TB notifications in UKHSA region, England, January to March (quarter 1) of 2023 to April to June (quarter 2) 2026
For the data behind this chart see Table 1 of the supplementary data tables.
Note 1: the axes on the London figure are different to that of the other regions due to the higher number of TB notifications in London.
Note 2: figures are ordered by decreasing total number of people with TB in April to June (quarter 2) of 2026.
Demographic and clinical characteristics
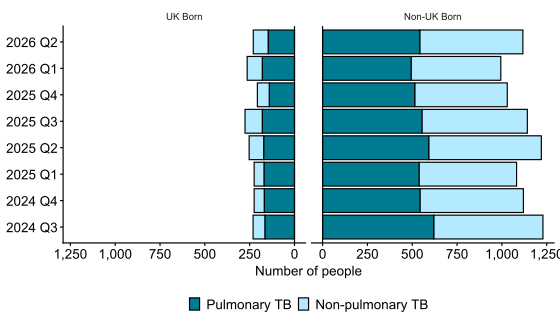
The number of TB notifications by place of birth (where known) is shown in Figure 3, sub-divided by whether the site of disease is pulmonary or non-pulmonary. Pulmonary disease is defined here as disease affecting the lungs and non-pulmonary disease notifications are those without any pulmonary involvement. Note that those with pulmonary disease may also have other sites of disease outside of the lungs.
Figure 3. Number of TB notifications by place of birth and site of disease, England, over the last 2 years (last 8 quarters)
For the data behind this chart see Table 3 of the supplementary data tables.
Place of birth was not known for 14 notifications in April to June (quarter 2) of 2026 and 1 notification in April to June (quarter 2) of 2025. Missing data may reflect difficulties in obtaining data (for example, if the patient died or there were language barriers). In April to June (quarter 2) of 2026, people born outside of the UK accounted for 82.9% of notifications (1,117 out of 1,347), similar to April to June (quarter 2) of 2025 (82.8%; 1,220 out of 1,473). Note that the numbers do not correspond to the total number of notifications due to missing data.
There was no missing data for pulmonary versus non-pulmonary disease. In April to June (quarter 2) of 2026, people with pulmonary TB accounted for 51.0% (694 of 1,361) of all people with TB, consistent with 51.8% in April to June (quarter 2) of 2025 (764 of 1,474). For those born outside the UK, pulmonary disease accounted for 48.5% (542 of 1,117) of all notifications in April to June (quarter 2) of 2026 compared with 63.5% (146 of 230) for those born in the UK. This pattern of pulmonary disease being more common in UK-born people is seen for all quarters.
Culture confirmation
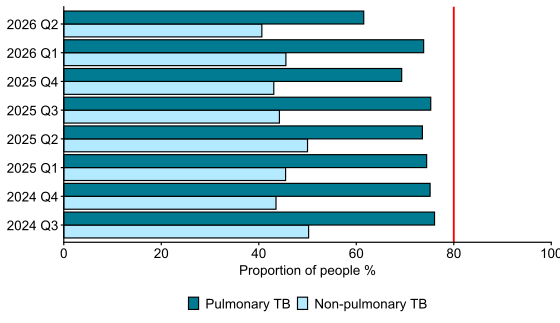
The TB action plan 2021 to 2026 Priority 3 workplan: action 3.3 aims to increase culture confirmation rates by 5% per year with a specific target within the workplan (Action 3.3.2a) to reach the European standard of 80% culture confirmation for pulmonary disease. In quarter 2 (April to June) 2026, the number of notifications with culture confirmation will increase as laboratory results become available.
Figure 4 shows the proportion of culture confirmed notifications by disease site (pulmonary or non-pulmonary) by quarter.
Figure 4. Proportion of culture confirmation among TB notifications by site of disease, England, over the last 2 years (last 8 quarters)
For the data behind this chart see Table 4 of the supplementary data tables.
In April to June (quarter 2) 2026, 51.3% (698 of 1,361) of notifications were culture confirmed. This increased to 61.5% (427 of 694), in those with pulmonary disease. In January to March (quarter 1) 2026, 73.8% of pulmonary notifications were culture confirmed compared with 74.4% in January to March (quarter 1) 2025. The 80% target of culture confirmation for pulmonary TB disease was reached in none of the last 8 quarters.
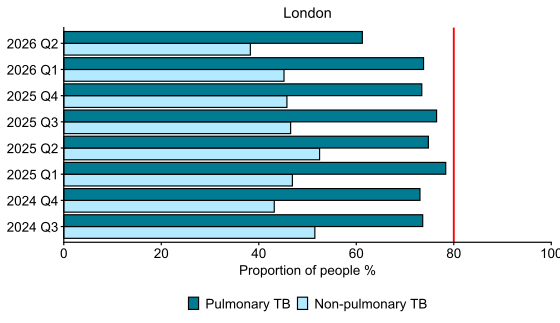
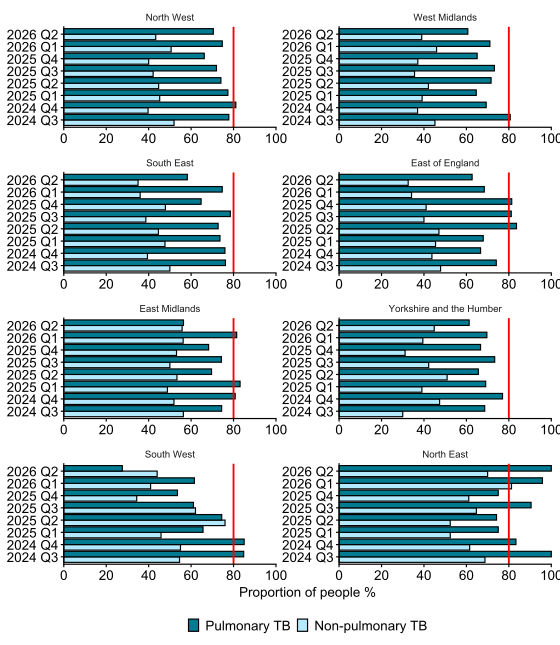
Figures 5a and 5b show the proportions of culture confirmation for pulmonary and non-pulmonary TB disease notifications by UKHSA regions.
Figure 5a. Proportion of culture confirmation among TB notifications in London by site of disease, over the last 2 years (last 8 quarters)
For the data behind this chart see Table 5 of the supplementary data tables.
Figure 5b. Proportion of culture confirmation among TB notifications by site of disease and UKHSA region, over the last 2 years (last 8 quarters)
For the data behind this chart see Table 5 of the supplementary data tables.
No UKHSA regions consistently achieved the 80% target of culture confirmation for pulmonary disease notifications. The highest proportions of culture confirmation for both pulmonary and non-pulmonary disease notifications were in the North East region.
For pulmonary TB, the largest changes in culture confirmation between January to March (quarter 1) of 2026 compared with the same quarter in 2025 were seen in:
- London and South West where proportion of notifications decreased
- North East and West Midlands where proportion of notifications increased
For non-pulmonary TB the largest changes in culture confirmation between January to March (quarter 1) of 2026 and the same quarter in 2025 were seen in:
- East of England, South East and South West where proportion of notifications decreased
- East Midlands, North East, North West and West Midlands where proportion of notifications increased
Multidrug-resistant or rifampicin-resistant TB
Resistance to antimicrobial therapy is a major concern for treatment of TB, historically requiring extended therapy of between 12 to 24 months. New 6-month regimens have now been recommended by the World Health Organization (WHO) and commissioned by NHS England. All notifications with a positive culture are tested for antimicrobial susceptibility using whole genome sequencing. If a notification does not have a positive culture, no resistance results are available.
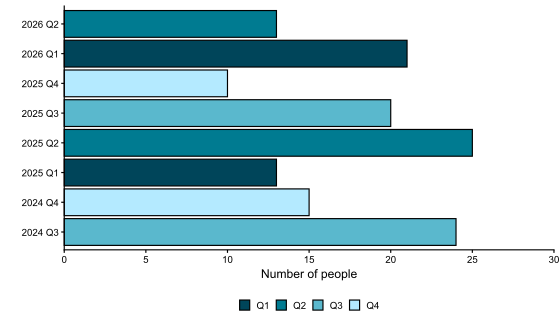
This report uses the WHO classification of multidrug-resistance or rifampicin-resistance (MDR or RR). Multidrug-resistance is classified as resistance to at least isoniazid and rifampicin. Figure 6 shows the number of culture confirmed notifications that are MDR or RR by quarter.
Figure 6. Number of culture confirmed TB notifications with MDR or RR TB at diagnosis, England, over the last 2 years (last 8 quarters)
For the data behind this chart see Table 6 of the supplementary data tables.
Note 3: this figure displays numbers rather than proportions due to low number of MDR or RR TB notifications.
Numbers of TB notifications with culture confirmed MDR or RR in quarter 2 2026 were lower than the same quarter in 2025 but may increase as laboratory results are finalised. For example, there were 21 MDR or RR notifications in quarter 1 2026 in the current report compared to 13 notifications previously reported for this quarter. A lower number of people were notified with MDR or RR TB (64 people) in the most recent 4 quarters (starting from quarter 2 2025) compared with the previous 4 quarters (77 people).
Treatment delays
Treatment delay is the time between the reported symptom onset date and treatment start date. It reflects either delays in individuals seeking or accessing healthcare or delays in diagnosis after presentation, or both. Treatment delays are reported only for pulmonary TB (Figure 7) due to the risk that extended treatment delays may increase transmission within communities. Analysis excludes notifications with a diagnosis made after death (post-mortem).
The joint UKHSA-NHS England 2021 to 2026 TB Action Plan has a target of a 5% reduction per year in the proportion of people with a treatment delay of 4 months or more compared with that in 2021 and 2022 (Action plan 3.1 and 3.2).
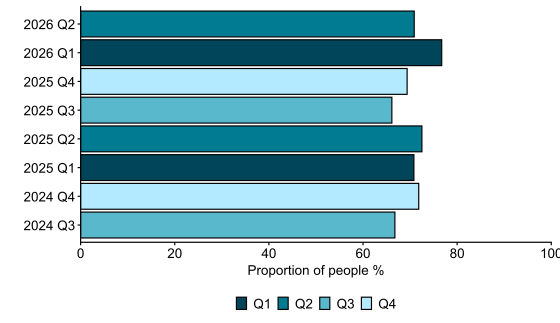
Data was missing for a considerable proportion of people due to missing date of onset of symptoms or treatment start date. In April to June (quarter 2) of 2026 this was missing for 197 people (28.6%) compared with 165 (21.8%) for April to June (quarter 2) of 2025. In January to March (quarter 1) of 2026 it was missing for 175 (26.2%) compared with 122 (17.4%) for January to March (quarter 1) of 2025.
In quarter 2 2026, 70.9% of people with pulmonary TB started treatment within 4 months of symptom onset, compared with 72.5% in quarter 2 2025. This proportion may change due to incomplete data in the latest quarter. Thus, further comparisons are made for the previous quarter compared with the same quarter in the previous year.
Figure 7. Proportion of pulmonary TB notifications starting treatment within 4 months (symptom onset to treatment start), England, over the last 2 years (last 8 quarters)
For the data behind this chart see Table 7 of the supplementary data tables.
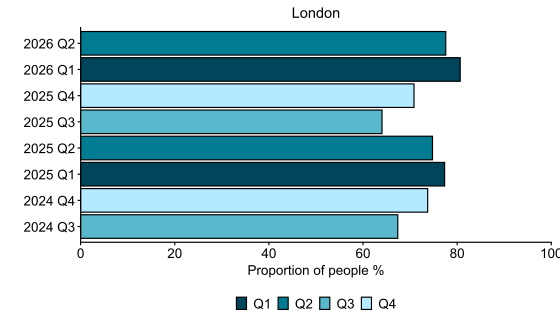
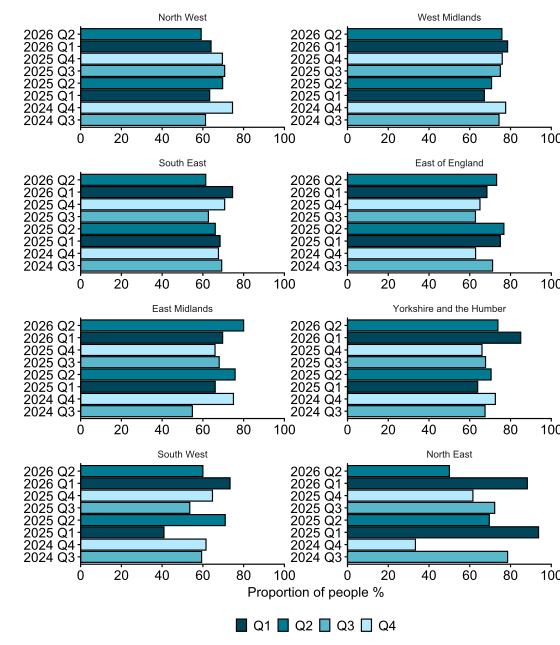
Figures 8a and 8b show the proportion of people starting treatment within 4 months by UKHSA region and quarter.
Figure 8a. Proportion of pulmonary TB notifications in London starting treatment within 4 months (symptom onset to treatment start), over the last 2 years (last 8 quarters)
For the data behind this chart see Table 8 of the supplementary data tables.
Figure 8b. Proportion of pulmonary TB notifications starting treatment within 4 months (symptom onset to treatment start) by UKHSA region, quarter 3 (July to September) 2024 to April to June (quarter) quarter 2 (April to June) 2026
For the data behind this chart see Table 8 of the supplementary data tables.
In January to March (quarter 1) of 2026 compared with January to March (quarter 1) of 2025, the proportion of people with TB who started treatment within 4 months of symptom onset was:
- higher for the East Midlands, South East, South West, West Midlands and Yorkshire and the Humber
- lower for the East of England and North East
- similar for London and North West
Treatment outcomes
Treatment outcomes at or before 12 months from start of treatment are reported for people notified up to April to June (quarter 2) of 2025 with known or assumed drug-sensitive TB, the majority of whom should have completed treatment within 12 months of treatment start. Data is not presented for those notified after April to June (quarter 2) of 2025 as many are not expected to have completed treatment. The data excludes people in the drug-resistant cohort and those with central nervous system (CNS), spinal, miliary, cryptic disseminated and meningococcal TB as treatment time for these groups usually exceeds 12 months.
The joint UKHSA-NHS England 2021 to 2026 TB Action Plan has a target of 90% treatment completion at 12 months by 2026 (Action 4.1) in those treated for drug-sensitive TB and expected to complete within 12 months.
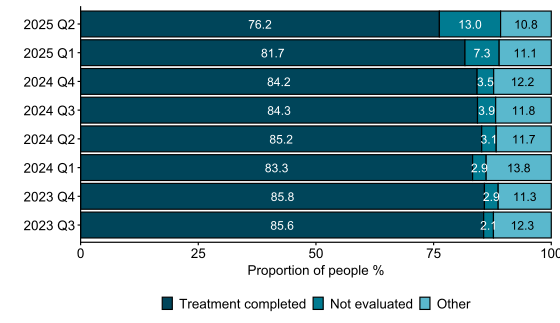
Where treatment outcome is reported as not known or transferred to a different country, data is included in the not evaluated group. Figure 9a shows outcomes for notifications where treatment is complete, not evaluated or other. The category ‘other’ comprises those who died, were lost to follow-up, are still on treatment (treatment period may be extended beyond 12 months in some cases) or where the treatment was stopped. The proportion of each of these is shown in Figure 9b.
Figure 9a. Outcomes at 12 months for people treated for drug-sensitive TB with expected treatment duration under 12 months, England, quarter 1 (January to March) 2023 to quarter 2 (April to June) 2025
For the data behind this chart see Table 9 of the supplementary data tables.
Figure 9b. Proportion of people in the ‘Other’ outcome category at 12 months for people treated for drug-sensitive TB with expected treatment duration under 12 months, England, quarter 1 (January to March) 2023 to quarter 2 (April to June) 2025
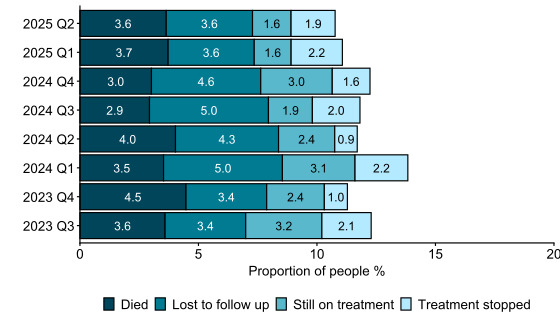
For the data behind this chart see Table 10 of the supplementary data tables.
Note 4: excludes people in the drug-resistant cohort and those with CNS, spinal, miliary or cryptic disseminated TB. People included here as drug-sensitive TB notifications include those with known drug sensitivities and those with no information on drug sensitivity or not known to be high-risk for MDR or RR TB and who were therefore not treated as MDR or RR notifications.
Note 5: not evaluated includes unknown and transferred out.
The proportion of people with drug sensitive TB (with an expected treatment duration of less than 12 months) who completed treatment at 12 months was 76.2% for people notified in quarter 2 2025 compared with 85.2% in quarter 2 2024.
Note that the latest 4 quarters evaluated tend to show a high proportion of people with treatment outcomes recorded as “not evaluated” despite having started at least 12 months previously. This reflects a delay in reporting the final outcome. The proportion not evaluated is expected to decrease with time. For those notified between July to September quarter 3 2023 and April to June quarter 2 2025 the highest proportion of treatment completed was observed in quarter 3 2023 at 82.5%.
Social risk factors
Social risk factors (SRFs) are reported as categorical yes or no variables with current or past history recorded as yes. Information on these social risk factors is collected through the routine surveillance system via interviews by the clinical team. Social risk factors that are recorded include current or history of prison, drug or alcohol misuse, homelessness, mental health needs and asylum seeker status. Data reported is only for people aged over 15 years due to low numbers in young children.
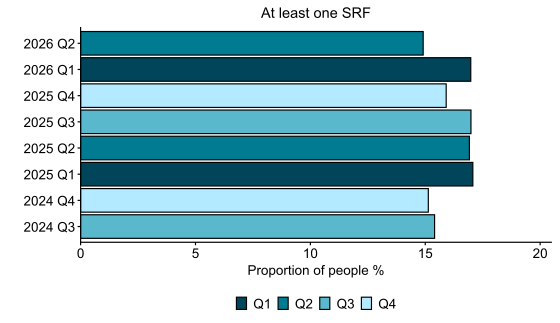
Figure 10a. Proportion of TB notifications (15 years or older) with at least one social risk factor (SRF), England, over the last 2 years (last 8 quarters)
For the data behind this chart see Table 11 of the supplementary data tables.
Note 6: the axes on the figure for people with at least one SRF (Figure 10a) are different to that for individual SRFs (Figure 10b) due to the higher proportion of people with at least one SRF.
In quarter 2 2026, 14.9% of people with TB aged 15 years and older had at least one SRF reported. This is similar compared with quarter 2 2025 (16.9%).
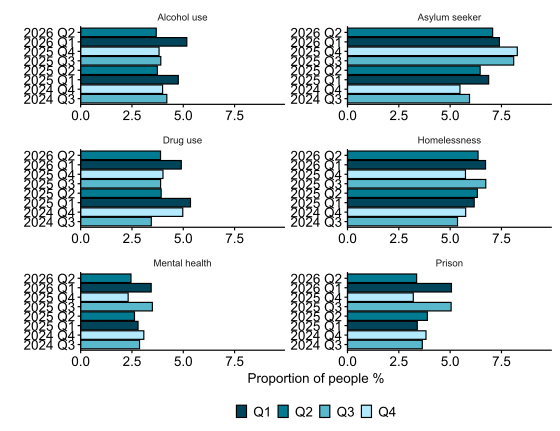
For single risk factors, shown in Figure 10b, the proportion of people with TB in April to June (quarter 2) 2026 with:
- alcohol misuse was similar to quarter 2 2025
- asylum seeker status was similar to quarter 2 2025
- current or a history of drug misuse was similar to quarter 2 2025
- current or a history of homelessness was similar to quarter 2 2025
- mental health needs was similar to quarter 2 2025
- current or history of imprisonment was similar to quarter 2 2025
Figure 10b. Proportion of TB notifications (15 years or older) by social risk factor, England, over the last 2 years (last 8 quarters)
For the data behind this chart see Table 11 of the supplementary data tables.
Data sources and methodology
Data sources and comprehensive methodological information can be found in the Quality and Methodology Information (QMI) report.
Background information
This report aims to provide timely and up-to-date figures of important epidemiological indicators to inform ongoing TB control efforts in England.
Note that data for 2026 is provisional and subject to validation and should be interpreted with caution. The data used for this report was extracted on 9 July 2026.
This report presents quarterly data on people with tuberculosis (TB) disease notified to the National TB surveillance system (NTBS) in England. Notifications include patients with culture confirmed TB or if a patient has started treatment for TB based on their clinical presentation. It is mandatory to notify cases of TB in the UK within 3 working days of making or suspecting a diagnosis of TB. You can find details about notification of TB online. Most health protection functions are devolved to the other UK nations’ public health teams in the UK, so this report only covers TB notifications and data from England.
Detailed results for data up to the end of 2024 are published in the annual report.
This report aims to provide timely and up-to-date figures of important epidemiological indicators to inform ongoing TB control efforts in England.
TB notifications
People who are diagnosed with TB in England, Wales, Scotland and Northern Ireland must be notified through the NTBS. This report only includes data for individuals with TB who are resident in England or are treated in England (including individuals who are homeless or visiting from abroad). Individuals with TB are reported by area of residence and by calendar year quarter of notification. UKHSA region was derived from UKHSA region of residence based on individual’s residential postcode. If missing, UKHSA region in which treatment occurred was used, for example if a person had no fixed abode. Data from April to June (quarter 2) of 2026 onwards is provisional and are provisional for treatment outcomes for those notified from April to June (quarter 2) of 2025 onwards. Verification and data cleaning and recoding, as conducted for the annual TB report dataset is not yet complete for provisional data.
Culture confirmation
Microbiological culture from biological specimens from persons with suspected disease confirms diagnosis and provides valuable information on antimicrobial susceptibility of TB and possible transmission events between persons notified with TB. It is noted that suitable specimens from children and from non-pulmonary sites are harder to obtain and culture from lower numbers of viable bacteria.
Site of disease
Site of disease is classified as pulmonary and therefore potentially infectious through airborne transmission if disease was recorded in the lungs, larynx or was recorded as miliary (that is, disseminated TB). If none of these sites were recorded, disease is classified as non-pulmonary disease. People can have multiple sites of disease and have pulmonary and non-pulmonary disease sites.
Social risk factors including prison and asylum status
People with TB are reported as having at least one social risk factor (SRF) (‘yes’) if any of the 6 SRFs has ‘yes’ recorded. As a result, the denominator is all notifications. This assumes that people for whom no data was recorded for individual SRFs were a ‘no’ and may result in underestimation. The 6 SRFs are:
- current alcohol misuse
- current or a history of homelessness
- current or a history of imprisonment
- current drug misuse
- asylum seeker status
- mental health needs
Data for individual social risk factors reported is limited to those with recorded data, for example a ‘yes’ or a ‘no’. As a result, the denominators for these are smaller than all notifications due to missing data. If there is significant under-reporting of SRFs in those with missing data, this should result in a better estimate of the true proportion of the people with each SRF. However, if data is more likely to be recorded if the response is a ‘yes’ this could result in an over-estimate. This may be the case for the asylum seeker SRF.
Mental health needs are recorded by TB case managers and is based on their judgement if mental health concerns are likely to affect the person’s ability to complete treatment.
Alcohol misuse is as recorded by case managers and is based on their judgement if current alcohol misuse is likely to affect treatment.
History of drug misuse, homelessness and prison are self-reported by individuals and are first asked as a ‘yes’ or ‘no’ response and then asked for additional information on the duration. This is then recorded; as either, within the last 5 years or more than 5 years ago. Unless indicated otherwise, analyses here present these SRFs as ‘yes’ if either history of, or a duration value, was recorded.
Data for SRFS are reported only for people aged over 15 years due to low numbers in young children.
Treatment delay
Treatment delay is calculated as the days difference between self-reported date of symptom onset and the date treatment started. People with either a missing symptom onset date or treatment start date have no value calculated for treatment delay and are not included in the denominator for the proportion of people with treatment delay.
Treatment outcome
For people expected to complete treatment in 12 months, if no treatment outcome at 12 months was recorded this was recoded as ‘not evaluated’. Hence, the denominator for the proportion of people completing treatment in 12 months includes all people in this group.
Further information and contact details
Feedback and contact information
To provide feedback and for all queries relating to this document, please contact tbunit@ukhsa.gov.uk
Official statistics
Our statistical practice is regulated by the Office for Statistics Regulation (OSR). OSR sets the standards of trustworthiness, quality and value in the Code of Practice for Statistics that all producers of official statistics should adhere to. You are welcome to contact us directly by emailing tbunit@ukhsa.gov.uk with any comments about how we meet these standards. Alternatively, you can contact OSR by emailing regulation@statistics.gov.uk or via the OSR website.
UKHSA is committed to ensuring that these statistics comply with the Code of Practice for Statistics. This means users can have confidence in the people who produce UKHSA statistics because our statistics are robust, reliable and accurate. Our statistics are regularly reviewed to ensure they support the needs of society for information. They were last formally reviewed internally in spring 2023. Actions following this review have continued to improve the trustworthiness, quality and value of the statistics, including:
- the automation of data processing to improve the accuracy of the statistics
- improved transparency of assessment of data, methods and quality assurance via publication of the accompanying quality and methodology information report
- simplified commentary to better enable users to understand the key messages
- clearer advice on appropriate use of the statistics, including consideration of seasonal trends in the data