Domestic air pollution emissions from transport in 2024
Published 14 July 2026

© Crown copyright 2026
This publication is licensed under the terms of the Open Government Licence v3.0 except where otherwise stated. To view this licence, visit nationalarchives.gov.uk/doc/open-government-licence/version/3 or write to the Information Policy Team, The National Archives, Kew, London TW9 4DU, or email: psi@nationalarchives.gov.uk.
Where we have identified any third party copyright information you will need to obtain permission from the copyright holders concerned.
This publication is available at https://www.gov.uk/government/statistics/transport-and-environment-statistics-2024--2/domestic-air-pollution-emissions-from-transport-in-2024
1. About this release
This release presents statistics on domestic air pollution emissions from transport. Transport vehicles emit gases or other substances which have significant health consequences.
The most significant air pollutants from the transport sector are nitrogen oxides (NOx) and particulate matter (PM).
Air pollution figures for the United Kingdom are measured by the National Atmospheric Emissions Inventory (NAEI) and emissions of air pollutants by sector are summarised by the Department for Environment Food and Rural Affairs (DEFRA) as accredited official statistics[footnote 1]. For more information, see the About these statistics section.
Data on air pollution from transport can be found on the energy and environment data tables page.
In 2020 transport was significantly impacted by the COVID-19 pandemic, as people were instructed to stay at home as much as possible. Restrictions were eased in 2021, and the last restrictions removed in 2022. This impact should be considered when interpreting these statistics.
2. Main findings
In 2024, transport was responsible for:
- 29% of NOx emissions, a 1 percentage point decrease from 2023 and a 4 percentage point decrease from 2019
- 26% of PM2.5 emissions, a 1 percentage point increase from 2023 and the same proportion as in 2019
- 22% of PM10 emissions, a 1 percentage point increase from 2023 and the same proportion as in 2019
Since 1990, air pollutants from transport have decreased considerably, primarily due to newer vehicles emitting lower levels of pollutants.
3. Domestic air pollutants changes over time
There have been significant reductions of all air pollutants from transport between 1990 and 2024.
Table 1: Change in domestic air pollutants from transport from 1990 to 2024 (ENV0301)
| Air pollutant | Percentage change 1990 to 2024 |
|---|---|
| PM2.5 | -65% |
| PM10 | -52% |
| NOx | -81% |
| SO2 | -94% |
| CO | -95% |
| Benzene | -96% |
| 13-butadiene | -98% |
| Lead | -97% |
Chart 1: Domestic nitrogen oxides (NOx) emissions by transport mode, 1990 to 2024 (ENV0301)
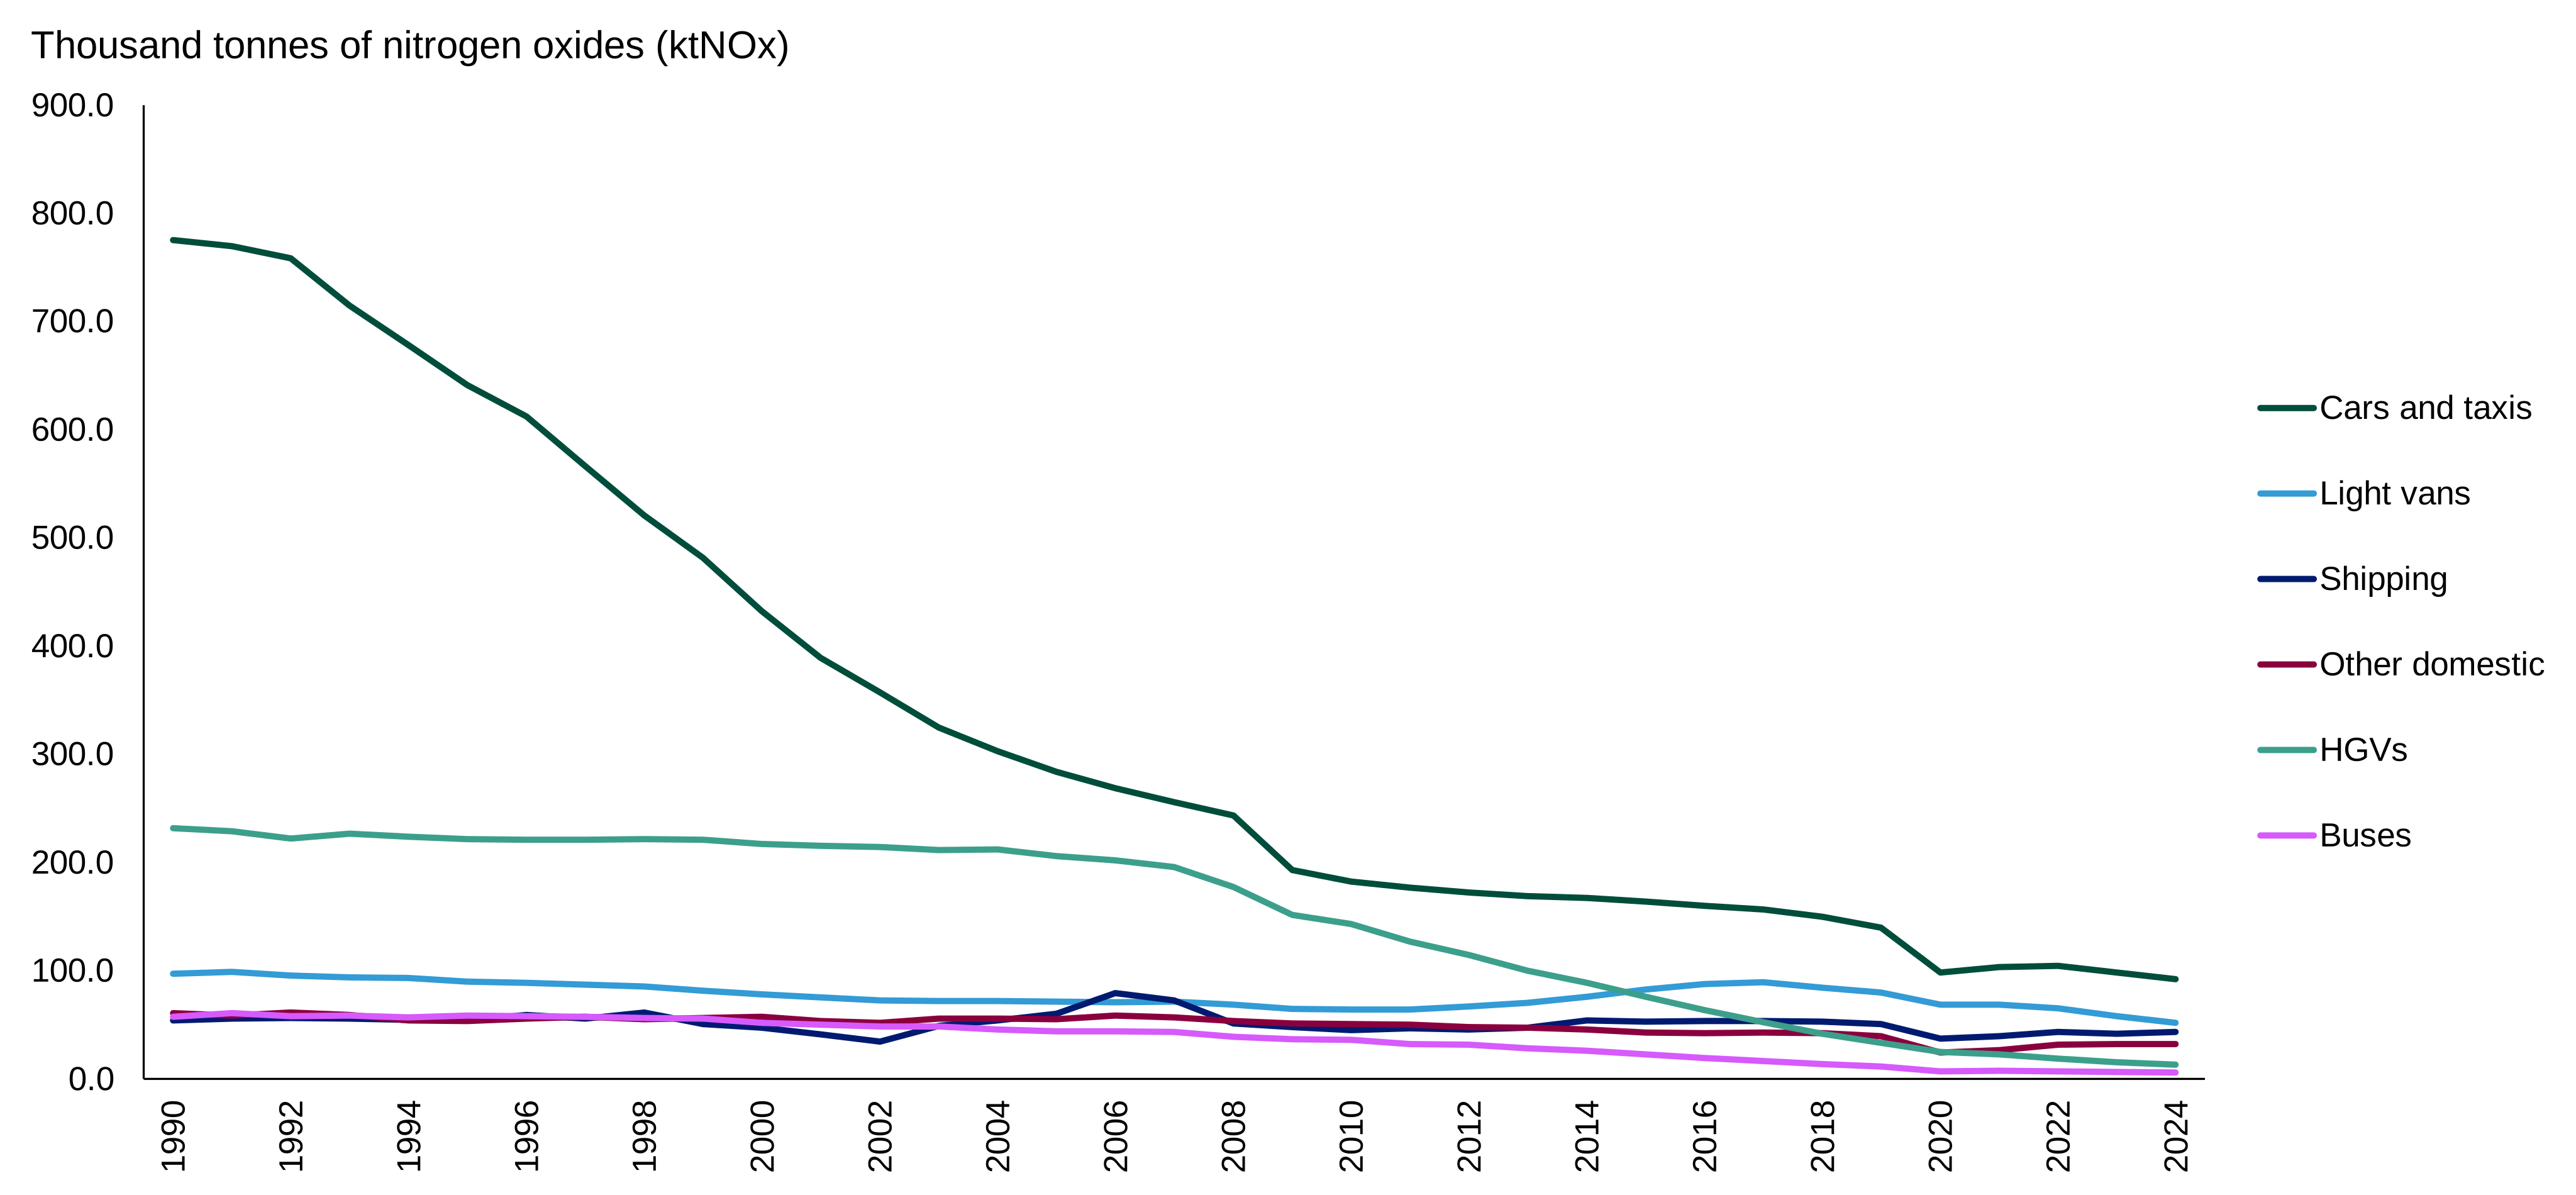
HGVs Stands for Heavy Goods Vehicles.
Other domestic Category includes motorcycles and mopeds, other road transport, rail, domestic aviation (landing and take-off), other non-road transport, military aircraft and shipping.
Chart 1 is a line chart showing that since 1990 NOx emissions from:
- Cars and taxis decreased by 683.2 kilotonnes (88% decrease from 1990), a significantly larger absolute decrease than any other domestic transport mode from a much higher baseline
- Light vans decreased by 45.1 kilotonnes (46% decrease from 1990)
- HGVs decreased by 218.8 kilotonnes (94% decrease from 1990)
- Buses and coaches decreased by 54.8 kilotonnes (86% decrease from 1990)
- Domestic shipping decreased by 10.6 kilotonnes (19% decrease from 1990)
There have been revisions to domestic and international shipping emissions estimates this year: for further detail see the About these statistics section.
Most domestic NOx emissions come from cars and taxis. Over time, reductions in NOx emissions from cars and taxis have been caused primarily by the introduction of legislative vehicle emission standards (for more details on the impact of these legislative standards, see ENV302).
In 2020 transport was significantly impacted by the COVID-19 pandemic, as people were instructed to stay at home as much as possible. Restrictions were eased in 2021, and the last restrictions removed in 2022.
In 2024, NOx emissions from domestic transport decreased by 5% compared to 2023 and 33% lower than in 2019.
5. Particulate matter with aerodynamic diameter of less than 2.5 micrometres (PM2.5)
Chart 2: Domestic PM2.5 emissions from road transport by source, 1990 to 2024 (ENV0301)
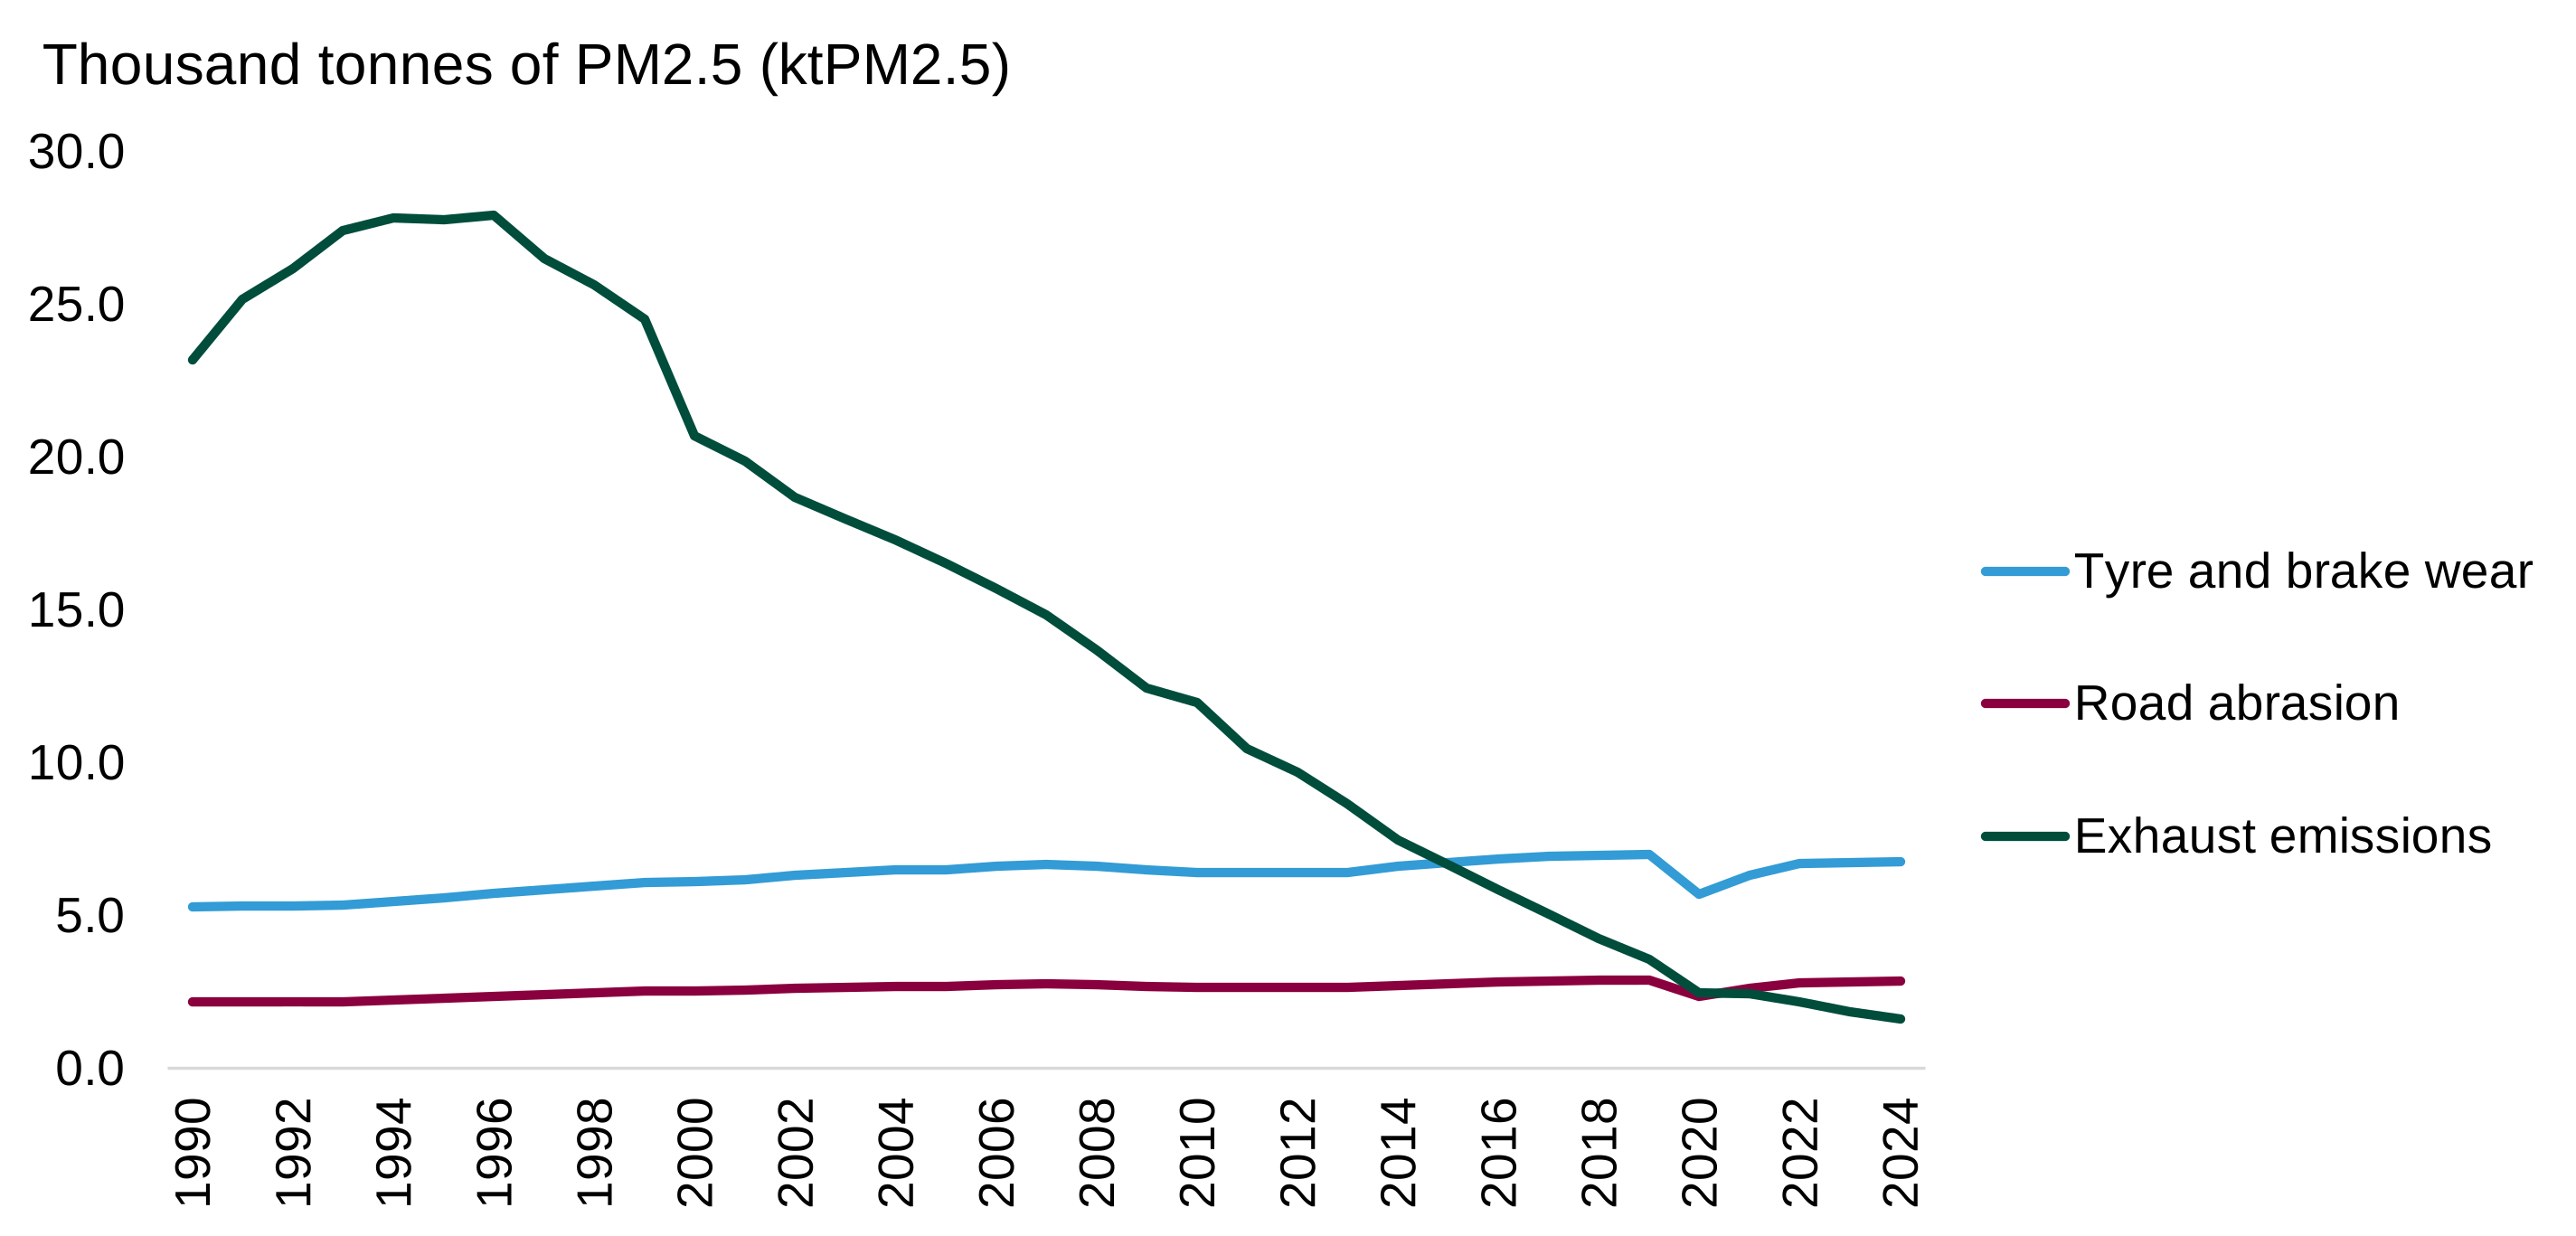
Chart 2 is a line chart showing that from 1990 to 2024, PM2.5 emissions from:
-
Exhaust emissions decreased by 93%, from 23.2 ktPM2.5 in 1990 to 1.6 ktPM2.5 in 2024
-
Tyre and brake wear increased by 28%, from 5.3 ktPM2.5 in 1990 to 6.8 ktPM2.5 in 2024
-
Road abrasion increased by 31%, from 2.2 ktPM2.5 in 1990 to 2.9 ktPM2.5 in 2024
Exhaust emissions have decreased significantly from 1996 to 2024 due to stricter emissions standards. Non-exhaust emissions have increased 19% for PM2.5 between 1996 and 2024, in part due to the rise in the distance travelled by vehicles each year and the trend towards heavier vehicles (DEFRA emissions of air pollutants statistics).
PM2.5 emissions from transport sources, including non-road sources, are available in table ENV0301.
6. About these statistics
Our statistical practice is regulated by the Office for Statistics Regulation (OSR). OSR sets the standards of trustworthiness, quality and value in the Code of Practice for Statistics that all producers of official statistics should adhere to. Environment.Stats@dft.gov.uk with any comments about how we meet these standards.
Data sources
Air pollution figures for the UK are measured by the National Atmospheric Emissions Inventory (NAEI). Data here covers the period of 1990 to 2024. Unlike GHG emissions expressed as CO2e, there is no agreed way of comparing relative effects of different air pollutions. As a result, this report does not include a summed total of all air pollutants.
Each year the latest data are added to the NAEI and the time series from 1990 is updated to take account of improved data and any advances in the methodology used to estimate the emissions. You can find out more in the NAEI’s Informative Inventory Report.
Updates to domestic shipping emissions
There has been an update to the method for estimating domestic shipping emissions to align with data on the amount of fuel sold, moving away from methods based on estimates of the fuel used. There are significant changes across all years from 1990 to 2024.
Previously, bottom-up estimates of emissions were reported based on ship movement data, which allowed an estimate of the amount of fuel used. The updated method uses this same approach but then normalises the bottom-up estimates to align with DESNZ’s Digest of UK Energy Statistics (DUKES) data on the amount of fuel sold.
Modelled emissions estimates for inland waterways and port machinery are also now normalised to align with DUKES data, but estimates for military shipping are based on fuel purchases by the Ministry of Defence (MoD).
Further information can be found:
- In the ‘Revisions to the UK Greenhouse Gas Inventory’ section of DESNZ’s Final UK 1990-2024 greenhouse gas emissions statistics
- In the ‘MS 10 National navigation and fishing’, ‘MS 11 Inland Waterways’ and ‘MS 12 International shipping’ sections, of the UK 1990-2024 National Inventory Document
- Under section 3.3.5.4 of the UK Informative Inventory Report from the National Atmospheric Emissions Inventory
International air pollutants
Emissions from aviation (cruise) and international shipping are not included in the national total that is reported to the United Nations Economic Commission for Europe (UNECE) and not currently included in this report. These emissions are reported in table ENV0301 separately as memo items.
7. Instructions for printing and saving
Depending on which browser you use and the type of device you use (such as a mobile or laptop) these instructions may vary.
You will find your print and save options in your browser’s menu. You may also have other options available on your device. Tablets and mobile device instructions will be specific to the make and model of the device.
8. How to search
Select Ctrl and F on a Windows laptop or Command and F on a Mac.
This will open a search box in the top right-hand corner of the page. Type the word you are looking for in the search bar and press enter.
Your browser will highlight the word, usually in yellow, wherever it appears on the page. Press enter to move to the next place it appears.
9. Contact details
Transport energy and environment statistics
Email environment.stats@dft.gov.uk
Media enquiries 0300 7777 878
To hear more about DfT statistical publications as they are released, follow us on X at DfTstats.
10. Footnotes
-
Accredited official statistics are called National Statistics in the Statistics and Registration Service Act 2007. ↩