Total Income from Farming in the regions of England in 2025
Updated 24 September 2026
Applies to England

© Crown copyright 2026
This publication is licensed under the terms of the Open Government Licence v3.0 except where otherwise stated. To view this licence, visit nationalarchives.gov.uk/doc/open-government-licence/version/3 or write to the Information Policy Team, The National Archives, Kew, London TW9 4DU, or email: psi@nationalarchives.gov.uk.
Where we have identified any third party copyright information you will need to obtain permission from the copyright holders concerned.
This publication is available at https://www.gov.uk/government/statistics/total-income-from-farming-for-the-regions-of-england/total-income-from-farming-in-the-regions-of-england-in-2025
This publication contains the summary of the farm accounts in the regions of England for 2025 and addresses trends for the ITL1 regions. More detailed datasets have been published alongside this release, with breakdowns at ITL1, ITL2 and ITL3 level. Please note, for this publication we are using ITL (2021) boundaries. More information about ITLs (International Territorial Levels) can be found here.
This publication is primarily intended to provide a comparison of the England regions only. Definitive TIFF values for England should be taken from Total income from farming in England. All TIFF values presented in this release are in current prices (i.e. not adjusted for inflation). This is considered to be the most intuitive way to present year-on-year comparisons.
Total Income from Farming (TIFF) is the income to those who own businesses within the agricultural industry. It is the total profit from all farming businesses on a calendar year basis. It measures the return to all entrepreneurs for their management, inputs, labour and capital invested. The term ‘income’ used throughout this notice refers to TIFF.
Section 1: Key messages
-
TIFF in England in 2025 increased in 5 of the 8 ITL1 regions. The largest value increase was the South West which rose by £315 million (+38.4%).
-
The two largest contributors to England TIFF in 2025 at ITL1 level were the South West (21.0%) and the East Midlands (16.4%).
-
The two ITL1 regions with the lowest contribution to TIFF in England in 2025 were the North East (2.1%) and Yorkshire and the Humber (9.6%).
Figure 1.1: TIFF in each ITL1 region of England, 2025 to 2024 (£ million)
| ITL1 region name | 2024 | 2025 |
|---|---|---|
| South West | 819 | 1133 |
| East Midlands | 831 | 884 |
| East of England | 902 | 853 |
| West Midlands | 637 | 714 |
| London and the South East | 528 | 601 |
| North West | 394 | 583 |
| Yorkshire and the Humber | 517 | 516 |
| North East | 153 | 115 |
Notes:
- The ITL1 regions for Greater London and the South East have been combined due to limited agricultural activity in Greater London.
-
The highest TIFF in the ITL1 regions in 2025 was in the South West, which contributed £1.1 billion to TIFF England. The South West region has been the highest contributor to TIFF England in 4 of the last 16 years and has been the second or third highest contributor in the remaining years. In 2025, the South West increased by £315 million (+38.4%) from 2024, the largest value increase among the ITL1 regions.
-
The lowest TIFF in the ITL1 regions in 2025 was the North East, contributing £115 million, a decrease of £37 million (-24.5%) from 2024. The North East has been the lowest contributor to TIFF England over the past 16 years.
-
The largest percentage change in TIFF was the North West region, which increased by 47.9% from 2024 to £583 million in 2025. The smallest percentage change in TIFF in 2025 was the Yorkshire and the Humber region, which decreased by 0.2% to £516 million.
Figure 1.2: TIFF per hectare of agricultural land in each ITL1 region of England, 2025 to 2024 (£ per ha)
| ITL1 region name | 2024 | 2025 |
|---|---|---|
| West Midlands | 683 | 766 |
| East Midlands | 691 | 735 |
| South West | 457 | 633 |
| North West | 420 | 621 |
| East of England | 645 | 610 |
| London and the South East | 464 | 527 |
| Yorkshire and the Humber | 464 | 463 |
| North East | 253 | 191 |
Notes:
- Data for hectares of agricultural land is taken from June Survey H10 “Total area on agricultural holdings” (Total croppable area + total permanent grassland + other land on agricultural holdings).
-
The ITL1 region with the highest TIFF per hectare in England in 2025 was the West Midlands, which had a TIFF per hectare of £766. This is an increase of £82 per hectare (+12.1%) from 2024.
-
The largest differences between absolute TIFF and TIFF per hectare were observed in the West Midlands and the South West. The West Midlands had the highest TIFF per hectare but only the fourth highest absolute TIFF value in 2025. Conversely, the South West had the highest TIFF of any ITL1 region in England but only the third highest TIFF per hectare.
Section 2: Outputs and subsidies
Below is a summary of the key points regarding outputs and subsidies at ITL1 level. Any comparison made here between current and past years is made using current prices data as this is widely considered to be the most intuitive and helpful for year on year change.
2.1 Overview
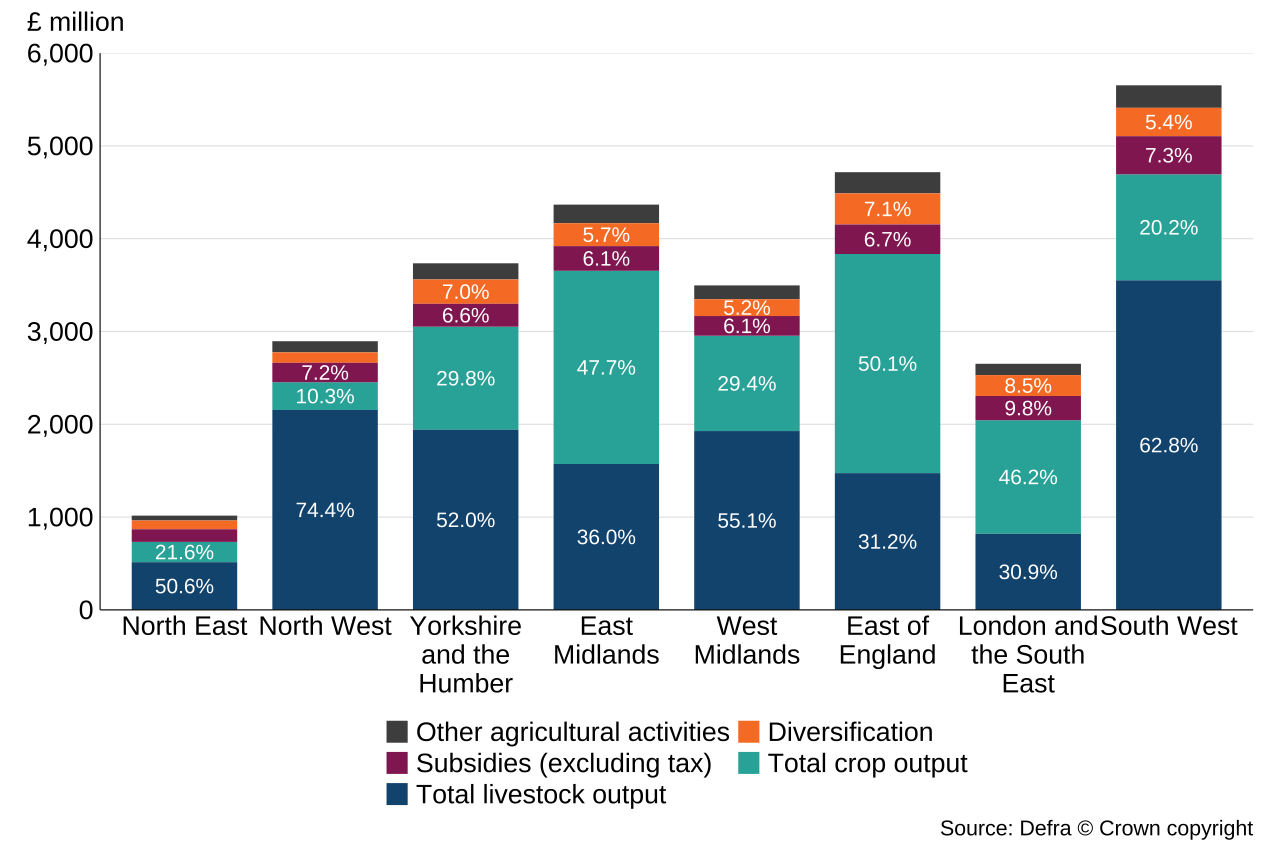
Figure 2.1 Outputs and subsidies from each ITL1 region of England in 2025 split by percentage
Notes:
- To improve clarity, the item ‘Inseparable non-agricultural activities’ has been renamed ‘Diversification’.
Figure 2.1 shows the value and percentage composition of agricultural industry outputs and subsidies in 2025 across England’s eight ITL1 regions. Values are presented in £ million. The output categories and subsidies represent the main sources of income received by farmers within each region.
Total livestock output was the largest output value in 5 of the 8 ITL1 regions: North East, North West, Yorkshire and the Humber, West Midlands and South West. Total crop output was the largest output value in the remaining 3 ITL1 regions: East of England, East Midlands and London and the South East. Subsidies less tax made up between 6.1% (West Midlands and East Midlands) and 13.4% (North East) of total output value for the ITL1 regions.
2.2 Livestock
Figure 2.2 Top 3 ITL1 regions in England for total livestock output from 2020 to 2025 (£ million)
| Year | South West | North West | Yorkshire and the Humber |
|---|---|---|---|
| 2020 | 2,420 | 1,456 | 1,334 |
| 2021 | 2,536 | 1,592 | 1,434 |
| 2022 | 3,068 | 1,937 | 1,643 |
| 2023 | 2,962 | 1,876 | 1,685 |
| 2024 | 3,171 | 1,980 | 1,733 |
| 2025 | 3,551 | 2,155 | 1,940 |
-
The South West was the highest contributor to total livestock output value in England’s ITL1 regions for the past 6 years. In 2025, the South West had a total livestock output value of £3.6 billion, an increase of £380 million (+12.0%) from 2024. This increase was mainly driven by higher values for milk, which increased by £187 million (+12.5%), and beef, which increased by £150 million (+23.4%). The South West region is home to a third of England’s total cattle population, with a herd size of 1.6 million head at June 2025.
-
The North West has remained the second largest contributor to livestock output value among England’s ITL1 regions over the last six years. In 2025, the North West had a livestock output value of £2.2 billion, an increase of £175 million (+8.8%) from 2024.
-
The 3 regions shown in the table (the South West, the North West and Yorkshire and the Humber) have together contributed, on average, 54.0% of England’s total livestock output value over the past six years.
2.3 Crops
Figure 2.3 Top 3 ITL1 regions in England for total crop output from 2020 to 2025 (£ million)
| Year | East of England | East Midlands | London and the South East |
|---|---|---|---|
| 2020 | 1,871 | 1,392 | 1,094 |
| 2021 | 2,385 | 1,897 | 1,318 |
| 2022 | 2,844 | 2,303 | 1,616 |
| 2023 | 2,593 | 2,277 | 1,397 |
| 2024 | 2,536 | 2,077 | 1,252 |
| 2025 | 2,362 | 2,082 | 1,224 |
-
The East of England was the highest contributor to total crop output value among England’s ITL1 regions for the past six years. In 2025, the East of England had a total crop output of £2.4 billion, a decrease of £175 million (-6.9%) from 2024. The East of England has the highest number of cereal farms of any ITL1 region, with 3,832 commercial holdings at June 2025 and a total cereal area of 728 thousand hectares.
-
The East Midlands has remained the second largest contributor to total crop output value among England’s ITL1 regions in each of the past six years. In 2025, it had a total crop output value of £2.1 billion, an increase of £6.0 million (+0.3%) from 2024.
-
In 2025, 7 out of 8 ITL1 regions experienced reductions in total crop output. Across all 8 regions, the average decrease in the value of total crop output was £45.0 million. These decreases were largely driven by falls in UK cereal prices due to ample global supplies. Hot and dry weather during key planting and harvesting periods also affected production volumes of some major cereal crops, resulting in lower yields and variable crop quality.
-
The 3 regions shown in the table (the East of England, the East Midlands and the South East (including London)) have together contributed on average 59.0% of the total crop output value in England in the past six years.
2.4 Other outputs and subsidies
Other outputs and subsidies includes all non-agricultural activities (diversified outcome e.g. rental of holiday cottages on farm), secondary activities (e.g. contract work to provide a combine for other farmers) and subsidies.
Figure 2.4 Other outputs and subsidies from each of the ITL1 regions of England in 2024 and 2025 (£ million)
| ITL1 Name | 2024 | 2025 |
|---|---|---|
| South West | 895 | 959 |
| East of England | 807 | 882 |
| East Midlands | 648 | 713 |
| Yorkshire and the Humber | 595 | 683 |
| London and the South East | 578 | 608 |
| West Midlands | 507 | 542 |
| North West | 406 | 442 |
| North East | 248 | 283 |
The South West had the highest other outputs and subsidies value of the ITL1 regions of England at £959 million, a £64 million (+7.2%) increase from 2024. The East of England had the second highest at £882 million, a £75 million (+9.3%) increase from 2024. On average the value of other outputs and subsidies across all 8 ITL1 regions increased by £54 million, with all regions showing an increase in value between 2024 and 2025.
Section 3: Inputs and costs
3.1 Overview
Figure 3.1 Inputs and costs from each ITL1 region of England in 2025 split by percentage
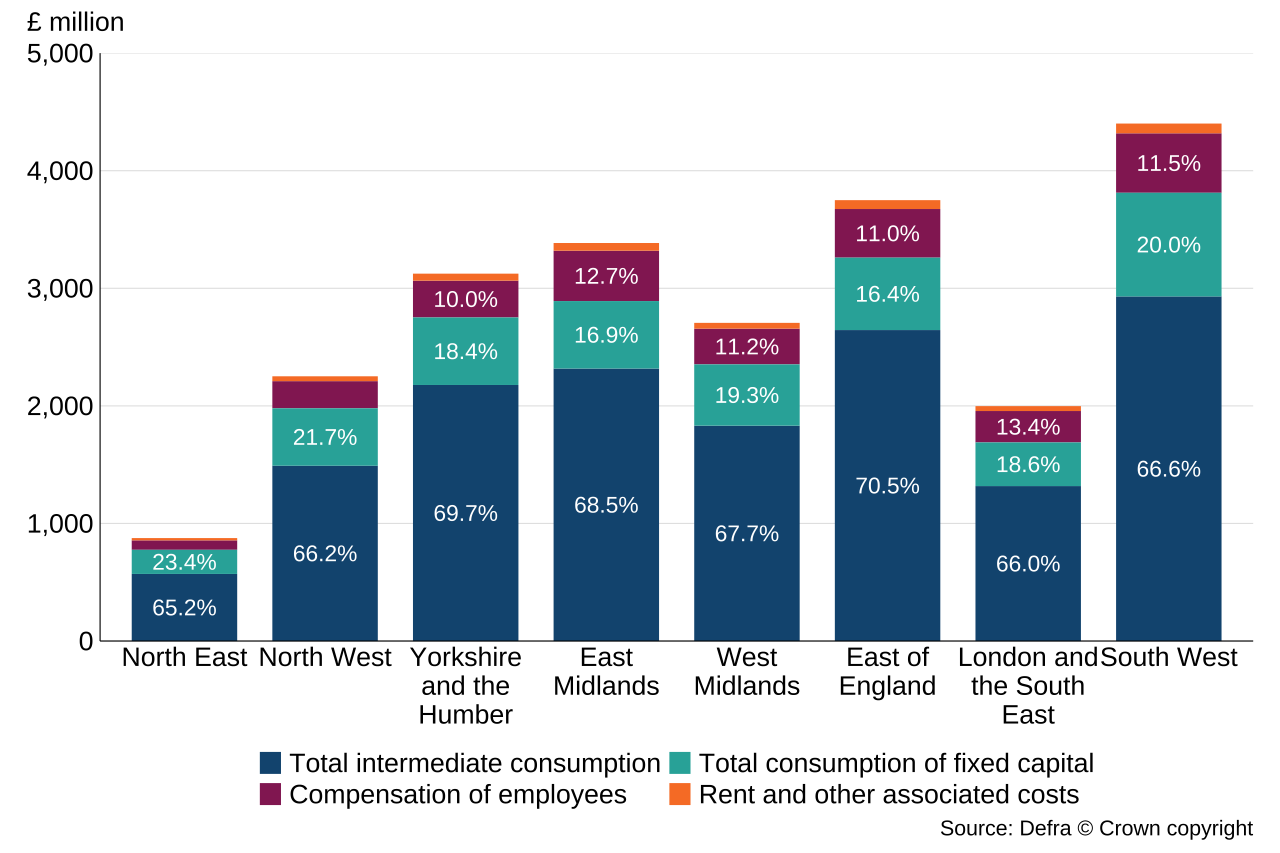
Figure 3.1 presents the value and percentage breakdown of agricultural industry inputs and costs in 2025 for England’s 8 ITL1 regions. Values are shown in £ million. The cost categories represent expenditure incurred by agricultural businesses.
Intermediate consumption was the largest cost across all of the England ITL1 regions, followed by total consumption of fixed capital, compensation of employees, and rent and other costs. Intermediate consumption accounted for between 65.2% (North East) and 70.5% (East of England) of total costs, while compensation of employees accounted for between 9.2% (North East) and 13.4% (London and the South East) across England’s ITL1 regions.
For the majority of the ITL1 regions, animal feed was the highest value item in intermediate consumption, with London and the South East region as the only exception. The South West region had the largest expenditure on animal feed at £1.1 billion. The intermediate consumption item with the second highest value across 7 out of 8 regions was other goods and services, which includes bills, insurance costs and hire of specialist contractors. In 2025, the East of England had the highest fertiliser cost at £337 million, followed by the East Midlands at £252 million. These two regions combined make up 45% of arable land in England at June 2025.
Section 4: Individual Region Breakdowns
More detailed breakdowns for each ITL1 region in 2025 will be published with the 2025 update of Agricultural facts: England regional profiles in October 2026.
Previous breakdowns at the ITL1 regions can be found on the Historical statistics notices on Agriculture in the English regions page.
Section 5 - About these statistics
5.1 Contact details
Responsible statistician: Alexandra Hall
Public enquiries: farmaccounts@defra.gov.uk
For media queries between 9am and 6pm on weekdays:
Telephone: 0330 041 6560
newsdesk@defra.gov.uk (monitored 9am to 6pm on weekdays)
5.2 Methodology
TIFF refers to income generated by production within the agricultural industry, including subsidies. TIFF represents business profits and remuneration for work done by owners and other unpaid workers. It excludes changes in the values of assets and stocks due to price changes, but includes non-agricultural activities such as further processing or tourist activities where these cannot be separated from the agricultural business. TIFF is the preferred measure of aggregate income for the agricultural industry, conforming to internationally agreed national accounting principles required by the UK National Accounts.
The regional accounts for England are constructed by apportioning each account item value (£) for England to the 133 ITL3 territories (County/unitary authorities) using coefficients derived from the Farm Business Survey (FBS) and June Survey of Agriculture and Horticulture (‘June Survey’) data. The FBS records detailed annual account data from a relatively small panel of farms whereas the June Survey records a snapshot of crop areas and livestock numbers as at June 1st each year. ITL1 (regional) and ITL2 estimates are then derived through aggregation of ITL3 account values. Latest account information for England can be found at Total income from farming in England.
The England level estimates used as a starting point for the estimates in this release were published by Defra on 24th September 2026.
5.3 Revisions
Revisions are intended to increase the precision of the estimates and are routinely the result of more data becoming available over time. Sometimes additional revisions are necessary to refine the methodology or correct historical errors.
TIFF is the relatively small difference between two large numbers and is therefore sensitive to small percentage changes in the values of Outputs and Intermediate Consumption. A combination of a revision downwards in Output and revision upwards in Intermediate Consumption leads to more sizeable revisions in percentage terms to GVA and TIFF.
For revisions to the underlying TIFF in England data, please see TIFF in England in 2025 release for further details.
Further information regarding revisions can be found on the webpage for Defra’s policy statement on revisions and correction.
5.4 Official Statistics
Our statistical practice is regulated by the Office for Statistics Regulation (OSR). OSR sets the standards of trustworthiness, quality and value in the Code of Practice for Statistics that all producers of official statistics should adhere to. You can read about how Official Statistics in Defra comply with these standards on the Defra Statistics website.
You are welcome to contact us directly with any comments about how we meet these standards using the contact details above. Alternatively, you can contact OSR by emailing regulation@statistics.gov.uk or via the OSR website.
5.5 Quality assurance
DEFRA has in place quality assurance processes to check the accuracy and reliability of the aggregate agricultural accounts that include:
-
Ongoing review of methods employed in the calculation of the accounts.
-
Assessment of the quality of the estimates of the accounts with experts within DEFRA.
-
Discussion of the accounts with external experts.
5.6 Development areas
DEFRA statisticians carry out a continuous review of methods employed in making estimates of the production and income accounts. This may lead to revisions to data series owing to improvements in methods, in addition to the use of more up-to-date information.
5.7 Main users and uses of these statistics
The aggregate agricultural accounts are used both within government and by the wider agricultural industry in conjunction with other economic information to:
-
Monitor the productivity and competitiveness of the farming industry.
-
Inform policy decisions and to help monitor and evaluate current policies relating to agriculture in the UK by Government.
-
Inform stakeholders of the performance of the agricultural industry.
-
Inform research into the economic performance of the agricultural industry.
5.8 User engagement
As part of our ongoing commitment to compliance with the Code of Practice for Official Statistics we wish to strengthen our engagement with users of TIFF in the regions of England data and better understand how data from this release is used. Consequently, we invite you to register as a user of the TIFF in the regions of England data, so that we can retain your details and inform you of any new releases and provide you with the opportunity to take part in any user engagement activities that we may run.
5.9 Future publications
These estimates for 2025 will be subject to minor (unless otherwise specified) revisions in future publications of TIFF in the regions of England where the availability of additional data and revised data will be incorporated to improve the accuracy of the estimates.
To find out the latest information on when UK government statistics will be released, please visit the statistics release calendar.
5.10 Other publications relevant to this release
A number of publications released by DEFRA, are relevant to this release. Below is a list of the key publications and links to them on GOV.UK