The People and Nature Survey for England: Monthly indicators for March 2022 (Official Statistics)
Published 18 May 2022
Applies to England

© Crown copyright 2022
This publication is licensed under the terms of the Open Government Licence v3.0 except where otherwise stated. To view this licence, visit nationalarchives.gov.uk/doc/open-government-licence/version/3 or write to the Information Policy Team, The National Archives, Kew, London TW9 4DU, or email: psi@nationalarchives.gov.uk.
Where we have identified any third party copyright information you will need to obtain permission from the copyright holders concerned.
This publication is available at https://www.gov.uk/government/statistics/the-people-and-nature-survey-for-england-monthly-indicators-for-march-2022-official-statistics/the-people-and-nature-survey-for-england-monthly-indicators-for-march-2022-official-statistics
1. Main findings
- In March 61% of adults in England said that they had spent time outside in green and natural spaces in the previous 14 days. This remained unchanged from February.
- The survey found 26% of adults had not spent any time in green and natural spaces in the previous 14 days, which was a slight increase on February (25%).
- The likelihood of visiting a green and natural space differed by household income. Those with a household income of less than £15,000 were less likely to have visited a green and natural space in the last 14 days (49%, 2.3 visits per person) than those with a household income of £15,000 – 49,999 (60%, 2.8 visits per person) or more than £50,000 (69%, 3.5 visits per person).
- The total number of visits made by adults to green and natural spaces in March was 299,828,943, an increase on the total number of visits made in February (294,715,030).
- The main reasons for not spending time outdoors in the last 14 days were ‘Bad / poor weather’ (33%) followed by ‘Poor physical health (or illness)’ (22%), ‘Too busy at home’ (20%) and ‘Too busy at work / with family commitments’ (16%).
- ‘Stayed at home to stop coronavirus spreading / Government restrictions’ as a barrier to spending time outside increased from 10% in February to 12% in March 2022.
- Close to four in ten adults said nature/wildlife (39%) and visiting green and natural spaces (40%) had been even more important to their wellbeing since coronavirus restrictions began.
2. Other pages in this release
The People and Nature Survey for England, led by Natural England, is one of the main sources of data and statistics on how people experience and think about the environment. It began collecting data via an online panel (adults aged 16 years and older) in April 2020, and runs continuously, in line with Government Statistical Service guidance on data collection during the COVID-19 pandemic.
The Official Statistics in this publication are based on a survey of 2,083 adult respondents conducted online continuously between March 1st and March 31st 2022 (inclusive). Throughout this bulletin, “this month” and “March” refers to this period.
Alongside this publication, a spreadsheet containing all the latest indicators for Year 2 of the survey (April 2021 – March 2022) has been published. Data from Year 1 of the survey (April 2020 – March 2021) can also be viewed. These figures have been updated with the specific People and Nature weight, and so can be directly compared to Year 2 figures. See ‘Methods and Limitations’ for more details.
Further information about the People and Nature Survey for England (including information on methods, strengths and limitations, and Official Statistics status) is available. To receive updates on the survey, including data releases and publications, sign-up via the People and Nature User Hub.
Results from this survey for March followed easing of social contact restrictions and most legal restrictions on meeting others outdoors being lifted in England. This page summarises the latest government advice on COVID-19 and this page details how to stay safe and help prevent the spread.
3. Official Statistics
Initial releases from the People and Nature Survey that used an interim weighting method were released as Experimental Statistics. This status highlighted to users that these Official Statistics were in the National Statistics testing phase and that Natural England was still working on further developing the methodologies used in their production whilst ensuring adherence to the Code of Practice for Statistics (the Code).
After one year of data collection, we have refined data quality assurances to capture additional metrics on data quality and finalised an optimal and specific weighting method for the People and Nature Survey. As such, releases from the People and Nature Survey that use the specific weighting method (as opposed to the interim weighing method) are no longer designated as ‘Experimental’ (a subset of Official Statistics) and are instead designated as Official Statistics. For further justifications behind this change, please see our brief statement.
4. Time spent in green and natural spaces
In March, 61% of adults in England said that they had spent time outside in green and natural spaces in the previous 14 days. This remained unchanged from February. Also, 26% of adults had not spent any time in green and natural spaces in the previous 14 days, which was a slight increase on February (25%). The proportion of adults not spending any time in green and natural spaces remains higher than August 2021 when it was at an all-time low of 21% (Figure 1).
Figure 1: The proportion of adults in England (weighted percentage) visiting a green and natural space in the last 14 days. In March, 61% of adults in England said that they had spent time outside in green and natural spaces in comparison to 26% who had not.
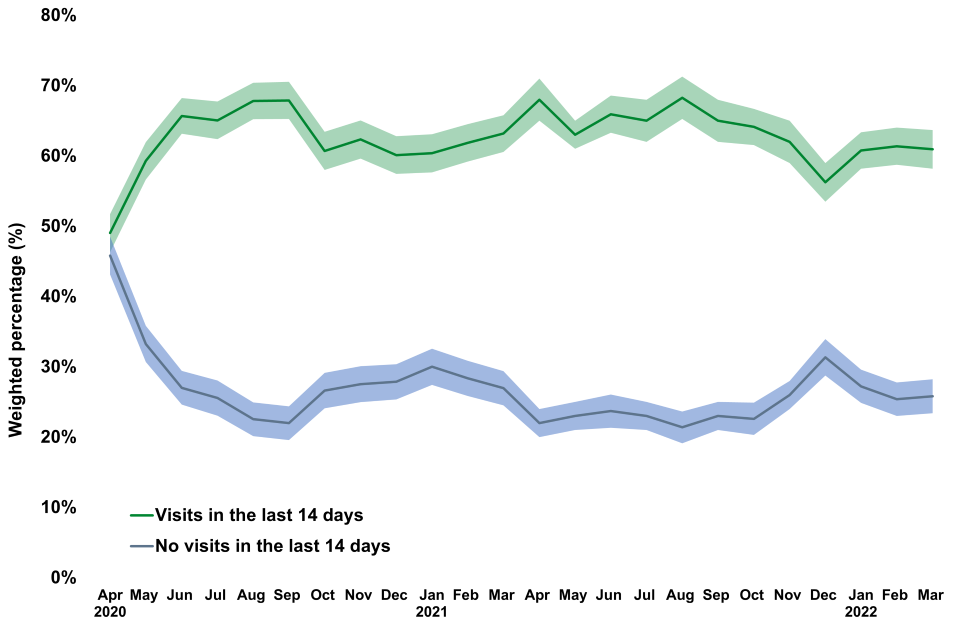
Visits and no visits in the last 14 days April 2020 to March 2022
Figure notes
Source:
Q6 / No_Of_Visits: How many times, if at all, did you make this type of visit to green and natural spaces in the last 14 days?
(1) Data collected between April 1st 2020 and March 31st 2022 (inclusive).
(2) The monthly samples for this question range from 1,833 to 1,915. See supporting data and year 1 indicators for individual samples.
(3) See Glossary for 95% confidence interval of the mean.
Figure 2 shows the proportion of adults in England who had taken a visit to a green and natural space during the previous fortnight, grouped by total annual household income.
Adults with a lower total annual household income were less likely to have visited a green and natural space in the last 14 days. Thirty seven percent of adults with a household income of below £15,000 had not made a visit in the last 14 days, compared to 16% of those with a household income of over £50,000.
Similarly, of those with a total annual household income of less than £15,000, 49% made a visit to a green and natural space in the last 14 days compared to 69% of those with a total annual household income of more than £50,000. Additionally, those with a total annual household income under £15,000 made on average 2.3 visits per person in the last 14 days, less than the 3.5 visits made on average by those with a total annual household income over £50,000.
Figure 2: Proportion of adults in England (weighted percentage) visiting a green and natural space in the last 14 days. In March, 37% of people with a total annual household income of less that £15,000 did not make a visit to a green and natural space in the last 14 days, compared to 16% of those with an income of more than £50,000.
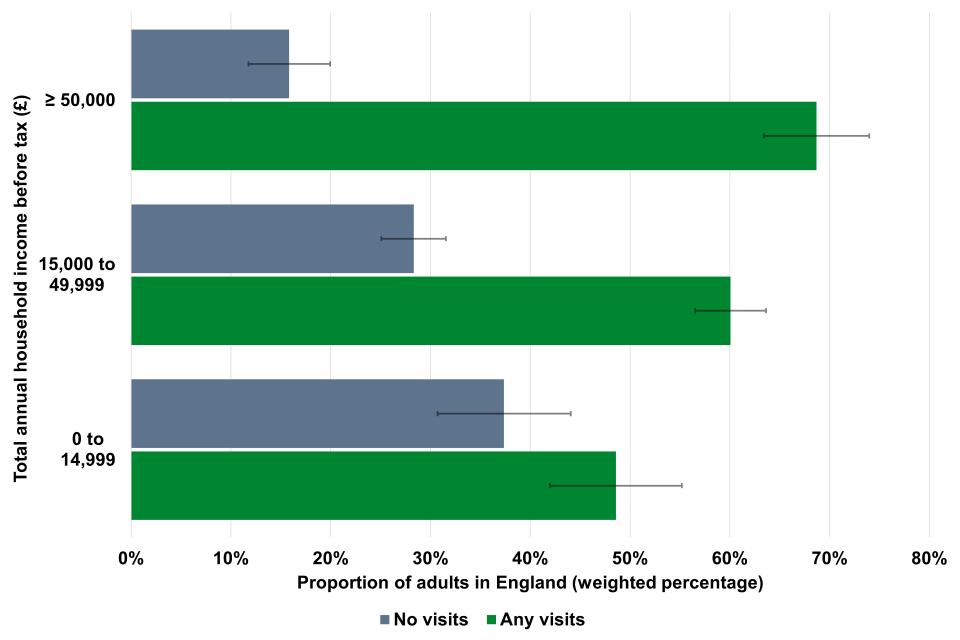
Proportion of adults in England no visits and any visits by total annual household income before tax
Figure notes
Source:
Q6 / No_Of_Visits: How many times, if at all, did you make this type of visit to green and natural spaces in the last 14 days?
Q69 (Income): Which of the following best describes your total annual household income before tax?
(1) Data collected between March 1st and 31st 2022 (inclusive).
(2) The samples for this question were 1,852 (March 2022) respondents.
(3) See Glossary for 95% confidence interval of the mean.
Figure 3 shows the total number of visits made by adults to green and natural spaces in March was 299,828,943, an increase on the total number of visits made in February (294,715,030). The peak number of visits was made in May 2020 (441,228,000).
Figure 3: The total number of visits made by adults to green and natural spaces in March (299,828,943).
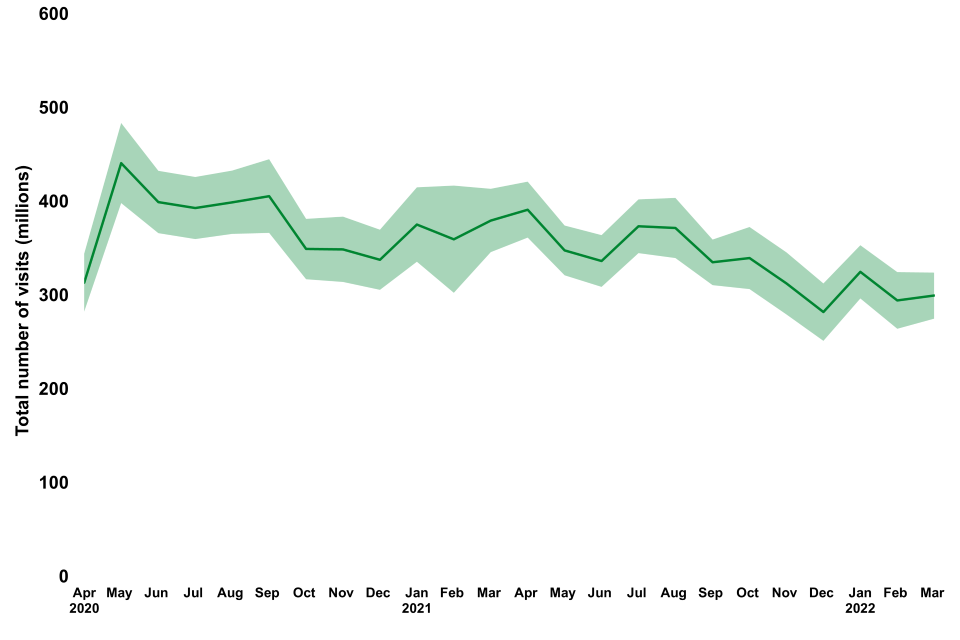
Total number of visits (millions) by month
Figure notes
Source:
Q6 / No_Of_Visits: How many times, if at all, did you make this type of visit to green and natural spaces in the last 14 days?
(1) Data collected between April 1st 2020 and March 31st 2022 (inclusive).
(2) The monthly samples for this question range from 1,833 to 1,915. See supporting data and year 1 indicators for individual samples.
(3) See Glossary for 95% confidence interval of the mean.
The survey asked adults about their reasons for not spending time in green and natural spaces during the previous 14 days (Figure 4). In March, the top reason was ‘Bad / poor weather’ (33%). The second most reported reason was ‘Poor physical health (or illness)’ (22%). ‘Too busy at home’ (20%) and ‘Too busy at work / with family commitments’ (16%) were the next most stated reasons. Of note, reporting ‘Stayed at home to stop coronavirus spreading / Government restrictions’ as a barrier to spending time outside increased from 10% in February to 12% in March 2022.
Figure 4: The top two reasons for not spending free time outdoors in the last 14 days (March 2022) were ‘Bad / poor weather’ (33%) and ‘Poor physical health (or illness)’ (22%). ‘Too busy at home’ (20%), ‘Too busy at work / with family commitments’ (16%), ‘Stayed at home to stop coronavirus spreading / Government restrictions’ (12%) and ‘Poor mental health or well being’ (8%) are also included. Note that only a subset of reasons has been presented - see the supporting data for all reasons.
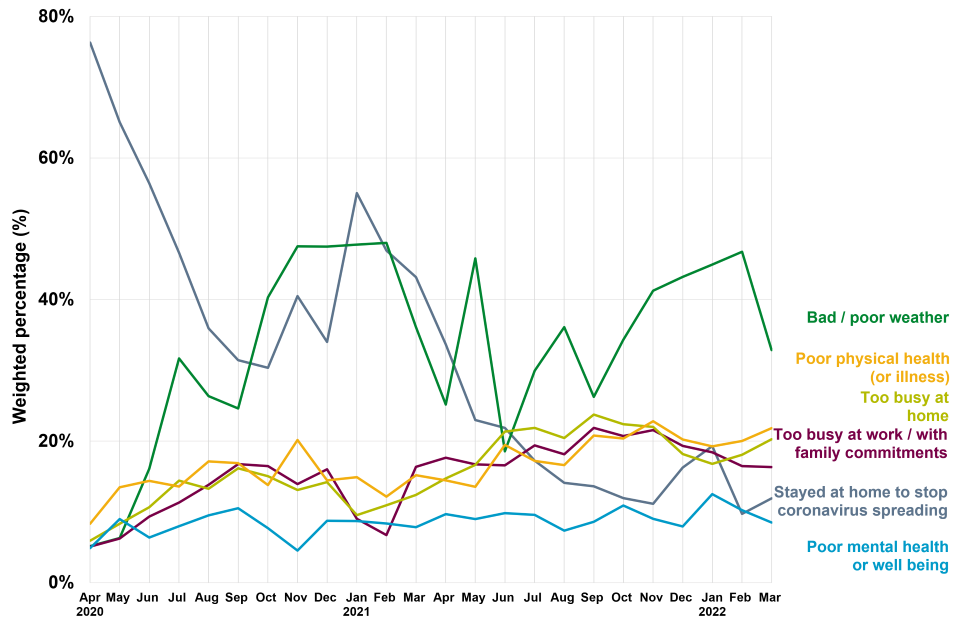
Reasons for no visits
Figure notes
Source:
Q27a / M2B_Q2: What was the main reason or reasons for not spending free time outdoors in the last 14 days?
(1) Data collected between April 1st 2020 and March 31st 2022 (inclusive).
(2) The monthly samples for this question range from 567 to 958. See supporting data and year 1 indicators for individual samples.
(3) Respondents can select more than one option and so percentages will not add up to 100%.
(4) Only a subset of reasons have been presented - see the supporting data for all reasons and 95% confidence intervals of the mean (see Glossary).
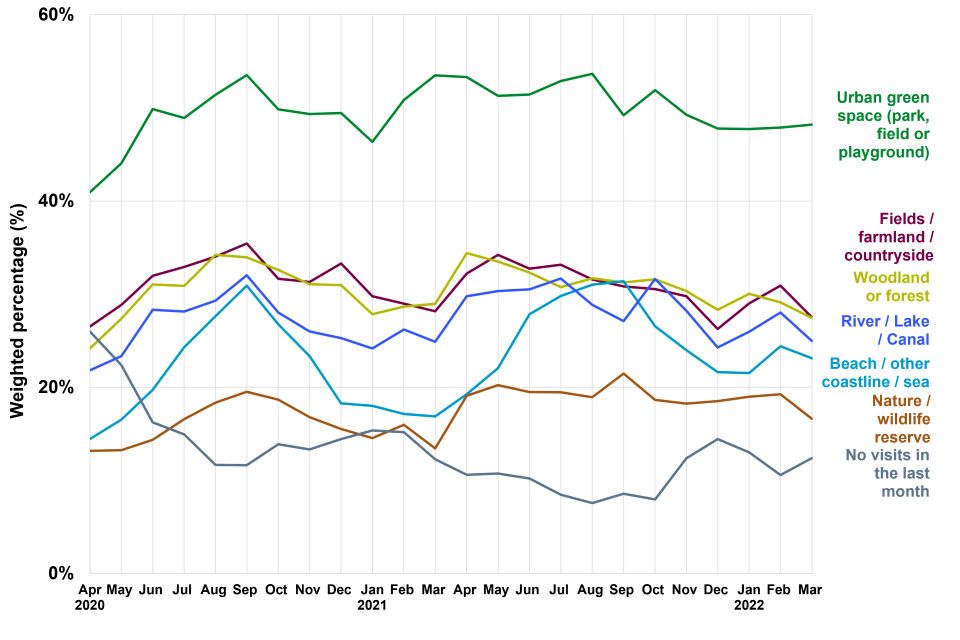
In March, 12% of adults reported that they had not spent any time in green and natural spaces in the previous month (see Figure 5), up on the previous month (11% for February).
For adults that had spent free time outside in green and natural spaces, just under half (48%) had visited an urban green space. Twenty eight percent had visited fields/farmland/countryside and 27% visited woodland/forest in the last month.
Figure 5: Proportion of adults in England (weighted percentage) visiting different types of green and natural spaces within the last month (April 2020 - March 2022). Urban green spaces have been the most frequently visited across all months. Note that only a subset of types of green and natural spaces has been presented - see the supporting data for all types of green and natural spaces visited during the last month.
Different types of places visited April 2020 to March 2022
Figure notes
Source:
Q2 / M1_Q2: Which of the following type(s) of green and natural spaces have you visited during the last month?
(1) Data collected between April 1st 2020 and March 31st 2022 (inclusive).
(2) The monthly samples for this question range from 1,938 to 2,024 See supporting data and year 1 indicators for individual samples.
(3) Respondents can select more than one option and so percentages will not add up to 100%.
(4) See the supporting data for all green and natural spaces and 95% confidence intervals of the mean (see Glossary)
5. Other results
The accompanying spreadsheet includes monthly results for a number of areas including:
- Activities undertaken during visits to green and natural spaces;
- Reasons for not spending time outside;
- Worries or concerns related to visiting green and natural spaces;
- The role of green and natural spaces for health and wellbeing;
- Feelings of nature connection;
- Importance of gardens;
- Behaviour changes during the Coronavirus pandemic;
- Children’s time in nature.
6. Methodological note
Information about the survey’s methodology can be found here.
7. Strengths and Limitations
Information about the survey’s strengths and limitations can be found here.
8. Glossary
Green and natural spaces are defined in this survey as green and blue spaces in towns and cities (e.g. parks, canals); the countryside (e.g. farmland, woodland, hills and rivers); the coast (e.g. beaches, cliffs) and activities in the open sea; visits of any duration (including short trips to the park, dog walking etc.). They do not include: gardens; outside spaces visited as part of someone’s employment; spaces outside the UK. Additional questions are asked about private gardens.
95% confidence interval is a range of values around a calculated statistic (e.g. the mean) that you are 95% certain contains the true value of that statistic. For example, where there is a mean value of 49 with a 95% confidence interval of 2, we would be 95% certain that the true mean of the population was in the range of 47-51 (i.e. 49 -2 and 49 + 2). Please note that the People and Nature Survey uses quota sampling and confidence intervals here were calculated as if the data were generated from a random probability sample.
9. Contact
Natural England welcomes feedback on these monthly indicators, questions and suggestions for analysis for future releases. Please contact the team by email: people_and_nature@naturalengland.org.uk
If you would like to receive further information on the survey, including data releases, publications and survey changes, then visit our User Hub and sign-up to the mailing list at the bottom of the page (best viewed in Google Chrome). After signing up, if you do not receive a confirmation email please check your ‘Junk’ or ‘Spam’ folder.
The Senior Responsible Officer for this publication is Tom Marshall.
10. Pre-release access
Pre-release access was not sought for this release.
11. Related links
Coronavirus – Living safely with respiratory infections: Latest government guidance on living safely with respiratory infections, including COVID-19.
Natural England operational update: Coronavirus information on how Natural England is facing the challenges posed by Coronavirus.
People and Nature questionnaire: Includes link to People and Nature Survey questions.
People and Nature Survey information: Further information on the People and Nature Survey for England.
The Countryside Code Statutory guidance on respecting, protecting and enjoying the outdoors.