Tenant Satisfaction Measures 2025/26: Headline Report
Published 5 November 2026
Applies to England

© Crown copyright 2026
This publication is licensed under the terms of the Open Government Licence v3.0 except where otherwise stated. To view this licence, visit nationalarchives.gov.uk/doc/open-government-licence/version/3 or write to the Information Policy Team, The National Archives, Kew, London TW9 4DU, or email: psi@nationalarchives.gov.uk.
Where we have identified any third party copyright information you will need to obtain permission from the copyright holders concerned.
This publication is available at https://www.gov.uk/government/statistics/tenant-satisfaction-measures-202526/tenant-satisfaction-measures-202526-headline-report
Executive Summary
This report sets out analysis of 2025/26 tenant satisfaction measures (TSM) results for social landlords with 1,000 or more homes. The aims of the TSMs are to allow tenants to scrutinise their landlord’s performance, give insights to landlords on where they might improve their services, and provide a source of intelligence for our regulation.
TSMs are collected and reported by landlords according to detailed requirements we set. This includes, for example, the questions landlords must use in their surveys of tenants. In 2025/26 landlords surveyed almost half a million tenants. This is a rich and important source of feedback about individual landlords and the social housing sector as a whole.
In 2025/26 there has been an increase in the average level of tenant satisfaction reported by landlords. The average (median) landlord has reported an increase in overall satisfaction from 72% in 2024/25 to 74% in 2025/26 for their tenants living in low cost rental accommodation (LCRA). Telephone surveys are the most widely used collection method and looking only at those surveys, the proportion of tenants reporting overall satisfaction has risen from 71% to 73% across the same two years.
Our 2024 National Tenant Survey showed that overall satisfaction reflects views on a variety of landlord services, but that repairs and maintenance services appear to be the most significant specific drivers of overall satisfaction among LCRA tenants. Our wider regulatory intelligence suggests that many landlords have prioritised investment in their repairs and maintenance services. TSM information shows that 83% of non-emergency repairs were being completed on time in 2025/26, compared to 77% in 2023/24. Average (median) satisfaction with the timeliness of repairs has risen from 67% in 2023/24 to 73% in 2025/26, the largest increase across the perception TSMs. Satisfaction with the maintenance of the home has increased from 71% to 74% over the same period.
TSMs generated from management information show that:
- the vast majority of homes owned by large landlords, as at 31 March 2026, had required gas (99.7%), fire (98.9%), asbestos (98.7%), water (98.2%) and lift safety checks (98.0%) completed. These have each increased since TSMs began in 2023/24, with asbestos, water and lift safety having the comparatively largest increases.
- 86% of over 319,000 stage one complaints made during 2025/26 were responded to within the Housing Ombudsman’s Complaint Handling Code timescales. This has increased from 73% in the first year of collection (2023/24).
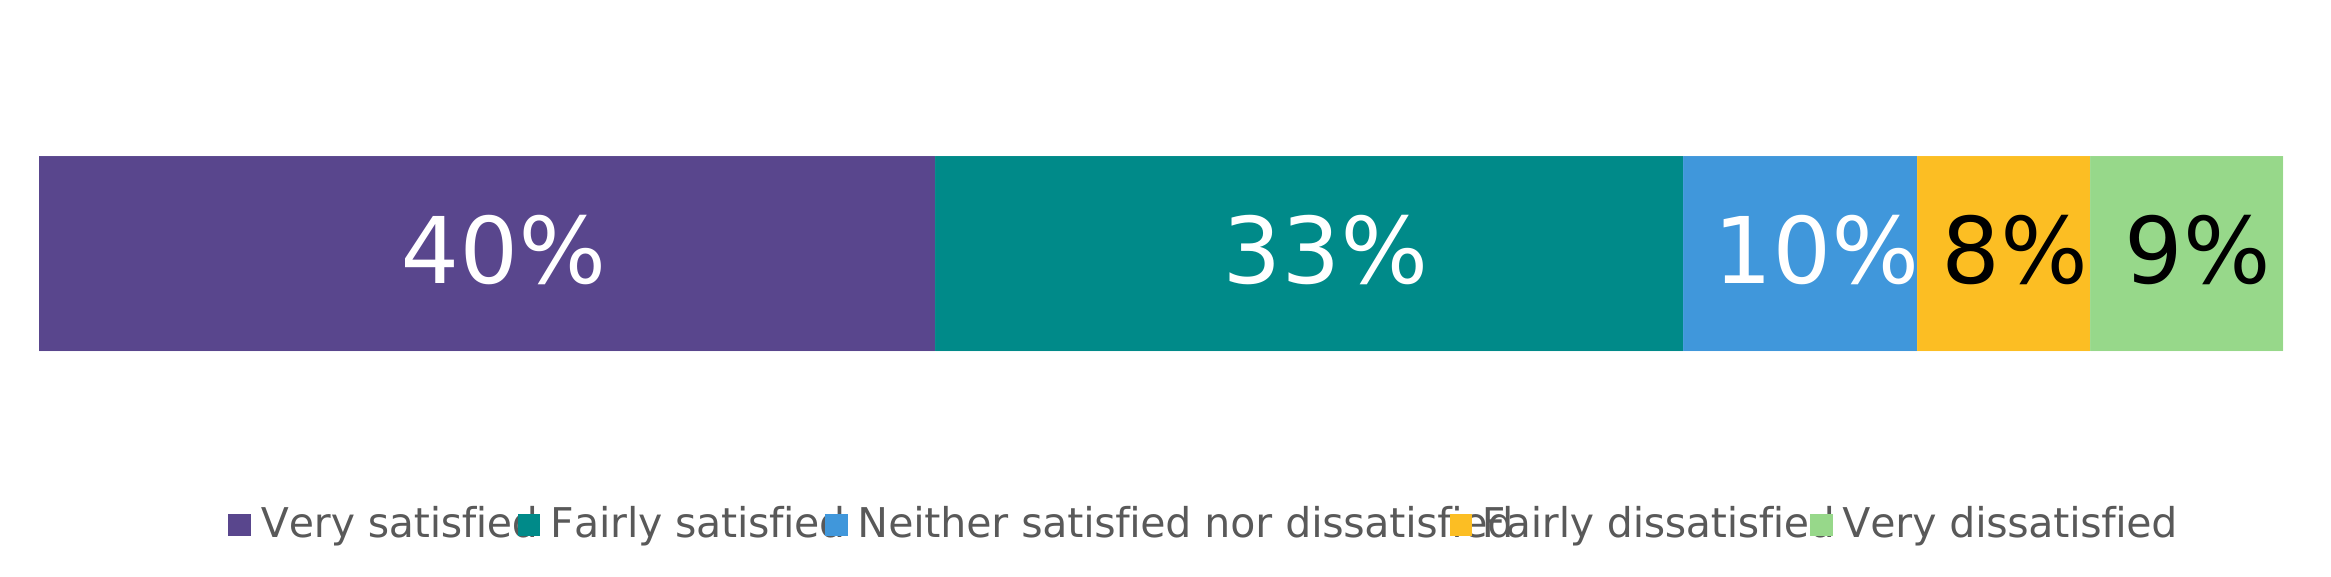
The TSMs also provide landlords with valuable information as to how services might be further improved. Around one in six (16%) of LCRA tenants surveyed are dissatisfied with the overall service from their landlord.
Overall average (landlord median) satisfaction for low cost home ownership (LCHO) remains lower (50%) than LCRA. This reflects continuing opportunities to improve services and satisfaction for shared owners. It also reflects fundamental differences in the role of the landlord for these residents.
TSMs are intended to be interpreted in the round and with other relevant information to inform a view of landlord performance. The published landlord data includes key contextual information discussed in this report, including on survey collection method(s) and the profile of each landlord. We have also published for each landlord their overall satisfaction by collection method. These are useful for reasonably comparing performance between landlords. The TSMs are one source of regulatory intelligence, and no regulatory judgement is based solely on TSM results.
As set out in our regulatory casework review, it is important for landlords to use insights from data to properly understand issues and drive improvements. This TSM publication can help inform how TSMs can be used to understand performance and improve service delivery.
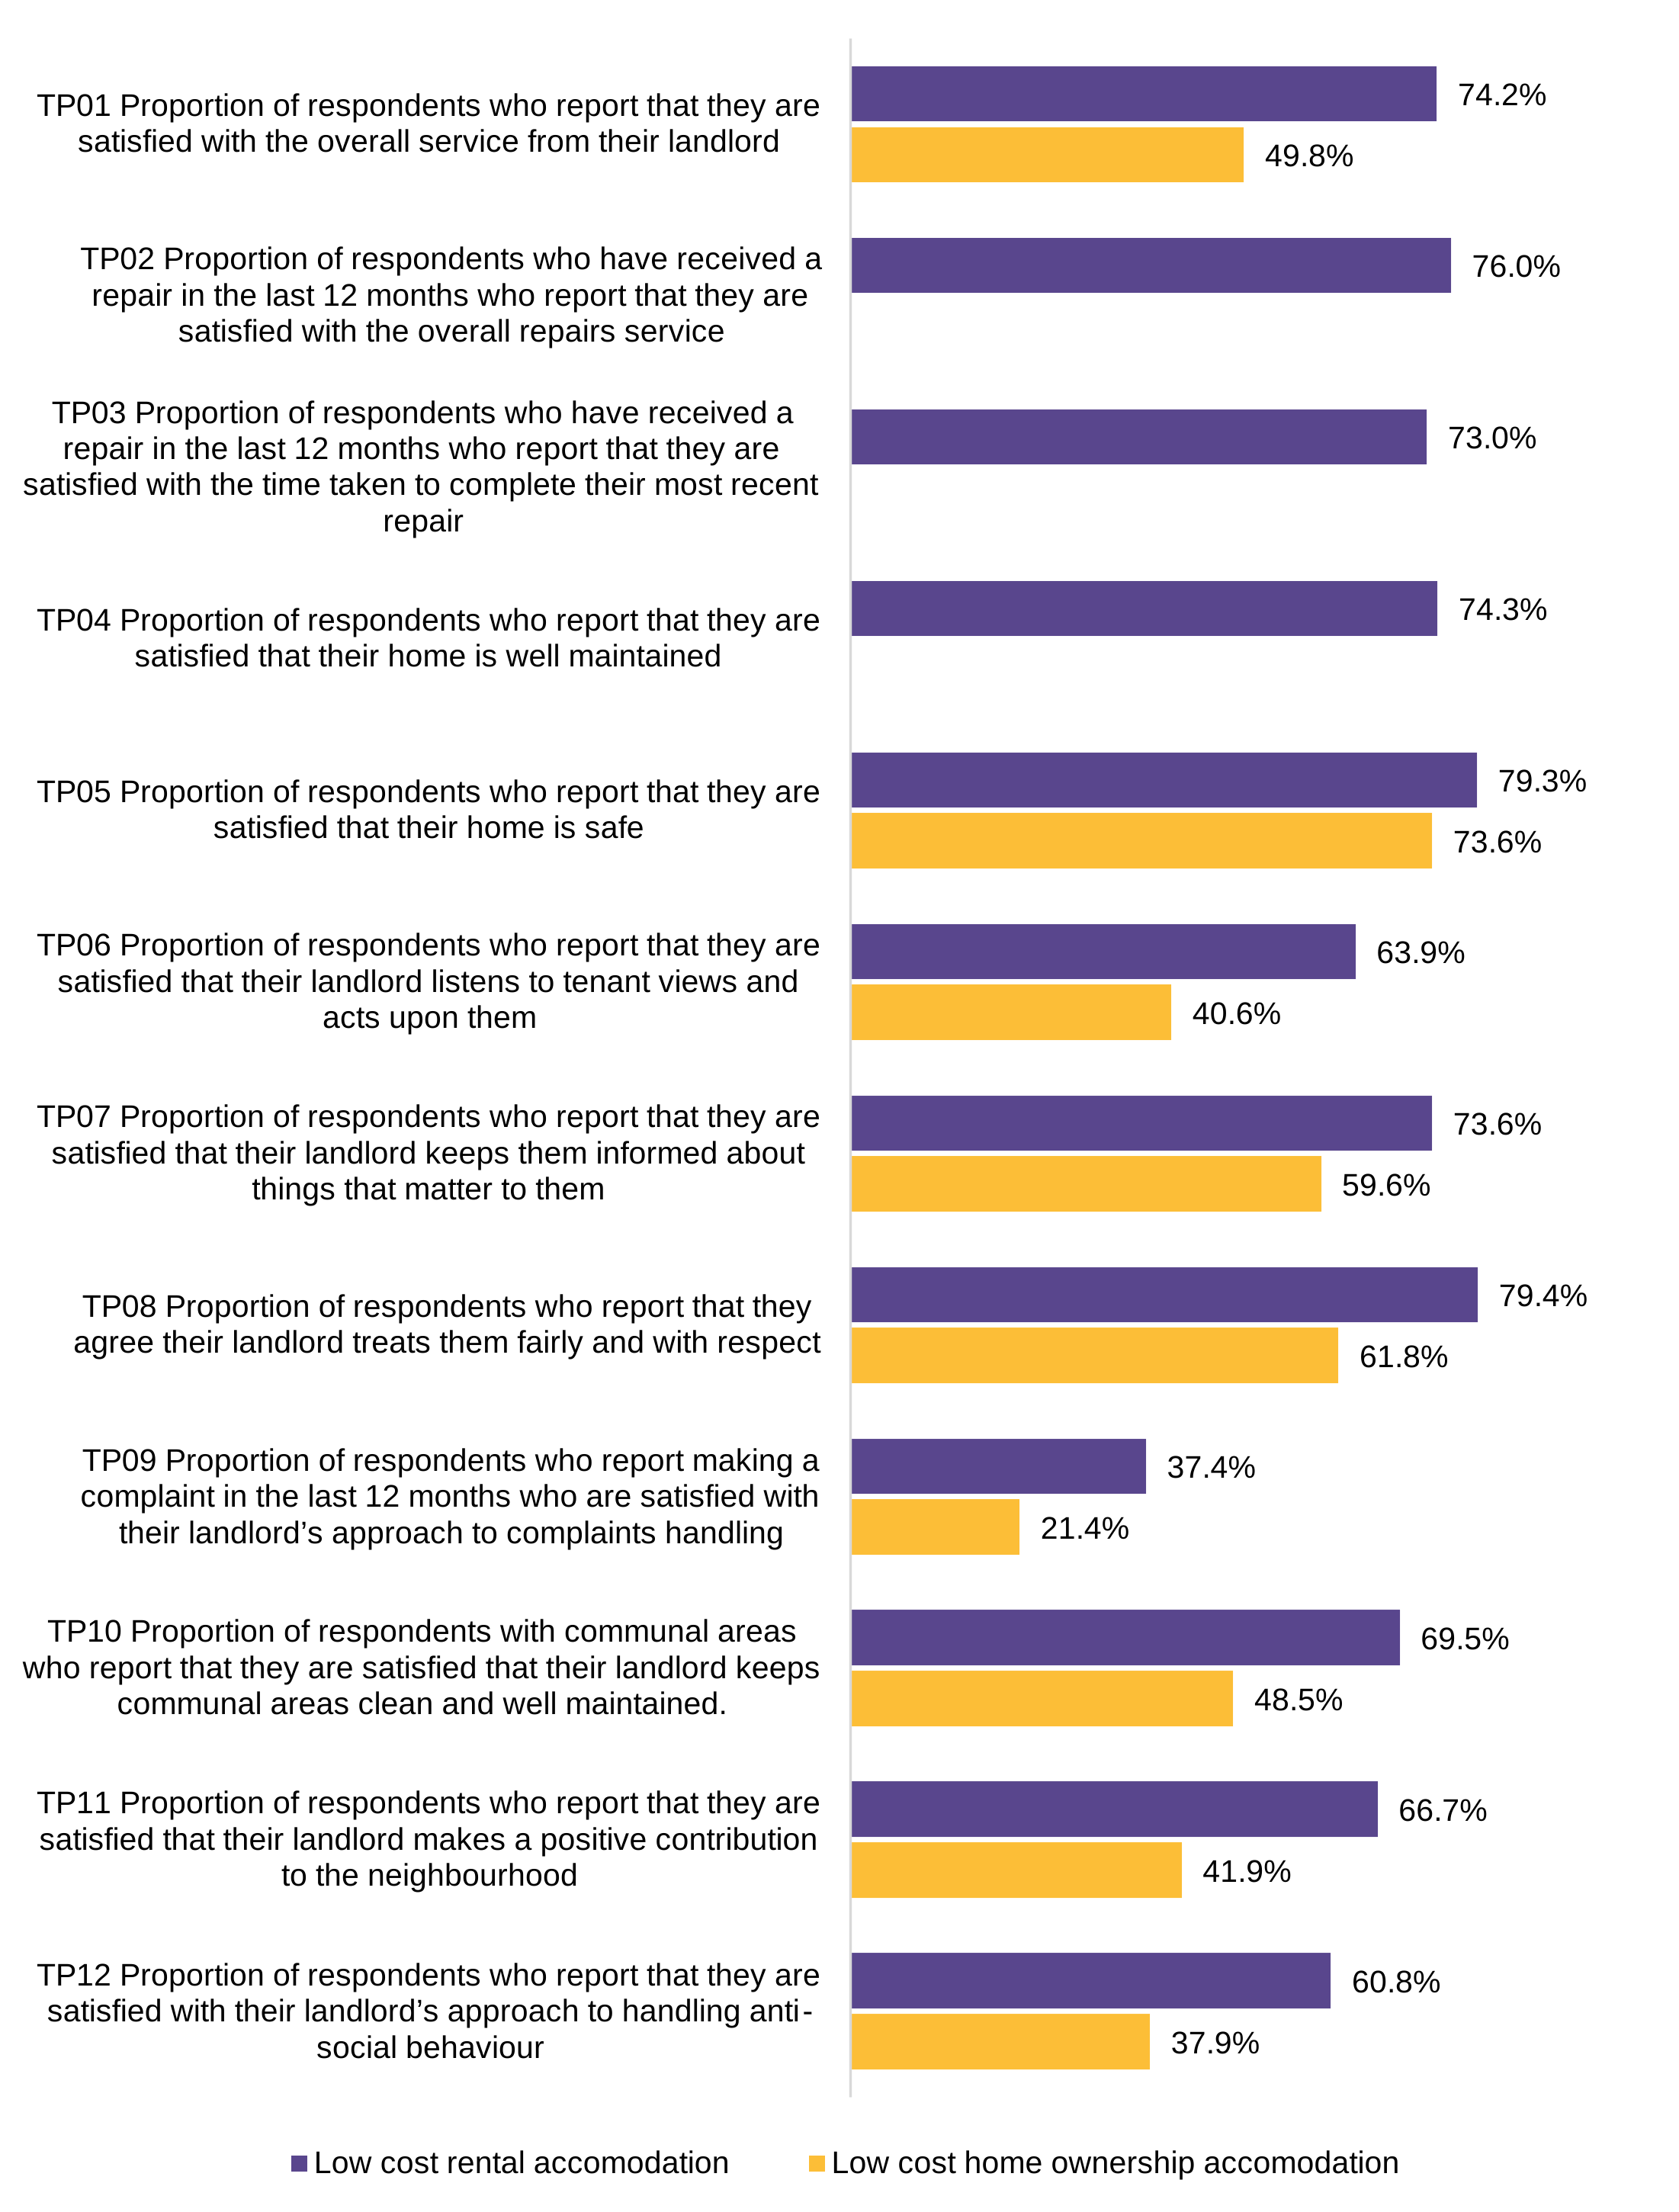
Figure 1: Average (median landlord) perception Tenant Satisfaction Measure results, 2025/26
| Low cost rental accomodation | Low cost home ownership accomodation | |
|---|---|---|
| TP01 Proportion of respondents who report that they are satisfied with the overall service from their landlord | 74.2% | 49.8% |
| TP02 Proportion of respondents who have received a repair in the last 12 months who report that they are satisfied with the overall repairs service | 76.0% | |
| TP03 Proportion of respondents who have received a repair in the last 12 months who report that they are satisfied with the time taken to complete their most recent repair | 73.0% | |
| TP04 Proportion of respondents who report that they are satisfied that their home is well maintained | 74.3% | |
| TP05 Proportion of respondents who report that they are satisfied that their home is safe | 79.3% | 73.6% |
| TP06 Proportion of respondents who report that they are satisfied that their landlord listens to tenant views and acts upon them | 63.9% | 40.6% |
| TP07 Proportion of respondents who report that they are satisfied that their landlord keeps them informed about things that matter to them | 73.6% | 59.6% |
| TP08 Proportion of respondents who report that they agree their landlord treats them fairly and with respect | 79.4% | 61.8% |
| TP09 Proportion of respondents who report making a complaint in the last 12 months who are satisfied with their landlord’s approach to complaints handling | 37.4% | 21.4% |
| TP10 Proportion of respondents with communal areas who report that they are satisfied that their landlord keeps communal areas clean and well maintained. | 69.5% | 48.5% |
| TP11 Proportion of respondents who report that they are satisfied that their landlord makes a positive contribution to the neighbourhood | 66.7% | 41.9% |
| TP12 Proportion of respondents who report that they are satisfied with their landlord’s approach to handling anti-social behaviour | 60.8% | 37.9% |
LCHO shared owners are not asked TP02, TP03 and TP04 due to differing responsibilities for repairs and maintenance.
Table 1: Average (median landlord) management information Tenant Satisfaction Measure results, 2025/26
| Tenant satisfaction measure | Landlord Median |
|---|---|
| BS01 Proportion of homes for which all required gas safety checks have been carried out (%) | 99.9 |
| BS02 Proportion of homes for which all required fire risk assessments have been carried out (%) | 100.0 |
| BS03 Proportion of homes for which all required asbestos management surveys or re-inspections have been carried out (%) | 100.0 |
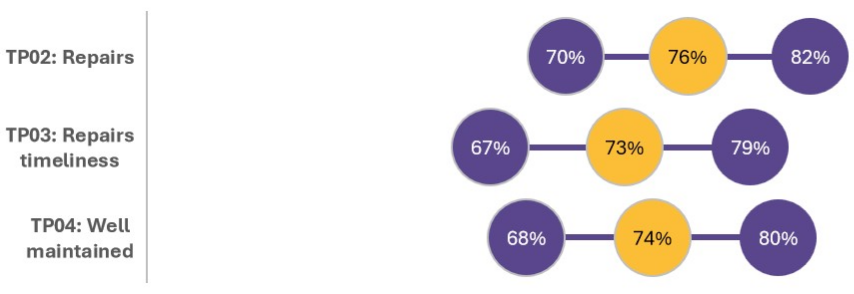
| BS04 Proportion of homes for which all required legionella risk assessments have been carried out (%) | 100.0 |
| BS05 Proportion of homes for which all required communal passenger lift safety checks have been carried out (%) | 100.0 |
| RP01 Proportion of homes that do not meet the Decent Homes Standard [LCRA only] (%) | 0.6 |
| RP02 Proportion of non-emergency responsive repairs completed within the landlord’s target timescale [LCRA only] (%) | 85.3 |
| RP02 Proportion of emergency responsive repairs completed within the landlord’s target timescale [LCRA only] (%) | 96.2 |
| NM01 Number of anti-social behaviour cases opened (per 1,000 homes) | 35.7 |
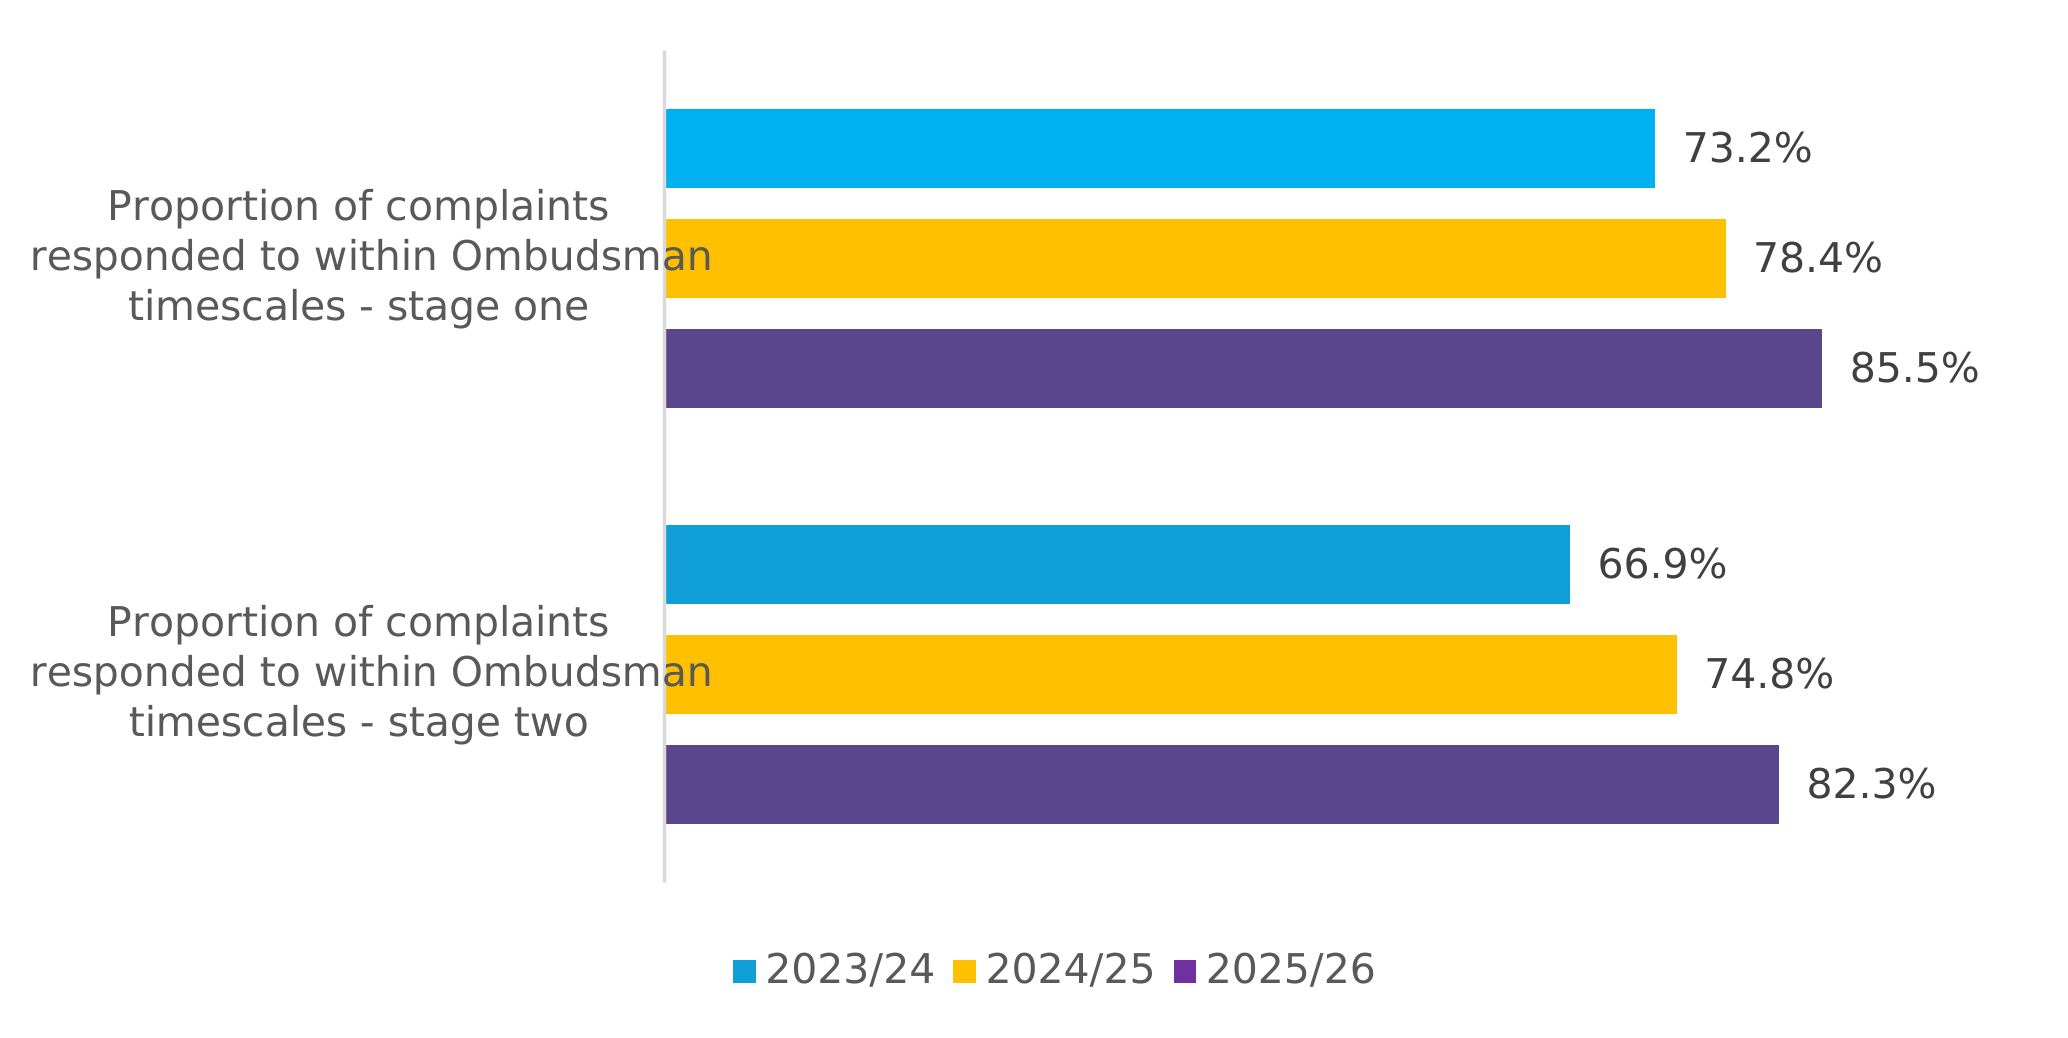
| NM01 Number of anti-social behaviour cases that involve hate incidents opened (per 1,000 homes) | 0.7 |
| LCRA | LCHO | |
|---|---|---|
| CH01 Number of stage one complaints received (per 1,000 homes) | 56.8 | 46.6 |
| CH01 Number of stage two complaints received (per 1,000 homes) | 12.0 | 14.2 |
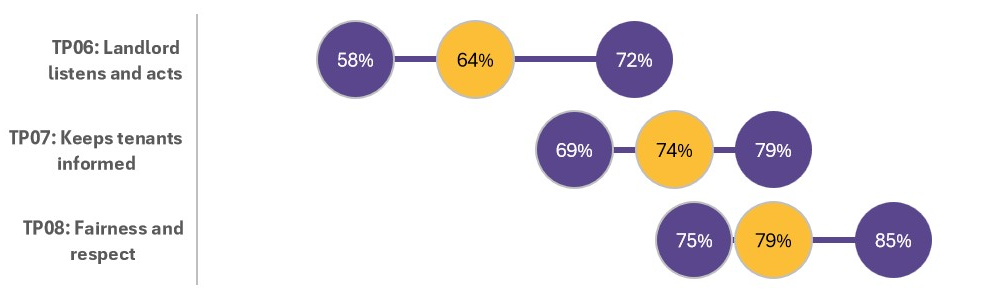
| CH02 Proportion of stage one complaints responded to within the Housing Ombudsman’s Complaint Handling Code timescales (%) | 93.8 | 93.2 |
| CH02 Proportion of stage two complaints responded to within the Housing Ombudsman’s Complaint Handling Code timescales (%) | 93.2 | 93.3 |
Introduction
1 - The Transparency, Influence and Accountability Standard requires all registered landlords to report information that is an accurate, reliable, valid, and transparent reflection of their performance against the Tenant Satisfaction Measures (TSMs) we set. TSMs are intended to be a valuable tool to allow tenants to scrutinise their landlord’s performance, giving insights to landlords on where they might look to improve their services, and provide a source of intelligence to us on whether landlords are meeting new consumer standards.
2 - All registered landlords must publish 2025/26 TSMs and supporting information. Large landlords which own 1,000 or more homes are required to submit a TSM data return and supporting information to us. This publication sets out analysis of the third year of TSM information submitted for 2025/26 by large landlords.
3 - The TSMs in 2025/26 include 12 tenant perception measures that must be generated from tenant perception surveys, and 10 TSMs that must be generated from management information[footnote 1]. TSMs are intended to be interpreted in the round, alongside relevant contextual information, to inform a view of landlord performance on particular themes. TSM requirements include the calculation of all TSMs, and specifically how landlords are required to conduct tenant perception surveys.
4 - We do not use the TSMs as a regulatory tool in isolation. TSMs are one source of information, amongst a range of sources, that we use to gather assurance about a landlord delivering the outcomes of the standards. We expect landlords to use performance information, including TSMs, to understand how effectively they are delivering landlord services. We engage proportionately with landlords where the TSMs indicate a higher risk of them failing to deliver the outcomes of our standards. This includes where we consider they may not have met the TSM requirements.
5 - Alongside this report we have published the dataset with TSM results for each large landlord. It is important to take appropriate care in interpreting TSMs. This report sets out our analysis of TSM results, including key aspects of landlord operating context or methodological issues that may influence scores. These contextual factors – including survey collection method(s) and landlord profile – are set out alongside the published TSM data for each landlord.
6 - To support understanding and analysis of the TSMs, we commissioned our own National Tenant Survey (NTS), which was published in 2024. This survey provided greater insight into how particular TSMs drawn from tenant surveys can be interpreted, how different TSMs are correlated, and how contextual factors influence average satisfaction scores. Relevant findings from the NTS are reflected in this report. We intend to review the TSMs at an appropriate point and to consider whether any changes are required.
7 - This report provides the median score for all TSMs. This is the value for the landlord in the middle of the distribution for each TSM and is unaffected by extreme values. The report also sets out lower and upper quartiles to summarise the range of landlord scores. For some TSMs, in addition to the median, we set out the total or mean across the sector for additional context.
8 - The analysis in this report is based on 356 submissions from large landlords covering TSM results for the period between April 2025 to March 2026[footnote 2]. It covers low cost rental accommodation (LCRA) and low cost home ownership (LCHO) in England, with tenant perception and complaints TSMs calculated for LCRA or LCHO specifically depending on the stock owned by each landlord. In total, 294 large landlords submitted results for tenant perception and complaints TSMs based on LCRA stock solely. A further 55 landlords produced separate TSMs for LCRA and LCHO stock. Five landlords reported these TSMs for LCHO only and another two reported combined LCRA and LCHO results[footnote 3].
9 - The remainder of this document is set out in chapters showing:
- Headline overall satisfaction (TP01) and factors that can support comparisons of satisfaction scores between landlords.
- Other TSM results by thematic service areas, with contextual information to support reading TSMs in the round.
- The methodological factors that can impact perception measure results and areas identified in landlord submissions that can affect data quality.
10 - Figures in this report have been rounded, at most to one decimal place. This can result in rounding differences between totals and percentages.
Overall satisfaction
11 - Overall satisfaction (TP01) is the headline tenant perception measure drawn from landlords’ tenant perception surveys. The required wording for TP01 asks tenants their overall level of satisfaction with the service provided by their landlord, taking everything into account. Overall satisfaction can be seen as a summary of the other perception TSMs: the National Tenant Survey confirmed that TP01 reflects tenant views of landlord services across the themes covered by the other TSMs. This chapter looks in detail at what can affect TP01 to support useful comparisons between landlords.
12 - Overall satisfaction is a well-established performance measure that is used in similar surveys across a range of sectors. The question used in the TSMs is very similar to the equivalent question used in the English Housing Survey. We consider that, when considered carefully alongside other evidence and in an appropriate context, overall satisfaction can help us understand landlord performance.[footnote 4]
13 - Tenants completed almost 500,000 surveys in total to generate tenant perception measures, a similar number to previous years. Over 458,000 (93%) of these were completed with low cost rental accommodation (LCRA) tenants and just under 34,000 (7%) with shared owners[footnote 5]. This means that around one in eight households of social housing owned by registered landlords took part in this set of TSMs[footnote 6].
14 - In general, landlords with 1,000 or more homes are required to report perception TSMs separately for LCRA and shared owners. This is because landlords’ responsibilities are fundamentally different for shared owners (e.g. more limited repairs obligation) meaning that satisfaction scores are likely to be fundamentally different from LCRA tenants.
Overall satisfaction: low cost rental accommodation
15 - 73% of all large landlord LCRA tenants surveyed were either ‘very satisfied’ or ‘fairly satisfied’ with the overall service provided by their landlord.[footnote 7] Just under one in six (16%) tenants report that they are dissatisfied with the overall service.
Figure 2: Breakdown of LCRA overall satisfaction (TP01) by responses, 2025/26
| LCRA TP01: overall satisfaction | |
|---|---|
| Very satisfied | 39.9% |
| Fairly satisfied | 33.4% |
| Neither satisfied nor dissatisfied | 10.4% |
| Fairly dissatisfied | 7.7% |
| Very dissatisfied | 8.6% |
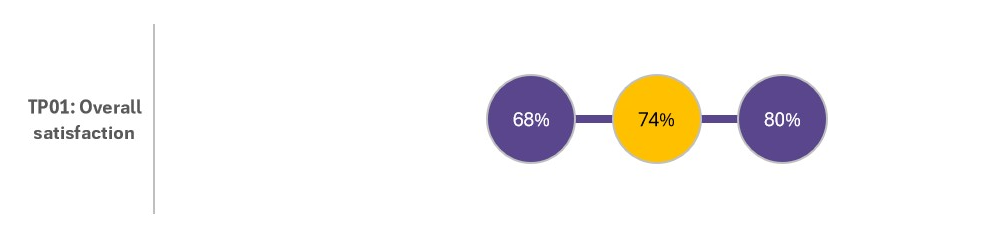
16 - This average level of satisfaction across all LCRA responses is in line with the median overall satisfaction score reported by landlords (74%). There is substantial variation of overall satisfaction reported by landlords, from 68% at the lower quartile to 80% at the upper quartile.
Figure 3: LCRA TP01 Overall satisfaction (lower quartile, landlord median, and upper quartile)
|
LCRA TP01: Overall satisfaction |
|
|---|---|
| Lower Q | 68% |
| Median | 74% |
| Upper Q | 80% |
Collection method and year on year change
17 - Landlord results also vary based on the mix of collection method used. As with the results for all submissions, telephone continues to be the most used collection method in LCRA, with the proportion of tenant surveys continuing to grow year on year (65% in 2025/26 compared to 61% in 2023/24). The less common survey collection methods have seen smaller variations, with face to face and postal surveys slightly reducing[footnote 8].
18 - Overall satisfaction across all responses (including all survey collection methods) has increased by 2 percentage points to 73%[footnote 9]. ‘Dissatisfied’ and ‘neither satisfied nor dissatisfied’ responses have collectively fallen by 1 percentage point. Increased satisfaction appears to have been driven in particular by improvements for landlords reporting relatively low satisfaction: the lower quartile for overall satisfaction across landlords has risen by 4 percentage points since 2023/24, which is a greater rise than either the median or upper quartile.
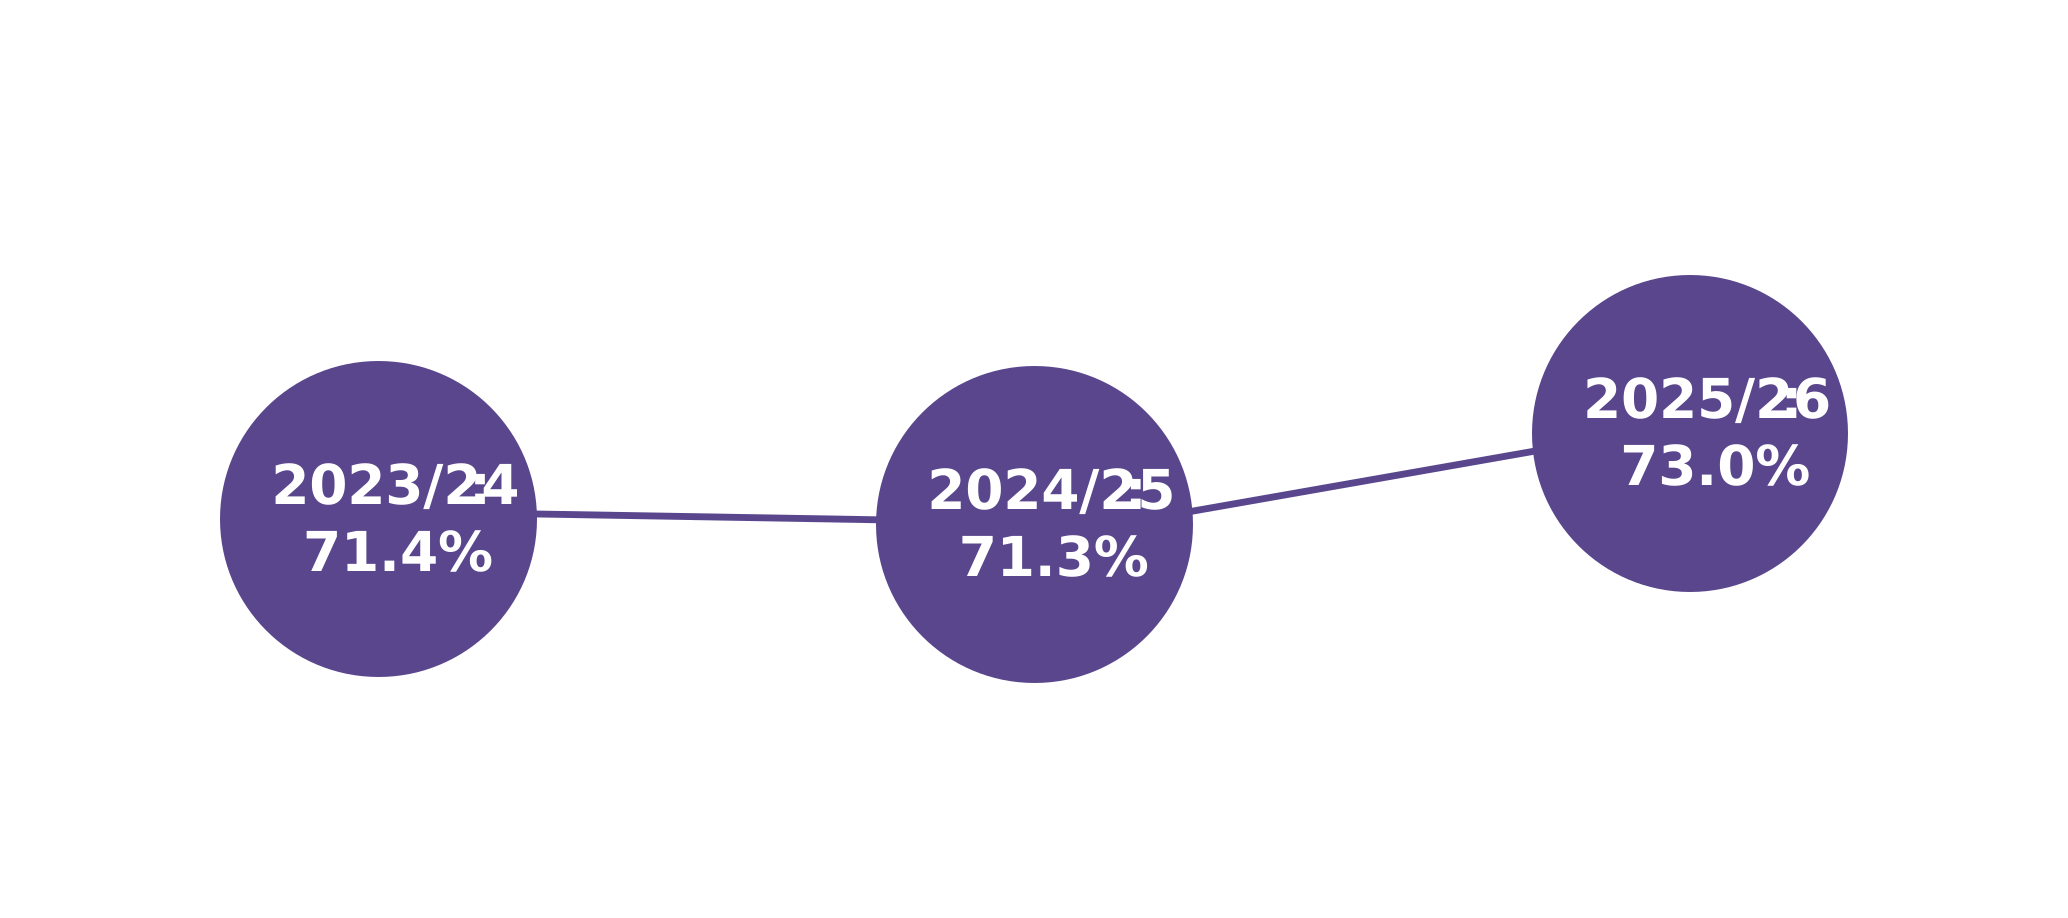
19 - Changes in overall satisfaction can be impacted by changes in the mix of survey collection methods used by landlords. However, looking solely at telephone results (covering the majority of surveys) the proportion of tenants reporting satisfaction overall has grown 1.6 percentage points from 71.4% in 2023/24 to 73.0% in 2025/26. Increases in average satisfaction are evident across survey collection methods, which suggests an increase in underlying tenant satisfaction.
20 - Overall satisfaction has increased for more than two thirds (69%) of landlords since 2024/25. We do not anticipate large swings in satisfaction in the short term where a similar methodology (including collection method) has been used. Rather, in general, improvements in service delivery are likely to give rise to small incremental year-on-year changes in tenant satisfaction.
Figure 4: Overall satisfaction TP01 across all LCRA surveys collected by telephone, 2025/26
| 2023/24 | 2024/25 | 2025/26 | |
|---|---|---|---|
| LCRA Overall satisfaction (TP01) collected by telephone | 71.4% | 71.3% | 73.0% |
Table 2: Survey responses by collection method (LCRA)[footnote 10]
| Survey collection method | Proportion of surveys collected 2023/24 | Proportion of surveys collected 2024/25 | Proportion of surveys collected 2025/26 | Change in proportion of survey responses 24/25 to 25/2610 | Average satisfaction across LCRA TP01 2024/25[footnote 11]) | Average satisfaction across LCRA TP01 2025/26 |
|---|---|---|---|---|---|---|
| Telephone | 61% | 62% | 65% | 3pp | 71.3% | 73.0% |
| Internet | 19% | 16% | 16% | 0pp | 61.6% | 64.5% |
| Face to face | 6% | 11% | 10% | -1pp | 79.9% | 80.7% |
| Postal | 11% | 8% | 8% | 0pp | 80.4% | 84.5% |
| SMS | 2% | 2% | 1% | -1pp | 63.2% | 70.0% |
Supported housing
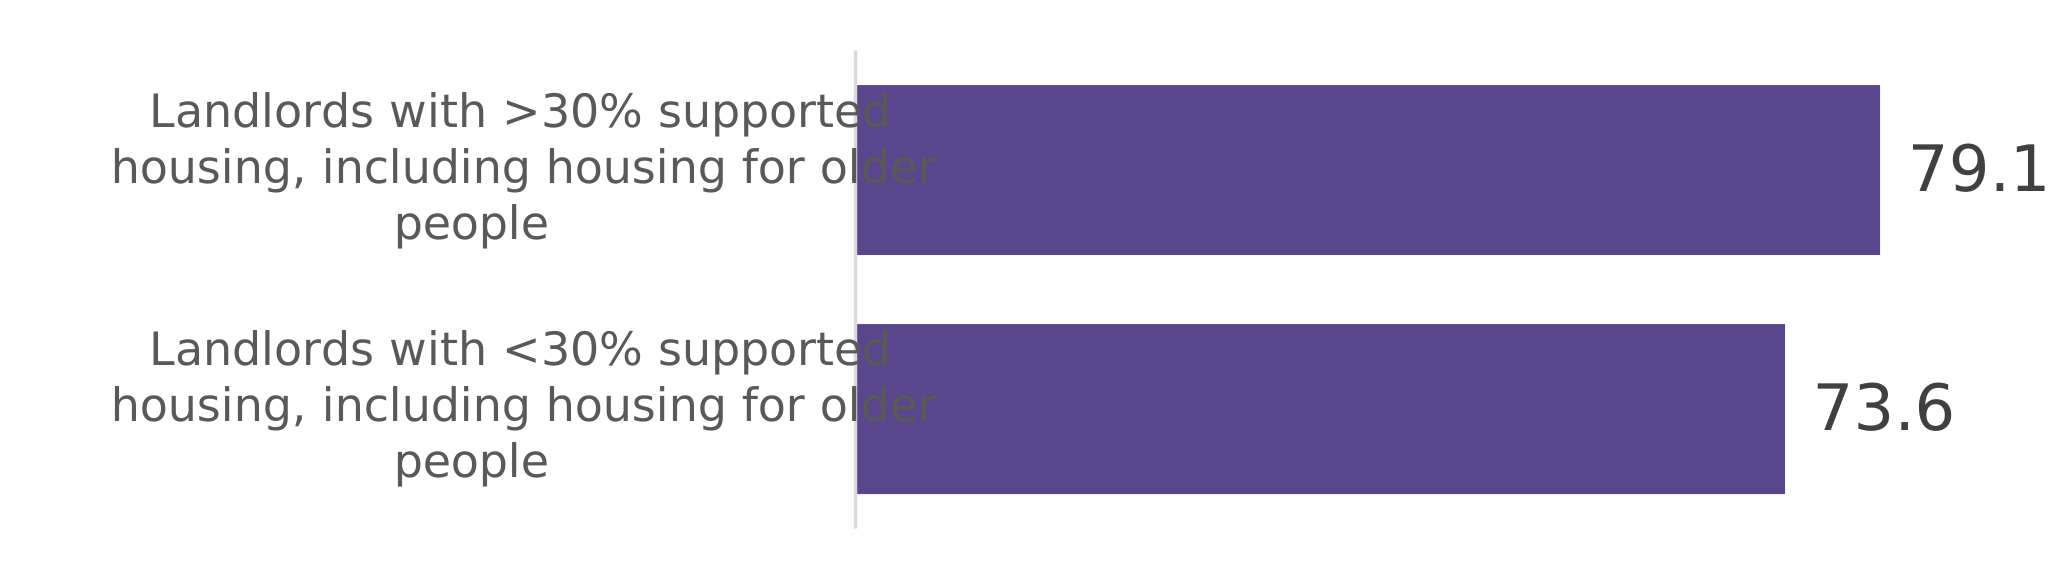
21 - Landlords with more than 30% of supported housing, which by definition includes housing for older people, report median overall satisfaction of 79%[footnote 12]. In comparison, other landlords report median satisfaction of 74%. These findings may reflect a range of factors, including differences in quality of services provided by landlords, underlying contextual differences in stock and tenant profile between landlord groups[footnote 13], differences in the scope of services provided for supported housing tenants compared to general needs, and that certain collection methods may be more commonly used to collect survey responses from supported housing tenants. In some supported housing settings, landlords may need to use collection methods that diverge from those commonly used for general needs tenants in order to address barriers to tenant participation. Median satisfaction has risen for both landlords with high proportions of supported housing and those with lower proportions.
Figure 5: Median overall satisfaction (TP01) by proportion of supported housing owned, 2025/26[footnote 14]
| Median overall satisfaction | |
|---|---|
| Landlords with >30% supported housing, including housing for older people | 79.1 |
| Landlords with <30% supported housing, including housing for older people | 73.6 |
Region
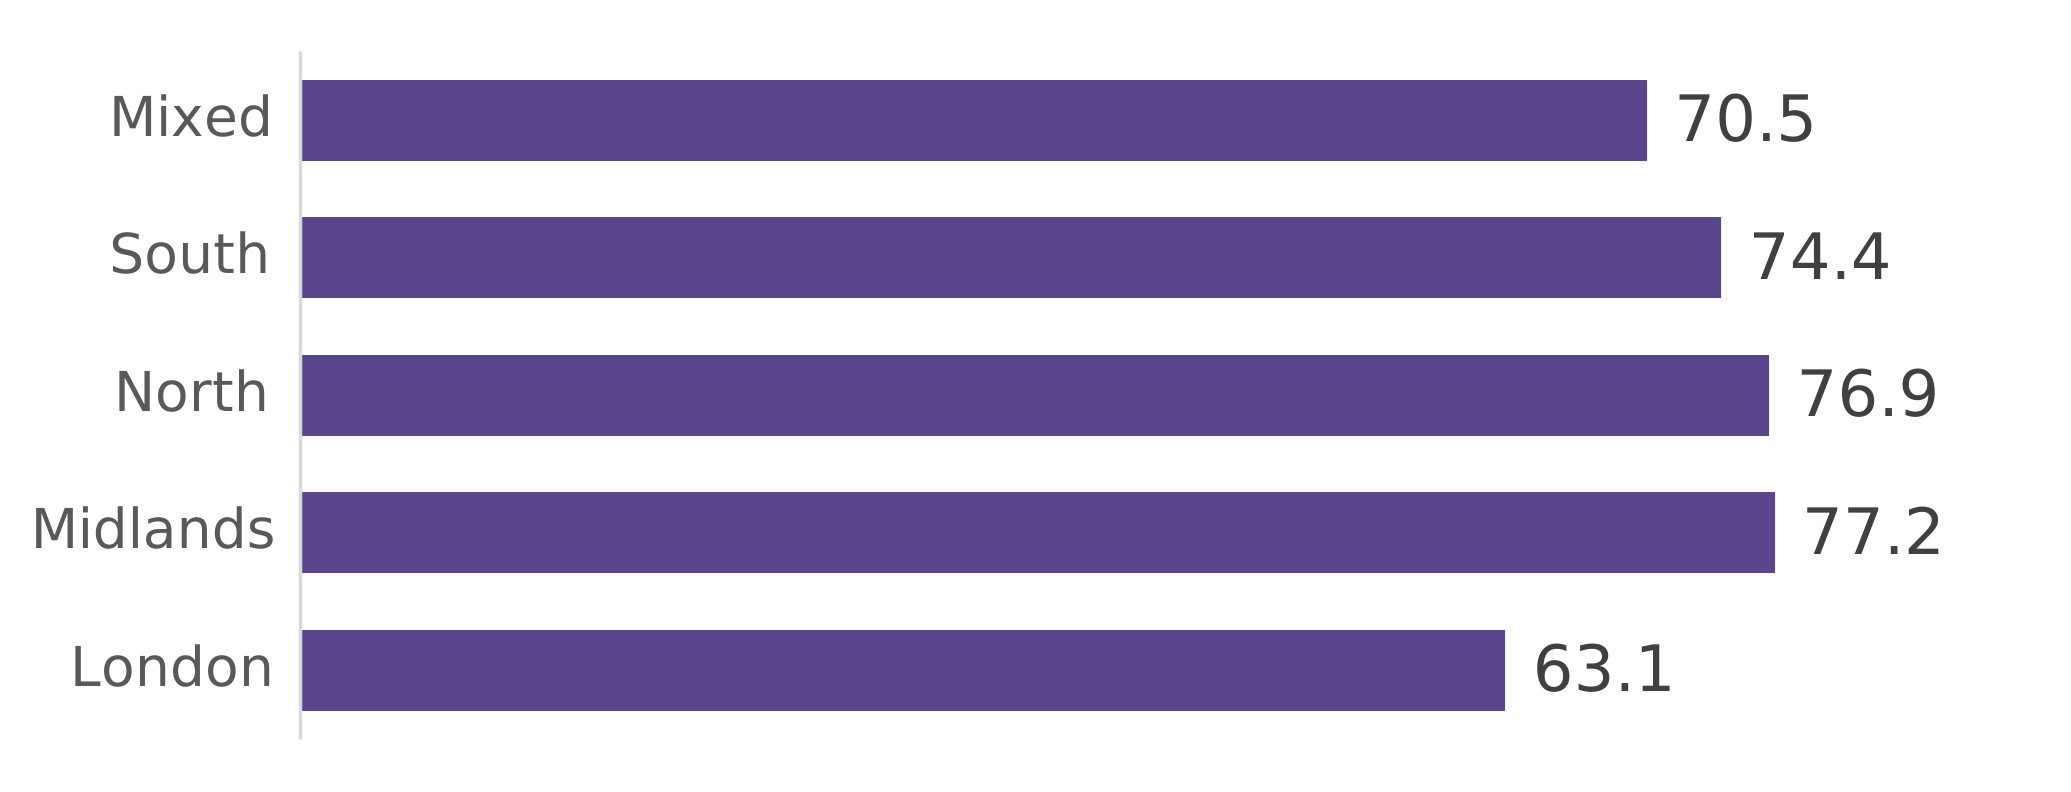
22 - Average overall satisfaction (TP01) varies by region. Landlords with the majority of their homes located in London report significantly lower median overall satisfaction (63.1%). In contrast, landlords operating predominantly in the Midlands and the North (77.2% and 76.9% respectively) report higher median levels of satisfaction. These findings are consistent with the National Tenant Survey, which found that average tenant satisfaction was significantly lower in London even after controlling for other factors. We recognise that there are likely to be a range of reasons for lower levels of reported satisfaction amongst tenants in London. Reported median satisfaction has risen in all regions since 2024/25.
Figure 6: Median satisfaction by predominant region of operation, 2025/26[footnote 15]
| Median overall satisfaction | |
|---|---|
| London | 63.1 |
| Midlands | 77.2 |
| North | 76.9 |
| South | 74.4 |
| Mixed | 70.5 |
Landlord size
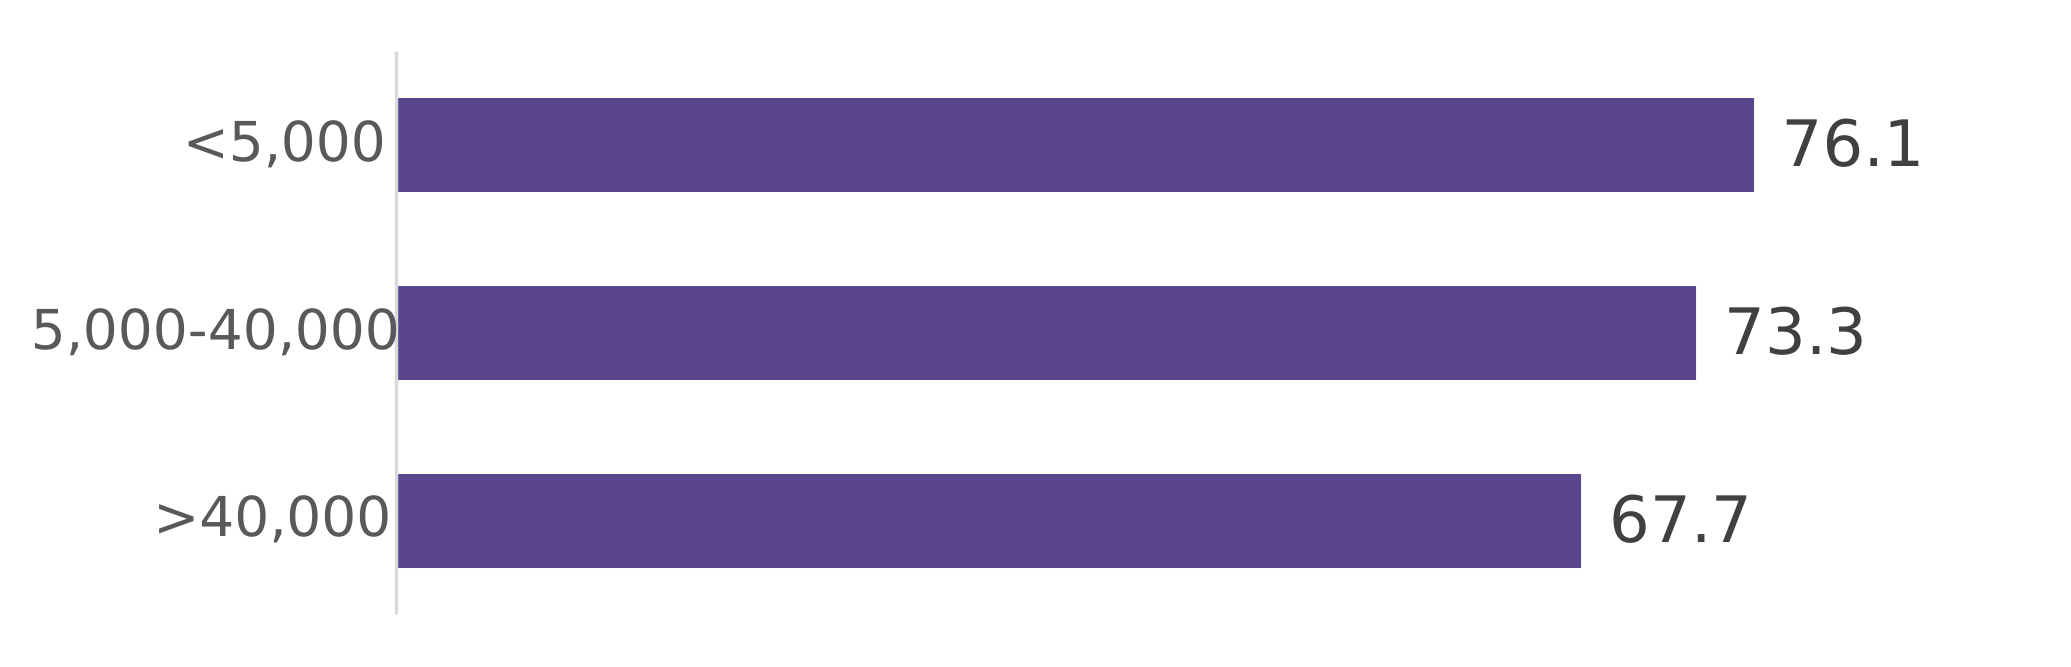
23 - Smaller landlords report higher average overall satisfaction (TP01) than larger landlords. Landlords that own fewer than 5,000 homes report median satisfaction (76.1%) that is considerably higher than landlords with 40,000 or more homes (67.7%). Median reported satisfaction across all size groups has increased.
24 - There may be underlying contextual factors that can partly explain differences in average satisfaction by landlord size, including the regions larger landlords operate within and the concentration of supported housing in smaller landlords. However, this result is consistent with the National Tenant Survey which found that larger landlords had lower average satisfaction scores after controlling for other factors.
25 - Customer service, including dealing with service requests and complaints promptly and efficiently, can drive higher overall satisfaction. The National Tenant Survey suggested in particular that lower average satisfaction for large landlords was particularly evident for satisfaction with the timeliness of repairs (TP03) and complaint handling (TP09). Larger landlords are likely to require a degree of complexity in their operations. This can introduce challenges such as managing larger specialist teams, successfully completing handovers of information between teams and maintaining consistent contact with tenants. Overcoming these challenges will provide better outcomes for tenants, which may then be reflected in reported satisfaction results.
Figure 7: Median overall satisfaction (TP01) by landlord size in dwelling units, 2025/26[footnote 16]
| Median overall satisfaction | |
|---|---|
| <5,000 | 76.1 |
| 5,000-40,000 | 73.3 |
| >40,000 | 67.7 |
Landlord type
26 - The average overall satisfaction score for tenants of local authorities is 70.6%, compared to 76.9% for tenants of private registered providers. This difference may be due in part to differing contextual factors such as region (particularly the proportion of homes in London), the average ages of tenants and the size of landlord having an impact and differences in survey collection methods used. The scale of the increase in overall median satisfaction since 2024/25 is similar for both local authority and private registered providers.
Overall satisfaction: low cost home ownership
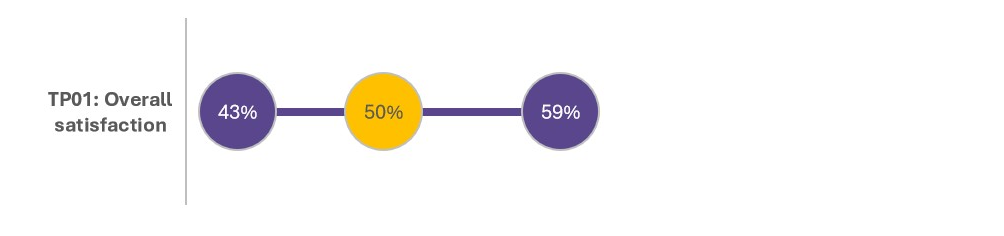
27 - The reported 2025/26 overall satisfaction (TP01) median landlord result for shared owners (LCHO residents) is also slightly higher than in the previous year (50% in 2025/26 against 48% in 2024/25)[footnote 17]. Taking into account all of the tenant survey responses collected from shared owners, 49% of these were either ‘very satisfied’ or ‘fairly satisfied’ with the overall service provided by their landlord, a one percentage point increase on last year. There is a wide range of reported performance under TP01 for landlords reporting LCHO, from 43% at the lower quartile to 59% at the upper quartile.
Figure 8: LCHO TP01 Overall satisfaction (lower quartile, landlord median, and upper quartile), 2025/26
| LCHO TP01: Overall satisfaction | |
|---|---|
| Lower Q | 43% |
| Median | 50% |
| Upper Q | 59% |
28 - Satisfaction of shared owners (LCHO residents) with their landlord remains lower than it is for LCRA tenants across all the perception measures. 30% of shared owners were dissatisfied with the overall landlord service. All tenant perception questions are asked of shared owners, with the exception of those around responsive repairs and maintenance. Shared owners have lower satisfaction with landlords across the perception measures. Satisfaction with the handling of complaints remains the lowest result for LCHO landlords, with 21% of tenants reporting satisfaction in this area.
29 - The National Tenant Survey results suggest that lower satisfaction scores for shared owners compared to tenants in rental accommodation at least partly reflects differences in services, particularly relating to repairs and maintenance and the fundamentally different nature of the shared ownership model. However, results also reflect opportunities for many landlords to consider and improve the quality and value for money of the services offered to shared owners.
TSM results by theme
30 - Overall satisfaction provides a summary of tenants’ perspectives of landlord performance in the round. Other Tenant Satisfaction Measures provide information on landlord performance on specific services areas. These TSMs cover four themes:
- Repairs and maintenance
- Complaints and engagement
- Building safety
- Neighbourhoods and anti-social behaviour.
31 - This chapter summarises TSM results result for each theme, alongside relevant contextual information. For each theme there are TSMs calculated using tenant survey information (perception measures) and information held by landlords (management information measures). TSMs for each theme are intended to be considered in the round, cross referencing both perception and management information to help understand landlord performance.
Repairs and maintenance
32 - Five TSMs reflect landlords’ repairs and maintenance performance.
Repairs and maintenance TSMs
| TP02 - Satisfaction with repairs TP03 - Satisfaction with time taken to complete most recent repair TP04 - Satisfaction that the home is well maintained |
RP01 - Homes that do not meet the Decent Homes Standard RP02 - Repairs completed within target timescale |
33 - Repairs and maintenance are fundamental parts of landlord services, and responsive repairs in particular are the main interaction between many tenants and their landlord. There were 15.6 million responsive repairs completed by landlords during 2025/26 –11.6 million of these were defined as non-emergency repairs, while 4.0 million were emergency repairs. This has increased since 2023/24, where a total of 14.3 million repairs were reported. This increase could indicate further reporting of repairs by tenants following changes in government policy as well as more consistent identification and categorisation by landlords.
34 - Most LCRA tenants (68%) reported having at least one repair carried out on their home during the last 12 months (TP02 filter). This proportion has not changed significantly in the years of TSM collection, though each tenant responding positively to this question may have multiple repairs within the last year.
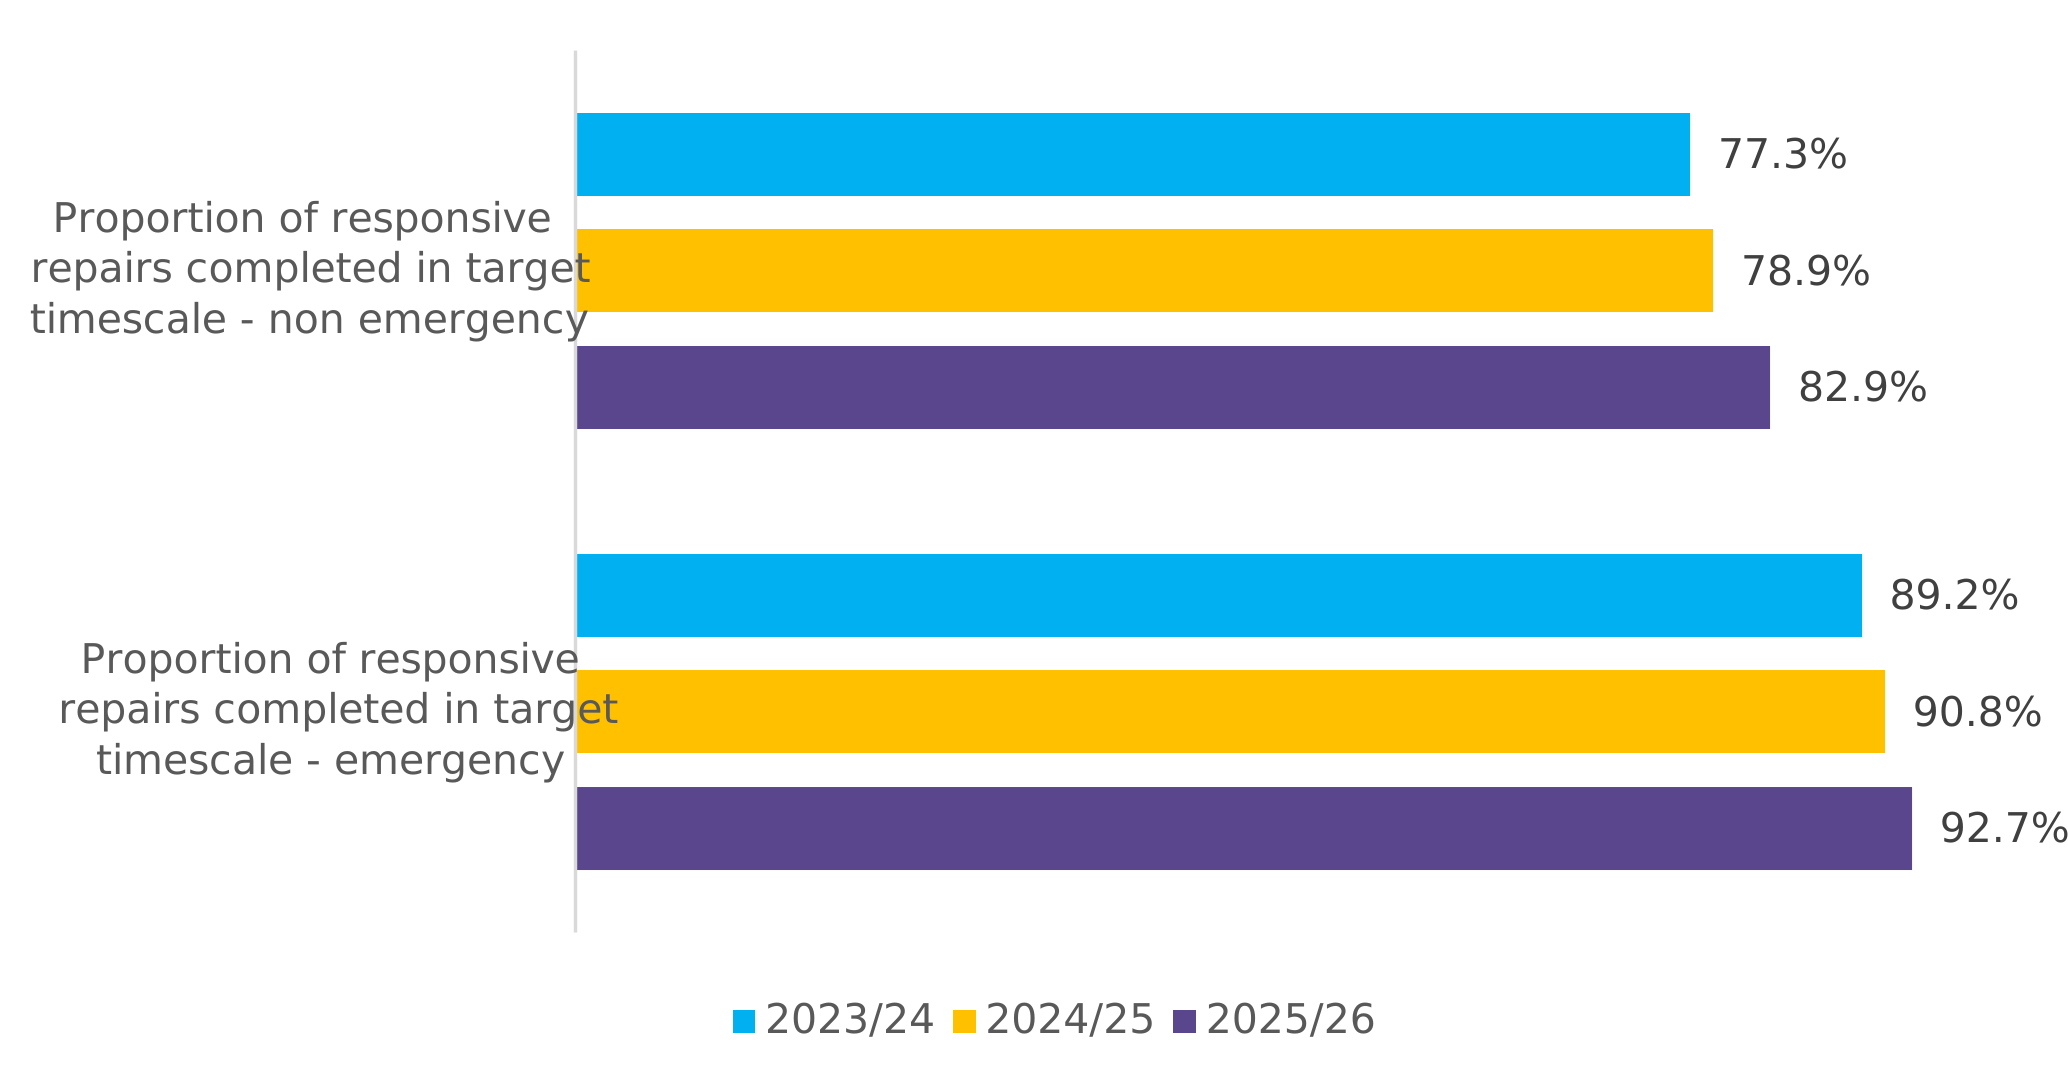
35 - Landlords are required to set target timescales for the end-to-end completion time for both emergency and non-emergency responsive repairs and use these to calculate RP02. Across the sector, a large majority of responsive repairs were recorded as being completed within these target timescales (2025/26: 83% of non-emergency, and 93% of emergency repairs).
Figure 9: Proportion of all responsive repairs completed within target timescale, 2023/24 to 2025/26
| 2023/24 | 2024/25 | 2025/26 | |
|---|---|---|---|
| Proportion of responsive repairs completed in target timescale - non emergency | 77.3% | 78.9% | 82.9% |
| Proportion of responsive repairs completed in target timescale - emergency | 89.2% | 90.8% | 92.7% |
36 - The proportion of repairs recorded as completed within landlord timescales has risen from 77% (non-emergency) and 89% (emergency) in 2023/24. For both emergency and non-emergency repairs timeliness the lower quartile of landlord reported results have risen faster than the median. Median satisfaction with the timeliness of repairs has risen from 67% in 2023/24 to 73% in 2025/26, the largest increase across the perception TSMs.
37 - Our global accounts report shows how landlords have significantly increased spending on repairs and maintenance, after accounting for inflation, and regulatory intelligence suggests that many landlords have focused on service delivery in these areas. Each of the perception TSMs covering repairs and maintenance services, including on satisfaction with the timeliness of repairs, have also increased in each year. The timeliness of repairs (TP03) is the perception TSM showing the highest increase in median. The National Tenant Survey confirmed that satisfaction with maintenance and repairs have a strong influence on overall satisfaction. In the round this suggests that some landlords are making improvements to services that have the potential to increase overall satisfaction.
38 - There is considerable variation in reported landlord performance against RP02. At the lower quartile, 78% of non-emergency responsive repairs were completed within target timescales compared to 92% at the upper quartile. There may however be particular reasons why it is not possible for landlords to complete all repairs within target timescales, for example the availability of specific parts. Some landlords who are seeking to improve their performance by working through a repairs backlog may see a temporary reduction in RP02.
39 - It is important to consider performance in light of target timelines used to generate RP02, which landlords should report as well as their TSMs. Comparisons between landlords need to be mindful of the timescales used. As part of the data return, each landlord was asked to report the maximum timescale that applied to general emergency and non-emergency repairs. Across landlords, the median maximum timescale was 24 hours for emergency repairs and 28 working days for non-emergency repairs. In general, average repairs timescales have been stable and median emergency and non-emergency maximum target timescales have not changed over the years TSMs have been reported. The median emergency repair timeline is in line with that set in the Hazards in Social Housing (Prescribed Requirements) (England) Regulations 2025, commonly referred to as Awaab’s Law.
40 - Landlords are permitted to set more than one target timescale corresponding to different types of non-emergency or emergency responsive repairs (e.g. ‘urgent’ and other non-emergency repairs). More than four out of five (83%) landlords reported having more than one non-emergency repair timescale. A description of the multiple timescales supplied by each landlord is included in the published TSM dataset.
41 - Most landlords report relatively robust tenant satisfaction with repairs overall (TP02: 76%), the time taken to complete the most recent repair (TP03: 73%) and that the home is well-maintained (TP04: 74%). However, there is considerable variation between landlords, for example with the lower quartile landlord reporting satisfaction with repairs timeliness of 67% compared to 79% at the upper quartile. These satisfaction scores are intended as a cross-reference to the repairs and maintenance TSMs derived from management information.
Figure 10: LCRA TP02, TP03 and TP04 Repairs and maintenance satisfaction (lower quartile, landlord median, and upper quartile), 2025/26
| Lower Q | Median | Upper Q | |
|---|---|---|---|
| TP02: Repairs | 70% | 76% | 82% |
| TP03: Repairs timeliness | 67% | 73% | 79% |
| TP04: Well maintained | 68% | 74% | 80% |
42 - A sufficiently rounded view of responsive repairs data is important. The TSM RP02 is only based on those repairs that have been completed during the year. During 2025/26, just over 18.4 million responsive repairs were raised, and more than 2.6 million repairs were closed without completion (i.e. cancelled by the landlord or tenant). At year end, there were over 1.2 million ‘work in progress’ responsive repairs, where a need for a repair has been identified but the work has not yet been completed.
43 - The median landlord cancelled 11% of responsive repairs during 2025/26 and had 6% of repairs uncompleted at year end although there is significant variation across landlords. This information can supplement RP02 and contextualise landlord performance. Relatively high levels of cancelled or work in progress repairs may explain some of the differences between landlord reported repairs completed within target timescale (RP02) compared to tenant satisfaction with repairs (TP02 and TP03).
44 - Maintenance is broader than responsive repairs and includes planned and cyclical works which may be necessary in order to ensure that properties are maintained up to the Decent Homes Standard. In their TSM results (RP01), landlords reported that 3.9% of LCRA homes did not meet the Decent Homes Standard (DHS) at 31 March 2026. This sector mean is driven by a minority of landlords reporting substantial levels of non-decent stock. The number of non-decent units identified at year end (RP01) can depend on the coverage and frequency of stock condition surveys, the remediation of identified non-decent units through the year, and the approach that landlords take to calculating year-end DHS fails. Landlords achieving a better understanding of their stock – in particular improving stock condition survey coverage - is likely to be one factor that is increasing the level of DHS fails reported at year end. More information on landlord DHS compliance is set out in other statistics published by us (Private Registered Providers - Social Housing Stock and Rents in England) and MHCLG (Local Authority Housing Statistics).
Table 3: Repairs and maintenance management information measures, 2025/26
| Measure | Landlord lower quartile | Landlord median | Landlord upper quartile | Average across sector[footnote 18] | Change in average since 23/24 |
|---|---|---|---|---|---|
| RP01 Homes that do not meet the Decent Homes Standard [LCRA only] (%): | 0.0% | 0.6% | 3.3% | 3.9% | +0.9pp |
| RP02 Repairs completed within timescale (non-emergency) [LCRA only] (%) | 77.8% | 85.3% | 91.7% | 82.9% | +5.7pp |
| RP02 Repairs completed within timescale (emergency) [LCRA only] (%) | 91.6% | 96.2% | 99.0% | 92.7% | +3.6pp |
Table 4: Repairs and maintenance contextual information, 2024/25 to 2025/26[footnote 19]
| Measure | Landlord lower quartile | Landlord median | Landlord upper quartile | Average across sector[footnote 20] | Change in average since 24/25 |
|---|---|---|---|---|---|
| Responsive repairs closed without completion (i.e. cancelled) as a proportion of repairs raised during 2025/26 | 7.0% | 11.3% | 15.3% | 14.1% | +0.5pp |
| Responsive repairs work-in-progress at year end, as a proportion of repairs raised during 2025/26 | 3.7% | 5.6% | 7.9% | 6.8% | +0.4pp |
| Non-emergency responsive repairs (working days) maximum target timescale | 20 | 28 | 60 | - | - |
| Emergency responsive repairs (hours) maximum target timescale | 24 | 24 | 24 | - | - |
Complaints and engagement TSMs
45 - Six TSMs reflect landlord performance on complaints and engagement:
Complaints and engagement TSMs[footnote 21]
| TP06 - Satisfaction that the landlord listens to tenant views and acts upon them TP07 - Satisfaction that the landlord keeps tenants informed about things that matter to them TP08 - Agreement that the landlord treats tenants fairly and with respect TP09 - Satisfaction with the landlord’s approach to handling complaints |
CH01 - Complaints relative to the size of the landlord CH02 - Complaints responded to within Complaint Handling Code timescales |
46 - The number of stage one and stage two complaints recorded by landlords (CH01) has increased over the last two years. In 2023/24 landlords reported more than 250,000 stage one complaints and 290,000 in 2024/25 before reaching nearly 320,000 in 2025/26. The number of stage two complaints have nearly doubled in the same period, from 43,000 in 2023/24 to 82,000 in 2025/26. This change may be partly explained by landlords updating their approaches to defining and recording complaints in light of the revised Complaint Handling Code (2024), which states that residents should not be required to give a reason for wanting to escalate their complaint. It may also reflect wider tenant knowledge of complaints processes, including around requesting an escalation, and potentially more tenants using online resources including Artificial Intelligence (AI) to assist in making complaints. To note the proportion of tenants who report making a complaint in tenant surveys (TP09 filter) has not increased.
Figure 11: Proportion of complaints responded to within Ombudsman timetables, all stock (LCRA&LCHO), 2023/24 to 2025/26
| 2023/24 | 2024/25 | 2025/26 | |
|---|---|---|---|
| Proportion of complaints responded to within Ombudsman timescales - stage one | 73.2% | 78.4% | 85.5% |
| Proportion of complaints responded to within Ombudsman timescales - stage two | 66.9% | 74.8% | 82.3% |
47 - The proportion of complaints responded to within Complaint Handling Code timescales (CH02) has also increased, for stage 1 from 73% in 2023/24 to 86% in 2025/26. This suggests landlords have been able to respond to the higher volume of complaints recorded in a way that meets the Code timescales. To note, the largest increase has been at the lower quartile, which has seen an increase of 18 percentage points for stage 1 complaints. Satisfaction with complaint handling (TP09) remains the lowest perception score across the TSMs, with the median landlord reported satisfaction score at 37.4% (for LCRA). In line with other perception TSMs, this has shown a slight increase on last year (2024/25: 35.5%). These responses are drawn solely from those tenants who state in the tenant perception survey that they have made a complaint in the last 12 months.
48 - Complaints TSMs are intended to be interpreted carefully in the round. For example, the total number of complaints (CH01) in isolation is not necessarily an indicator of poor landlord performance. Higher complaints volumes may be the result of a more accessible and transparent complaints process, or landlords making different decisions about what is a complaint or a service request. However, understanding the number of complaints is fundamental to getting a rounded picture of each landlord’s complaints procedures and performance.
49 - The proportion of LCRA tenants who report making a complaint in perception survey responses (TP09 filter: 25% across all submissions) is significantly higher than those identified by landlords (CH01: 72 per 1,000 which translates to 7.2%). National Tenant Survey analysis indicates that what some tenants consider as a complaint is likely to have been recorded as a service request by a landlord in line with the Complaint Handling Code. However, perspectives of these tenants provide a valid and useful source of information from those who have been dissatisfied with the service or home provided by their landlord.
Figure 12: LCRA TP09 complaints satisfaction (lower quartile, landlord median, and upper quartile), 2025/26

| TP09: Approach to complaints handling | |
|---|---|
| Lower Q | 31% |
| Median | 37% |
| Upper Q | 45% |
50 - The lower result for satisfaction with the handling of complaints (TP09) compared to other TSMs suggests that landlords need to understand why tenants report dissatisfaction. There is significant variation in complaints logged by landlords. Stage one complaints per 1,000 units range from 40 per 1,000 homes at the lower quartile to almost double this at 79 per 1,000 units at the upper quartile (CH01, LCRA). Moreover, the proportion of stage one complaints responded to within Complaint Handling Code timescales ranges from 83% at the lower quartile to 99% at upper quartile (CH02, LCRA).
51 - Under the Complaint Handling Code, landlords have the ability to extend complaint response timelines in specific circumstances. Landlords report that 23% of the stage one complaints responded to within Complaint Handling Code timescales required an extension – however, there is considerable variation across landlords, with 5% of LCRA stage one complaints extended at the lower quartile, to 24% at the upper quartile.
Table 5: Management information on complaints, 2025/26
| Landlord lower quartile (LCRA) | Landlord median (LCRA) | Landlord upper quartile (LCRA) | Average across sector[footnote 22] | Change in average since 23/24[footnote 23] | |
|---|---|---|---|---|---|
| CH01 Complaints relative to the size of the landlord – stage one (per 1,000 homes) | 39.8 | 56.8 | 78.7 | 72.4 | +12.5 |
| CH01 Complaints relative to the size of the landlord – stage two (per 1,000 homes) | 7.2 | 12.0 | 18.7 | 18.6 | +9.1 |
| CH02 Complaints responded to within CHC timescales– stage one (%) | 82.5% | 93.8% | 98.6% | 85.5% | +12.4pp |
| Of these, what proportion required extensions (of up to 10 days as permitted in the code) (%) | 5.2% | 12.4% | 23.6% | 22.8% | +3.8pp (on 2024/25) |
| CH02 Complaints responded to within CHC timescales – stage two (%) | 79.6% | 93.2% | 100% | 82.3% | +15.4pp |
| Of these, what proportion required extensions (of up to 20 days as permitted in the code) (%) | 3.1% | 14.3% | 29.0% | 27.4% | +2.7pp (on 2024/25) |
Respectful and helpful engagement
52 - Satisfaction that the landlord treats tenants with fairness and respect is one of the highest scoring perception TSM results (TP08: 79% for LCRA). In line with other perception TSMs this has increased in the past year (2024/25: 78%). National Tenant Survey evidence suggests that responses often reflected how tenants felt they were treated by staff when they contacted their landlord.
Figure 13: LCRA TP06, TP07 and TP08 respectful and helpful engagement satisfaction (lower quartile, landlord median, and upper quartile), 2025/26
| Lower Q | Median | Upper Q | |
|---|---|---|---|
| TP06: Landlord listens and acts | 58% | 64% | 72% |
| TP07: Keeps tenants informed | 69% | 74% | 79% |
| TP08: Fairness and respect | 75% | 79% | 85% |
53 - The two TSMs focused on satisfaction with engagement (TP06 and TP07) measure tenant views on their experience of the relationship with the landlord. The flow of information between tenants and landlords is necessary to support accountability and scrutiny, and ensure that tenant views influence landlords’ strategies, policies and services.
54 - National Tenant Survey evidence suggests that satisfaction that the landlord keeps tenants informed about things that matter to them (TP07) often reflects general formal communications from landlords (e.g. newsletters, formal letters), while satisfaction that the landlord listens to views and acts (TP06) often reflects service requests and complaints raised by tenants.
Building safety TSMs
55 - Six TSMs reflect landlords’ building safety performance in 2025/26[footnote 24]:
Building Safety TSMs
| TP05 - Satisfaction that the home is safe This is asked of both tenants and shared owners. |
BS01 - Proportion of homes for which all required gas safety checks have been carried out BS02 - Proportion of homes for which all required fire risk assessments have been carried out. BS03 - Proportion of homes for which all required asbestos management surveys or re-inspections have been carried out. BS04 - Proportion of homes for which all required legionella risk assessments have been carried out. BS05 - Proportion of homes for which all required communal passenger lift safety checks have been carried out. |
56 - Building safety measures drawn from management information (BS01-BS05) reflect five key areas of operational safety in the social housing sector. Most landlords report that all homes had required building safety checks under BS01-BS05 carried out by 31 March 2026. The median result for all building safety TSMs are at or very near 100%. There may be particular issues that affect individual landlord results, including the ability to gain access to homes or to source information on checks carried out by third parties. We recognise that not all landlords will be able to report 100% of required checks by year end where they encounter issues, but that all reasonable steps must be taken to ensure statutory checks are carried out and appropriately recorded.
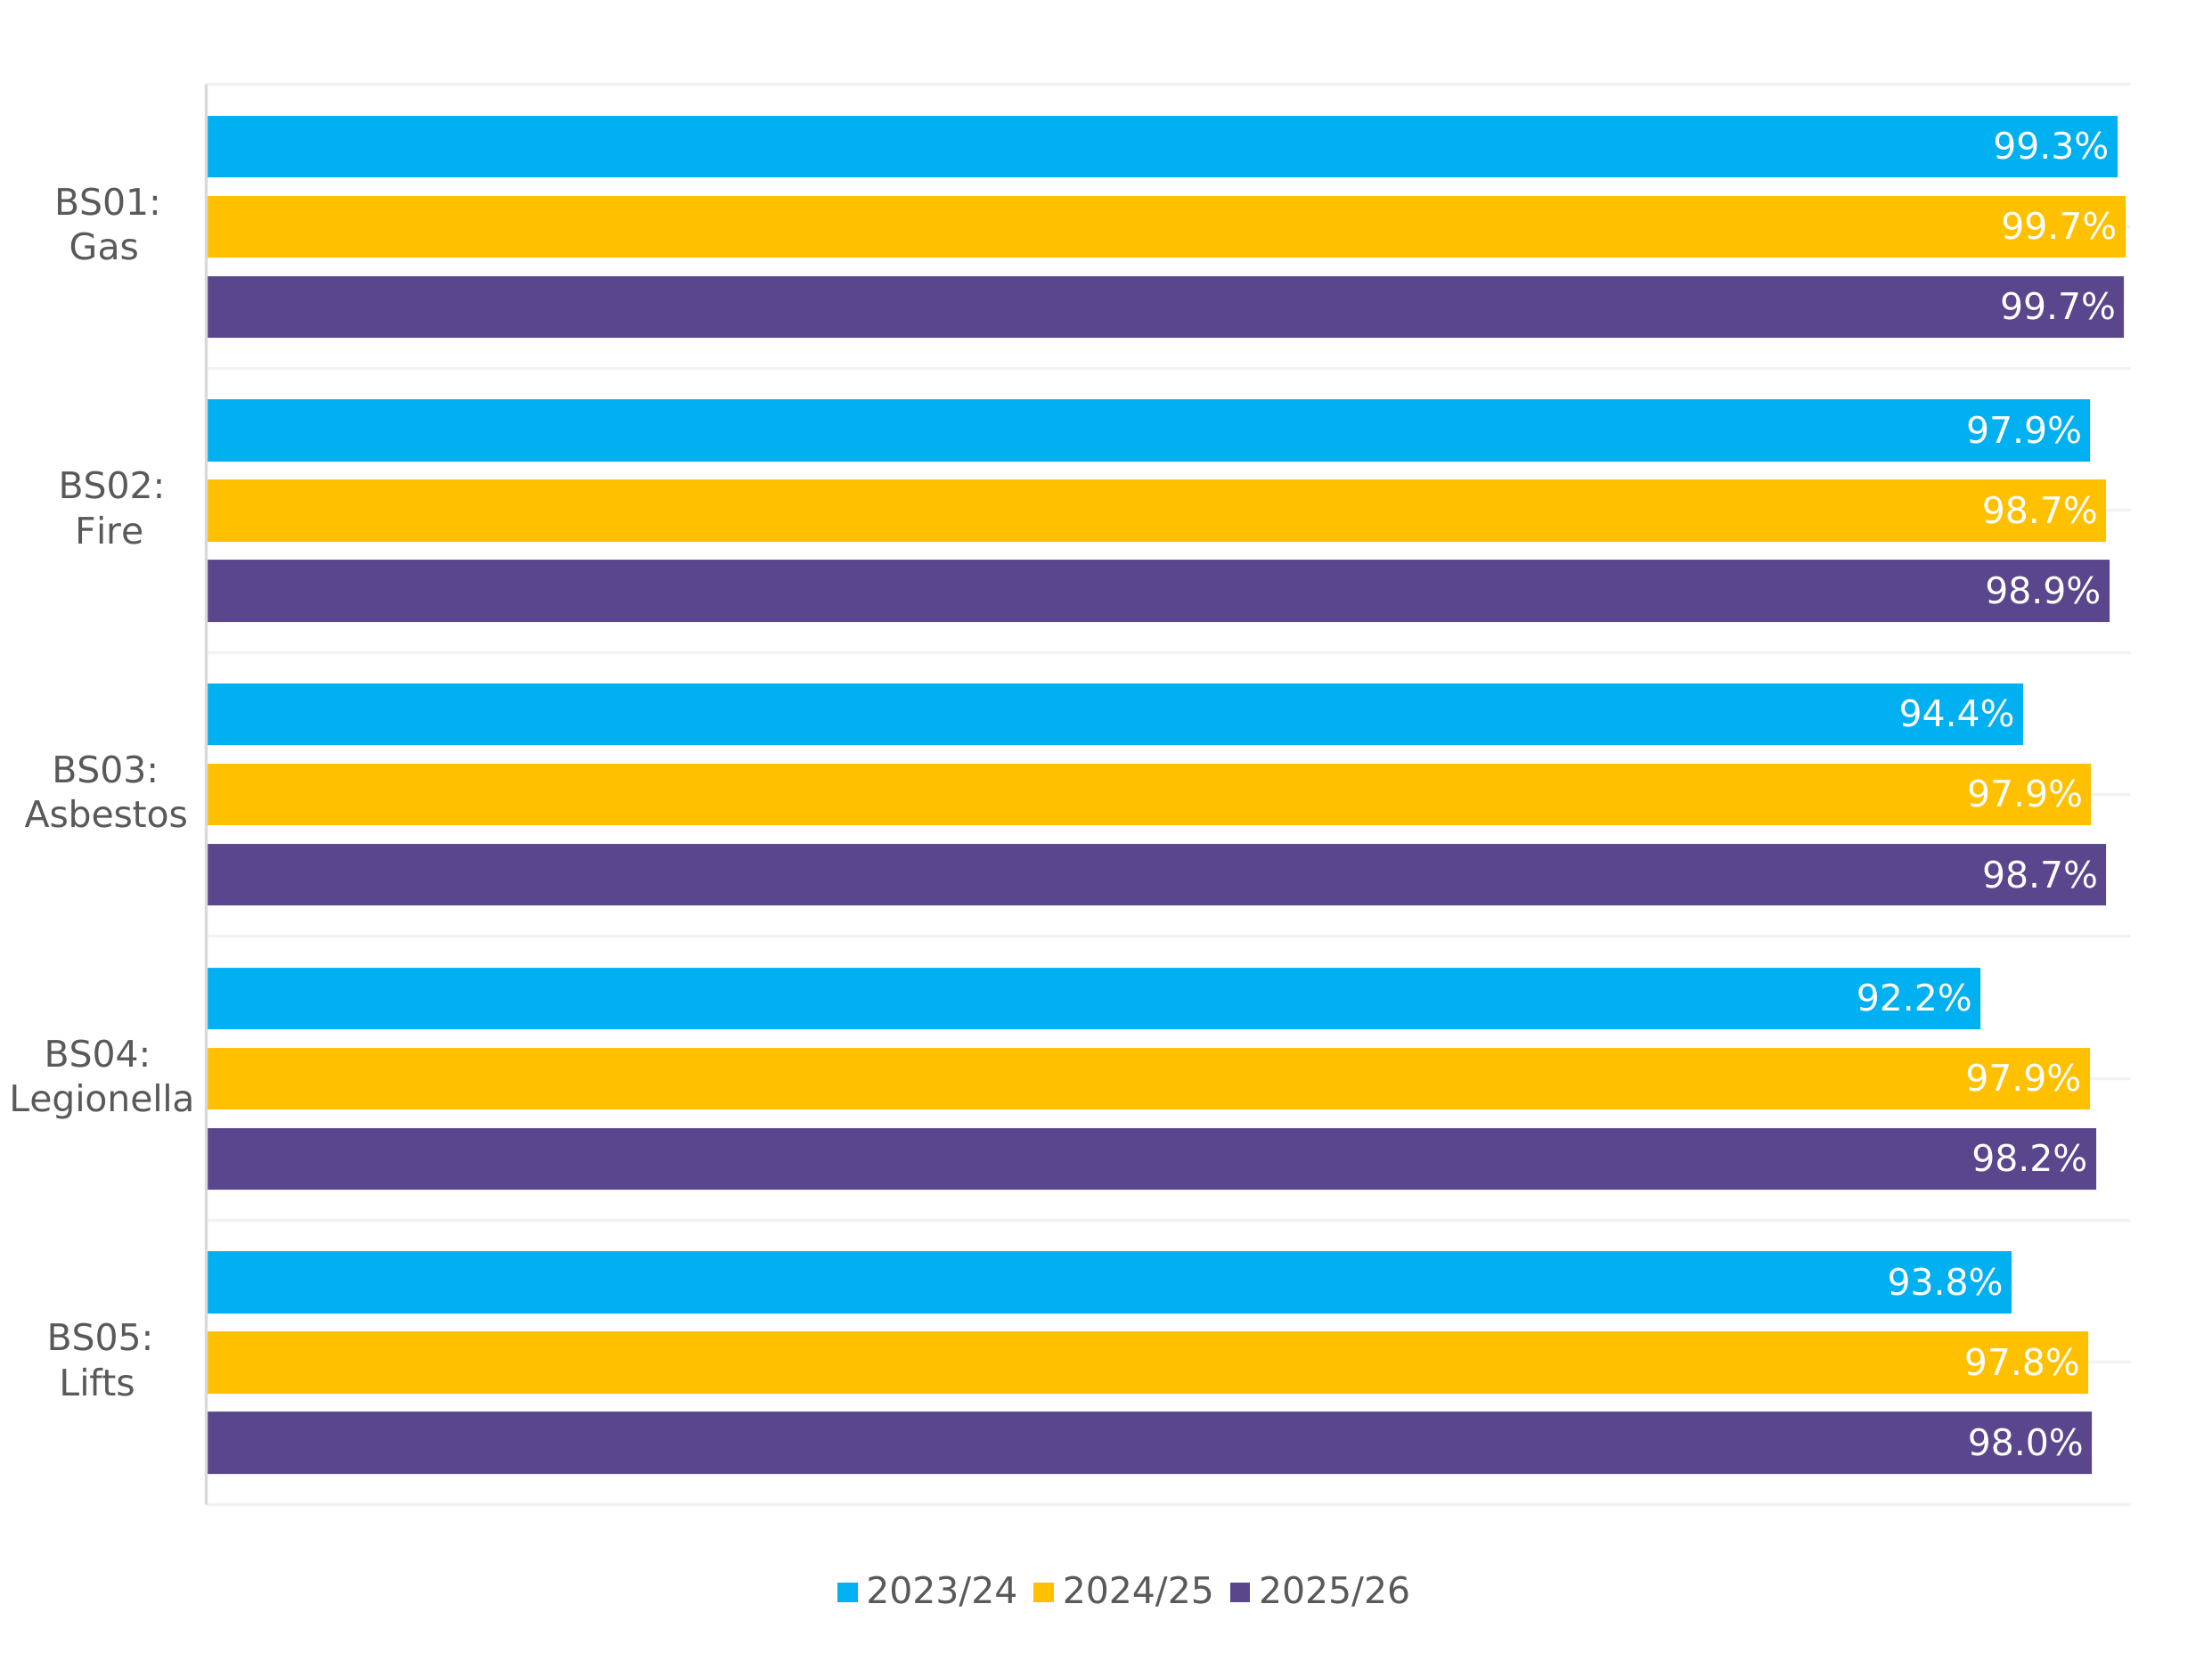
Figure 14: Building safety management information TSMs, proportion of units with all required completed checks carried out on 31 March, 2023/24 to 2025/26
| 2023/24 | 2024/25 | 2025/26 | |
|---|---|---|---|
| BS01: Gas | 99.3% | 99.7% | 99.7% |
| BS02: Fire | 97.9% | 98.7% | 98.9% |
| BS03: Asbestos | 94.4% | 97.9% | 98.7% |
| BS04: Legionella | 92.2% | 97.9% | 98.2% |
| BS05: Lifts | 93.8% | 97.8% | 98.0% |
57 - Whilst most landlords report being at or very near 100% for all safety checks, a minority of landlords reported material numbers of homes for which checks had not been carried out at year end. Results based on the total number of homes with all checks completed showed above 99% compliance for gas (BS01) and above or at 98% compliance for fire (BS02), asbestos, water and lift safety (BS03, BS04 and BS05). Reported sector level compliance has improved across all building safety checks since 2023/24, most notably for asbestos, water and lift safety (BS03-BS05), and has continued to increase in the last year. We consider that reasons for these improvements are likely to include a bedding in of regulatory requirements, a greater consistency in the interpretation of statutory guidance, a heightened focus on building safety requirements and data (including on checks managed by other organisations) and landlords improving levels of compliance.
58 - We have engaged with small numbers of landlords that report material numbers of homes where building safety checks reported in the TSMs have not been carried out. This is to understand the presenting issue and to seek assurance that the landlord has an appropriate approach in place to manage associated risks. We will continue this engagement and take further action where necessary in line with our regulatory approach. Where necessary, we will reflect the conclusions of this engagement in a published regulatory judgement.
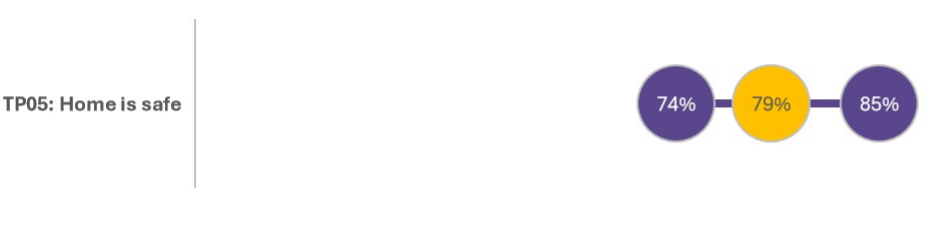
59 - The perception measure TP05 asks how safe residents feel within their home, with the landlord median score of 79% for LCRA and 74% for LCHO. Behind this there is variation between landlords, with the lower quartile at 74% and upper quartile at 85% for landlords reporting LCRA. There may be several factors driving tenants’ perceptions that their home is safe. The National Tenant Survey found that tenant views on safety checks reflected in the TSMs are a clear component of this, although this also reflects views on building security, general repairs and maintenance, and crime and anti-social behaviour from immediate neighbours and the wider area.
Figure 15: LCRA TP05 satisfaction that the home is safe (lower quartile, landlord median, and upper quartile), 2025/26
| TP05: Home is safe | |
|---|---|
| Lower Q | 74% |
| Median | 79% |
| Upper Q | 85% |
60 - The TSM results only reflect part of the overall picture for building safety within registered landlords. As set out in the Safety and Quality Standard, remedial actions arising from the safety checks must also be completed in a timely way to ensure tenant safety.
Table 6: Building safety management information, 2025/26
| Landlord lower quartile | Landlord median | Landlord upper quartile | Average across sector[footnote 25] | Change in average since 23/24 | |
|---|---|---|---|---|---|
| BS01 Gas safety checks | 99.7% | 99.9% | 100.0% | 99.7% | +0.4pp |
| BS02 Fire safety checks | 100.0% | 100.0% | 100.0% | 98.9% | +1.0pp |
| BS03 Asbestos safety checks | 100.0% | 100.0% | 100.0% | 98.7% | +4.3pp |
| BS04 Water safety checks | 100.0% | 100.0% | 100.0% | 98.2% | +6.0pp |
| BS05 Lift safety checks | 99.9% | 100.0% | 100.0% | 98.0% | +4.2pp |
Neighbourhood and anti-social behaviour TSMs
61 - Four TSMs reflect landlords’ performance on neighbourhood management and anti-social behaviour (ASB):
Neighbourhood and anti-social behaviour TSMs
| TP10 - Satisfaction that the landlord keeps communal areas clean and well maintained TP11 - Satisfaction with the landlord’s contribution to the neighbourhood TP12 - Satisfaction with the landlord’s handling of ASB |
NM01 – Anti-social behaviour cases per 1,000 properties |
62 - Just over half of LCRA tenants (51%) completing perception surveys report living in a building with communal areas. Of these tenants, average satisfaction that the landlord keeps these communal areas clean and well maintained is 70% (TP10 median landlord). This is an increase on last year’s results (2024/25: 67%). The level of satisfaction with communal areas for shared owners is considerably lower at 49% (TP10 median landlord) and is likely to be one factor driving overall satisfaction for this group.
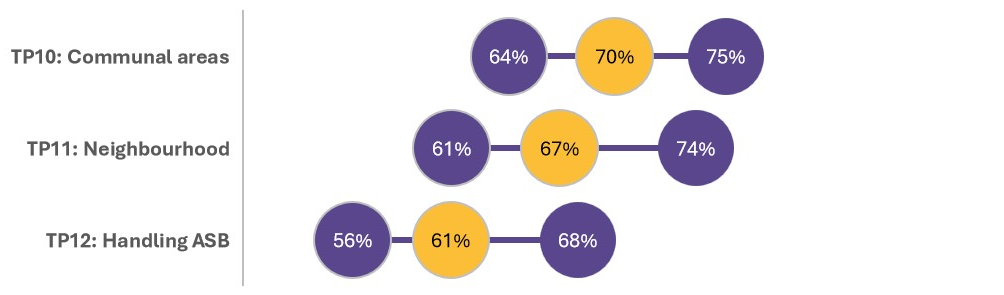
Figure 16: LCRA TP10, TP11 and TP12 neighbourhood and anti-social behaviour satisfaction (lower quartile, landlord median, and upper quartile), 2025/26
| Lower Q | Median | Upper Q | |
|---|---|---|---|
| TP10: Communal areas | 64% | 70% | 75% |
| TP11: Neighbourhood | 61% | 67% | 74% |
| TP12: Handling ASB | 56% | 61% | 68% |
63 - Satisfaction that landlords make a positive contribution to neighbourhoods (TP11) is on average somewhat lower than other tenant perception measures (67% median landlord score). National Tenant Survey analysis suggests that this TSM reflects a wide range of issues, including landlord initiatives but also those where many landlords may have limited influence (e.g. the appearance of the local area). Moreover, responses from tenants with local authority landlords may be influenced by perspectives on council services which extend beyond the landlord function. While there may be valuable feedback on neighbourhoods through this TSM, relative scores between landlords need to be interpreted with care.
Table 7: Anti-social behaviour management information (LCRA)
| Measure | Lower quartile | Landlord median | Upper quartile | Average across sector[footnote 26] | Change in average since 23/24 |
|---|---|---|---|---|---|
| NM01 Anti-social behaviour cases relative to the size of the landlord (per 1,000 homes) | 23.3 | 35.7 | 56.0 | 52.6 | +3.5 |
| NM01 Anti-social behaviour cases relative to the size of the landlord - hate incidents (per 1,000 homes) | 0.3 | 0.7 | 1.3 | 1.2 | +0.2 |
64 - The number of anti-social behaviour cases reported by the median landlord was 36 per 1,000 homes (NM01 all cases), which is unchanged since the first year of TSM collection. Larger landlords typically report more anti-social behaviour cases relative to their size, and the average across the sector as a whole has increased somewhat to 53 ASB cases per 1,000 homes in 2025/26.
65 - An anti-social behaviour case is a log of activity undertaken by a landlord in response to a report of anti-social behaviour. There is a considerable range of anti-social behaviour cases reported by landlords – from 23 per 1,000 homes for a lower quartile landlord to 56 per 1,000 homes at the upper quartile.
66 - The total number of anti-social behaviour cases in isolation is not intended as an indicator of relative landlord performance. Case numbers are likely to be driven by a number of factors outside landlord control, as well as how landlords identify, record, and act on reports of anti-social behaviour. However, case numbers are a fundamental component of a rounded picture of landlords’ performance in this area and a starting point for considering each landlord’s approach.
67 - Satisfaction with the landlord’s approach to handling anti-social behaviour (TP12) is also typically somewhat lower than other tenant perception measures (61% median landlord score). For some tenants, this is likely to reflect knowledge and experience of their landlord’s approach to handling anti-social behaviour. However, the National Tenant Survey evidence suggests that the satisfaction of tenants may be influenced by more general neighbourhood issues. A landlord’s role in handling anti-social behaviour in an area may also depend on the density of stock owned by the landlord in a particular area. Moreover, responses from local authority tenants may reflect their perspectives on the council’s wider role on anti-social behaviour. While tenant feedback through this TSM is likely to be valuable part of understanding landlord performance, relative scores between landlords need to be interpreted with care.
Tenant perception surveys and data quality
68 - Tenant perception measure results are based on surveys collected by landlords, following detailed requirements set by the regulator. While many methodological factors that could impact survey results are standardised by these requirements, where this is not feasible we set clear requirements for landlords to be transparent about their approach. Each landlord must publish a summary of their survey approach used to generate their tenant perception measures. The number of surveys collected by local authorities and private registered providers is broadly reflective of the number of tenants living in homes owned by each type of landlord.
69 - This chapter summarises areas of methodology that may have an impact on results calculated from perception surveys and the extent to which TSM requirements have been followed in generating perception measures.
Figure 17: Tenant perception surveys – overview of LCRA survey, 2025/26[footnote 27]

| LCRA - Local Authorities | LCRA - Private Registered Providers |
|---|---|
| 167,335 | 291,516 |
Survey collection method
70 - Landlords have flexibility within TSM requirements to determine which survey collection methods to use, for example whether the tenant survey used to generate TSMs is conducted by telephone, face-to-face, or online. Landlords are required to use an appropriate survey collection method or mix of methods considering factors such as likely response rate, cost, addressing barriers to participation, tenant profile, and the representativeness of responses. Landlords must also be able to demonstrate a rationale for the survey collection methods chosen with reference to the size and characteristics of their relevant tenant population.
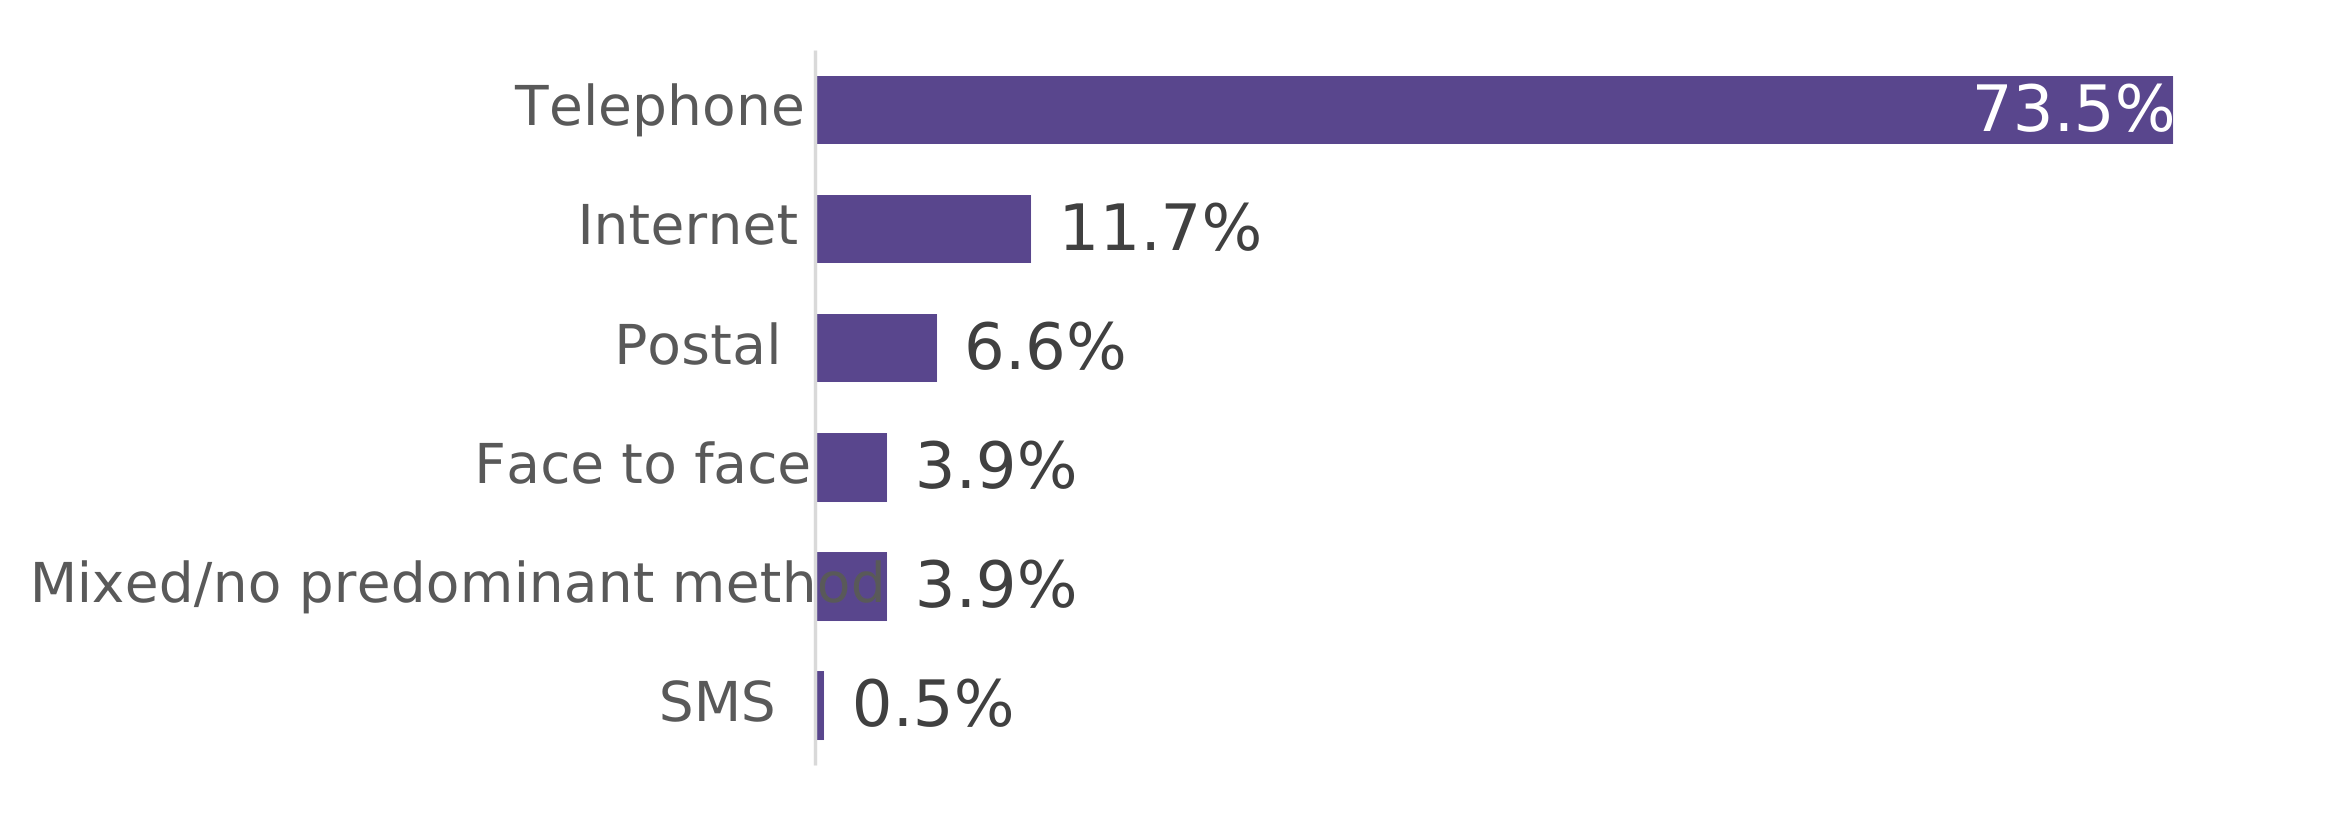
71 - There is a degree of consistency over survey collection approach for most landlords. The majority of TSM surveys (65%) in 2025/26 were collected by telephone, and 74% of landlords used telephone surveys as their principal survey collection method. In general, landlords’ collection approaches have been generally stable over time: slightly more landlords used telephone as their predominant collection method compared to previous years (73% in 2025/26 compared to 71% in 2024/25). It is important to note most (67%) landlords have used more than one survey collection method to collect TSMs. This is likely to reflect a goal of reaching different groups of tenants.
72 - There are only a small proportion of landlords that used internet, postal or face-to-face as their principal survey collection method.
Figure 18: Predominant survey collection method, 2025/26[footnote 28]
| ALL | |
|---|---|
| Telephone | 73.5% |
| Internet | 11.7% |
| Postal | 6.6% |
| Face to face | 3.9% |
| Mixed/no predominant method | 3.9% |
| SMS | 0.5% |
73 - Landlords have reported overall satisfaction scores for each collection method used to us. While telephone surveys had an average satisfaction of 71%, average scores for internet surveys (63%) were lower. The average level of satisfaction reported in surveys completed using postal forms (85%) were higher, as were those collected through face-to-face surveys (80%). As well as potentially the quality of services provided by different landlords, the differences in average results between collection methods may reflect which tenants respond to different collection methods[footnote 29], that landlords with different stock and tenant profiles may select certain collection methods[footnote 30], and factors that relate directly to the survey collection method itself[footnote 31].
74 - We consider that survey collection method used is fundamental context to assessing each landlord’s satisfaction scores; this is especially the case for landlords using a predominant survey collection method that diverges from that commonly used by other landlords. It is reasonable to compare satisfaction scores for landlords where they have used a similar mix of methods, or to compare overall satisfaction by collection method reported across landlords (e.g. comparing average satisfaction from telephone surveys specifically by two landlords). Similarly, when comparing individual landlord’s results year on year it is important to be aware of any changes in survey collection methods used. We require landlords to be transparent with tenants when there are changes to their survey methodology that could have a material impact on satisfaction. For each landlord, the dataset published alongside this report clarifies which survey collection methods have been used and the overall satisfaction score for each method used for comparability.
Table 8: Average TP01 overall satisfaction by collection method, all submissions (including LCRA and LCHO), 2025/26
| Survey collection method | Total number of surveys collected | Overall satisfaction across sector (TP01)[footnote 32] |
|---|---|---|
| Postal | 37,690 | 84.5% |
| Face to face | 49,397 | 79.8% |
| Telephone | 321,993 | 71.2% |
| SMS | 5,182 | 68.5% |
| Internet | 78,636 | 62.5% |
Tenant interviews
75 - Some survey collection methods, for example telephone and face to face, involve interviews with tenants to generate perception measures.
76 - Most landlords use external market research contractors to undertake these interviews, whilst a minority choose to undertake the surveys themselves. There are risks for landlords to manage in their choice of approach, and landlords ultimately remain responsible for ensuring the accuracy of their TSM results. For example, landlords need to ensure their contractors are following the TSM requirements including in the wording of their surveys and contacts with tenants.
77 - Landlords need to consider carefully their approach to conducting tenant interviews and meeting TSM requirements. Assurance should be in place to confirm that those undertaking surveys are appropriately trained and monitored, and that appropriate quality control of surveys takes place. This is particularly important where landlords are using their own staff to conduct surveys, who may not have day to day experience of survey collection good practice.
Approach to calculating tenant perception measures
78 - Landlords must ensure that, as far as possible, survey responses used to calculate perception TSMs are representative of the relevant tenant population. This can be achieved through either generating a representative sample, or weighting responses. Just over a fifth of submissions (23%) have used weighting to ensure the survey data is representative of their tenants. Landlords must include a summary of their assessment of representativeness in their published summary of survey approach. Unrepresentative data can impact the accuracy of the results. We will continue to scrutinise summary of approach documents to ensure that landlords have transparently assessed representativeness and calculated TSMs in line with the requirements.
79 - Landlords must, as far as possible, generate a sample size that meets minimum levels of statistical accuracy set out in TSM requirements. The vast majority of landlords report that they have met these minimum sample sizes to generate TSMs. For context, sample size achieved is set out alongside each landlord’s tenant perception measures in the published data.
Figure 19: Approach to tenant perception survey (all submissions), 2025/26
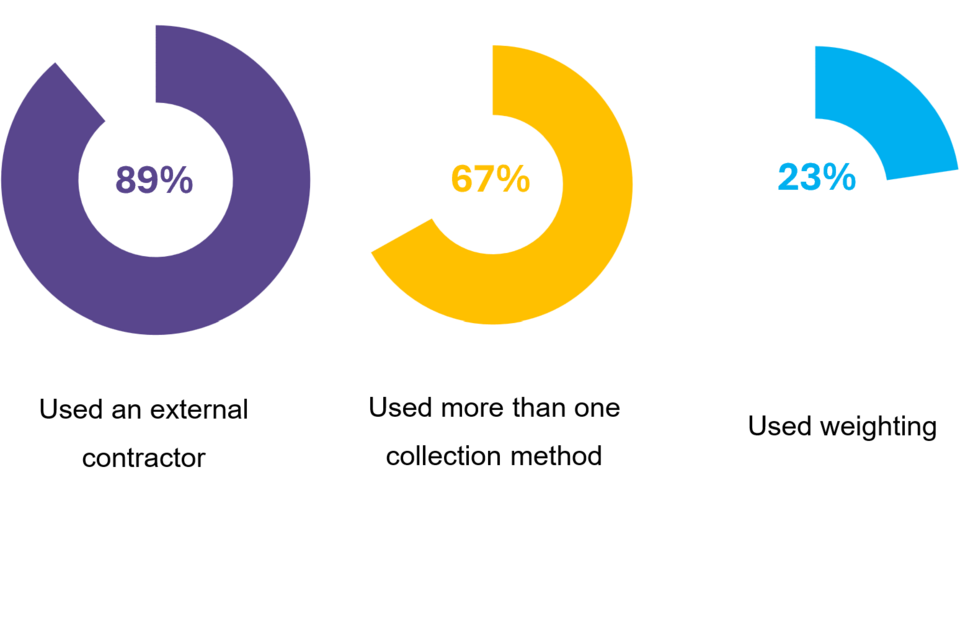
| Yes | No | |
|---|---|---|
| Used an external contractor | 89% | 11% |
| Used more than one survey collection method | 67% | 33% |
| Used weighting to ensure representativeness | 23% | 77% |
Data quality - meeting TSM requirements
80 - It is ultimately the responsibility of boards of private registered landlords and governing bodies of local authority landlords to ensure that TSMs are accurate and built on a survey methodology that meets the requirements.
81 - We have reviewed all TSM data returns and supporting documentation to check for any material or obvious areas where landlords may not have met requirements in generating or reporting TSMs. As well as checking landlords’ published TSMs, this review focused in particular on each landlord’s approach to tenant perception surveys.
82 - From this review, we have assurance that the vast majority of large landlords have generated the full range of TSMs and in general have met TSM requirements on the generation and calculation of satisfaction scores. In general, we have seen improvements in landlords meeting the full range of TSM requirements, particularly around promptly publishing required documents and the quality of these documents. However, the review also identified some common issues each affecting a minority of landlords (see below). These often relate to the wording used in surveys outside of the TSM questions themselves and transparency of the TSM results published by landlords, rather than the calculation of the TSMs submitted to us.
83 - Where divergence from the TSM requirements is identified, we will be proportionate in our approach and engage with landlords in due course. Where we are aware of fundamental issues of divergence from TSM requirements for individual landlords – and this is likely to have a material impact on the reported TSM data – this is indicated in the landlord dataset. Further information is included in the data quality and methodology report that accompanies this publication. We may also reflect this in our published regulatory judgements.
Review of TSM data returns and supporting information: common issues relevant to tenant perception measures
- With few exceptions, all landlords reviewed are publishing their questionnaire and summary of survey approach alongside their TSM results. However, a small number required contact from us during 2026 to ensure the range of required information were published. The quality of the summary of survey approach documents has improved since the first year of publication, but a minority of these documents missed out required information.
- Some published landlord questionnaires did not match the surveys completed with tenants. Landlords must ensure that the questionnaires published are an accurate representation of the surveys undertaken, including those used on their behalf by external contractors.
- Landlords are permitted to ask additional questions in their surveys but must meet TSM requirements on survey structure. For example, they must ensure that TSM questions precede any other questions on the same topic and that tenants are not led to a particular point of view. A very small number of landlords had questions on the same topic before the TSM question.
- Landlords are required to publish a comparison of the stock and tenant characteristics of tenants they survey against the wider tenant population. For large landlords this summary of representativeness must include quantitative information, as set out in the TSM requirements. A minority of landlords required contact from us to ensure the required information was included in the published assessment. In light of this analysis of representativeness, landlords need to assess whether weighting is required and apply any weighting in line with TSM requirements.
- Landlords are required to confirm in their published documents where they have made any methodological change that could materially impact their results. This often happens when there is a material change in survey collection method. A small number of landlords required prompting to ensure a change in collection method was adequately referenced in their published documents.
We will follow-up with identified landlords as part of the TSM Review.
Annex: summary tables
Year on year - LCRA median perception TSMs
| Tenant satisfaction measure | 2023/24 | 2024/25 | 2025/26 |
|---|---|---|---|
| TP01 Proportion of respondents who report that they are satisfied with the overall service from their landlord | 71.3 | 71.8 | 74.2 |
| % of tenants reporting a repair (last 12 months) – sector total | 67.4 | 67.8 | 67.9 |
| TP02 Proportion of respondents who have received a repair in the last 12 months who report that they are satisfied with the overall repairs service | 72.3 | 73.6 | 76.0 |
| TP03 Proportion of respondents who have received a repair in the last 12 months who report that they are satisfied with the time taken to complete their most recent repair | 67.4 | 69.5 | 73.0 |
| TP04 Proportion of respondents who report that they are satisfied that their home is well maintained | 70.8 | 71.9 | 74.3 |
| TP05 Proportion of respondents who report that they are satisfied that their home is safe | 76.7 | 77.6 | 79.3 |
| TP06 Proportion of respondents who report that they are satisfied that their landlord listens to tenant views and acts upon them | 60.4 | 61.6 | 63.9 |
| TP07 Proportion of respondents who report that they are satisfied that their landlord keeps them informed about things that matter to them | 70.3 | 72.0 | 73.6 |
| TP08 Proportion of respondents who report that they agree their landlord treats them fairly and with respect | 76.8 | 77.9 | 79.4 |
| % of tenants having made a complaint (last 12 months) – sector total | 27.8 | 26.2 | 24.7 |
| TP09 Proportion of respondents who report making a complaint in the last 12 months who are satisfied with their landlord’s approach to complaints handling | 34.5 | 35.5 | 37.4 |
| % of tenants reporting living in a property with a communal area- sector total | 50.1 | 50.9 | 51.1 |
| TP10 Proportion of respondents with communal areas who report that they are satisfied that their landlord keeps communal areas clean and well maintained | 65.1 | 66.7 | 69.5 |
| TP11 Proportion of respondents who report that they are satisfied that their landlord makes a positive contribution to the neighbourhood | 63.1 | 64.6 | 66.7 |
| TP12 Proportion of respondents who report that they are satisfied with their landlord’s approach to handling anti-social behaviour | 57.8 | 59.5 | 60.8 |
Year on year – management information median TSMs
| Tenant satisfaction measure | 2023/24 | 2024/25 | 2025/26 |
|---|---|---|---|
| BS01 Proportion of homes for which all required gas safety checks have been carried out | 99.9 | 100 | 99.9 |
| BS02 Proportion of homes for which all required fire risk assessments have been carried out (%) | 100 | 100 | 100 |
| BS03 Proportion of homes for which all required asbestos management surveys or re-inspections have been carried out (%) | 100 | 100 | 100 |
| BS04 Proportion of homes for which all required legionella risk assessments have been carried out (%) | 100 | 100 | 100 |
| BS05 Proportion of homes for which all required communal passenger lift safety checks have been carried out (%) | 100 | 100 | 100 |
| RP01 Proportion of homes that do not meet the Decent Homes Standard [LCRA only] (%) | 0.5 | 0.5 | 0.6 |
| RP02 Proportion of non-emergency responsive repairs completed within the landlord’s target timescale [LCRA only] (%) | 81.7 | 82.5 | 85.3 |
| RP02 Proportion of emergency responsive repairs completed within the landlord’s target timescale [LCRA only] (%) | 95.4 | 94.9 | 96.2 |
| NM01 Number of anti-social behaviour cases opened (per 1,000 homes) | 35.5 | 36.0 | 35.7 |
| NM01 Number of anti-social behaviour cases that involve hate incidents opened (per 1,000 homes) | 0.6 | 0.7 | 0.7 |
| CH01 Number of stage one complaints received (per 1,000 homes) - LCRA | 42.5 | 53.5 | 56.8 |
| CH01 Number of stage two complaints received (per 1,000 homes) - LCRA | 5.7 | 8.3 | 12.0 |
| CH01 Number of stage one complaints received (per 1,000 homes) - LCHO | 35.2 | 40.1 | 46.6 |
| CH01 Number of stage two complaints received (per 1,000 homes) - LCHO | 9.0 | 10.9 | 14.2 |
| CH02 Proportion of stage one complaints responded to within the Housing Ombudsman’s Complaint Handling Code timescales (%)-LCRA | 82.2 | 89.9 | 93.8 |
| CH02 Proportion of stage two complaints responded to within the Housing Ombudsman’s Complaint Handling Code timescales (%)-LCRA | 83.3 | 88.9 | 93.2 |
| CH02 Proportion of stage one complaints responded to within the Housing Ombudsman’s Complaint Handling Code timescales (%)-LCHO | 73.2 | 86.0 | 93.2 |
| CH02 Proportion of stage two complaints responded to within the Housing Ombudsman’s Complaint Handling Code timescales (%)-LCHO | 78.6 | 86.0 | 93.3 |
Year on year - LCHO median perception TSMs
| Tenant satisfaction measure | 2023/24 | 2024/25 | 2025/26 |
|---|---|---|---|
| TP01 Proportion of respondents who report that they are satisfied with the overall service from their landlord | 49.5 | 47.9 | 49.8 |
| TP05 Proportion of respondents who report that they are satisfied that their home is safe | 70.6 | 72.5 | 73.6 |
| TP06 Proportion of respondents who report that they are satisfied that their landlord listens to tenant views and acts upon them | 37.3 | 38.4 | 40.6 |
| TP07 Proportion of respondents who report that they are satisfied that their landlord keeps them informed about things that matter to them | 53.3 | 55.8 | 59.6 |
| TP08 Proportion of respondents who report that they agree their landlord treats them fairly and with respect | 59.1 | 60.0 | 61.8 |
| % of tenants having made a complaint (last 12 months) - sector total | 30.6 | 30.1 | 28.7 |
| TP09 Proportion of respondents who report making a complaint in the last 12 months who are satisfied with their landlord’s approach to complaints handling | 19.2 | 23.4 | 21.4 |
| % of tenants reporting living in a property with a communal area | 57.2 | 55.1 | 55.9 |
| TP10 Proportion of respondents with communal areas who report that they are satisfied that their landlord keeps communal areas clean and well maintained | 46.2 | 46.8 | 48.5 |
| TP11 Proportion of respondents who report that they are satisfied that their landlord makes a positive contribution to the neighbourhood | 39.1 | 40.8 | 41.9 |
| TP12 Proportion of respondents who report that they are satisfied with their landlord’s approach to handling anti-social behaviour | 37.1 | 38.0 | 37.9 |
Have your say on our statistics in 2026/27
We want to hear your views on how the format and range of documents in this statistical release meet your needs. Please email feedback, including suggestions for improvements to enquiries@rsh.gov.uk or click below to quickly rate how this document meets your needs.
Our statistical practice is regulated by the Office for Statistics Regulation (OSR). OSR sets the standards of trustworthiness, quality and value in the Code of Practice for Statistics that all producers of official statistics should adhere to. You are welcome to contact us directly with any comments about how we meet these standards. Alternatively, you can contact OSR by emailing regulation@statistics.gov.uk or via the OSR website.
-
A new TSM covering electrical safety checks (BS06) will be reported by landlords for the first time in 2027. ↩
-
Information about a small number of landlord removals are covered in the accompanying Data Quality and Methodology note. ↩
-
Landlords reporting combined LCRA and LCHO results are reported in the accompanying dataset and the sector averages, but not the separate LCRA and LCHO median landlords results presented in this report. ↩
-
Further information on the differences between landlord approaches are available in the final chapter of this document. ↩
-
By ‘shared owners’ we mean all residents of low cost home ownership accommodation (LCHO) ↩
-
Registered provider social housing in England – stock and rents (2026). ↩
-
Total LCRA responses reporting ‘very satisfied’ or ‘fairly satisfied’ for each collection method divided by total LCRA responses for each collection method. ↩
-
Given the relatively small number of landlords using these collection methods, individual landlord results can have a large impact on the proportion of surveys collected and the average results. ↩
-
Sector average perception measure results are weighted by the number of surveys each landlord completed. This increase in satisfaction has been confirmed to be statistically significant at a 5% confidence level using a one tailed paired z test (P<0.05). ↩
-
Throughout this document pp means ‘percentage point’. Percentages and changes in this table may not sum exactly due to rounding. ↩
-
Total LCRA responses reporting ‘very satisfied’ or ‘fairly satisfied’ for each collection method divided by total LCRA responses for each collection method. ↩
-
For the full definition, see the SDR and LADR guidance ↩
-
For example, the National Tenant Survey found that older tenants typically (though not always) report higher satisfaction than other age groups – before and after controlling for other contextual factors. Most supported housing owned by registered providers is housing for older people, hence the age profile of most supported housing tenants is likely to be older than average. ↩
-
Median overall satisfaction (TP01) for LCRA stock, for landlords with supported housing making up more/less than 30% of LCRA units owned (SDR/LADR, 2026). ↩
-
Median overall satisfaction (TP01) for LCRA stock, by predominant region of operation for landlords. Predominant region of operation is based on the region in which 50% of total stock owned (LCRA and LCHO units) by the landlord is located (SDR/LADR 2026). ‘Mixed’ indicates that there is no region where 50% or more of a landlord’s total stock is owned ↩
-
Median overall satisfaction (TP01) for LCRA stock, by landlords size bands based on total stock owned (LCRA and LCHO, SDR/LADR 2026) ↩
-
The vast majority of LCHO units are owned by private registered landlords - only one local authority landlord was required to collect separate LCHO tenant perception measures ↩
-
RP01: Total number of homes that do not meet DHS as a proportion of total homes where DHS applies. RP02: Total number of repairs completed within landlord’s target timescales as a proportion of total repairs completed. ↩
-
Information on the use of extensions was not part of mandatory collection in 2023/24. ↩
-
Total number of repairs closed/work in progress as a proportion of all repairs raised. ↩
-
Definitions in the management information TSMs – including complaints, complaint stages, and response timelines – follow the Housing Ombudsman’s Complaint Handling Code. ↩
-
CH01: total number of complaints as a relative to all homes in sector (per 1,000 – including LCRA and LCHO). CH02: total number of complaints responded to within CHC timescales as a proportion of all complaints responded to within timescale (LCRA and LCHO). Extensions: total number of complaints within exemptions as a proportion of all complaints (LCRA and LCHO). ↩
-
Unless otherwise stated ↩
-
A seventh building safety TSM was confirmed in June 2026 covering electrical safety checks. This TSM will be reported for the first time in the TSM results for 2026/27. More information on this is available at Consultation on changes to the TI&A Standard - GOV.UK. ↩
-
Total number of all units with all required checks completed on 31 March, as a proportion of all units requiring checks on 31 March. ↩
-
CH01: total number of cases relative to all units owned by landlords (per 1,000). ↩
-
In LCHO all but 173 surveys were completed by shared owners living in private registered provider accommodation. For LCRA the split of LA and PRP surveys broadly matches the sector, where PRP homes account for 64% of total stock. ↩
-
Predominant means more than 50% of a landlord’s surveys were collected by this method. ‘Mixed’ means no predominant method. ‘Other’ includes mentions of ‘email’ and ‘not known’. ↩
-
Referred to in academic literature as ‘mode selection’. ↩
-
For example, landlords specialising in supported housing for older people may be more likely to select face-to-face survey collection to overcome barriers to participation. Such landlords typically offer a different scope of service and have older tenant base than those with general needs housing. ↩
-
These are referred to as ‘mode effects’, which may include the impact of whether tenants complete surveys themselves or through a face to face or telephone interview. ↩
-
All tenants reporting they are very satisfied or fairly satisfied to TP01, across respondents to landlord tenant surveys (LCRA and LCHO). ↩