Statutory homelessness in England: technical note
Published 10 May 2023
Applies to England

© Crown copyright 2023
This publication is licensed under the terms of the Open Government Licence v3.0 except where otherwise stated. To view this licence, visit nationalarchives.gov.uk/doc/open-government-licence/version/3 or write to the Information Policy Team, The National Archives, Kew, London TW9 4DU, or email: psi@nationalarchives.gov.uk.
Where we have identified any third party copyright information you will need to obtain permission from the copyright holders concerned.
This publication is available at https://www.gov.uk/government/statistics/statutory-homelessness-in-england-october-to-december-2022/statutory-homelessness-in-england-technical-note
1. Data collection
Local housing authorities report their homelessness activities under Part 7 of the Housing Act 1996 to DLUHC by completing the quarterly Homelessness Case Level Information Collection (H-CLIC) statistical return. H-CLIC is an upload of statutory homelessness cases and the authorities’ activities within the legislative framework. This collection was introduced in April 2018 alongside significant changes in the homelessness legislation, which introduced new homelessness duties through the implementation of the Homelessness Reduction Act (HRA). It replaced the previously collected P1E form.
At the start of the transition from P1E to H-CLIC, where accurate H-CLIC data was not available, data in the temporary accommodation and main duty sections was supplemented by additional data provided through the old P1E form.
-
Rates per 1,000 households have been calculated using the 2018-based household projections for 2022 produced by the Office for National Statistics. These were published on 29 June 2020 and are available in Table 406.
-
The national and regional figures in the text and accompanying tables are presented rounded to the nearest 10 households or applicants. Local authority figures provided in the live tables are unrounded. Local authority to regional and regional to national sum totals may not match due to rounding.
-
In tables containing information considered sensitive, breakdowns have been suppressed at local authority, regional or national level to protect the identity of individuals. Suppressed data is clearly marked in the live tables and may mean the sum of local authority data provides a lower figure than the regional or national rounded totals.
The three groups we used to impute data are: London boroughs, unitaries combined with metropolitan districts and shire districts. Where local authorities have provided missing or incomplete breakdowns, the authorities’ previously submitted data is used to estimate the values using a multiplier based on previous proportional representation within their respective weighting group.
Starting in April to June 2020, we have used a new case-level weighting method to estimate levels of missing data. Similar to the earlier imputation method, the weighting process estimates the amount of missing data by observing quarter-on-quarter change in the groups of local authorities. However, instead of imputations being calculated and applied to each table at the summary level, the weights are calculated and applied at household-level within the H-CLIC dataset. This means that households have differing influence on the weighted national and regional totals depending on the amount of data estimated to be missing from their weighting group.
Weighting groups are defined across three dimensions to ensure that the estimates for missing cases are produced by weighting similar types of households.
-
Household type: The cases in the H-CLIC dataset are grouped by households with children and those without children, due to the different circumstances these two household types tend to approach local authorities.
-
Duty context: In the assessments data, households are classified by initial duty owed (i.e. prevention / relief / no duty) while the outcomes data is split by households whose prevention or relief duty had ended during the quarter. In the main duty data, households are classified by whether they are owed a main duty, and outcomes data is classified according to successful and other outcomes.
-
Temporary Accommodation (TA): For temporary accommodation, households are classified by the type of temporary accommodation they are in.
-
Regional / local authority area classification: The cases are defined by the type of local authority in which they are situated. These local authority groupings are based on the 2011 area classification published by the ONS which takes into account their demographic and economic characteristics. The classifications are not regionally distinct so we have further split and consolidated the original ONS groups into regional supergroups. This ensures that a) weighted cases can only influence the totals for their own region, and b) each weighting group contains enough local authorities to provide non-extreme weights even when multiple authorities from a single group fail to provide data.
These controls in the weighting calculation mean that, for example, an urban local authority in the North West which normally reports many homeless single households (but failed to submit this quarter) would result in weights that specifically correct the shortfall in homeless single households, using data provided by other urban local authorities in the North West.
A combination of high weight with high ‘impact’ (i.e. absolute difference between projected and reported totals) indicates a weighting group with significant missing data. Issues would most likely arise from local authorities that fail to report data for many quarters in succession, or where a weighting group has a large number of missing local authorities (or those that are missing make up a significant proportion of the group’s caseload).
2. Data quality
All H-CLIC returns are submitted by local housing authorities and undergo thorough validation and cross-checking. Late returns are chased to ensure overall response is as complete and accurate as possible. Local authorities are given a minimum of six weeks to submit accurate data and are reminded when they fail to submit. Any missing returns after this period are omitted and imputed in the release. These local authorities are referenced in the imputations and weighting section and are highlighted in the associated local authority level tables.
Diagram 1: Data submission process
Diagram 1 shows the data collection and submission, QA checks and feedback process between local authorities and DLUHC.
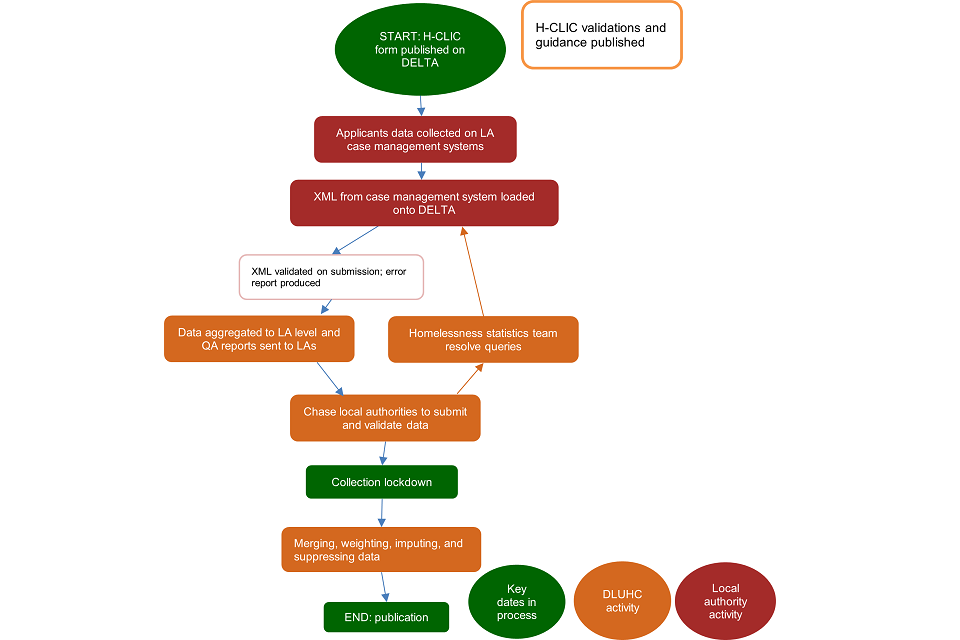
Case data is reported by local authorities onto DLUHC’s data collection platform, DELTA. On upload a case level error report is instantly available to authorities by case ID. This allows local authorities to fix any case issues in their own systems. During the collection period and following the deadline, a summary level data QA report is made available on DELTA to local authorities. This report contains some of the metrics we plan to publish in the release.
Any inconsistencies with the previous quarter or anomalous use of certain fields are flagged in these reports and local authorities can mark metrics as approved or not approved for publication. DLUHC also provides quality assurance dashboards to local authorities to investigate their data further and locate any erroneous case IDs. Local authorities can fix their data and/or report any system issues to their software suppliers. The QA report and dashboards are updated once a week with any new data being submitted by close the previous working day; towards the end of a collection window, the report and dashboards are updated twice a week.
After the data returns phase is complete, DLUHC collates the information and performs a final quality assurance, where any unexplained or unusual local authority level changes are further examined by the authority. The response rate for local authorities submitting both HCLIC data and QA reports is 80% for October to December 2022.
Any issues raised by local authorities are logged throughout the process. System based issues are identified and are then raised with the software supplier. Conversations with suppliers then lead to improvements in guidance, corrections to DLUHC collection or to the software supplier’s reporting systems, a combination of all of these may be required to resolve the issue.
Before April 2021, local authorities were able to provide temporary accommodation returns through P1E as well as H-CLIC. Similarly, main duty data could also be provided via P1E or H-CLIC or both in all quarters except the April to June 2019 release. This flexibility was intended to ensure the best data quality was achieved during the transition. Additional steps were taken for these authorities to ensure no duplication or omission of data occurred. The P1E form was discontinued from the April to June 2021 collection.
Chart 1: Percentage of England total by temporary accommodation submission method
Chart 1 shows the percentage of total submissions in England according to the submission method used for data on temporary accommodation.

The proportion of local authorities providing case-level temporary accommodation data through H-CLIC has risen from 23% in Q2 2018 to 94% in the latest collection. This is largely due to fewer local authorities being unable to report legacy (pre-HRA) cases in temporary accommodation. Pre-HRA cases are typically stored on a separate software system that cannot export data in H-CLIC format.
Chart 2: Percentage of local authorities by temporary accommodation submission method
Chart 2 shows the percentage of local authorities according to the submission method used by each local authority for data on temporary accommodation.

We are working with local authorities to overcome technical difficulties in moving temporary accommodation reporting to an accurate, case-level data return on H-CLIC. This is being achieved through working closely with local authorities alongside DLUHC’s Homelessness Advice and Support Team to understand the barriers to submitting accurate data and to understand what plans are already in place for moving the data.
Map 1: Temporary accommodation submission methods in England
Map 1 shows temporary accommodation submission methods in England.^[This refers to submissions deemed accurate by DLUHC]

2.1 QA principles, standards and checks applied by data supplier
Most software suppliers have incorporated the H-CLIC reporting requirements into their case management systems. Software suppliers and local authorities were invited to test their XML extracts from May to June 2018. H-CLIC is an XML data submission, uploaded to DLUHC’s DELTA data collection system. The DELTA system checks the format of H-CLIC files, and the fields in each case are checked using schema validation tool. The schema checks are XPath coded scripts that test the validity of the data structure. Once the data has been uploaded onto DELTA, the values submitted in each case are checked for consistency. Any omitted fields or inconsistent reporting variables are validated using a validation report that is shared immediately with the authority on the DELTA website. Local authorities reporting this data are required to check and correct for inconsistencies in the data. DLUHC welcome feedback on any issues from these processes and are working with authorities to continually improve the process.
Additionally, there are a small number of local authorities who have not adopted a H-CLIC compatible reporting requirement, who manually fill out case level forms. Their data is less reliable, and we are working with those affected to adopt better systems in the future. Data for these local authorities are more likely to be omitted from the published data.
2.2 Producer’s QA investigations and documentation
Case level validations in DELTA are explained with information flags marked against the reportable fields and text validation messages that help local authorities identify the cause of their mistakes. Where a combination of errors are flagged, a validations glossary produced by DLUHC can be used to help local authorities understand and correct for these errors.
Many software suppliers have incorporated DLUHC’s schematron, a validation script that runs against the xml file, into local authority systems. The schematron enables local authorities to identify and fix errors at the point of collection. This allows the administrative officers who collect the information to resolve any issues at the source.
After local authorities complete their H-CLIC submission on DELTA, DLUHC make quality assurance reports available on DELTA. The reports show summary headline figures for the current quarter’s data, along with the previous quarter and the same quarter the previous year. They check for any significant changes against similar fields collected in the previous quarter and highlight any possible issues. These quality assurance reports aggregate activity totals for the homelessness duties owed, outcomes, temporary accommodation and several other breakdowns. Local authorities are asked to check these quality reports against their internal reports to confirm if the data is correct. Any large absolute or proportional changes or data artefacts are flagged to authorities with an expectation that these issues would be explained or case data revised to correct for known mistakes.
During the quality assurance process, a number of authorities could raise concerns about their submission. DLUHC’s Homelessness Statistics Team would then work with these authorities and their software suppliers to resolve any incorrectly formatted data, data omissions or misunderstanding of the data requirement. Lessons are learned throughout the process and guidance documentation, new documentation and test sites are all made available to continually improve the quality of all local authority submissions. This quality assurance process has significantly improved the data in this release.
3. Data limitations
Detailed information on data coverage and limitation per H-CLIC section can be found on the front page of each of the detailed local authority level tables. The information for the latest quarter can also be found in the imputations and weightings section.
Time series
As discussed in the comparability section of the release, time series may show trends in the data which are either not directly comparable or may change with time due to data revisions from data quality improvements.
Main duty comparisons before and after the HRA 2017
Although the definition of main duty is similar both pre- and post-HRA, any inferences about trends in main duty acceptances should be made with caution. This is due to changes under the HRA in April 2018 that introduced a minimum 56 day relief duty period for all households irrespective of priority need. This has meant that from April 2018, no new cases of main duty assessments could take place until after at least 56 days. It is advised that no strong conclusions are drawn from 2018-19 data due to this minimum 56 day lag following the introduction of the HRA. In addition, post-HRA households that are only threatened with homelessness are no longer owed a main duty.
We also recommend comparing 2019-20 main duty acceptance data with 2017-18 or earlier. The fall in main duty acceptances following the introduction of the HRA was expected as priority need households could be helped out of homelessness under a prevention or relief duty. A main duty acceptance data comparison would therefore reflect whether prevention and relief duties are effective in preventing and relieving homelessness for households with priority need.
Initial assessments
Initial assessments include information on new prevention and relief duties as assessed at the point of application. Applicants who were assessed as being owed a prevention duty at their initial assessment and were subsequently owed a relief duty are only reported as owed a prevention duty in the initial assessment section.
As local authorities adjusted to the new system of collecting data in 2018-19, figures may have been misreported. For example, some local authorities have previously reported a large proportion of ‘not threatened with homelessness’ cases, incorrectly logging ‘advice only’ cases that were never formally issued a homeless decision under this category. These authorities have worked to correct these mistakes, and data in recent and future quarters may show a decrease in these categories due to improvements in data quality.
Some local authorities may also be reporting upstream preventions as prevention duties lasting only one day, which may represent some over-reporting of prevention duties.
Prevention and relief duties
Feedback from local authorities who have provided data suggest that prevention and relief activities may have been underreported in April to June 2018, this was caused by issues regarding their new software extracting and uploading such data. Many local authorities and software suppliers have since corrected these issues. Note that some of the trends from 2018-19 may be affected by these data corrections.
As local authorities have adjusted to the HRA, DLUHC’s Homelessness Advisory and Support Team have been using the H-CLIC data to identify how local authorities have adopted this legislation, checking fields are being applied correctly where certain categories are higher than expected; for instance on the categories refusal to cooperate, and prevention duty ends after 56 days with no further action. Further improvements to figures are expected in future quarters.
Main duty
Many main duty outcomes and a small number of main duty decisions refer to legacy cases – households whose duty began prior to the introduction of the HRA, and therefore did not receive prevention or relief duties. Reviews, reapplication duties, and reassessments, as well and the end of duties, are still occurring for these households.
Temporary accommodation
As part of the initial consultation to move from a P1E summary return to H-CLIC case level submissions, local authorities have identified potential issues linking their homeless cases to the associated temporary accommodation placements. To assist local authorities, a transition period was offered where local authorities could separately report temporary accommodation data through the old P1E return as an alternative or addition to H-CLIC. It was up to local authorities to choose the most suitable option. Those local authorities who procured a new software system typically reported via both returns. Whilst those who updated from existing software tended to return P1E or H-CLIC. The transition period ended in April 2021, and the P1E was discontinued from the April to June 2021 collection.
All submissions are reviewed, and where large changes have occurred between quarters local authorities are approached for an explanation. If no explanation of the change could be provided then this data is rejected and imputed figures are used instead for the England total. These local authorities can be identified in the live tables because they are highlighted yellow and their imputed figures are not published to ensure these are not misused.
As part of the QA process local authorities were asked to verify their households in temporary accommodation. There were a number of inconsistencies identified in the way local authorities reported these. Some local authorities omitted anyone in temporary accommodation whose main duty had been discharged and other local authorities did not, and the method for omitting data varied by local authority.
3.1 Imputations and weightings
Missing values are imputed to ensure national and regional headline figures are representative. Since July to September 2019, all local authorities with missing data have provided data for at least one previous quarter, and missing values can therefore be estimated via imputation to include in headline totals. Prior to July to September 2019, where authorities had failed to submit any H-CLIC data for the Act since April 2018, imputation was not possible and these authorities were excluded from previous totals; the national totals published for this period were therefore initially an underestimate.
From the January to March 2020 release we have applied reverse imputation (the same method as outlined in the data collection section but in reverse) for those local authorities that failed to submit H-CLIC data prior to July to September 2019. This means that national headline figures have been updated and are now more representative. Figures for July to September 2019 and October to December 2019 have also been re-imputed to correct for any trends caused by local authorities that previously could not be imputed. These revised figures are available in the time series tables within the live tables. Figures previously published in the live tables remain unchanged.
For households in temporary accommodation, missing values were reduced by allowing local authorities with a plan to move systems to complete a P1E as well as a H-CLIC return. We also allowed main duty data to be submitted via P1E or H-CLIC in all quarters except the April to June 2019 data collection. From April 2021, all local authorities are expected to provide data via H-CLIC as the P1E was discontinued.
For all submissions, the response rate for the latest quarter was 300 out of 309 local authorities (97.1% response rate).
Initial assessment
20 local authorities were unable to provide initial assessment information. National and regional totals were weighted based on previous trends for these missing authorities: Boston, Brent, Cambridge, Charnwood, Dudley, East Lindsey, East Riding of Yorkshire, Enfield, Halton, Havant, Hounslow, Kingston upon Hull, Newham, North Lincolnshire, Preston, Rugby, Slough, Stevenage, Welwyn Hatfield and Wolverhampton who did not provide accurate data this quarter but have provided figures in previous quarters. They are highlighted and referenced in the live tables, and are estimated to comprise of 8.6% of total assessments in England. There may be seasonal trends in this data, which is not currently adjusted.
Prevention and relief outcomes
Several local authorities have reported issues collecting or reporting accurately on prevention and relief duty outcomes. 17 out of 309 local authorities did not provide this information, and therefore the corresponding regional totals were weighted. The missing authorities were: Boston, Brent, Cambridge, Dudley, East Lindsey, East Riding of Yorkshire, Enfield, Halton, Havant, Hounslow, Milton Keynes, Newham, North Lincolnshire, Plymouth, Preston, Rugby and Wolverhampton who did not provide duty end data this quarter but have provided figures in previous quarters. These are estimated to comprise of 6.9% of prevention outcomes and 9.2% of relief outcomes in England.
Main duty
Several local authorities have reported issues collecting or reporting accurately on main duty decisions. Users of one of the main software systems have previously informed us that this information is not always extracted for a case and has resulted in some underreporting or missing information. 12 out of 309 local authorities either provided inaccurate data or did not provide this information. The authorities whose figures were estimated were: Boston, Dudley, East Lindsey, East Riding of Yorkshire, Halton, Havant, Hounslow, Preston, Redbridge, Rugby, Tower Hamlets and Waltham Forest. These are estimated to comprise of 3.8% of total main duty decisions in England.
Some local authorities have also struggled to provide accurate information on main duties ended. As with temporary accommodation this information mostly relates to cases assessed before the introduction of the 2017 HRA. 12 out of 309 local authorities did not provide this information. The local authorities whose figures were estimated were: Dudley, East Lindsey, East Riding of Yorkshire, Enfield, Halton, Hounslow, Luton, Manchester, Merton, Preston, Rugby and Tower Hamlets who did not provide accurate data this quarter but have provided figures in previous quarters. These are estimated to comprise of 9.9% of main duty outcomes in England. Some local authorities have identified issues with underreporting. As such, the England level figure is likely to be underreported so should be used with caution.
Temporary accommodation
Complete temporary accommodation (TA) data was provided by 289 (93.5%) local authorities. 20 local authorities either provided no temporary accommodation figures or their figures were incomplete and could not be used. Figures for these households have been imputed. The authorities who did not provide this information were Bexley, Boston, Brent, Brighton & Hove, Cambridge, Dudley, East Lindsey, East Riding of Yorkshire, Enfield, Halton, Havant, Hounslow, Kensington & Chelsea, Lambeth, Leicester, Newham, North Warwickshire, Preston, Torridge and Tower Hamlets. These are estimated to comprise of 20.7% of total households in temporary accommodation.
For further information on how official statistics are produced using sound methods and assured quality, please consult the department’s statistical quality guidelines.
4. Data dashboards
We publish a range of data dashboards to help users interact and navigate with the data we collect.
4.1 Statutory homelessness data dashboard
The statutory homelessness data dashboard is based on quarterly data from the live tables and provides a visual representation of the data in the tables. The dashboard allows users to quickly view the information in maps and graphs, facilitating spacial comparisons of the data. Time-series information is also available for users from January 2020. In-depth guidance on how to use the dashboard can be accessed by clicking the guidance button on the front page of the dashboard.
4.2 H-CLIC performance dashboard
The H-CLIC performance dashboard provides a high level summary of homelessness figures for each local authority in England and is used to aid conversations around improving data quality with data providers. It shows performance across a handful of key measures, allowing for comparison between authorities. It also includes a Red Amber Green (RAG) rating for the broader quality of submission of each authority. As well as showing whether the local authority provided data which was accurate enough to publish without the need for imputation and weighting, the dashboard provides metrics on timeliness of the data upload, the proportion of cases submitted with errors, how well outcomes are reported against assessments, and whether the local authority has provided data which is accurate enough for publication. More information on each measure can be found within the dashboard.
RAG ratings for performance dashboard
If any of the measures for data quality are red or amber, the RAG rating for the local authority will be red or amber respectively.
For the percentage of those owed a duty being accepted at prevention stage, we consider the number of initial decisions made during the quarter and what percentage of these were prevention duties that were accepted.
A local authority is green if they accepted over 58.4% of their duties at the prevention stage, amber if they accepted between 37.8% and 58.4%, and red if they accepted below 37.8%. The RAG percentages are derived from calculating this metric for each local authority and then using the upper (58.4%) and lower quartiles (37.8%) of the Q4 2022 data as boundaries.
For percentage of prevention and relief duties owed that ended in accommodation secured, we look at the number of total preventions and reliefs awarded during the quarter and what percentage of these outcomes ended with secured accommodation for over six months.
A local authority is green if they secured accommodations for over 57.8% of their duties owed, amber if they secured between 37.0% and 57.8%, and red if they secured below 37.0%. The RAG percentages are derived from calculating this metric for each local authority and then using the upper and lower quartiles of the Q4 2022 data as boundaries.
For percentage of duties owed that were prevented, we look at the number of initial decisions made during the quarter and what percentage of these duties ended at prevention stage with accommodation being secured for longer than six months.
A local authority is green if they prevented over 38.9% of their duties, amber if they prevented between 17.5% and 38.9%, and red if they prevented less than 17.5%. The RAG percentages are derived from calculating this metric for each local authority and then using the upper and lower quartiles of the Q4 2022 data as boundaries.
For percentage of main duties owed that ended in accommodation secured, we look at the total number of main duties that ended and calculate the percentage of those that ended with accommodation secured.
A local authority will be green if they secured accommodation for over 92.1% of their main duties owed, amber if they secured between 66.7% and 92.1% and red if they secured below 66.7%. The RAG percentages are derived from calculating this metric for each local authority and then using the upper and lower quartiles of the Q4 2022 data as boundaries.
These descriptions are also provided in the H-CLIC performance dashboard.
4.3 Infographics
In addition to the live tables and data dashboards, we publish an infographic with a ‘things you need to know’ sheet to highlight key points of each quarterly release.
5. Upcoming developments
We are also looking to update to update the data tables to reflect changes to the data specification made in April 2021, including the addition and removal of various options that were implemented to make the H-CLIC collection more flexible, and to improve data quality. For instance, by minimising the use of categories such as ‘Other’ that are known to be overused.
We would also welcome any feedback on the development of our products by completing this user engagement survey.
6. Definitions
Prevention duty: Local authorities may deliver their prevention duty through any activities aimed at preventing a household threatened with homelessness within 56 days from becoming homeless. This would involve activities to enable an applicant to remain in their current home or finding them alternative accommodation. The duty lasts for up to 56 days but may be extended if the local authority is continuing with efforts to prevent homelessness.
Relief duty: The relief duty is owed to households that are already homeless on approaching a local authority, and require help to secure settled accommodation. The duty lasts 56 days and can only be extended by a local authority if the household is not owed the main homelessness duty.
Main duty: The ‘main’ homelessness duty describes the duty a local authority has towards an applicant who is unintentionally homeless, eligible for assistance and has priority need. This definition is largely unchanged by the 2017 HRA. However, households are now only owed a main duty if they did not secure accommodation in the prevention or relief stage, and the main duty is not owed to those ‘threatened with homelessness’. In addition, a minimum of 56 days of assistance must have elapsed from when a household approached the local authority on being owed a main duty. This means that households who may previously have been accepted as owed a main duty may now have secured accommodation through prevention or relief duties during this period, and therefore are no longer owed a main duty.
Prevention and relief information collected by H-CLIC cover new legal duties introduced from the 3 April 2018, so these are not comparable to the activity information collected previously. The definition of main duty acceptances and temporary accommodation remain the same, however due to the new steps local authorities must take with households prior to households being accepted as owed a main duty, any inferences about trends in main duty acceptances before and after the HRA 2017 should be made with caution.
Duty to refer: Since 1st October 2018, duty to refer has required specified public bodies to refer, with consent, users of their service who they think may be homeless or be threatened with homelessness to a local housing authority of the individual’s choice.
Assured Shorthold Tenancy: An Assured Shorthold Tenancy is a fixed term letting from a private rented landlord. Typical tenancies last 1 or 2 years.
Eligible households: Eligible households are those that meet eligibility criteria, which broadly concern UK immigration status and whether the household is habitually resident in the UK. Eligibility is an extremely complex aspect of the legislation, and more information is available in Chapter 7 of the Homelessness Code of Guidance.
The Homelessness Reduction Act (HRA) 2017: This act commenced on 3rd April 2018, and amended Part 7 of the Housing Act 1996 (“the 1996 Act”), and the Homelessness (Suitability of Accommodation) (England) Order 2012. It placed duties on local housing authorities to intervene at earlier stages to prevent homelessness and to take reasonable steps to help those who become homeless to secure accommodation. The HRA provisions require local housing authorities to provide homelessness advice services to all residents in their area and expands the categories of people who they have to help to find accommodation. The requirements of the Homelessness Reduction Act 2017 is available in the Homelessness code of guidance.
Intentionally homeless: Households who have lost accommodation as a result of actions that they took or failed to take. This may include households who have given up suitable accommodation without good reason or have been evicted due to rent arrears or other breach of tenancy conditions.
Threatened with homelessness: Following the introduction of the HRA, an applicant is threatened with homelessness if it is likely they will become homeless within 56 days, or if they have been served with a valid Section 21 notice to end an Assured Shorthold Tenancy which expires within 56 days. Prior to the introduction of the HRA an applicant was accepted as owed duties if they were threatened with homelessness within 28 days.
Hidden homelessness: Hidden homelessness includes people who live in overcrowded, insecure or uninhabitable conditions. Many people in this group do not present themselves to the local authority for help and are sometimes unaware they would be considered statutory homeless. For this reason, the group are called hidden homeless with an unknown proportion appearing in Official Statistics. This makes quantifying the number of hidden homelessness difficult.
Households for whom a duty is owed, but no accommodation has been secured: These are households who have been accepted as being owed a homelessness accommodation duty and for whom arrangements have been made for them, with consent, to remain in their existing accommodation (or to make their own arrangements) for the immediate future. This was previously referred to as “Homeless at Home”. Before Q2 2005, figures were also collected on those who could potentially be in this category but whose application was still under consideration pending a decision.
Main homelessness duty acceptance: A household who is accepted by the local authority as eligible for assistance, unintentionally homeless and falling within a priority need group (as defined by chapter 8 of the homelessness code of guidance) during the quarter are referred to as ‘main duty acceptances’. The main homelessness duty is to secure accommodation until such time as the duty ends, usually through an offer of settled accommodation.
P1E: P1E was a quarterly local authority return, used to report on statutory homelessness in England until March 2018. The purpose of the quarterly P1E forms was to collect summary data from English local housing authorities on their responsibilities under homelessness legislation. It also included a section on homelessness prevention and relief. Information from these returns has been published in the statutory homelessness statistical release.
Priority need: The legislation states that some categories of applicants have a priority need for accommodation if homeless, whereas others do not. Applicants who have priority need include households with dependent children or a pregnant woman; those who are homeless due to fire, flood or other emergency; those who are particularly vulnerable due to ill health, disability or old age; those having been in custody or care; or those who have become homeless due to violence or the threat of violence. A full explanation of priority need groups and assessments is contained in Chapter 8 of the Homelessness Code of Guidance.
Rough sleeping: People sleeping in the open air (such as on the streets, in tents, doorways, parks, bus shelters or encampments) or other places not designed for habitation (such as stairwells, barns, sheds, car parks, cars, derelict boats, stations, or ‘bashes’ which are makeshift shelters, often comprised of cardboard boxes). Rough sleepers in this publication may have slept rough one night or across several nights.
-
Rough sleeping at the time of local authority approach: Rough sleepers are defined as those who were, in the judgement of the assessor, rough sleeping when they approached a local authority for help.
-
History of rough sleeping: This is a support need based on a history of sleeping rough and does not mean that the household was sleeping rough at the time of approach to the local authority.
Section 21 notice: A Section 21 notice is the form a landlord must give a tenant to start the process to end an assured shorthold tenancy. This is recorded alongside initial assessments.
Self-contained accommodation: This includes all temporary accommodation where the household has sole use of kitchen and bathroom facilities, including property held by local housing authorities, registered social landlords and private sector landlords. A distinction is made between this type of accommodation and accommodation where such facilities are shared with other households (i.e. bed and breakfast, hostels and women’s refuges).
Single households: A term used for households without children, which will include couples and households with two or more adults.
Single adult households: Single adult households are a subset of single households, where the household comprises just one individual adult.
Temporary accommodation: Temporary accommodation is the term used to describe accommodation secured by a local housing authority under their statutory homelessness functions. The majority of households in temporary accommodation have been placed under the main homelessness duty, but temporary accommodation is also provided during the relief stage to households that the local authority has reason to believe may have priority need, or is provided on an interim basis in other circumstances such as pending the outcome of a review on a homelessness decision.
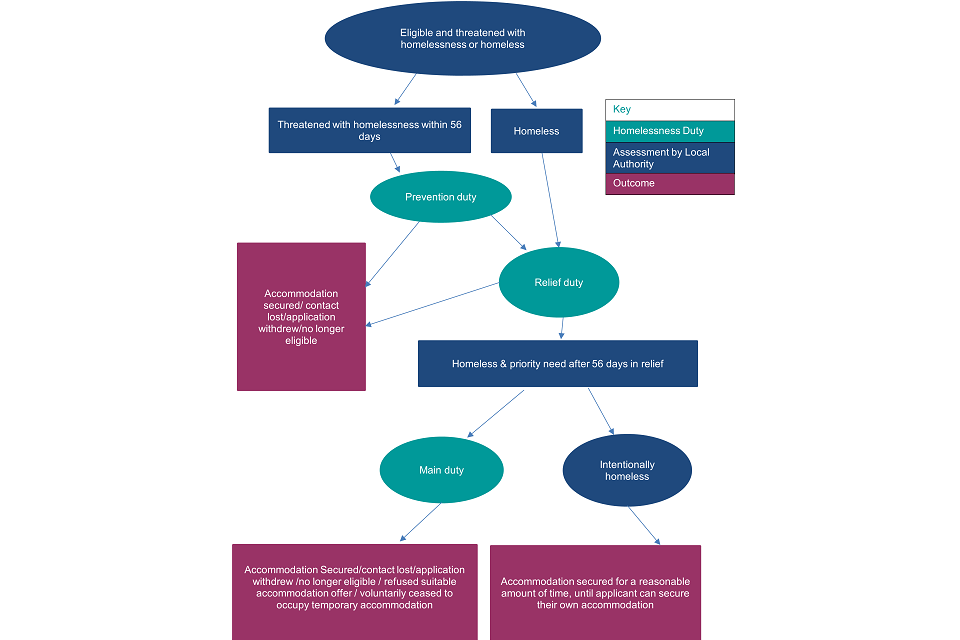
Diagram 2: Homelessness duties and outcomes flow
Diagram 2 shows the flow from homelessness duties to outcomes.
7. Revision policy
The department’s revision policy has been developed in accordance with the UK Statistics Authority’s Code of Practice for Statistics. There are two types of revisions that the policy covers:
7.1 Scheduled revisions
Data published for the latest quarter is provisional and subject to revision at the following quarter and at the end of the financial year as part of the annual publication. Local authorities may add new homelessness duty cases late, which are copied back to previous quarters where they should have been first reported, or revisions can be made to previous reported statistics if data submissions are deemed later on to be accurate or inaccurate. Most changes between provisional and revised data fluctuate around 1.0% at the England level, with main duty data seeing slightly larger fluctuations at around 2.0%. These changes will not be marked with an R in the local authority dataset because these are likely to be extensive across all local authorities. However, the time series dataset will be marked with a P for the latest quarter and an R, where applicable, for previous quarters where changes have been made.
7.2 Non-scheduled revisions
Where local authorities spot a mistake in their own data that affects the national story, such as changing a national trend or total by 3.0% or more or reversing it, these changes will be incorporated into the live tables and published statistics release as soon as possible. These changes will not be pre-announced on the release calendar. Users will be informed of the change by a change to the title of the document, adding a ‘(revised)’ suffix both on the webpage and in the document itself. An explanation of the changes will be included in the updated publication and local authority level changes will be marked with an ‘R’. Smaller changes at the local authority level are routinely expected as part of the previous quarter revisions in future publications. Where a local authority notes a minor correction to their data, these will be updated in the next release along with the other routine amendments.
If DLUHC spot a mistake in the numbers or trends referred to in this release or live tables, these will be updated as soon as possible. Users will be informed of the change by a change to the title of the document, adding a ‘(revised)’ suffix both on the webpage and in the document itself. An explanation of the changes will be included in the updated publication and local authority level changes will be marked with an ‘R’.
8. Other information
Some data collected via P1E is broadly comparable to data collected via H-CLIC. The new method of reporting means initially any suggestions of recent trends about households in temporary accommodation should be made with caution.
For prevention and relief information, data collected by H-CLIC cover new legal duties introduced from 3 April 2018, these are not comparable to the activity information collected in P1E.
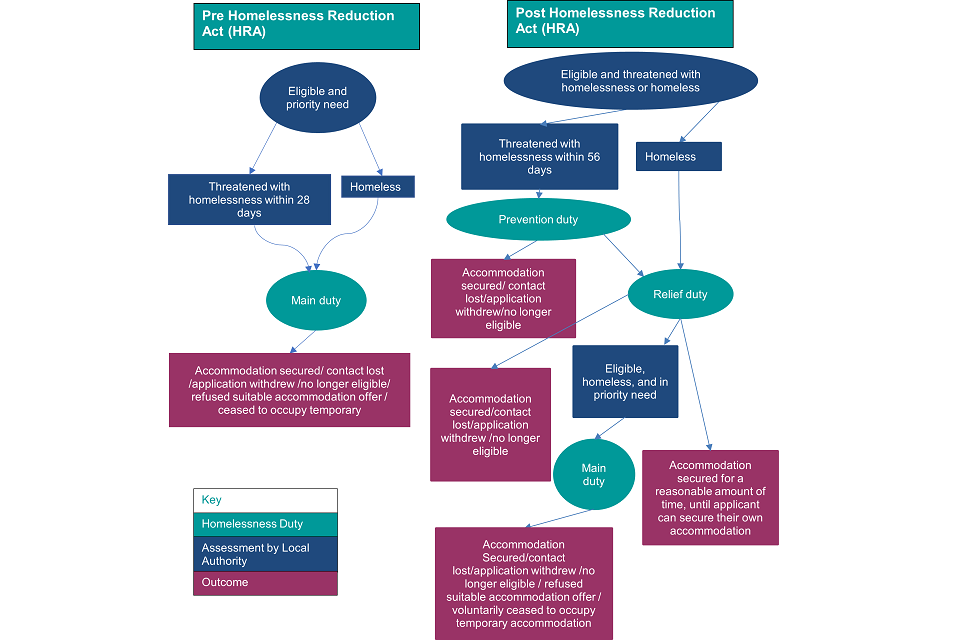
Diagram 3: Comparability between the H-CLIC case level collection and the previous P1E summary returns
Diagram 3 compares the case level data collection process for H-CLIC returns to P1E summary returns.
Prevention and relief data in this release cannot be compared with the prevention and relief activity based on the P1E returns. Through the P1E local authorities were able to report all cases where homelessness was prevented, whether or not a homelessness application had been taken. Data submissions included, for example, households who had been provided with assistance through a third-party organisation funded by the local authority to provide services that helped to prevent homelessness, such as money advice services. Prevention data reported in this release however are based on case level information from homelessness applications and should only include data on prevention activity when a homelessness application has been made. Relief was also previously discretionary to those not owed a main duty.
The definition of main duty acceptances remains the same, but the introduction of the new prevention and relief duties mean that there are now steps local authorities take with households before they reach a main duty. This means that it no longer includes households threatened with homelessness within 28 days. Any inferences about trends in main duty acceptances pre-HRA compared to post-HRA should be made with caution.
Temporary accommodation figures remain the most consistent with historical data; the criteria for temporary accommodation have not changed, although an increase in households without children has been observed. We are working with local authorities to understand this increase but it may be due to the number of households being offered temporary accommodation whilst their circumstances and needs are assessed rather than those who are priority need and owed a S193(2) TA duty.
H-CLIC is a household case level data collection and contains new information not collected in the P1E return. H-CLIC includes information on all individuals within the household and not just the main applicant.
8.1 Uses of the data
These data form the basis of evidence on homelessness duties. Ministers and officials in the Department for Levelling Up, Housing and Communities use this information to understand the scale and causes of homelessness and to consider possible policy responses. The data are used to ensure democratic accountability in answers to Parliamentary questions, ministerial correspondence, Freedom of Information Act cases and queries from the public. They are used by DLUHC Ministers to help determine local authority performance for the 2017 Homelessness Reduction Act. This includes assessing the performance of OGDs under the duty to refer. They are also used to allocate resources, monitor performance and to support bids for funding from the Treasury.
Other government departments also use the statistics, including DWP (monitoring those in temporary accommodation in receipt of housing benefit), DHSC (Public Health Outcomes Framework), DfE (Child poverty needs assessment toolkit for local authorities) and Defra (sustainable development indicators). Local housing authorities are both providers and users of the statistics and use the data extensively to plan services, allocate resources, monitor performance and benchmark against other authorities. The voluntary sector also uses the statistics to monitor and evaluate housing policy and for campaigning and fundraising purposes. These statistics, along with our annual rough sleeping count, regularly feature in reports from Homelesslink, Crisis, Shelter and other homeless organisations.
8.2 Related statistics
Rough sleeping
DLUHC conduct an annual single night snapshot of rough sleeping each autumn. This count/estimate is used to track annual changes in the population. The number of people owed a homelessness duty will include some but not all people in this rough sleeping count.
A further source of data on rough sleeping is from the Combined Homelessness and Information Network (CHAIN). CHAIN is a multi-agency database recording information about people seen rough sleeping by outreach teams in London. CHAIN is managed by St Mungo’s, a London-based homelessness charity, and is used by organisations working with people sleeping rough in London. Information is recorded onto the CHAIN database by people who work directly with people sleeping rough in London (e.g. workers in outreach teams, day centres, hostels and resettlement teams). CHAIN does not cover ‘hidden homeless’ groups, such as those who are squatting or staying in inaccessible locations to outreach workers.
There will be some overlap between rough sleeping households in this release and the rough sleepers in the annual autumn count estimates and in the CHAIN dataset, the extent of this overlap is unknown and is likely to differ at local authority level.
The ONS has also published a summary of initiative across government to improve statistics on homelessness and rough sleeping.
Support for people sleeping rough survey data
DLUHC have published management information about support for people sleeping rough as part of the range of extra support that helped to protect vulnerable people during the COVID-19 pandemic.
Hidden homelessness
DLUHC produces other statistics releases that can to build up the wider homelessness picture including hidden homeless. The English Housing Survey (EHS) is a national survey of people’s housing circumstances. This includes breakdowns on the additional adults in a household who wanted to rent or buy but could not afford to do so. As part of the EHS interview, households are asked some questions about all members of the household, including the circumstances of additional adults in the household such as grown-up children, nieces and nephews, adult siblings, or parents or grandparents who might otherwise be living elsewhere. There are many possible reasons that additional adults might be living as part of a household, including caring responsibilities, being cared for by another household member, waiting to move into their own property, and simply preferring to live as part of the household. Data on concealed households, a subset of hidden homeless can be found in DLUHC’s English Housing Survey Statistics.
Social housing
The CORE social letting statistics provides information on the lettings of local authority and private registered provider properties in England and are collected on the CORE (COntinuous REcording of Lettings and Sales in Social Housing) system. The dataset includes information on whether lettings have been made to statutorily homeless households and homeless households not covered by a local authority’s statutory duty. A tool for analysing the dataset is also available for users.
Local authority expenditure on housing and homelessness
DHLUC publishes statistics on local authority revenue expenditure and financing in England. The RO4 return within the Revenue Outturn suite relates to housing services and includes information on local authorities’ expenditure on homelessness activities.
8.3 Devolved administration statistics
The devolved administrations are working with the ONS to produce guidance on the comparability of datasets across the UK. The House of Commons library have produced a guide to comparing homelessness legislations in the UK. ONS have also produced a document explaining how different definitions across the 4 counties of homelessness affect comparability of statistics.
The most recent statutory homelessness statistics for other UK countries are available on the following websites:
8.4 User engagement
The DHLUC homelessness statistics user forum was created to keep users up to date with latest developments in the department’s homelessness statistics. It contains H-CLIC newsletters for data providers and other guidance documents including a detailed H-CLIC data specification.
The H-CLIC data specification was first produced after consultation with charities, local authorities, local authority homelessness case management system software suppliers, other government departments and the Scottish Government (who moved to a case level reporting system in 2001). The final draft H-CLIC data requirement was shared with local authorities in August 2018. Feedback received on the data requirement meant that the draft was revised until January 2018. Since January 2018, minor amendments to the H-CLIC data requirement have been published as revisions on the homelessness statistics user forum website from January 2018. In the development and QA process DLUHC has been in continued contact with software suppliers and local authorities via phone, email and face to face meetings. Software suppliers are also continuously invited to discuss the further amendments to the data specification, as well as other planned developments. Local authorities are consulted on further developments to the collection and burdens of the process via the Central and Local Government Information Partnership Housing (CLIP-H) group.
Users are also encouraged to provide feedback on how homelessness statistics are used and how well they meet user needs. Comments on any issues relating to this statistical release are welcomed and encouraged. Responses should be addressed to homelessnessstats@levellingup.gov.uk.
The department has an engagement strategy to meet the needs of statistics users.
8.5 Pre-release access
Pre-release access to official statistics provides the details of officials who have access to the department’s quarterly statutory homelessness statistics up to 24 hours before official release.