Statistics on International Development: Provisional UK Aid Spend 2022
Published 5 April 2023

© Crown copyright 2023
This publication is licensed under the terms of the Open Government Licence v3.0 except where otherwise stated. To view this licence, visit nationalarchives.gov.uk/doc/open-government-licence/version/3 or write to the Information Policy Team, The National Archives, Kew, London TW9 4DU, or email: psi@nationalarchives.gov.uk.
Where we have identified any third party copyright information you will need to obtain permission from the copyright holders concerned.
This publication is available at https://www.gov.uk/government/statistics/statistics-on-international-development-provisional-uk-aid-spend-2022/statistics-on-international-development-provisional-uk-aid-spend-2022
1. About this release
1.1 What is ODA?
Official Development Assistance (ODA) is provided according to the standardised definitions and methodologies of the Organisation for Economic Cooperation and Development’s (OECD) Development Assistance Committee (DAC)[footnote 1]. ODA is defined as resource flows to developing countries and multilateral organisations, which are provided by official agencies (e.g. the UK Government) or their executive agencies, where each transaction meets the following requirements:
-
it is administered with the promotion of the economic development and welfare of developing countries as its main objective
-
it is concessional, including grants and soft loans[footnote 2]
1.2 Which countries are ODA eligible?
The list of countries eligible to receive ODA is set by the OECD Development Assistance Committee (DAC). Gross National Income (GNI) per capita data by the World Bank is used to define the coverage and boundaries of the list. The list of eligible countries includes all low, lower-middle and upper-middle income countries, except for those that are members of the G8 or the European Union (including countries with a firm accession date for EU membership). The DAC reviews the list every 3 years. Countries ‘graduate’ if they have surpassed the high-income GNI per capita threshold for the 3 consecutive years prior to a graduation year.
1.3 What is in this report?
This publication provides provisional statistics about the amount of Official Development Assistance (ODA) the UK provided in 2022. It also provides comparisons with 2021 spend. It includes:
-
total UK ODA as a proportion of GNI (the ODA:GNI ratio) - chapter 2
-
total UK ODA delivered through bilateral and multilateral channels - chapter 3
-
a breakdown of UK ODA by contributor - chapter 4
-
region-specific bilateral ODA broken down by region (FCDO only) - chapter 5
-
non-region specific bilateral ODA broken down by Type of Aid (FCDO only) - chapter 6
The figures presented in this publication are provisional and based on summary data with limited sector and geographical breakdowns. A final estimate of UK ODA, the ODA:GNI ratio and more detailed breakdowns of UK ODA will be published in autumn 2023 in ‘Statistics on International Development: Final UK Aid Spend 2022’ (Final SID)[footnote 3]. Figures may change between the provisional and final publications due to further quality assurance which is carried out on the more detailed data.
1.4 What else is included as part of Statistics on International Development?
All data tables included in this report are available to download in spreadsheet format. If you require any other data or information relating to this publication, or if you have any suggestions on how to improve the publication, please contact the statistics team at: statistics@fcdo.gov.uk. Further information on the technical terms, data sources, quality and processing of the statistics in this publication are found in Annexes 1-3 on the Statistics on International Development webpage (PDF, 268 KB).
Note to users
Source of FCDO ODA data
- during 2022, FCDO launched a new finance and HR system (‘Hera’) to serve the merged department. The majority of the FCDO’s ODA data for 2022 (60%) was gathered using the same process as previous years using former DFID’s Aries finance system. Further quality assurance of ODA data from Hera will be carried out as part of our normal processes in preparation for Final SID. See background notes 7.1 and 7.7 for more information
Changes to UK ODA expenditure
-
in 2020, the UK government announced a temporary reduction in ODA from 0.7% of GNI to 0.5% of GNI. The UK government committed to return to spending 0.7% as soon as the fiscal situation allows (see ‘Key Background’ section on page 7 for more information)
-
in the Autumn Statement 2022, the UK government announced additional ODA resources of £1 billion in 2022-23 and £1.5 billion in 2023-24, stating these funds were to help meet the significant and unanticipated costs incurred in supporting the people of Ukraine and Afghanistan to escape oppression and conflict and find refuge in the UK
-
please see section 2 for more information and background on the UK’s ODA as a proportion of GNI for 2022
Key Points[footnote 4]
-
the provisional ODA:GNI ratio for 2022 was 0.51%
-
in 2022, UK Official Development Assistance (ODA) was £12,774 million, an increase of £1,352 million (11.8% increase) on 2021. For more information see section 2
-
in 2022, UK bilateral ODA spend was £9,447 million while UK multilateral ODA was £3,327 million. For more information and definitions see section 3
-
in 2022, £3,686 million of ODA was in the form of in-donor refugee costs (28.9% of UK total ODA). This represents a £2,634 million increase compared to 2021 when its share of total ODA was 9.2%. The trends presented in this report reflect this increase
-
the Foreign, Commonwealth and Development Office (FCDO) spent £7,636 million in 2022 compared with £8,175 million in 2021 (a decrease of £539 million). The FCDO’s share of total UK ODA stood at 59.8% in 2022 compared to 71.6% in 2021
-
non-FCDO[footnote 5] spend on ODA in 2022 was £5,138 million, compared with £3,248 million in 2021 (an increase of £1,891 million). The non-FCDO share was 40.2%, up from 28.4% in 2020
-
statistics on bilateral ODA by geographic region are currently only available for FCDO spend. In 2022, total FCDO ODA attributed to a specific region decreased by 3.3% to £2,514 million. Africa and Asia received a reduced share of ODA, with the share to Africa decreasing from 52.3% to 44.1% (£1,109 million). Europe, the Americas and Pacific received an increase in ODA, with the volume of FCDO ODA to Europe increasing from £61 million to £310 million
2. The ODA:GNI Ratio
The ODA:GNI ratio presents the total amount of UK ODA as a proportion of its Gross National Income (GNI).
Key Background – the UK’s ODA:GNI ratio
From 2013 to 2020:
The ODA:GNI target of 0.7% was first agreed internationally in 1970 by the United Nations General Assembly. The UK government made a commitment to spend 0.7% of GNI on ODA from 2013. The International Development (Official Development Assistance Target) Act 2015 placed the commitment to spend 0.7% of GNI on ODA in UK law from 2015 and in each subsequent calendar year.
The UK spent 0.7% of UK GNI on ODA between 2013 to 2020.
2021 onwards:
In 2020, the UK government announced (note A) a temporary reduction to ODA spend from 0.7% to 0.5% of GNI, citing a severe economic downturn as a result of the COVID-19 pandemic (note B). The UK government committed to returning to spending 0.7% when the fiscal situation allowed.
In July 2021, the government set out the 2 key tests that must be met on a sustainable basis in the fiscal forecast produced by the Office for Budget Responsibility (OBR) before ODA spending can return to 0.7%:
-
First, when the UK government are not borrowing to support day-to-day spending.
-
Second, when underlying debt is falling.
Until the tests are met, the government’s plans assume ODA spending will be around 0.5% of GNI. Once ODA spending has returned to 0.7% of GNI, the tests will no longer apply and ODA spending will be maintained at 0.7% of GNI each year.
At the 2022 Autumn Statement (note C) the government updated that, reflecting a significant shock to the economy and public finances, the independent OBR’s forecasts showed that the principles for a return to 0.7% GNI confirmed by Parliament in 2021 had not been met for 2023/24. In accordance with the International Development (Official Development Assistance Target) Act 2015, the government will continue to review and confirm each year whether a return to spending 0.7% of GNI on ODA is possible.
Notes:
A: See the Government statement (PDF, 565 KB)
B: The International Development Act 2015 highlights possible circumstances where the 0.7 per cent target is not met and the accountability mechanisms that are triggered when the FCDO Annual Report is laid in parliament See Section 2(3) of the International Development Act: https://www.legislation.gov.uk/ukpga/2015/12/section/2/enacted
Table 1 shows that in 2022:
-
the ODA:GNI ratio was 0.51%. This shows that the UK has spent in line with the government’s decision to spend around 0.5% of Gross National Income on ODA in 2022
-
UK ODA was £12,774 million, an increase of £1,352 million (11.8%) on 2021. This was principally due to growth in the size of the economy in 2022
Table 1: UK GNI[footnote 6] Estimates, total UK ODA and ODA:GNI ratios; current prices (£ millions) 2021 to 2022 (provisional)
| 2021 | 2021 | 2021 | 2022 | 2022 | 2022 |
|---|---|---|---|---|---|
| GNI £ million | ODA £ million | ODA:GNI ratio | GNI £ million | ODA £ million | ODA:GNI ratio |
| 2,073,880 | 11,423 | 0.50 | 2,505,567 | 12,774 | 0.51 |
Long-term trends in UK ODA
Figure 1 shows the trend in UK ODA since 1970. Overall there has been a steady increase in the level of UK ODA since 1970, with a peak in 2005 and 2006 which was driven by high levels of debt relief, and a steep increase in 2013 when the UK Government first met the 0.7% ODA:GNI target.
A commitment to spend a percentage of UK GNI (a key economic measure) on ODA means that when GNI increases/decreases, in turn UK ODA will also increase/decrease. Between 2013 and 2019, UK ODA continued to increase in line with growth in the UK’s GNI and the 0.7% commitment. The relatively larger increase in the level of ODA in 2016 (by £1,242 million) reflects the switch to the European System of Accounts (ESA) 2010 methodology for measuring GNI and the consequent increase in UK ODA to meet the 0.7% ODA commitment on that basis.
The level of UK ODA fell between 2020 and 2021 due to the government’s decision to spend 0.5% of GNI on ODA compared to 0.7% but has increased from 2021 to 2022.
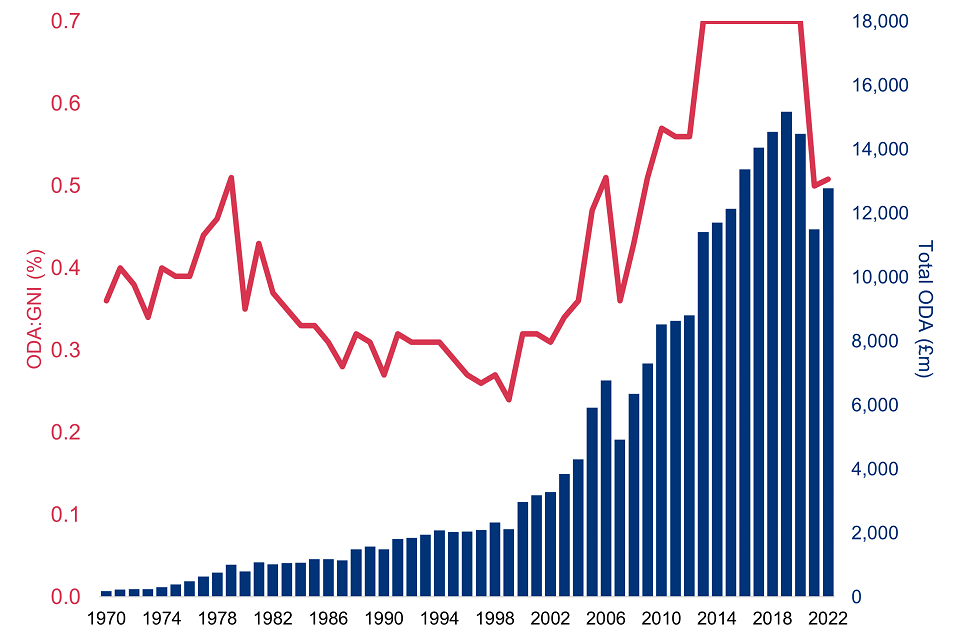
Figure 1: UK ODA levels (£ millions) and ODA:GNI ratios (%), 1970 to 2022
Figure 1 legend: The blue bars are the UK ODA spend from 1970 to 2022 (note the 2022 ODA figure is provisional), the pink line is the calculated ODA:GNI ratio from 1970 to 2022 and the grey dashed line is the 0.7% ODA:GNI target set by the United Nations General Assembly in 1970. From 2018 onwards, ODA has changed from being measured on a cash basis to being measured on a grant equivalent basis, following a decision taken by the DAC in 2014[footnote 7].
3. UK Bilateral and Multilateral ODA
There are 2 main channels of delivery for ODA: bilateral and multilateral.
-
bilateral ODA is earmarked spend. This means that the donor has specified where and what the ODA is spent on – this is usually ODA going to specific countries, regions or programmes. For example, delivering family planning services across Malawi through a Non-Government Organisation. Bilateral ODA also includes earmarked spend through multilaterals
-
core multilateral ODA is un-earmarked core funding from national governments to multilateral organisations, which is pooled with other donors’ funding and disbursed as part of the core budget of the multilateral organisation. For example, the UK’s un-earmarked contribution to the World Bank International Development Association. Core contributions will fluctuate from year to year in part due to the payment schedules of the receiving multilateral organisation
Table 2 below shows that in 2022[footnote 8]
-
£9,447 million of UK ODA was delivered through bilateral channels, a 32.2% increase (£2,301 million) compared to 2021: the main driver was a rise in in-donor refugee costs (2,634 million), which was partially off-set by an overall reduction in other bilateral ODA. £3,327 million of UK ODA was delivered through core contributions to multilaterals, a 22.2% decrease (£950 million) compared to 2021
-
there has been an increase to the share of UK ODA delivered through bilateral channels (from 62.6% in 2021 to 74.0% in 2022), whilst the share of UK ODA delivered through multilateral channels has decreased (from 37.4% to 26.0%). This share of multilateral spend is the lowest to date
Table 2: Provisional Total UK Net ODA: by Delivery Channel (Bilateral, Multilateral), 2021 and 2022
| Delivery channel | 2021 £ million | 2021 % total ODA | 2022 £ million | 2022 % total ODA | Change since 2021 £ million | Change since 2021 % |
|---|---|---|---|---|---|---|
| Total Bilateral ODA | 7,146 | 62.6% | 9,447 | 74.0% | 2,301 | 32.2% |
| of which Humanitarian assistance | 743 | 6.5% | 1,060 | 8.3% | 317 | 42.6% |
| Total Multilateral ODA | 4,277 | 37.4% | 3,327 | 26.0% | -950 | -22.2% |
| Total ODA | 11,423 | 100.0% | 12,774 | 100.0% | 1,352 | 11.8% |
Note 1. Figures may not sum to totals due to rounding
In addition:
-
£3,686 million of total ODA was in the form of in-donor refugee costs (28.9% of total UK ODA)[footnote 9][footnote 10]. This represents a £2,634 million increase compared to 2021 when its share of total ODA was 9.2%. The increase in 2022 was due to an increase in ODA eligible costs of asylum seeker support, support to individuals in the Ukraine Visa schemes and the Afghanistan Citizens Resettlement Scheme. Supplementary Table 1 in the accompanying tables provides a breakdown of in-donor refugee costs by contributor.
-
in 2022, approximately £265 million[footnote 11] of UK bilateral ODA was spent on activities specifically designed to address the COVID-19 pandemic. This included the UK’s donation of excess vaccine doses, both directly and through COVAX[footnote 12], to developing countries (estimated at £227.8 million)[footnote 13]. For this report, the FCDO’s COVID-19 figure consists of programmes specifically designed to address the pandemic, whereas in previous reports the figure also included spend of programmes which already existed but were adapted to respond to the crisis. Further work will be done between the provisional and final report to both refine the FCDO’s COVID-19 estimate and expand the coverage to align with previous years.
4. Breakdown of UK ODA by contributor
Table 3 shows a breakdown of UK ODA by UK government department and other UK official sector contributors in 2022. It also shows changes in spend from 2021. The analysis presented in the table is based on summary provisional returns from government departments and other sources. More detailed spending data will be published in ‘Statistics on International Development: Final UK Aid Spend 2022’ this autumn.
The overall amount of ODA is largely determined by the size of GNI, however shifts in the percentage shares of departments and other ODA contributors depend on their spending in the given year.
Contributors of UK ODA in 2022
-
FCDO spent £7,636 million of ODA (59.8% of total UK ODA) in 2022. This was a decrease of £539 million (or 6.6%) compared to 2021
-
ODA delivered by all contributors other than FCDO (known as non-FCDO) totalled £5,138 million (40.2% of total UK ODA) in 2022, an increase of £1,891 million (or 58.2%) compared to 2021
Of this:
-
ODA delivered by government departments other than FCDO (known as Other Government Departments) totalled £4,811 million in 2022, an increase of £1,985 million (or 70.2%) compared to 2021. This was largely due to an increase in spend on in-donor refugee support by a number of departments. See Supplementary Table 1 for more detail
-
spend by Other Contributors of UK ODA totalled £328 million in 2022, a decrease of £94 million (or 61.3%) compared to 2021
-
the largest increases in the latest years’ spend amongst non-FCDO contributors were driven by increases in in-donor donor refugee costs:
-
Home Office, which spent £2,397 million of ODA in 2022, an increase of £1,356 million (130.2%). This was driven by an increase in in-donor support costs for asylum seekers, and individuals within the Afghanistan Citizens Resettlement Scheme
-
Department for Levelling Up, Housing & Communities (new to spending ODA), spent £524 million in 2022
-
Department for Health and Social Care, which spent £465 million of ODA in 2022, an increase of £238 million
-
Department for Education, which spent £216 million of ODA in 2022, an increase of £195 million
-
Department for Work and Pensions, which spent £168 million of ODA in 2022, an increase of £155 million
-
The largest decrease amongst non-FCDO contributors was:
-
Department for Business, Energy and Industrial Strategy[footnote 14], which spent £552 million on ODA in 2022, a decrease of £383 million (-40.9%) since 2021
Table 3: UK ODA Contributors 2021, 2022; ordered by 2022 Provisional ODA spend
| Contributor Grouping Individual Contributor |
2021 £ million | 2021 % UK ODA | 2022 £ million | 2022 % UK ODA | Change since 2021 £ million | Change since 2021 % |
|---|---|---|---|---|---|---|
| Total Foreign, Commonwealth and Development Office | 8,175 | 71.6% | 7,636 | 59.8% | -539 | -6.6% |
| of which: EU attribution | 684 | 6.0% | 532 | 4.2% | -152 | -22.2% |
| Total non-FCDO | 3,248 | 28.4% | 5,138 | 40.2% | 1,891 | 58.2% |
| Sub-total other government departments | 2,826 | 24.7% | 4,811 | 37.7% | 1,985 | 70.2% |
| Home Office | 1,041 | 9.1% | 2,397 | 18.8% | 1356 | 130.2% |
| Department for Business, Energy and Industrial Strategy | 935 | 8.2% | 552 | 4.3% | -383 | -40.9 |
| Department for Levelling up, Housing & Communities | 0 | 0.0% | 524 | 4.1% | 524 | z |
| Department of Health and Social Care | 226 | 2.0% | 465 | 3.6% | 238 | 105.2% |
| Conflict Stability and Security Fund (CSSF) | 426 | 3.7% | 307 | 2.4% | -119 | -28.0% |
| Department for Education | 21 | 0.2% | 216 | 1.7% | 195 | 918.9% |
| Department for Work and Pensions | 13 | 0.1% | 168 | 1.3% | 155 | 1193.1% |
| Department for Environment Food and Rural Affairs | 76 | 0.7% | 91 | 0.7% | 15 | 19.1% |
| Cabinet Office | 18 | 0.2% | 51 | 0.4% | 33 | 180.6% |
| HM Revenue & Customs | 3 | 0.0% | 27 | 0.2% | 24 | 846.9% |
| Department for Digital, Culture, Media and Sports | 6 | 0.1% | 4 | 0.0% | -2 | -36.2% |
| Ministry of Defence | 3 | 0.0% | 4 | 0.0% | [low] | 8.2% |
| HM Treasury | 2 | 0.0% | 3 | 0.0% | 1 | 48.9% |
| Office for National Statistics | 2 | 0.0% | 3 | 0.0% | 2 | 102.2% |
| Department for Transport | 0 | 0.0% | [low] | 0.0% | 0 | z |
| Cross-Government Prosperity Fund | 53 | 0.5% | 0 | 0.0% | -53 | -100.0% |
| Department of International Trade | [low] | 0.0% | 0 | 0.0% | 0 | -100.0% |
| Sub-total Other contributors of UK ODA | 422 | 3.7% | 328 | 2.6% | -94 | -61.3% |
| Gift Aid | 158 | 1.4% | 170 | 1.3% | 12 | 2.3% |
| Other In-Donor Refugee costs | 4 | 0.0% | 109 | 0.9% | 105 | -39.0% |
| BBC World Service | 25 | 0.2% | 29 | 0.2% | 5 | -4.4% |
| Scottish Government | 26 | 0.2% | 17 | 0.1% | -10 | 20.3% |
| Welsh Government | 3 | 0.0% | 2 | 0.0% | -1 | 7.0% |
| Colonial pensions administered by FCDO | 1 | 0.0% | 1 | 0.0% | 0 | 1.9% |
| IMF Poverty Reduction and Growth Trust (PRGT) | 204 | 1.8 | 0 | 0.0% | -204 | -19.8% |
| Total UK Net ODA | 11,423 | 100.0% | 12,774 | 100.0% | 1,352 | -20.6 |
Contributors’ share of UK ODA
-
in 2022 the FCDO accounted for 59.8% of UK ODA, compared to 71.6% in 2021. This is the smallest share of UK ODA reported for FCDO
-
the share of total ODA delivered by contributors other than FCDO increased from 28.4% in 2021, to 40.2% in 2022
Of the non-FCDO contributors, Other Government Departments’ (OGD) ODA accounted for 37.7% of total UK ODA in 2022, compared to 24.7% in 2021. This is their largest share on record. The departments with the largest shares of ODA were: the Home Office (18.8% of total UK ODA); the Department for Business, Energy & Industrial Strategy (4.3%); and the Department for Levelling Up, Housing & Communities (4.1%).
Other Contributors of UK ODA accounted for 2.6% of total UK ODA, a decrease from 3.7% in 2021. See table 3 for details.
5. FCDO Bilateral ODA by Region
Figure 2 presents the breakdown of FCDO’s bilateral ODA spend by region. Similar data from all other contributors of UK ODA is not available for this provisional release and will be presented in the ‘Statistics on International Development: Final UK Aid Spend 2022’ publication.
Bilateral ODA by region includes spend which benefits either a single region or country/countries within a single region (referred to in this report as ‘region-specific’). It excludes spend that benefits multiple regions (see section 6).
-
in 2022, FCDO region-specific bilateral ODA was £2,514 million, a decrease of £100 million from 2021. The share of FCDO’s total bilateral ODA this represented decreased from 58.3% in 2021 to 54.8% in 2022
-
Africa and Asia regions experienced a reduction in FCDO region-specific bilateral ODA in 2022:
-
Africa received £1,109 million (down £258 million, 18.8% from 2021) and its share of total region-specific bilateral ODA decreased from 52.3% in 2021 to 44.1% in 2022
-
Asia received £938 million (down £127 million, 11.9% from 2021), representing 37.3% of total region-specific bilateral ODA, down from 40.8% in 2021
-
-
Europe, Americas and Pacific experienced an increase in FCDO region-specific bilateral ODA in 2022:
-
Europe received £310 million (up £249 million, 405% from 2021), the majority of which was for the benefit of Ukraine. The share of region-specific bilateral ODA this represented increased from 2.4% to 12.3%
-
ODA to the Americas increased from £106 million in 2021 to £147 million in 2022 (up 38.9%). This took their share of region-specific bilateral ODA from 4.1% to 5.9%
-
the Pacific region received £9 million (up £2 million, 33.4% from 2021), representing 0.4% of total, region-specific bilateral ODA
-
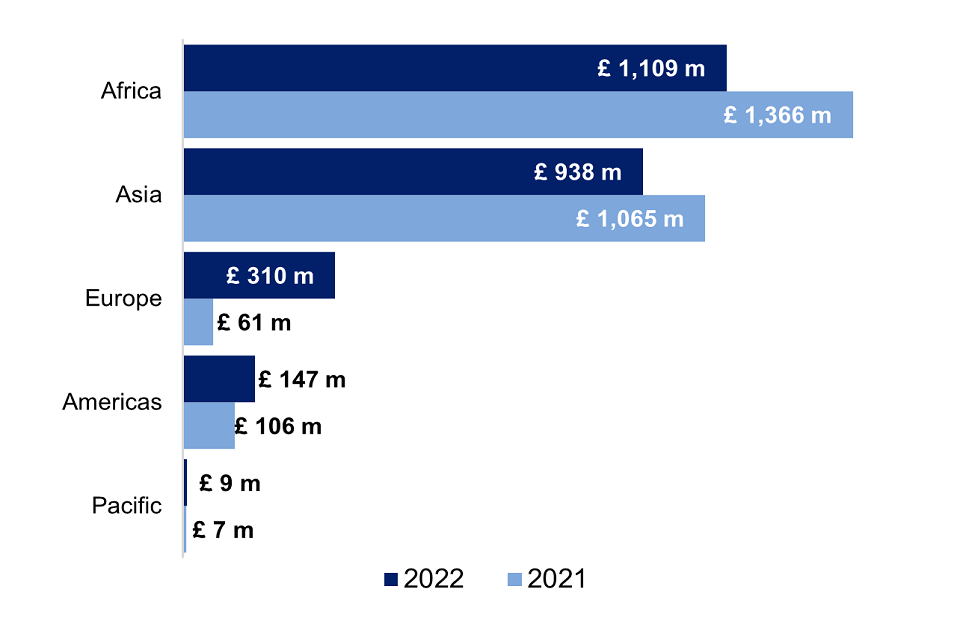
Figure 2: FCDO Region-Specific Bilateral ODA, 2021 and 2022
Figure 3 legend: Provisional FCDO region-specific bilateral ODA by recipient region (£ millions), 2021 and 2022.
6. FCDO Non-region specific Bilateral ODA
Non region-specific bilateral ODA consists of spend on projects which do not benefit either a single region or countries within a single region. For example, research which benefits several developing countries across multiple regions.
Non-region specific bilateral ODA spend by FCDO amounted to £2,073 million in 2022, an increase of £193 million compared to 2021. This accounted for 45.2% of FCDO’s total bilateral ODA spend, an increase from 41.9% in 2021.
Figure 3 provides a breakdown of FCDO’s non-region specific bilateral ODA for 2022.
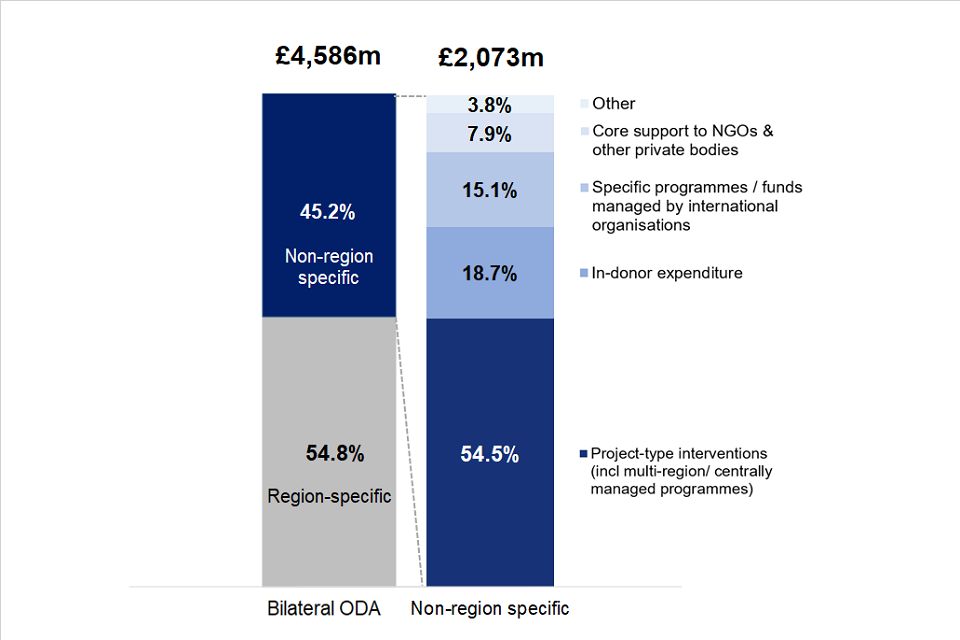
Figure 3: Breakdown of FCDO’s Non-Region specific Bilateral ODA in 2022
Figure 3 legend: Breakdown of FCDO non-region specific bilateral ODA by type of aid (£ millions), 2021 and 2022. 1 “In-donor expenditure” relates to ODA-eligible activities conducted within countries that donate aid, including the United Kingdom. ODA spend in the UK to support development work overseas or refugees within the UK are both examples of in-donor expenditure. 2 “Other” includes Basket funds/pooled funding and Other technical assistance.
7. Background Notes
7.1 Definitions and Sources
1. Information on the main definitions and sources used in this publication can be found in Annexes 2 and 3 (PDF, 268 KB) respectively, of the Statistics on International Development publication.
2. UK ODA figures for this publication are derived from:
-
former DFID’s ‘ARIES’ database of financial transactions relating to payments and receipts, which is quality assured centrally to ensure that data is complete, coding is correct and spend is in line with OECD definitions of ODA. Former FCO’s data is collected in a similar manner from financial transactions data. As explained in the Note to Users (page 4), FCDO launched a new finance and HR system (‘Hera’) during 2022. These administrative sources comprise 61.2% of total UK ODA in 2022. Background note 7.7 has more information on the quality assurance of data from the Hera finance system
-
non- FCDO sources are largely derived from financial transaction data. ODA contributors also assess whether the spend is in line with the OECD definitions of ODA. A small proportion of non-FCDO spend is estimated, for example Gift Aid on ODA eligible activity. These non-FCDO sources account for around 38.8% in 2022
7.2 Scope
3. This publication presents information on the UK’s Official Development Assistance (ODA) spend in calendar year 2022. Comparisons are made to calendar year 2021. It includes data from UK government departments as well as the Devolved Administrations of the UK and other contributors to UK ODA such as Gift Aid. Data relating to both Bilateral and Multilateral ODA are included in the scope of this publication.
4. This publication does not include information on:
-
private spending or donations made in support of developing countries, for example by the public, the voluntary sector or through remittances, are not part of the ODA definition and not covered in this publication
-
financial Year ODA budget allocations, which are set by HM Treasury. Users are advised to use caution when making comparisons between the calendar year figures reported in SID with financial year ODA budget allocations
7.3 ODA spending and reporting
5. FCDO and HM Treasury monitor spend by UK departments and funds, and movements in GNI during the year. The UK ODA commitment is reported in the calendar year following the spend, using confirmed ODA outturn spend, and GNI estimates published by the Office for National Statistics.
6. While FCDO manages its own spending on ODA, FCDO has no control over GNI nor the spending by other government departments and other sources of ODA. After final decisions on UK ODA spending are made the GNI estimate can still shift, due to later economic data for the year becoming available. So can the amount of ODA spent by other government departments and ODA contributions from non-departmental sources.
7. Between the spring and the autumn, the previous year’s ODA totals of FCDO and other government departments are finalised. Government departments other than FCDO will provide project-level details that allow the ODA spend to be quality assured by FCDO. The ONS will release further updates of GNI throughout the year. The final ODA data and the most up-to-date available GNI estimate are then used to calculate the final ODA:GNI ratio in the autumn publication.
8. FCDO is responsible for collating data and reporting spend on ODA to the Organisation of Economic Development and Co-operation (OECD), including the ODA:GNI ratio.
7.4 EU attribution
9. The provisional estimate for the UK’s share of the EU ODA spend in 2022 was £532 million compared to £684 million in 2021. The UK’s share of the EU attribution fluctuates from year to year due to the speed of programme delivery, the total share of EU external programming spend that is classified as ODA and fluctuations in exchange rates. In addition to the normal fluctuations, the decrease in 2022 reflects the UK’s shrinking residual contributions to the EU Multiannual Financial Framework (MFF) 2014 to 2020 budget. Under the Withdrawal Agreement, the UK committed to meet outstanding contributions from the 2014 to 2020 EU budget including external action, development and humanitarian aid programming. This means a declining tail of ODA contributions until around 2030, which is part of the wider financial settlement in the Withdrawal Agreement.
7.5 Grant Equivalent Measure
10. From 2018 onwards, Official Development Assistance (ODA) has changed from being measured on a cash basis to a grant equivalent basis, following a decision taken by the DAC in 2014. This change in measure affects official loans to sovereign states and development multilaterals. See our technical note (PDF, 345 KB) for more information.
11. The headline grant equivalent measure of UK ODA for 2022 was £12,774 million, compared to £12,749 million on the cash basis measurement (a difference of 0.2%).
12. The difference is due to official loan reflows not being included under the grant equivalent measure.
7.6 Revisions and Changes to the Publication
13. The revisions process is set out in FCDO’s Revisions Policy (PDF, 86 KB).
Accessibility
14. We have reformatted the summary tables which accompany the publication to ensure that they are fully assessable for use with screen readers and keyboard only navigation. This is in line with The Public Sector Bodies (Websites and Mobile Applications).
15. If you need any of the information published as part of the SID collections (SID 2021 or historical) in a different format please contact us on statistics@fcdo.gov.uk
7.7 Future developments
16. An important part of National Statistics production is assessing whether a product continues to meet user needs. The ODA statistics team are currently reviewing the SID to identify areas to develop further, as well as testing how best to present and communicate ODA trends. So far, the SID has been peered reviewed by other statisticians. The team has also gathered information on the users of SID and their data needs via short user feedback surveys launched in April 2021 and November 2022. More information on the development plans and user engagement opportunities will be published on the statistics gov.uk page throughout 2023.
17. The team always welcomes the opportunity to understand further how our readers are using the SID products and data. You can provide feedback either by completing our short user feedback directly by contacting us by email to statistics@fcdo.gov.uk
18. FCDO’s new finance system ‘Hera’ was implemented during 2022. A dedicated statistician worked on the shift between systems to assess its impact on our statistics and ensure that FCDO ODA can be consistently collected and reported in line with the OECD DAC directives. The assurance process will be ongoing throughout 2023 to further test the 2022 data and future data as the system is used to manage all FCDO ODA spend going forward. We will update our ‘assessment of assurance of administrative data’ ([Annex 3, (PDF, 268 KB)])(https://assets.publishing.service.gov.uk/government/uploads/system/uploads/attachment_data/file/1119473/Final-SID-annexes-1-3.pdf))and provide more information about the quality assurance of the Hera system prior to reporting on 2023 ODA data.
19. The ODA statistics team will keep users informed via the SID gov.uk page of any changes or improvements to FCDO ODA statistics.
20. FCDO is defined as a multi-purpose agency by the OECD, as it carries out both ODA and non-ODA activities. FCDO statisticians have produced a suitable interim methodology that captures the ODA eligible proportion of FCDO administration costs. Information on this methodology can be found in our explanatory note (PDF, 220 KB). The methodology has been applied from April 2021 and is expected to be used on an interim basis whilst the Hera system is being fully implemented and tested. Once this happens, the methodology will be reviewed and adjusted as necessary. The explanatory note will be updated once the methodology is finalised.
7.8 Timing and Releases
21. FCDO releases 2 editions of Statistics on International Development each year:
-
Provisional UK Aid spend is published in the spring and includes a preliminary estimate of the UK’s ODA:GNI ratio for the previous calendar year. This is usually early April each year
-
Final UK Aid spend is usually published in the autumn. This publication confirms the UK’s ODA:GNI ratio for the previous year, as well as including more detailed analysis of the UK’s Bilateral and Multilateral ODA, and includes the microdata used to produce the publication. The latest edition of this publication can be found on Statistics on International Development final 2021
22. Provisional 2022 ODA statistics for all members of the OECD will be published by the OECD Development Assistance Committee (DAC) on 12 April 2023. Final data is normally published by the OECD in December.
7.9 Quality
23. The DAC sets the definitions and classifications for reporting on ODA internationally. These are laid out in the DAC Statistical Reporting Directives. The statistics shown here are reported in line with these directives and are subject to the quality assurance process as described in Annex 3 (PDF, 268 KB) of Statistics on International Development.
24. The data in the publication is largely based on administrative data and so it is not subject to sampling error. However, these provisional statistics may change between now and the final release in Autumn 2023 as the data is further audited and assured as part of the closing of accounts and statistical quality assurance processes.
ODA spend in response to the Coronavirus (COVID-19) Pandemic
25. The activities captured in the COVID-19 ODA spend figure have the objective of supporting the control of the COVID-19 pandemic or responding to its socio-economic impacts. The OECD DAC has requested aggregated total COVID-19 ODA spend from all donors. This will be published in their preliminary statistics on 12 April.
26. The sources of this ODA spend data are as follows:
a. Former-DFID: COVID-19 spend data was captured on the Aid Management Platform, which is the same source[footnote 15] of former-DFID spend data on sectors and benefitting country. ODA activities can be tagged either as a COVID-19 activity or as not applicable. Some ODA activities were designed specifically to address COVID-19 (COVID-19 specific), while some existing programmes were adapted or flexed to respond to the crisis (COVID-19 adapted). In this publication, only the former have been included. Further work will be done to refine this estimate between the provisional report and the final report.
b. Former-FCO: COVID-19 activities were carried out through the International Programme’s enabling fund, which provides small amounts of discretionary funding to posts /directorates for small-scale activities. The Fund is designed to be agile, to allow posts to respond quickly to developing events[footnote 16].
c. Non-FCDO: ODA contributors provided the amount of ODA focused on addressing the COVID-19 pandemic via the usual provisional data return.
27. Please note that the amount spent on activities which addressed the COVID-19 pandemic is an approximate estimate. Further work will be done to refine this estimate between the provisional report and the final report.
28. The £265 million does not include the UK’s core contributions to multilaterals, a proportion of which will have been channelled to address the COVID-19 pandemic.
In-donor refugee costs
29. The OECD Development Assistance Committee (DAC) states 5 clarifications for defining what in-donor refugee costs can be considered ODA in statistical reporting. The United Kingdom adheres to these principals to preserve ODA integrity and allow comparability between countries.
30. The UK’s methodology for estimating in-donor refugee costs (PDF, 389 KB) is published here. The FCDO statistics team are working to produce an updated methodology report prior to the publication of final SID 2022 in Autumn 2023. This will capture the methodology for new ODA eligible schemes and each component of spend by the responsible department.
7.10 Related Statistics and Publications
31. The OECD provide ODA breakdowns for DAC donors (including multilaterals). This source is useful when carrying out international comparisons.
The Development Tracker can be used to explore details of the individual development projects that the UK is funding. This allows you to filter projects
32. by country and sector and view further details about the project as published in documents such as the business case and annual review. The tracker uses open data on development projects, compliant with the International Aid Transparency Initiative standard, to show where funding by the UK Government and its partners is going and ‘trace’ it through the delivery chain.
7.11 Uses and users
33. The main purpose of these statistics is to provide timely summary statistics on ODA expenditure by the UK. They are published prior to the release of provisional ODA statistics by the OECD DAC for all OECD members.
34. Responses from our short user feedback survey in May 2021 show that our largest user groups include expert analysts/technical users, policy influencers and information foragers (see definitions of each personas). Our users use the SID primarily to find out which countries and sectors receive UK ODA, the bilateral/multilateral split of UK ODA and the amount of ODA spent by each government department.
35. We are always keen to enhance the value of these statistics and welcome your feedback either via our Statistics User Group or via email statistics@fcdo.gov.uk.
7.12 National Statistics
36. The Office for Statistics Regulation (part of the United Kingdom Statistics Authority) designated these statistics as National Statistics in March 2016, in accordance with the Statistics and Registration Service Act 2007 and signifying compliance with the Code of Practice for Statistics. Designation means the statistics carry the National Statistics label and conform to the standards summarised below.
37. Office for Statistics Regulation published their finding from the compliance check of SID which confirmed that it is designated a National Statistics.
38. The Foreign, Commonwealth and Development Office is now responsible for producing the Statistics on International Development statistical series, the designation of National Statistics carries through to the new Department.
39. Information on the work of the UK Statistics Authority
Contact
For enquiries (non-media) about the information contained in this publication, or for more detailed information, please contact: Jacqueline Robertson
Telephone: 07768 90 42 27
E-mail: statistics@fcdo.gov.uk
For media enquiries please contact the FCDO Press Office on +44 (0)20 7008 3100.
For further information on development issues and FCDO policies, please contact the Public Enquiry Point on 020 7008 5000.
-
The full OECD DAC ODA directives, including the full ODA definition can be found on their website (PDF, 2.5 MB). ↩
-
A glossary, explaining key terms used throughout this report, is available in Annex 1 (PDF, 268 KB). ↩
-
Once released the publication will be available on the ‘Statistics at FCDO’ webpage. ↩
-
Figures may not sum to totals due to rounding. ↩
-
This includes spend by other UK government departments and spend by other contributors such as the Scottish and Welsh Governments and Gift Aid claimed by charities working on ODA eligible activities. ↩
-
https://assets.publishing.service.gov.uk/government/uploads/system/uploads/attachment_data/file/854341/Expl-Note-Statistics-International-Dev-use-new-GDP-Framework.pdf (PDF, 150 KB) ↩
-
For information on the difference between the Grant Equivalent measure and the historical cash measurement please see background note 7.5. ↩
-
Figures may not sum to totals due to rounding. ↩
-
‘In-donor refugee costs’ refers to the amount of ODA eligible spend on refugees within a donor country. In 2022 all of these costs were incurred in the UK. For more information on the definitions and methodology, see section 7.9 on Quality. ↩
-
The Independent Commission for Aid Impact (ICAI) released a rapid review on UK aid to refugees in the UK on 29 March 2023. The figures differ as ICAI used management information from departments which are not quality assured to the same extent as National Statistics and did not provide a comprehensive total spend for in-donor refugee costs. ↩
-
Activities captured have the objective of supporting the control of the COVID-19 pandemic and the response to its social-economic impacts Please see the background note section 7.9 for information on ODA COVID-19 data collection, quality and calculation. ↩
-
COVAX is co-led by Coalition for Epidemic Preparedness Innovations (CEPI), Gavi (The Vaccine Alliance) and ‘World Health Organisation’ (WHO). The WHO website describes COVAX’s aim as to accelerate the development and manufacture of COVID19 vaccines, and to guarantee fair and equitable access for every country in the world. ↩
-
This figure has been calculated in line with the DAC guidance on reporting vaccine donations in 2022 by applying the DAC’s average price of $6.66 per dose. For vaccines the UK paid less than $6.66 per dose, the actual price paid has been used instead, in line with the DAC’s proposed safeguard. ↩
-
The Department for Energy Security and Net Zero, Department for Science, Innovation and Technology and Department for Business and Trade are government departments created in 2023. For this publication we have continued to report activity in 2022 by the departments as they were known in 2022. ↩
-
See the SID accompanying annexes (PDF, 268 KB) for more information on FCDO’s assessment of assurance of the administrative data ↩