Statistics on International Development: final UK aid spend 2021
Updated 15 March 2023

© Crown copyright 2023
This publication is licensed under the terms of the Open Government Licence v3.0 except where otherwise stated. To view this licence, visit nationalarchives.gov.uk/doc/open-government-licence/version/3 or write to the Information Policy Team, The National Archives, Kew, London TW9 4DU, or email: psi@nationalarchives.gov.uk.
Where we have identified any third party copyright information you will need to obtain permission from the copyright holders concerned.
This publication is available at https://www.gov.uk/government/statistics/statistics-on-international-development-final-uk-aid-spend-2021/statistics-on-international-development-final-uk-aid-spend-2021
1. Summary
In 2021:
• the final ODA:GNI ratio was 0.50%
• in 2021, UK Official Development Assistance (ODA) spend was £11,423 million, a decrease of £3,054 million (21.1% decrease) on 2020
• UK bilateral ODA spend was £7,146 million (62.6% of total UK ODA) while UK core funding to multilaterals was £4,277 million (37.4% of total UK ODA)
• the Foreign, Commonwealth and Development Office (FCDO) spent £8,175 million on ODA in 2021, compared with £10,663 million in 2020 (a decrease of £2,488m). The FCDO’s share of total UK ODA stood at 71.6% in 2021, a decrease from 73.7% in 2020
• non-FCDO spend on ODA (by Other Government Departments and other contributors of UK ODA) was £3,248 million in 2021, compared with £3,814 million in 2020 (a decrease of £566m). The non-FCDO share was 28.4%, up from 26.3% in 2020
• Africa remained the largest recipient of UK region-specific bilateral ODA in 2021 – accounting for 50.5%. However, in 2021 ODA to Africa decreased by £883 million (33.8 %) to £1,727 million
• the top 3 recipients of UK bilateral country specific ODA were Afghanistan (£187m), Nigeria (£140m) and Pakistan (£128m)
• the largest amount of bilateral ODA was focused on the sectors ‘Refugees in Donor Countries’ (£1,052m), ‘Health’ (£970m) and ‘Economic Infrastructure & Services’ (£820m)
In 2021 the UK provided £11.4bn of Official Development Assistance (infographic)
2. Setting the scene on Official Development Assistance
What is ODA?
Official Development Assistance (ODA) is provided according to the standardised definitions and methodologies of the Organisation for Economic Cooperation and Development’s (OECD) Development Assistance Committee (DAC). ODA (also known as aid) is defined as resource flows to developing countries and multilateral organisations, which are provided by official agencies (e.g. the UK government) or their executive agencies, where each transaction meets the following requirements:
-
it is administered with the promotion of the economic development and welfare of developing countries as its main objective and
-
it is concessional, including grants and soft loans[footnote 1]
Which countries are ODA eligible?
The list of countries eligible to receive ODA is set by the OECD DAC. Gross National Income (GNI) per capita below the World Bank high-income threshold defines the coverage and boundaries of the list. It includes all low, lower-middle and upper-middle income countries, except for those that are members of the G8 or the European Union (including countries with a firm accession date for EU membership). The DAC reviews the list every 3 years. Countries ‘graduate’ if they have surpassed the high- income GNI per capita threshold for the 3 consecutive years prior to a graduation year.
3. About this release
What is in this report?
This report contains the release of finalised UK ODA spend figures for the calendar year 2021, including:
- total UK spend on ODA, the UK’s ODA:GNI ratio and a breakdown of spend by main government department delivery channels
- analysis of UK ODA spend by recipient country or multilateral organisation, as well as type of assistance and sector
- comparisons between the UK and other donor countries
Comparisons between 2020 and 2021 ODA figures are made, as well as trends over the last 5 years (2017 to 2021 inclusive as shown in most tables). This publication updates previous provisional figures of UK ODA for 2021 published in April 2022. There have been notable changes to some government department figures since the provisional publication, details of which can be found in Background Notes 9.4.
All data tables included in this report are available to download in spreadsheet format. A full micro-dataset is also available in Open Data Standard format on the Statistics on International Development webpage. If you require any other data or information, or if you have any suggestions on how to improve the publication, please contact the statistics team at: statistics@fcdo.gov.uk
Further information on the technical terms, data sources, quality and processing of the statistics in this publication are found in Annexes 1-3 (PDF, 268 KB) on the Statistics on International Development webpage.
We are keen to hear from SID users to help us plan future developments and meet users’ analytical needs as far as possible. We would also be grateful to hear users’ views on a handful of our proposed ideas for improvements. You can provide feedback either by completing our short user feedback survey (open until 13 January 2023). Alternatively, you can contact us by email to statistics@fcdo.gov.uk
Note to users
Reduction in UK ODA expenditure
• in 2020, the UK government announced a temporary reduction in ODA from 0.7% of GNI to 0.5% of GNI effective from 2021. The UK government committed to returning to spending 0.7% as soon as the fiscal situation allows (see ‘Key Background’ section on page 11 for more information). Since the International Development (Official Development Assistance Target) Act 2015 was passed, 2021 is the first year in which the UK has spent less than 0.7% of its GNI on ODA. The trends presented in this report reflect this reduction
FCDO figures
• on 2 September 2020, the Department for International Development (DFID) and Foreign and Commonwealth Office (FCO) merged to form a new department - the Foreign, Commonwealth and Development Office (FCDO). As highlighted in ‘Statistics on International Development: final UK aid spend 2020’, from 2021, the first full year of the merged department, only total FCDO spend is available (rather than being broken down by former DFID and former FCO)
• comparisons in the report to historic FCDO figures are based on the sum total of former DFID and former FCO spend
• FCDO is defined as a multi-purpose agency by the OECD, as it carries out both ODA and non-ODA activities. FCDO statisticians have produced a suitable methodology that captures the ODA eligible proportion of FCDO administration costs *(a). Information on this methodology can be found in our explanatory note (PDF, 220 KB). The methodology has been applied from April 2021 (beginning of the financial year). This methodology is expected to be used on an interim basis whilst the FCDO finance system is being fully implemented and tested. Once this happens, the methodology will be reviewed and adjusted as necessary. The explanatory note will be updated once the methodology is finalised
*(a): The method is interim while FCDO future finance and HR systems are being implemented
• FCDO’s ODA eligible administration costs estimates are broken down by recipient country, this is in line with the approach to reporting former FCO’s Frontline Diplomacy Activity. Former DFID’s ODA eligible administration costs were all reported as “Developing Country, unspecified”. Therefore, care should be taken when comparing FCDO ODA eligible administration estimates at the country level to historical FCDO ODA eligible administration (which will only reflect former FCO)
4. UK ODA trends
This chapter provides an overview of UK Official Development Assistance (ODA). It covers the total amount of ODA provided by the UK in 2021, the calculation of the ODA:GNI ratio, longer-term spending trends, breakdowns of UK ODA spend by main delivery channel, and by contributors.
4.1 The ODA:GNI ratio
The ODA:GNI ratio presents the total amount of UK ODA as a proportion of UK Gross National Income (GNI).
Key background: the UK’s ODA:GNI ratio
From 2013 to 2020:
The ODA:GNI target of 0.7% was first agreed internationally in 1970 by the United Nations General Assembly. The UK government made a commitment to spend 0.7% of GNI on ODA from 2013. The International Development (Official Development Assistance Target) Act 2015 placed this commitment in domestic legislation. The UK spent 0.7% of UK GNI on ODA between 2013 to 2020.
2021 onwards:
In November 2020, the UK government announced *a) a temporary reduction to ODA from 0.7% to 0.5% of GNI, citing the economic challenges posed by the COVID-19 pandemic *b). The UK government committed to returning to spending 0.7% as soon as the fiscal situation allows. In July 2021, the government set out the conditions that would enable a return to spending 0.7% of GNI on ODA *c). There are 2 key tests, which must be met on a sustainable basis in the fiscal forecast produced by the Office for Budget Responsibility (OBR):
• first, when the UK government are not borrowing to support day-to-day spending
• second, when underlying debt is falling
When these tests are met the government will increase ODA spending above 0.5% of GNI to 0.7%. Once the government has spent 0.7% of GNI on ODA in a given year, the tests will no longer apply and the government will return to spending 0.7% of GNI on ODA year on year.
The government will continue to review and confirm each year whether a return to spending 0.7% of GNI on ODA is possible against the latest fiscal forecast. In the meantime, the government’s plans assume ODA spending will be around 0.5% of GNI.
*a): See the government statement *b): The International Development (Official Development Assistance Target) Act 2015 (the 2015 Act) sets out circumstances which may explain why the 0.7 per cent target is not met and FCDO’s accountability to Parliament, See Section 2 of the 2015 Act *c): See the government statement
Table 1 shows that in 2021:
- the ODA:GNI ratio was 0.50%. This shows that the UK has spent in line with the government’s decision to reduce ODA from 0.7% of Gross National Income to 0.5% in 2021
- the UK has not met the ODA 0.7% target for the first time since 2013
- UK ODA was £11,423 million in 2021, a decrease of £3,054 million (21.1%) on 2020. This change is driven by the government’s decision to reduce ODA from 0.7% of Gross National Income to 0.5% in 2021
- the GNI used to calculate the UK ODA:GNI ratio rose from £2,074 billion in 2020 to £2,267 billion in 2021
Table 1: UK GNI estimates, total UK ODA and ODA:GNI ratios, 2020 and 2021; Current prices (£ millions)
| Year | GNI | ODA | ODA:GNI ratio |
|---|---|---|---|
| 2021 | 2,266,768* | 11,423 | 0.50% |
| 2020 [r] | 2,073,880 | 14,477 | 0.70% |
*GNI figure is taken from Sept 2021 ONS estimate
[r] Several minor revisions have been made to 2020 data. Please see background note 9.8: Revisions for details.
4.2 Long-term trends in UK ODA spend
Figure 1 shows the trend in UK ODA since 1970. Overall there has been a steady increase in the level of UK ODA since 1970, with a peak in 2005 and 2006 which was driven by high levels of debt relief, and a steep increase in 2013 when the UK Government first met the 0.7% ODA:GNI target. As the UK commitment to spend 0.7% on ODA is based on the UK GNI (a key economic measure), when GNI increases/decreases, in turn the UK ODA spend will also increase/decrease.
Between 2013 and 2019, UK ODA continued to increase in line with growth in the UK’s GNI. The relatively larger increase in the level of ODA in 2016 (by £1.2 billion) reflects the switch to the European System of Accounts (ESA) 2010 methodology for measuring GNI and the consequent increase in UK ODA to meet the 0.7% ODA commitment on that basis. The decrease in 2020 ODA spend reflects the decrease in the size of the economy in 2020 as a result of the Coronavirus (COVID-19) pandemic.
The decrease in 2021 ODA spend reflects the government’s decision to reduce ODA from 0.7% of Gross National Income in 2020 to 0.5% in 2021. Figure 1 shows the levels of ODA in 2021 are broadly similar to levels of ODA spend in 2013 and 2014.
Figure 1: UK ODA levels (£ billions) and ODA:GNI ratios (%), 1970 to 2021
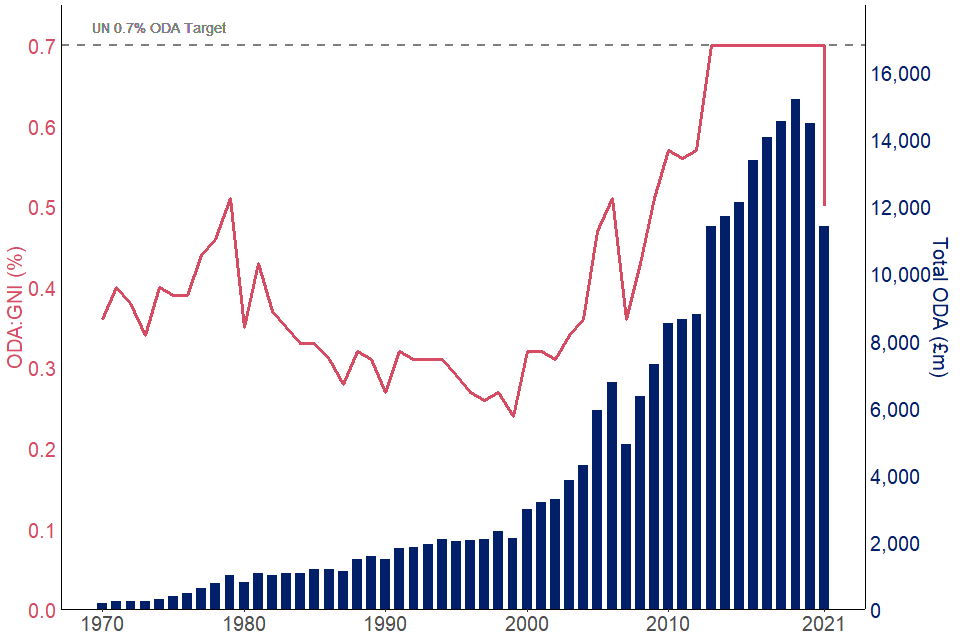
Figure 1 legend: The blue bars represent UK ODA spend from 1970 to 2021, the pink line is the calculated ODA:GNI ratio from 1970 to 2021 and the grey dashed line is the 0.7% ODA:GNI target set by the United Nations General Assembly in 1970. From 2018 onwards, ODA has changed from being measured on a cash basis to being measured on a grant equivalent basis, following a decision taken by the DAC in 2014.[footnote 2]
4.3 Bilateral and core multilateral ODA in 2021
Case Study: delivering aid through Bilateral and Multilateral channels (infographic)[footnote 7] [footnote 8].
- £7,146 million of UK ODA was delivered through bilateral channels. This was a 25.0% decrease (£2,386 million) compared to 2020
- bilateral ODA accounted for 62.6% of the UK’s ODA spend in 2021, down from 65.8% in 2020 – see Figure 2
- £4,277 million of UK ODA in 2021 was delivered through core contributions to multilateral organisations. This was a 13.5% decrease (£668 million) compared to 2020
- multilateral ODA accounted for 37.4% of total UK 2021 ODA, an increase to its percentage share compared to 2020 (34.2%). This is the highest share of multilateral ODA since 2014
Figure 2: Total UK ODA by main delivery channel (%), 2017 to 2021
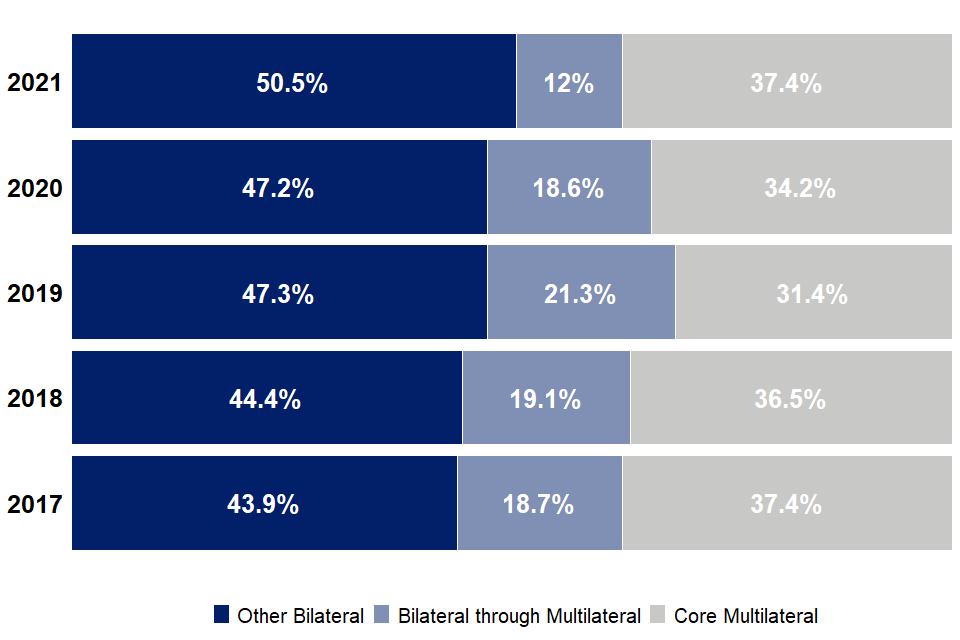
Figure 2 legend: Total UK ODA by main delivery channel. The bars for each year represent 100% of total UK ODA spend. The dark blue section represents the proportion of total UK ODA delivered through ‘Other Bilateral’ channels. The lighter blue represents the same measure but for ODA delivered through the ‘Bilateral through Multilateral’ channel. The grey section represents the proportion of total UK ODA that was channelled as core contributions to multilaterals, ‘Core Multilateral’. Note, percentages may not sum to 100 due to rounding.
COVID-19 pandemic
In March 2020, the World Health Organisation declared that the COVID-19 outbreak was a global pandemic. Since then, a proportion of UK ODA has been directed to support the international response to COVID-19 including helping developing countries counter its health, humanitarian and socio-economic impacts and supporting vaccination efforts.
In 2021, approximately £602 million[footnote 9] of UK bilateral ODA was spent on activities which directly addressed the COVID-19 pandemic (see Table 2 of published tables). FCDO accounted for 86.7% of this ODA. This included the UK’s donation of excess vaccine doses, both directly and through COVAX[footnote 10], to developing countries (estimated at £103.5 million)[footnote 11]. UK bilateral ODA for COVID-19 activities was higher in 2020 (£1,055 million) than 2021, reflecting the large contributions to CEPI and other multilateral programmes that were made at the beginning of the pandemic to respond to its immediate effects. For example, the 2020 contribution to the IMF-Catastrophe Containment and Relief Trust (£150 million in 2020). See the data underlying COVID ODA estimates dataset for more details.
4.4 Makeup of UK ODA by government department and other contributors of UK ODA
Table 2 shows UK ODA spend broken down by government department and other official sector contributors in 2021. It also shows changes in spend from 2020.
The overall amount of ODA spent in any given calendar year is determined by the size of GNI, however shifts in the percentage shares of departments and other ODA contributors depend on their spending in the given year. See ’Note to Users’ (Page 9) for more information on the UK government’s decision to temporarily reduce ODA from 0.7 % to 0.5% of GNI.
Contributors of UK ODA in 2021
- the FCDO is responsible for the majority of the UK ODA budget, spending £8,175 million of ODA (71.6% of total UK ODA) in 2021. This was a decrease of £2,488 million (23.3%) compared with the combined ODA spend of former DFID and former FCO in 2020
- ODA spend by all contributors other than FCDO (referred to as non-FCDO) totalled £3,248 million in 2021, a decrease of 14.8% (or £566m) on 2020
- however, the share of total ODA spend by non-FCDO contributors increased from 26.3% in 2020, to 28.4% in 2021
- Of this:
- spend by government departments other than FCDO (known as Other Government Departments) totalled £2,826 million in 2021, an increase of 2.5% (or £69m) on 2020
- spend by Other Contributors of UK ODA totalled £422 million in 2021, a decrease of 60.1% (or £636m) compared to 2020
Table 2: Breakdown of UK ODA by government department and other contributors of UK ODA [footnote 12]
| 2020[r] £ million | 2020[r] % UK ODA | 2021[r] £ million | 2021[r] % UK ODA | Change since 2020 £ million | Change since 2020 % | |
|---|---|---|---|---|---|---|
| Total Foreign, Commonwealth and Development Office (*note 2) | 10,663 | 73.7% | 8,175 | 71.6% | -2,488 | -23.3% |
| Of which: EU Attribution (*note 3) | 522 | 3.6% | 684 | 6.0% | 162 | 31.1% |
| Total non-FCDO | 3,814 | 26.3% | 3,248 | 28.4% | -566 | -14.8% |
| Sub-total Other Government Departments | 2,757 | 19.0% | 2,826 | 24.7% | 69 | 2.5% |
| Home Office | 597 | 4.1% | 1,041 | 9.1% | 444 | 74.3% |
| Department for Business, Energy and Industrial Strategy | 1,002 | 6.9% | 935 | 8.2% | -67 | -6.7% |
| Conflict, Stability and Security Fund (CSSF) | 534 | 3.7% | 426 | 3.7% | -108 | -20.2% |
| Department of Health and Social Care (*note 4) | 247 | 1.7% | 226 | 2.0% | -21 | -8.4% |
| Department for Environment Food and Rural Affairs | 66 | 0.5% | 76 | 0.7% | 10 | 15.6% |
| Cross- Government Prosperity Fund | 207 | 1.4% | 53 | 0.5% | -154 | -74.4% |
| Department for Education | 18 | 0.1% | 21 | 0.2% | 3 | 18.0% |
| Cabinet Office | 0 | 0.0% | 18 | 0.2% | 18 | z |
| Department for Work and Pensions | 17 | 0.1% | 13 | 0.1% | -4 | -23.5% |
| Department for Digital, Culture, Media and Sports | 8 | 0.1% | 6 | 0.1% | -1 | -18.1% |
| HM Revenue & Customs | 8 | 0.1% | 3 | 0.0% | -5 | -62.6% |
| Ministry of Defence | 5 | 0.0% | 3 | 0.0% | -1 | -29.4% |
| HM Treasury | 1 | 0.0% | 2 | 0.0% | 1 | 56.1% |
| Office for National Statistics (*note 5) | [low] | 0.0% | 2 | 0.0% | 1 | 535.9% |
| Department of International Trade (*note 6) | 3 | 0.0% | [low] | 0.0% | -2 | -86.9% |
| Export Credit Guarantee Department | 44 | 0.3% | 0 | 0.0% | -44 | -100.0% |
| Sub-total Other contributors of UK ODA | 1,057 | 7.3% | 422 | 3.7% | -636 | -60.1% |
| IMF Poverty Reduction and Growth Trust (PRGT) (*note 7) | 255 | 1.8% | 204 | 1.8% | -51 | -19.8% |
| Gift Aid | 154 | 1.1% | 158 | 1.4% | 4 | 2.3% |
| Scottish Government | 12 | 0.1% | 26 | 0.2% | 14 | 119.1% |
| BBC World Service | 26 | 0.2% | 25 | 0.2% | -1 | -4.4% |
| Other In-Donor Refugee Costs (*note 8) | 7 | 0.0% | 4 | 0.0% | -3 | -37.0% |
| Welsh Government (*note 9) | 3 | 0.0% | 3 | 0.0% | 0 | 7.0% |
| Colonial Pensions administered by FCDO | 1 | 0.0% | 1 | 0.0% | 0 | 1.9% |
| Other EU Attribution (*note 3) | 600 | 4.1% | 0 | 0.0% | -600 | -100.0% |
| Total UK Net ODA | 14,477 | 100.0% | 11,423 | 100.0% | -3,054 | -21.1% |
[r] Several minor revisions have been made to 2017, 2018, 2019 and 2020 data. Please see background note 9.8: Revisions for details. ‘z’ is not applicable, where it is not possible to report an ODA value for the variable (e.g. if the category does not exist). “0” is null and “[low]” is less than half the smallest unit displayed.
*Note 2. FCDO figures are the total sum of former FCO and former DFID ODA spend
*Note 3. From 2021, the full UK Attribution of the development share of the EU budget is reported under FCDO. This is in line with ODA allocations. Prior to 2021, the UK EU Attribution core contribution was partly reported by former DFID, and partly by non-DFID
*Note 4. For this publication the basic health support for asylum seekers have been produced with a health unit cost (per capita cost) for 2021
*Note 5. ONS ODA for 2020 was £238,443
*Note 6. Department of International Trade ODA for 2021 was £373,465
*Note 7. Poverty Reduction Growth Trust
*Note 8. This includes ODA eligible in-donor refugee costs which have been administered by the devolved administrations. There may be some ODA eligible health and education activity as part of the Afghanistan Citizens Resettlement Scheme in the devolved administrations that is not included in these figures
*Note 9. Welsh Government record their ODA by financial year.
The largest year on year changes amongst non-FCDO contributors were:
- Home Office, which spent £1,041 million in 2021, an increase of £444 million, or 74.3%, on 2020. This was due to increased accommodation costs for the rising number of asylum seekers coming to the UK and the ODA eligible costs of the Afghanistan Citizen Resettlement Scheme (ACRS)
- other EU Attribution[footnote 13], which totalled £600 million in 2020 and appears as ‘z’ in report Table 2. This is due to the total amount of EU attribution in 2021 (£684 million) now being captured as FCDO spend instead of being split between FCDO, CSSF and Other Contributors of UK ODA. The UK’s overall EU attribution saw a decrease of £437 million (39.0%) in 2021 compared to 2020
- cross-Government Prosperity Fund spend decreased by £154 million (74.4%) to £53 million in 2021. This was because the Prosperity Fund ended on 31 March 2021[footnote 14]. See background note 9.9 for more information
- conflict, Stability and Security Fund (CSSF), which spent £426 million of ODA in 2021, a decrease of £108 million (20.2%), from 2020
- Cabinet Office, which spent £18 million of ODA in 2021, up from zero in 2020. This reflects spend by the Cabinet Office on ODA eligible activities for the 2021 United Nations Climate Change Conference, also known as the Conference of the Parties - COP26
Contributors’ share of UK ODA
-
figure 3 shows that of the non-FCDO contributors, ODA coming from Other Government Departments’ (OGDs) accounted for 24.7% of total UK ODA, compared to 19.0% in 2020. The departments with the largest ODA shares were: the Home Office (9.1%); the Department for Business, Energy & Industrial Strategy (BEIS) (8.2% of ODA); the Conflict, Stability and Security Fund (3.7%); and the Department of Health and Social Care (2.0%)
-
the largest Other Contributors of UK ODA were IMF-PRGT (1.8% of UK ODA) and Gift Aid claimed by charities and used for ODA eligible activities (1.4% of UK ODA)
Figure 3: Breakdown of UK ODA by contributor (2017, 2020 and 2021)
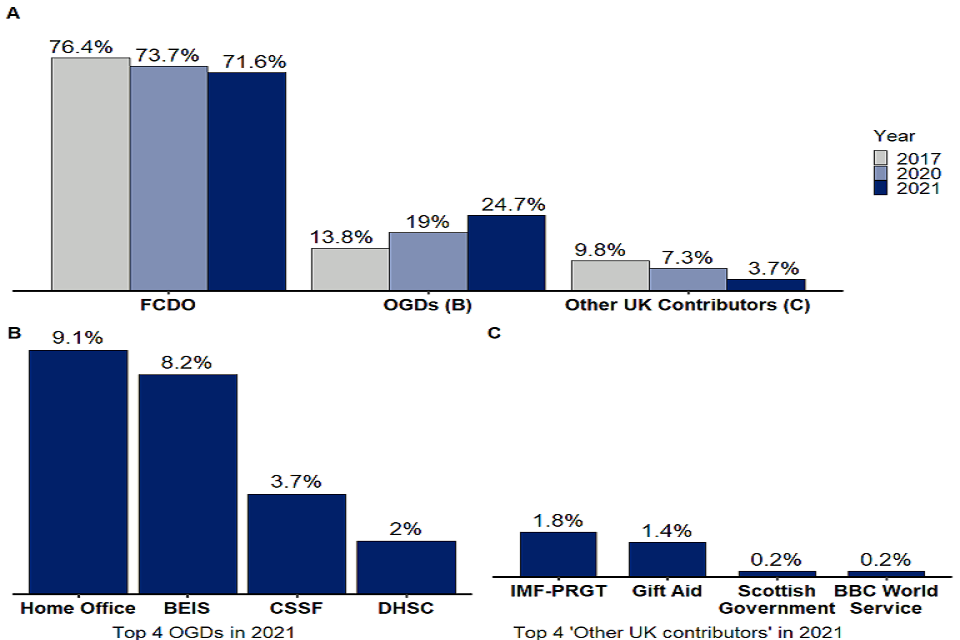
Figure 3 legend: A. Percentage of UK ODA spend by FCDO, Other Government Departments (OGDs) and Other UK Contributors (Other Contributors) in 2017 (dark blue), 2020 (light blue) and 2021 (grey). B. Top 4 other government departments (OGD) in 2021. BEIS=Department for Business, Energy and Industrial Strategy; CSSF=Conflict, Stability and Security fund; DHSC=Department for Health & Social Care. Remaining OGDs make up 0.7% of UK ODA: Department for Environment, Food and Rural Affairs, Prosperity Cross-Government Fund, Department for Education, Cabinet Office, Department for Work and Pensions, Department for Digital, Culture, Media and Sports, Ministry of Defence, HM Revenue and Customs, HM Treasury, Office for National Statistics, Department for International Trade. C. Top 4 other UK contributors in 2021. Remaining other contributors make up 0.04% of UK ODA: Other In-Donor Refugee Costs, Welsh Government and Colonial Pensions administered by FCDO.
5. Analysis of UK ODA spend by region/country
5.1 Regional / country breakdowns of bilateral ODA spend
Bilateral ODA (see case study section 4.3) includes ODA to specific countries or regions[footnote 15] (sections 5.1.1-5.1.4) as well as ODA to multiple countries and/or regions[footnote 16]. Also included is ODA to specific sectors for which there are no designated benefitting country or region, or where benefitting countries are not known until the end of the programme[footnote 17]
In 2021, 47.9% (£3,421m) of the UK’s bilateral ODA was allocated to a specific country or region. This is a reduction from 52.9% (£5,041m) in 2020, partly due to an increase in in-donor refugee costs which are not allocated to a benefitting country or region.
Figure 4: UK bilateral ODA by recipient region (£ millions), 2009 to 2021
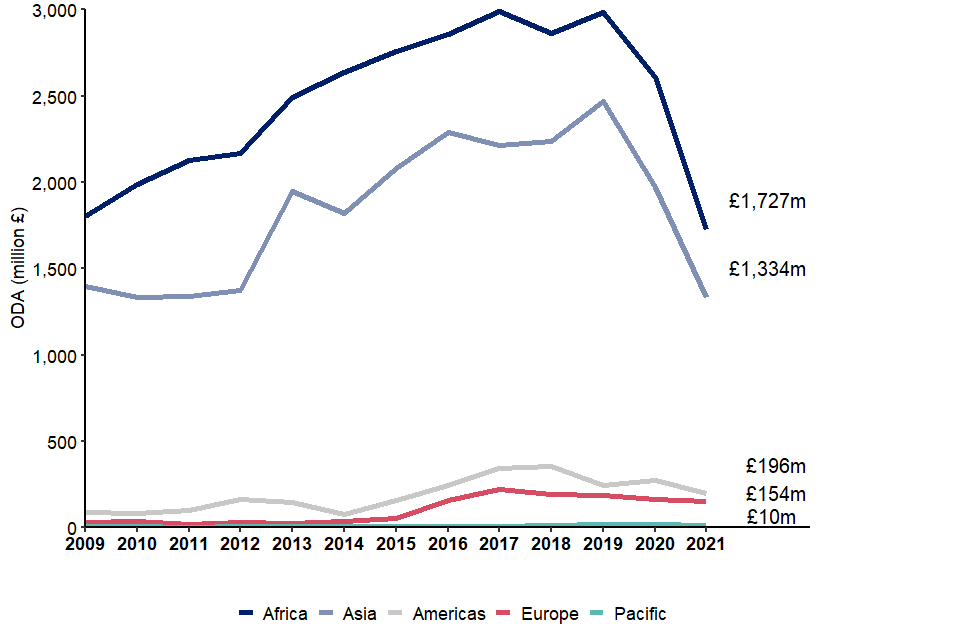
Figure 4 legend: UK bilateral ODA by receiving region (£ millions), 2009 – 2021. Dark blue = Africa, light blue = Asia, grey = Americas, pink = Europe, teal = Pacific.
5.1.1 Changes in UK bilateral ODA by region
5.1.1.1 Africa
2021:
As a region, Africa continues to receive the largest proportion of UK bilateral ODA allocated to a specific country or region (50.5%). Bilateral ODA to Africa decreased by £883 million (33.8%) from £2,610 million in 2020 to £1,727 million in 2021 (Figure 4). The sector that experienced the largest decrease in spend was the humanitarian aid sector, and the country that experienced the largest country-specific[footnote 18] decrease in spend was Ethiopia.
Over 5 years:
Africa has consistently received the largest amount of UK ODA allocated to a specific country or region. Apart from a slight increase in 2019, bilateral ODA to Africa has been decreasing from 2017. In 2021, bilateral ODA received by Africa fell to similar levels as in 2012 (£1,960m).
5.1.1.2 Asia
2021:
In 2021, Asia remains the second largest recipient of UK bilateral ODA in 2021 with 39.0% (down from 39.2% in 2020). The volume of bilateral ODA to Asia was £1,334 million in 2021, a decrease of £639 million (32.4%) compared to 2020 (Figure 4). The sector that experienced the largest decrease was humanitarian aid, and the largest decrease in country-specific ODA was experienced by Bangladesh (reduction of £116m from 2020).
Over 5 years:
Similar to Africa, apart from a £233 million increase from 2018 to 2019, bilateral ODA to Asia has been decreasing since 2017. The £639 million reduction between 2020 and 2021 leads to ODA volumes similar to the amounts reported for 2009 to 2012 (average of £1,328m).
5.1.1.3 The Americas
2021:
The Americas received £196 million of UK bilateral ODA in 2021, a decrease of £77 million or 28.1% compared to 2020 (Figure 4). The sector that experienced the largest decrease was Production Sectors (£35m). ODA spent in the America’s accounted for 5.7% of country or region specific bilateral ODA.
Over 5 years:
UK ODA to the Americas is on a smaller scale than to Africa or Asia. After an increase in 2019 to 2020, bilateral ODA to the Americas has decreased again in 2021.
5.1.1.4 Europe
2021:
Europe received £154 million of UK bilateral ODA in 2021, a decrease of £12 million compared to the previous year (Figure 4). The largest country-specific reduction was seen in Turkey (£14m decrease from 2020). The largest sector reductions were observed in Commodity and General Programme Assistance, and Other Social Infrastructure and Services (total of £9m decrease from 2020). ODA spent in Europe accounted for 4.5% of country or region specific bilateral ODA.
Over 5 years:
Like the Americas, ODA spend in Europe[footnote 19] is small compared to Asia and Africa. Bilateral ODA to Europe hit a high point in 2017 of £223 million, partly driven by support for displaced refugees during the Syria Crisis, and since then has been steadily decreasing.
5.1.1.5 Pacific
A small proportion of UK bilateral ODA goes to the Pacific (Figure 4). In 2021, UK bilateral ODA to the region was £10 million, 0.3% of total UK bilateral ODA spend allocated to a region or country. This is a decrease of £9 million from 2020, with Fiji being the largest country specific recipient.
5.1.2 Bilateral ODA spend by country
In 2021, the UK provided bilateral assistance to 132 countries (Figure 5, broadly the same number as previous years), with spend primarily concentrated in East Africa and the Middle East.
Figure 5 Map of UK bilateral ODA spend by recipient country: 2021
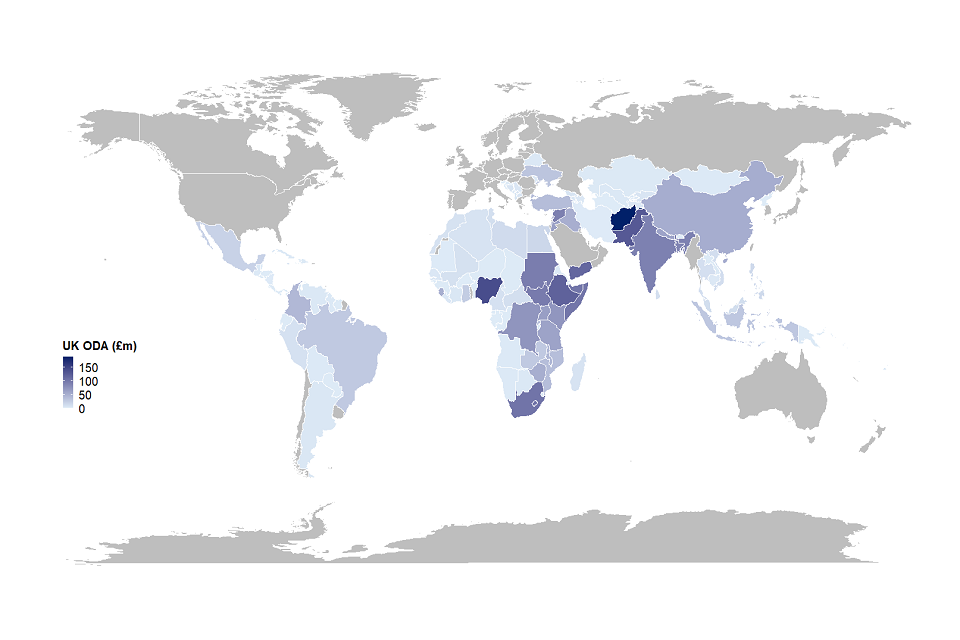
Figure 5 legend: World Map coloured by amount of bilateral ODA spend in recipient country (£ million) in 2021. Highlighted countries are those in receipt of UK bilateral ODA, and colours are based on amount received (dark blue=higher amounts UK Bilateral ODA received, light blue=lower amounts UK Bilateral ODA received).
5.1.2.1 Top 5 country-specific recipients of UK ODA
- UK bilateral ODA spend to the top 5 recipient countries (out of a total of 132 countries) in 2021 decreased from £1,174 million in 2020 to £689 million in 2021. They received around a quarter (24.5%) of the total country-specific UK bilateral ODA in 2021, slightly less than in 2020 (27.7%) (Figure 6)
- in 2021 the top 3 recipients of UK bilateral country specific ODA were Afghanistan (£187m), Nigeria (£140m) and Pakistan (£128m) (Figure 6). Spend to these countries accounted for 16.2% of total country-specific UK bilateral ODA
- Afghanistan has become the top recipient of UK bilateral ODA in 2021, after being the fourth largest recipient in 2020. This coincides with the humanitarian crisis and Taliban takeover. Compared to the other top 5 recipients, Afghanistan experienced the smallest bilateral ODA decrease in 2021 (£38m). Afghanistan has been in the top 5 since 2015, although 2021 is the first time it is the top recipient
- of the top 5 recipients, Ethiopia experienced the largest country-specific decrease (£134m) and is now the fourth largest recipient in 2021 (Figure 7)
- Nigeria remains the second largest recipient of bilateral ODA in 2021 despite a continued decline in ODA since 2017, and a decrease of £100 million from 2020
- in 2021, the amount of bilateral ODA to Pakistan decreased by £72 million from 2020 (Figure 6), steadily decreasing year on year from a 10 year high in 2016. Pakistan experienced the second smallest decrease of the top 5 recipient 2021 countries, resulting in it becoming the third largest country-specific recipient
- the UK provided £120 million of bilateral ODA to Ethiopia, a £134 million reduction from 2020, making it the fourth largest recipient of UK ODA in 2021
Yemen remained the fifth largest bilateral ODA recipient in 2021, with a £107 million decrease from 2020. Bilateral ODA to Yemen has generally maintained an upward trajectory since 2009, apart from a brief decrease in 2018, however since 2019 levels have decreased (Figure 6).
Figure 6: Top 5 country-specific bilateral ODA recipients, 2009 to 2021
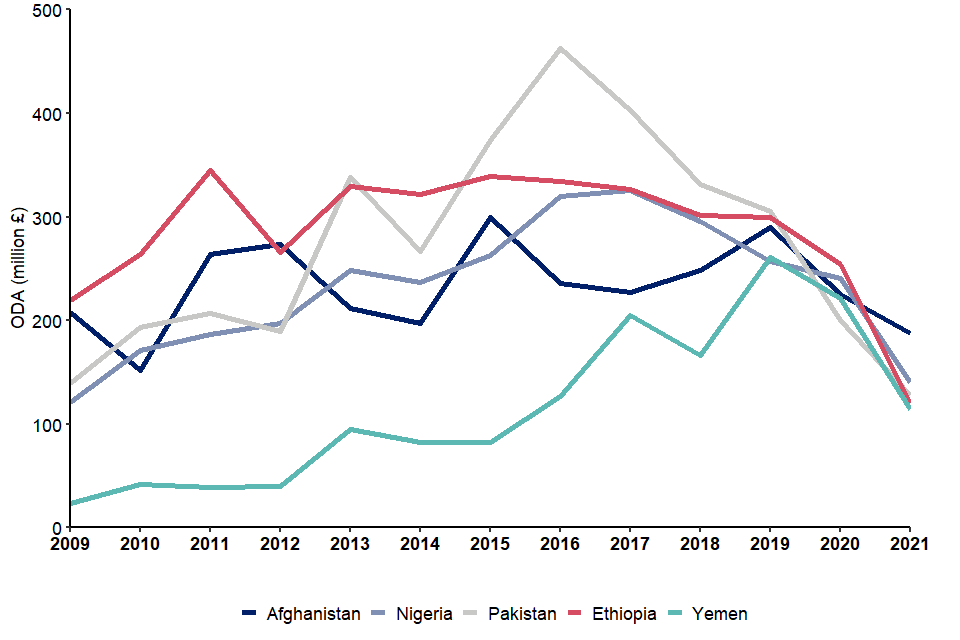
Figure 6 legend: Top 5 Recipients of 2021 UK Bilateral ODA (£ millions), 2009 to 2021. Dark blue = Afghanistan, light blue = Nigeria, grey = Pakistan, pink = Ethiopia, teal = Yemen.
5.1.2.2 Other major changes in top 10 country-specific rankings
- South Africa moved up by 22 places from 2020 to be in the top 10 in 2021 for the first time. Spend to South Africa increased by £54.2 million from 2020, due in part to a £64.3 million UK Climate Investments (UKCI) expenditure by BEIS
South Sudan and Sudan each moved up 1 place, while Somalia and Syria moved down in the top 10 rankings. This is because ODA decreased to a lesser extent in South Sudan and Sudan (£60m and £45m respectively) compared to in Somalia and Syria (£132m and £90m respectively).
Cast Study: Afghanistan (infographic)
Figure 7: Top 10 recipients of country-specific UK bilateral ODA in 2021
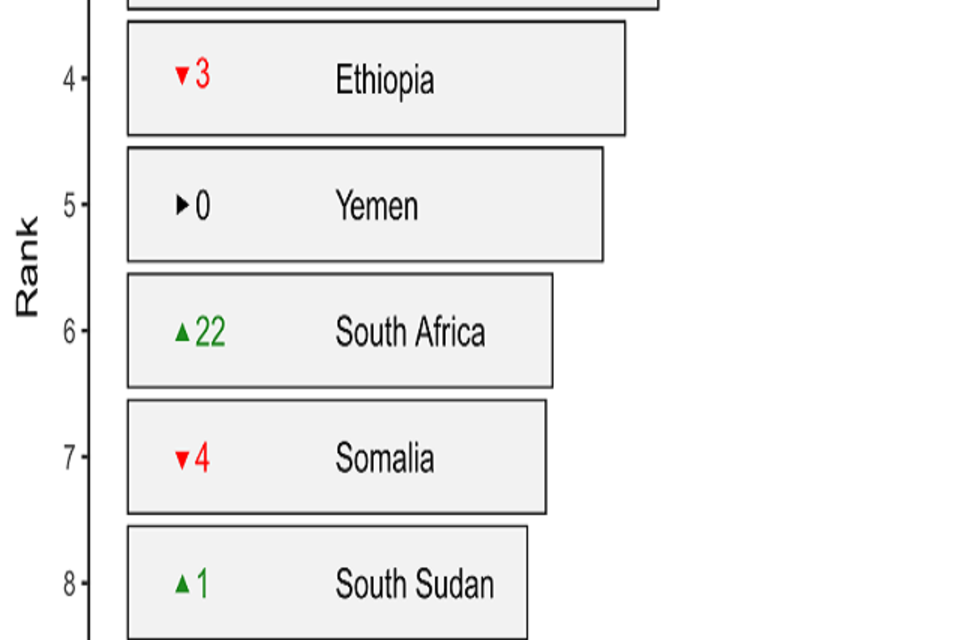
Figure 7 legend: Top 10 Recipients of UK Bilateral ODA in 2021[footnote 20]. The rank (1:10) is on the y-axis, ODA spend (million £) is on the x-axis. The country names and numbers inside each bar are how the rank for that country compared to last year (2020), coloured in red if it’s decreased (with a red downward pointing arrow), green if it’s increased (with a green upward pointing arrow) and black if its unmoving (with black horizontal pointing arrow). For example, Afghanistan in 2020 was in 4th position, and in 2021 is in 1st position (a change of +3).
5.1.4 Income groups
Country income groups
ODA eligible countries are classified into 4 groups – Least Developed Countries (LDC), Other Low-Income Countries (Other LIC), Lower Middle Income Countries (LMIC) and Upper Middle Income Countries (UMIC). The threshold for each income group is based on gross national income per capita published by the World Bank. The list of countries is reviewed every 3 years by the OECD-DAC, and countries exceeding the high-income threshold for 3 consecutive years are no longer ODA eligible.
5.1.4.1 Income groups: country-specific ODA
- LDCs and Other LICs continue to account for the largest proportion of bilateral country-specific ODA spend in 2021 – at 50.8%. UK ODA to UMICs represented 19.9% of UK country-specific bilateral ODA in 2021 compared to 16.0% in 2020
- total UK bilateral ODA received by LDCs and Other LICs decreased by 40.2% (£963m) from £2,393 million in 2020 to £1,430 million in 2021 (Figure 8)
- in terms of volume, 6 of the top 10 largest decreases in ODA to specific countries compared to 2020 were seen in LDCs or Other LICs (Ethiopia, Somalia, Bangladesh, Yemen, Democratic Republic of the Congo and South Sudan). Four of these countries were still in the top 10 recipients of bilateral ODA in 2021 (Ethiopia, Somalia, Yemen and South Sudan)
- total UK bilateral ODA received by LMICs decreased by 29.1% compared to 2020, dropping by £339 million
- total UK bilateral ODA received by UMICs decreased by £117 million (17.3%) to £560 million in 2021
Figure 8: Country-specific bilateral ODA by income group, 2009 to 2021
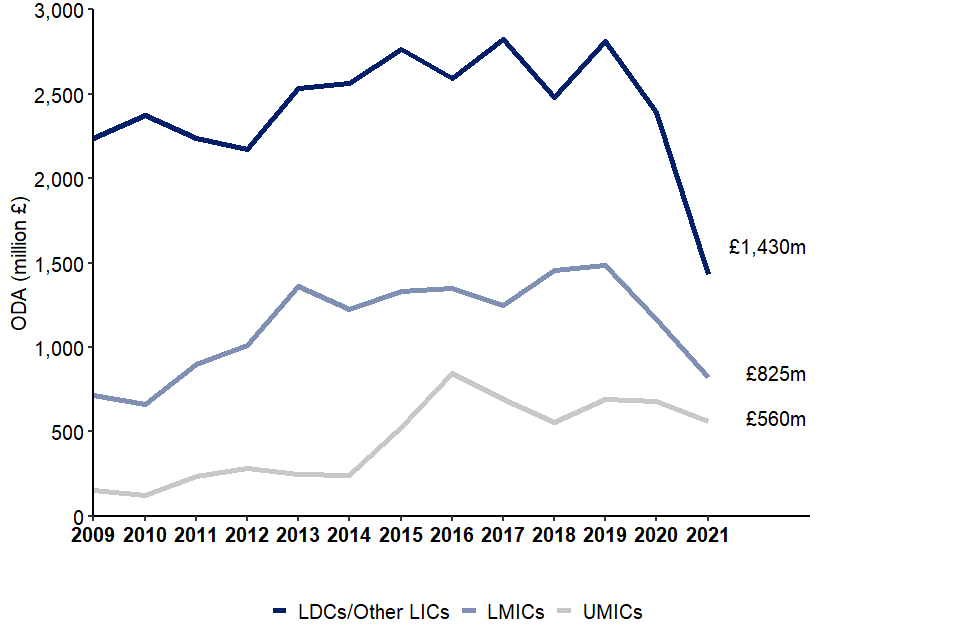
Figure 8 legend: Breakdown of Country-Specific UK Bilateral ODA by Country Income Group, 2009-2021. Dark blue = LDCs/Other LICs (Least Developed Countries/Other Low Income Countries), light blue = LMICs (Lower Middle Income Countries), grey = UMICs (Upper Middle Income Countries).
5.1.4.2 Income groups: FCDO - non-FCDO comparison 2021
- FCDO spent £2,232 million of UK bilateral country-specific ODA - accounting for 79.3% of total UK bilateral country-specific ODA in 2021 (Figure 9A)
- the majority of FCDO’s country-specific ODA was provided for the benefit of LDCs or Other LICs in 2021 – 58.1% (£1,298m)
- non-FCDO contributors spent £584 million of UK bilateral country-specific ODA in 2021 (Figure 9B), a £150 million decrease compared to 2020. The majority of non-FCDO country-specific ODA was channelled to Middle Income Countries – 77.3% (£196m to LMICs and £255m to UMICs)
- LDCs and Other LICs received £132 million of non-FCDO bilateral ODA in 2021, a decrease of £91 million compared to 2020
Figure 9: Breakdown of country-specific bilateral ODA by income group, 2021
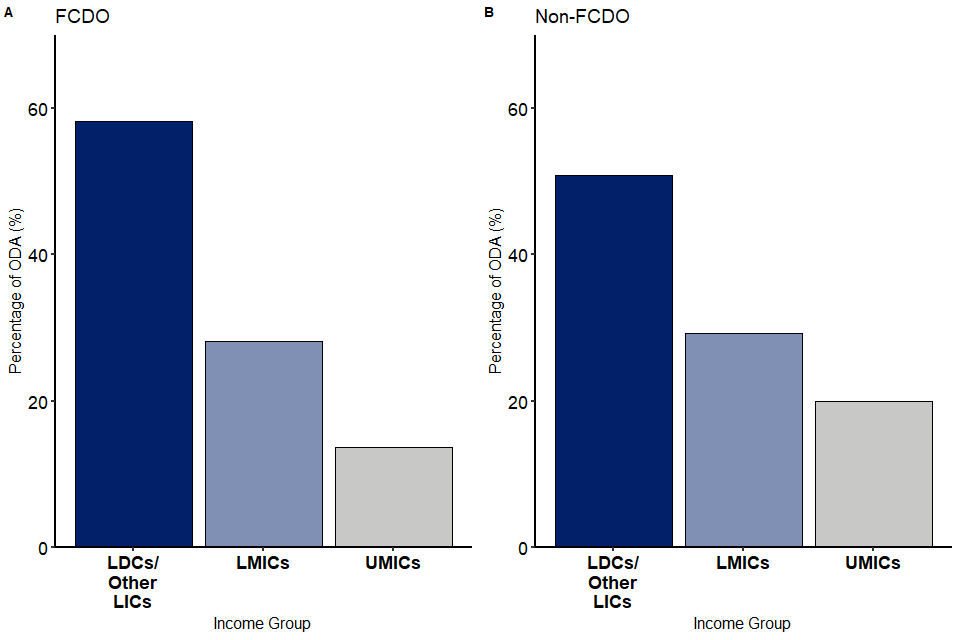
Figure 9 legend: (A) FCDO and (B) non-FCDO. Breakdown of Country-Specific UK Bilateral ODA by Country Income Group, 2021. Dark blue = LDCs/Other LICs (Least Developed Countries/Other Low Income Countries), light blue = LMICs (Lower Middle Income Countries), grey = UMICs (Upper Middle Income Countries).
5.1.5 Bilateral ODA spend by region and government department and other contributors of UK ODA
In 2021, 93.3% of FCDO’s region-specific bilateral ODA went to countries in Africa and Asia (£2,432m). Africa has consistently been the largest recipient of FCDO region-specific ODA, with a share of 52.4% in 2021 (see Figure 10A).
Until 2021, Asia has been the largest recipient of non-FCDO region-specific ODA (Figure 10B). Since 2016 Africa and Asia have steadily become more similar in terms of ODA split, and now in 2021 Africa is the largest recipient. In 2021, non-FCDO ODA contributors spent £360 million in Africa and £269 million in Asia, accounting for 44.2% and 33.0% of their total region-specific spend respectively. Non-FCDO contributors also spent a larger proportion of their ODA in Europe and the Americas (22.4%), compared to FCDO (6.4%).
Compared with 2017 (5 years ago), the percentage share of FCDO’s region-specific bilateral ODA received by Africa and Asia remains broadly similar (Africa decreased by 3.2 percentage points; Asia increased by 3.8 percentage points).
A stronger pattern emerges from non-FCDO contributors, with Africa’s share of non-FCDO region specific bilateral ODA in 2021 increasing by 15.6 percentage points compared to 2017, while the share received by Asia decreased by 12.6 percentage points over the same period.
Figure 10: Breakdown of region-specific UK bilateral ODA, 2017 and 2021
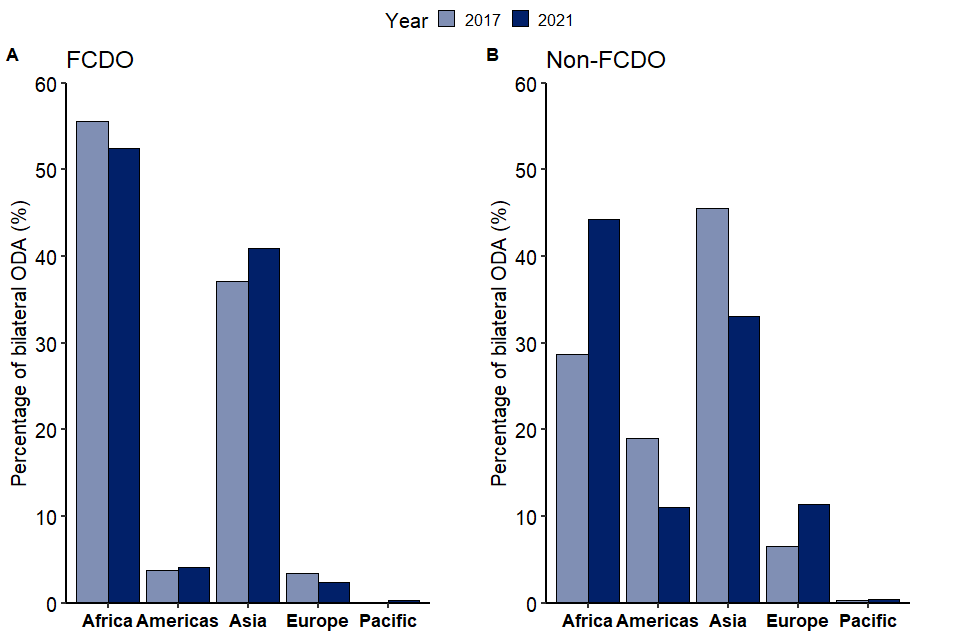
Figure 10 legend: Breakdown of FCDO (A) and Non-FCDO (B). Country/region-Specific proportion of Bilateral ODA by Region, 2017 & 2021. In light blue are the proportions of UK bilateral ODA by region in 2017, in dark blue are the proportions of UK bilateral ODA by region in 2021. Different regions are on the horizontal axis (Africa, Americas, Asia, Europe, Pacific).
5.1.6 Bilateral ODA spend with no single benefitting country or region
In 2021, 52.1% (£3,725m) of UK bilateral ODA was made up of spend that was not assigned to a single benefitting country or region (i.e. developing country, unspecified ODA) (Figure 11, Table C8). This is an increase in percentage share but not in volume of spend compared to 2020, when £4,491m (47.1%) of bilateral ODA was not assigned to a single benefitting country or region. The percentage share was around 33-34% from 2014 to 2017; from 2018 it has steadily increased. 2021 is the first year in which a greater share of bilateral ODA spend was not assigned to a single benefitting country or region.
Such spend comprises of, for example, centrally-funded research or programmes that develop policies which aim to benefit several developing countries. It also consists of ODA-eligible expenditure within donor countries, such as the ODA-eligible portion of costs to support asylum seekers and refugees in the UK. See the case study in SID 2018 (PDF, 1.4 MB) (p.34) for more information on ‘Developing country, unspecified’ ODA.
- 39.1% of spend within this category consists of expenditure in the UK or another donor country (e.g. support for international development work or asylum seekers/recognised refugees in the UK or another donor country). This is an increase compared to 2020 when 24.8% of spend fell in this category, caused by an increase in in-donor refugee costs.
- 35.3% of spend within this category consists of project-type interventions (type of aid code C01) and includes expenditure on multi-country or multi-region projects. As outlined above, these include programmes where there are designated benefitting countries or regions, but it is not possible to directly assign exact spend to them in the current administrative system
- 10.7% was for specific programmes or funds managed by international organisations in a specific sector with no designated benefitting countries
- 8.2% was classed as ‘Other’, which includes Other Technical Assistance (includes training and research), Basket Funds and Debt Relief. For example, the Cabinet Office contributed £18 million towards the COP26 conference in 2021, difference between provisional and final publications
- a further 6.7% consists of core support to Non-Governmental Organisations (NGOs) or other delivery partners, such as research institutions, where funds are not earmarked for a particular country/region and work may benefit a wide range of developing countries
Figure 11: Breakdown of UK 2021 non-region-specific bilateral ODA
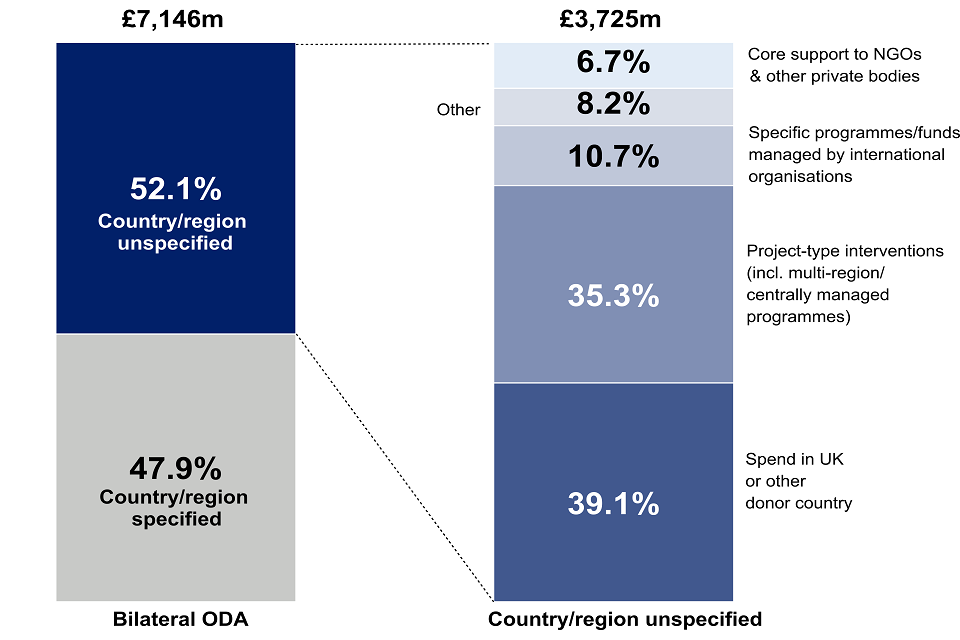
Figure 11 legend: Breakdown of UK non-region-specific bilateral ODA, 2021. Total bilateral ODA = £7.1 billion, of which £3.7 billion (52.1%) is spent in unspecified countries/regions. “Spend in UK or other donor country” includes donor country personnel, scholarships/training in donor country, admin costs not included elsewhere, development awareness and refugees/asylum seekers in donor countries (D01, E01, G01, H01, H02). “Other” includes basket funds/pooled funding, other technical assistance, and debt relief (B04, D02, F01).
6. Analysis of UK ODA spend by sector
6.1 Bilateral ODA spend by sector in 2021
UK ODA is classified into sectors according to its purpose, e.g. the social, economic or humanitarian assistance area it aims to support. There are multiple levels of sector classification used: at the lowest level are sector codes[footnote 21] that describe specific areas; these are then grouped together into OECD DAC broad sectors. These broad sectors can then be further grouped into major sectors, bringing together related themes to help simplify the key messages. See Annex 1 (PDF, 268 KB) for more information on what is included in each sector level.
Figure 12: Bilateral ODA by major sector, 2020 and 2021
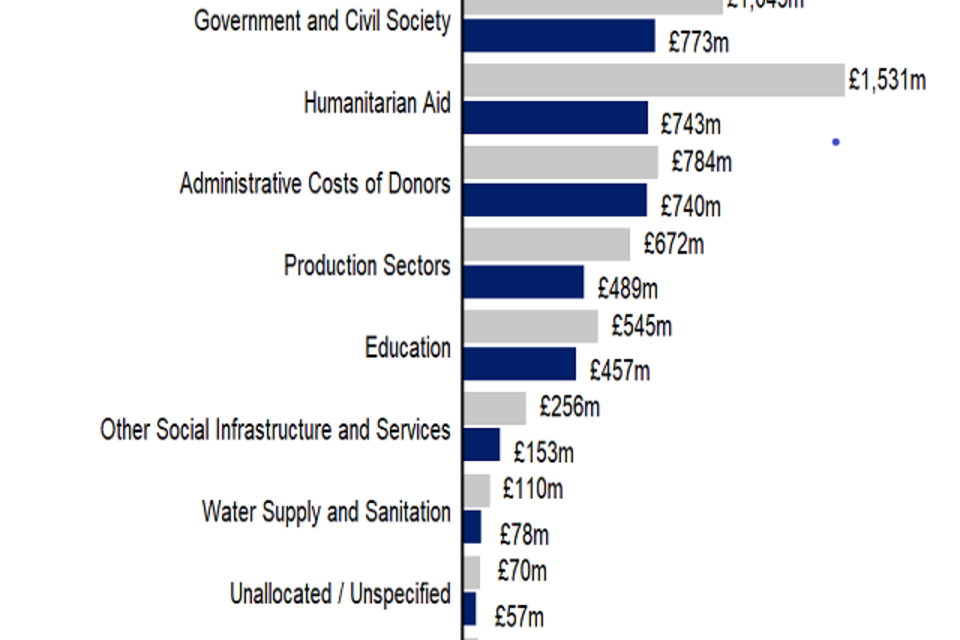
Figure 12 legend: Major Sector Spend – comparison between 2020 and 2021 bilateral ODA (£ millions). Major sectors are ordered from top to bottom by largest 2021 ODA spend. 2021 spend coloured in dark blue, 2020 spend in grey.
Figure 12 provides an overview of bilateral ODA by major sector in 2021 and shows that UK ODA is spent across a broad range of sectors.
In 2021, UK ODA spend decreased across all sectors, with the exception of ‘Refugees in Donor Countries’ which saw an increase of 67.6%. The top 5 sectors were ‘Refugees in Donor Countries’ (£1,052m), ‘Health’ (£970m), ‘Economic Infrastructure & Services’ (£820m), ‘Multisector/Cross-cutting’ (£795m) and ‘Government and Civil Society’ (£773m).
Outside of the top 5 sectors, the largest changes between 2020 and 2021 were in the Humanitarian sector (decreased by £788m, 51.5%), production sectors (down £183m, 27.3%) and Education (down £87m, 16.1%).
A more detailed breakdown of the broad sectors is given in Additional Table A7.
‘Refugees in Donor Countries’ was the largest sector (14.7%) to receive UK bilateral ODA in 2021.
Impact of ‘refugees in donor countries’ sector on UK ODA trends
The ‘Refugees in Donor Countries’ sector covers “costs incurred in donor countries for providing basic assistance to asylum seekers and refugees from developing countries during the first 12 months of their stay”[footnote 22].
In 2021, £1,052 million of UK ODA (14.7% of total bilateral ODA) was spent supporting ‘refugees in donor countries’[footnote 23] compared to £628 million in 2020. The increase was primarily driven by an increase in Home Office ODA spend, partly due to increased accommodation costs for the rising number of asylum seekers coming to the UK (£756m in 2021).
This was the largest sector to receive UK bilateral ODA spend in 2021 (Figure 12) and is the first time this sector has been in the UK’s top 5 sectors, as a result of spend increasing in this sector while it decreased in all others.
Note that ODA spent in this sector is not assigned to a developing country or region, since it is spent in donor countries. This spend therefore contributes to the increased volume of ODA that is not country-region specific in Figure 11.
Health was the second largest sector (13.6%) to receive UK bilateral ODA spend in 2021, though it decreased by £620m (39.0%) compared to 2020. Part of this decrease is due to reduced levels of spend to the health sector in response to Covid-19 in 2021 compared to 2020. Health was the top spend area in 2018 and 2020 and came second to Humanitarian Aid in 2017 and 2019. Within Health, the top spending areas in 2021 were Medical Research (£252m) and COVID-19 control (£186m)[footnote 24].
Economic Infrastructure & Services[footnote 25] was the third largest sector and saw a decrease of £113 million (12.1%) of ODA reported in 2021 compared to 2020. Within this sector, a large proportion of spend in 2021 was on Financial Policy and Administrative Management (£390m).
6.2 Broad sector breakdown of bilateral ODA spend by government department and other contributors of UK ODA
Figure 13 provides a breakdown of sector spend by FCDO and all Other Government Departments and other contributors of ODA (non-FCDO).
- for FCDO, the sector spend profile shows greater spend in the social and disaster response sectors, such as Humanitarian Aid (£737m) and Health (£652m). FCDO also contributed £647 million to ‘Economic Infrastructure and Services’. The next largest sector spend was £639 million on the ODA-eligible portion of FCDO’s administrative costs (‘Administrative costs of donors’)
- non-FCDO spend overall is on a smaller scale but includes the total spend on ‘Refugees in Donor Countries’ (£1,052m) which was the largest UK ODA sector in 2021
Figure 13: Bilateral ODA by government department and major sector, 2021
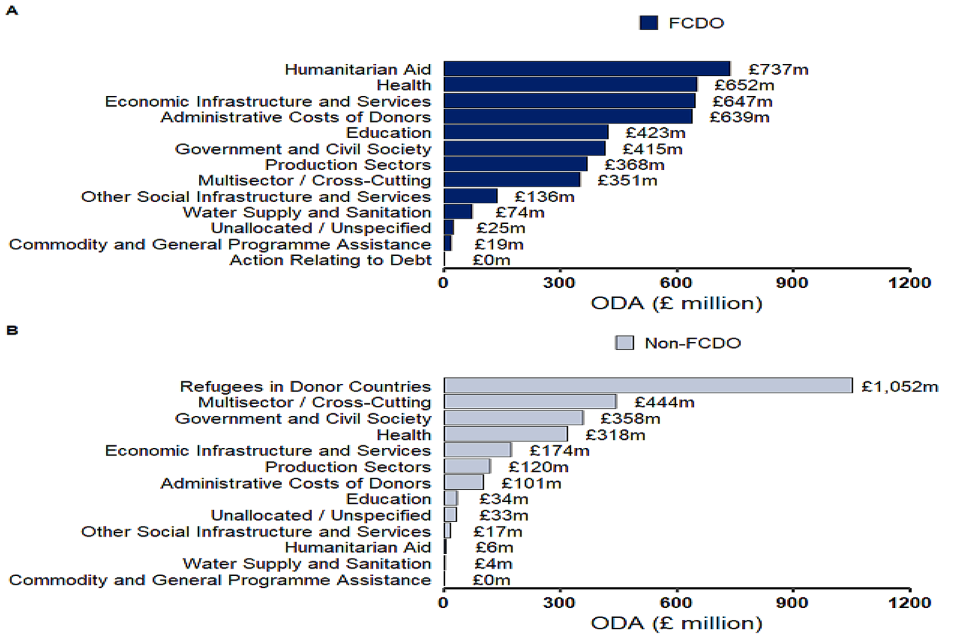
Figure 13 legend: A) FCDO and B) Other Government Departments’ and Other Contributors of ODA (non-FCDO – grey) spend by sector, 2021 (£ million). Major sectors are ordered from top to bottom by largest 2021 ODA spend.
6.3 Sector breakdown of bilateral ODA spend by top 10 recipients of UK bilateral ODA
Figure 14 provides an overview of the highest spending sector for each of the top 10 recipient countries of UK bilateral ODA in 2021. The size of the circles indicates the amount of ODA spent on that sector in that country relative to the other sectors and other countries.
Figure 14: Bilateral ODA by largest major sector for the top 10 country-specific ODA recipients, 2021
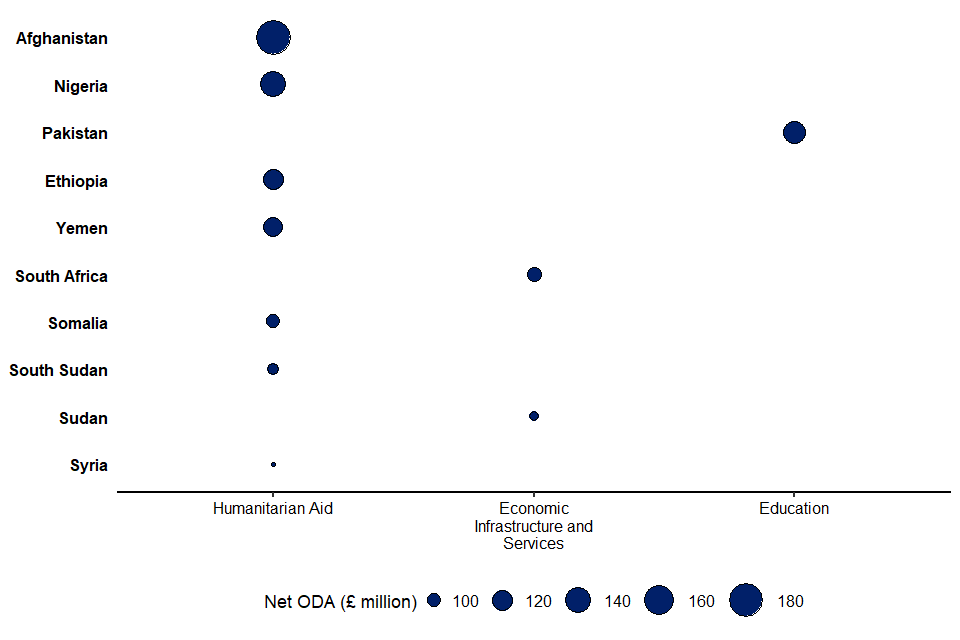
Figure 14 legend: Top 10 recipients of UK country-specific bilateral ODA 2021 and largest sector spend (£ millions). The size of the circles corresponds to the total amount of ODA spent in each country sector.
- the sector Humanitarian Aid received the largest amount of UK ODA in 7 of the top 10 recipient countries in 2021 (Figure 14)
- in Afghanistan, Humanitarian Aid was the largest sector in 2021 (£136m). Prior to this, Government and Civil Society has consistently been the largest sector in Afghanistan
- in Nigeria, Humanitarian Aid has been the top spending sector since 2018, where previously Health was the largest sector. In 2021, £38 million was spent on Humanitarian Aid in Nigeria
- Pakistan has been in the top 10 since 2009, with Education being the largest sector since 2013
Figure 15: Bilateral ODA by income group for the major sectors, 2021
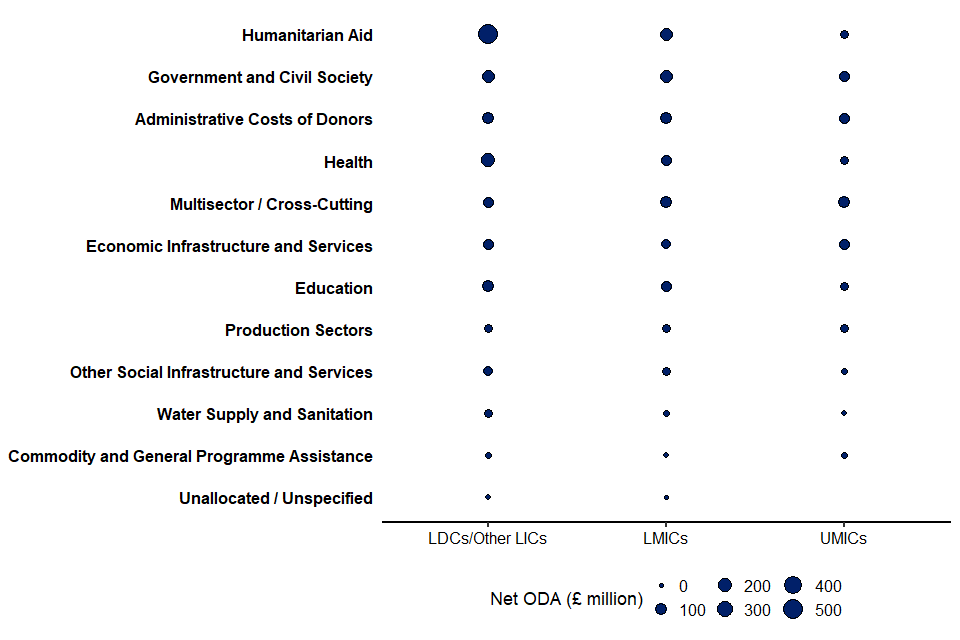
Figure 15 legend: Comparison of sector spend for 2021 UK bilateral ODA between countries of different income groups (£ million). The size of the circles corresponds to the total amount of ODA spent in each income groups sector.
Figure 15 summarises the differences in the main sectors of 2021 UK bilateral ODA spend between countries of different income groups. Least Developed Countries (LDCs/Other LICs) received more Humanitarian Aid (£514m, 36.0% of total bilateral ODA to LDCs/Other LICs) and Health support (£201m, 14.0% of total bilateral ODA to LDCs/Other LICs), whereas spend and share in these sectors was much lower for Middle Income Countries (Upper and Lower) (£171m and 12.4% of total bilateral ODA to MICs for Humanitarian Aid, £119m and 8.6% of total bilateral ODA to MICs for Health). ‘Government and Civil Society’ was the top sector for MICs in 2021 (£248m, 17.9% of total bilateral ODA to MICs), followed by ‘Multisector/Cross-Cutting’ sectors (£215m, 15.5% of total bilateral ODA to MICs). For MICs, spend is more evenly distributed across the sectors compared to LDCs.
7. Multilateral funding
7.1 UK Multilateral funding by organisation
Multilateral organisations [footnote 26] are an essential part of the international system for humanitarian and development ODA. The UK works with a wide range of organisations, for example to: respond to humanitarian need; develop infrastructure; support economic growth; or ensure that particular diseases are tackled in line with the best available evidence. Multilateral organisations offer economies of scale in their operations and expertise, and often have the mandate and legitimacy to work in politically sensitive situations. Accordingly, they enable individual donor governments, such as the UK, to support development and humanitarian work in a wider range of countries.
Table 3 below shows the 20 multilateral organisations that received the most core funding (referred to as “Multilateral ODA”) from the UK in 2020 and 2021. Core contributions will fluctuate year-to-year in part due to the payment schedules of the receiving multilateral organisation.
- the amount of UK ODA to the top 5 multilaterals represented 61.2% of total multilateral ODA in 2021
- the EU remains the recipient of the largest core contribution from the UK. The UK’s share of the EU ODA budget in 2021 was £684 million compared to £1,149 million in 2020. EU attribution fluctuates from year to year because the EU works on a 7 year programming cycle and so EU disbursements in any given year can vary. The UK’s share of EU ODA spend (European Development Fund and the Development share of the EU Budget), will continue on a declining scale until approximately 2029, in line with UK commitments
Gavi, the Vaccine Alliance (Gavi) received £222 million from FCDO in 2021, an increase of £22 million from 2020. This funding supported Gavi to restore immunisation services affected by the pandemic, and to - strengthen health systems to increase their resilience to COVID-19 and future disease outbreaks. - the 5 organisations in receipt of the highest volumes of UK multilateral ODA were the same in 2021 as they were in 2020, although the EU Development Fund contribution has moved from fifth to third largest recipient and received the largest increase from 2020 (£268m). The second and third largest increases from 2020 were World Health Organisation (£93m) and Clean Technology Fund (£88m)
Table 3: Top 20 recipients of UK core funding to multilateral organisations (multilateral ODA)[footnote 27]
2021
| Rank | Multilateral | Multilateral ODA (£ millions) | % share of total |
|---|---|---|---|
| 1 | European Commission - Development Share of Budget | 684 | 16.0% |
| 2 | International Development Association | 670 | 15.7% |
| 3 | European Commission - European Development Fund | 635 | 14.8% |
| 4 | Global Fund to Fight AIDS, Tuberculosis and Malaria | 380 | 8.9% |
| 5 | Green Climate Fund | 281 | 6.6% |
| 6 | Global Alliance for Vaccines and Immunization | 222 | 5.2% |
| 7 | International Monetary Fund - Poverty Reduction and Growth Trust | 204 | 4.8% |
| 8 | African Development Fund | 177 | 4.1% |
| 9 | International Finance Facility for Immunisation | 140 | 3.3% |
| 10 | World Health Organisation - core voluntary contributions account | 98 | 2.3% |
| 11 | Clean Technology Fund | 88 | 2.1% |
| 12 | Central Emergency Response Fund | 64 | 1.5% |
| 13 | Global Environment Facility Trust Fund | 63 | 1.5% |
| 14 | United Nations | 50 | 1.2% |
| 15 | International Bank for Reconstruction and Development | 40 | 0.9% |
| 16 | International Finance Corporation | 38 | 0.9% |
| 17 | World Food Programme | 37 | 0.9% |
| 18 | African Development Bank | 35 | 0.8% |
| 19 | Asian Development Fund | 29 | 0.7% |
| 20 | United Nations Office of the United Nations High Commissioner for Refugees | 29 | 0.7% |
2020
| Rank | Multilateral | Multilateral ODA (£ millions) | % share of total |
|---|---|---|---|
| 1 | European Commission - Development Share of Budget | 1,149 | 23.2% |
| 2 | International Development Association [note 2] | 920 | 18.6% |
| 3 | Global Fund to Fight AIDS, Tuberculosis and Malaria | 476 | 9.6% |
| 4 | Green Climate Fund | 450 | 9.1% |
| 5 | European Commission - European Development Fund | 368 | 7.4% |
| 6 | International Monetary Fund - Poverty Reduction and Growth Trust | 255 | 5.2% |
| 7 | Global Alliance for Vaccines and Immunization | 200 | 4.0% |
| 8 | African Development Fund | 176 | 3.6% |
| 9 | International Finance Facility for Immunisation | 129 | 2.6% |
| 10 | Central Emergency Response Fund | 66 | 1.3% |
| 11 | United Nations Development Programme | 55 | 1.1% |
| 12 | United Nations Children’s Fund | 48 | 1.0% |
| 13 | United Nations | 48 | 1.0% |
| 14 | International Bank for Reconstruction and Development | 45 | 0.9% |
| 15 | United Nations Relief and Works Agency for Palestine Refugees in the Near East | 43 | 0.9% |
| 16 | World Food Programme | 40 | 0.8% |
| 17 | Global Environment Facility - Special Climate Change Fund | 38 | 0.8% |
| 18 | United Nations Office of the United Nations High Commissioner for Refugees | 35 | 0.7% |
| 19 | United Nations Department of Peace Operations – UN peacekeeping operation | 35 | 0.7% |
| 20 | International drug purchase facility | 33 | 0.7% |
[footnote 28] The UK may also provide funding to these organisations for specific programmes, which would be recorded as bilateral spend through a multilateral organisation. 2020 and 2021
7.2 UK multilateral funding by extending agency
Table 4 shows UK funding being channelled through and to multilaterals in 2017, 2020 and 2021 by government agency and delivery channel i.e. bilateral through multilateral ODA (earmarked funding) and core contributions to multilateral organisations (un-earmarked funding).
Core contributions to multilateral organisations:
- FCDO provided the majority of the UK’s core multilateral ODA, accounting for 86.3% (£3,690m), an increase in terms of FCDO’s percentage share on 2020, which was 75.7%, although a slight decrease in spend (£52m). This increase in FCDO’s percentage share can partly be attributed to the full UK Attribution of the development share of the EU budget now being reported under FCDO in 2021. This is in line with ODA allocations. Prior to 2021, the UK EU Attribution core contribution was partly reported by former DFID, and partly by non-DFID
- BEIS was the largest non-FCDO department to provide core multilateral ODA in 2021, accounting for 7.1% (£303m), this includes their core contribution to the Green Climate Fund (£194m)
- over the last 5 years, the share of UK core funding to multilateral organisations from non-FCDO contributors has fallen from 27.3% (£1,433m) in 2017 to 13.7% (£587m) in 2021
- non-FCDO contributors share in 2021 decreased by 10.6 percentage points on 2020, due largely to the change in EU budget reporting
A full breakdown of UK ODA by Government Department and Other Contributors of UK ODA and delivery channel in 2017, 2020 and 2021 is available online in Table 10.
Table 4: Multilateral funding, by government departments and other contributors, 2017, 2020 and 2021(*note 1)
| 2017[r] | 2020[r] | 2021[r] | ||||||||||
|---|---|---|---|---|---|---|---|---|---|---|---|---|
| Bi through multi | Bi through multi | Multilateral | Multilateral | Bi through multi | Bi through multi | Multilateral | Multilateral | Bi through multi | Bi through multi | Multilateral | Multilateral | |
| £m | % ODA | £m | % ODA | £m | % ODA | £m | % ODA | £m | % ODA | £m | % ODA | |
| Total Foreign, Commonwealth and Development Office (*note 2) | 2,320 | 88.1% | 3,823 | 72.7% | 2,415 | 89.7% | 3,742 | 75.7% | 1,133 | 82.3% | 3,690 | 86.3% |
| Of which: EU Attribution (*note 3) | 0 | 0.0% | 439 | 8.4% | 0 | 0.0% | 522 | 10.6% | 0 | 0.0% | 684 | 16.0% |
| Total non-FCDO | 313 | 11.9% | 1,433 | 27.3% | 279 | 10.3% | 1,204 | 24.3% | 243 | 17.7% | 587 | 13.7% |
| Home Office | 10 | 0.4% | 0 | 0.0% | 0 | 0.0% | 0 | 0.0% | 18 | 1.3% | 0 | 0.0% |
| Department for Business, Energy and Industrial Strategy | 142 | 5.4% | 128 | 2.4% | 102 | 3.8% | 210 | 4.3% | 64 | 4.7% | 303 | 7.1% |
| Conflict, Stability and Security Fund (CSSF) | 139 | 5.3% | 70 | 1.3% | 124 | 4.6% | 80 | 1.6% | 109 | 7.9% | 46 | 1.1% |
| Department of Health and Social Care (*note 4) | 9 | 0.3% | 12 | 0.2% | 24 | 0.9% | 13 | 0.3% | 18 | 1.3% | 12 | 0.3% |
| Cross- Government Prosperity Fund | 11 | 0.4% | 0 | 0.0% | 25 | 0.9% | 0 | 0.0% | 10 | 0.7% | 0 | 0.0% |
| Department for Environment Food and Rural Affairs | 2 | 0.1% | 43 | 0.8% | 3 | 0.1% | 37 | 0.8% | 22 | 1.6% | 12 | 0.3% |
| Department for Work and Pensions | 0 | 0.0% | 8 | 0.2% | 0 | 0.0% | 8 | 0.2% | 0 | 0.0% | 9 | 0.2% |
| Department for Digital, Culture, Media and Sports | 0 | 0.0% | [low] | 0.0% | 0 | 0.0% | [low] | 0.0% | 0 | 0.0% | [low] | 0.0% |
| HM Revenue and Customs | [low] | 0.0% | 1 | 0.0% | 0 | 0.0% | 0 | 0.0% | 0 | 0.0% | 0 | 0.0% |
| Other contributors of UK ODA | ||||||||||||
| Other EU Attribution [note 3] | 0 | 0.0% | 445 | 8.5% | 0 | 0.0% | 600 | 12.1% | 0 | 0.0% | 0 | 0.0% |
| IMF Poverty Reduction and Growth Trust (PRGT) (*note 5) | 0 | 0.0% | 726 | 13.8% | 0 | 0.0% | 225 | 5.2% | 0 | 0.0% | 204 | 4.8% |
| Scottish Government | 0 | 0.0% | 0 | 0.0% | 0 | 0.0% | 0 | 0.0% | 2 | 0.1% | 0 | 0.0% |
| Total UK Net ODA | 2,633 | 100.0% | 5,256 | 100.0% | 2,693 | 100.0% | 4,945 | 100.0% | 1,376 | 100.0% | 4,277 | 100.0% |
[footnote 29] *Note 1. Figures may not sum to totals due to rounding.
*Note 2. FCDO figures are the total sum of former FCO and former DFID ODA spend.
*Note 3. From 2021, the full UK Attribution of the development share of the EU budget is reported under FCDO. This is in line with ODA allocations. Prior to 2021, the UK EU Attribution core contribution was partly reported by former DFID, and partly by non-DFID.
*Note 4. For this publication the basic health support for asylum seekers have been produced with a health unit cost (per capita cost) for 2021. “0” is null and “[low]” is less than half the smallest unit displayed. For a full breakdown of UK-ODA by government department and other contributors to UK ODA by delivery channel for 2017, 2020 and 2021 please see Table 10.
[r] Several minor revisions have been made to 2017, 2018, 2019 and 2020 data.
7.3 Multilateral core funding and imputed multilateral shares
When FCDO or other UK government departments provide core funding to multilateral organisations, the funding is pooled with other donors’ funding and disbursed as part of the core budget of the multilaterals. It is therefore not possible to directly track the use of UK core multilateral funding. However, to provide an indication of the destination and sector of UK multilateral ODA, overall percentages of ODA disbursements by the relevant multilateral organisations are used to impute a UK estimate.
The UK uses data on ODA spend by sector and country/region which is reported by each multilateral organisation to the OECD DAC to estimate what percentage of FCDO and UK core contributions are spent in each country and sector. Where a multilateral organisation does not report to the DAC but the multilateral is only mandated to work in a particular country, region or sector, we allocate all of its core contributions to the relevant country, region or sector. If a multilateral organisation does not report to the DAC but works in multiple sectors and/or countries, then its core contributions are not allocated to a country or sector.
The DAC publish detailed information of the multilaterals’ country and sector spending in December. Because of this timing the latest estimates that are available are for 2020. These shares should be taken as indicative estimates rather than exact amounts of funding, and they are dependent upon multilateral organisations returning disbursement data to the DAC.
The estimates for 2020 can be found in our published Table A9 and A10.
8. Comparisons between the UK and other international donors
Key definitions
Figures are based on provisional [footnote 30] 2021 ODA data from all 29 Development Assistance Committee (DAC) member countries26 except the UK, for which final 2021 ODA data is used.
Prices in nominal terms[footnote 31]: this represents ODA in the monetary value disbursed during year. It does not account for inflation and exchange rates. In most cases, nominal prices have been converted from US dollars (as published by the OECD) to pounds sterling. ODA totals between years will be affected by inflation and exchange rate fluctuations and therefore are not directly comparable.
Prices in real terms[footnote 32] : this represents how much money was disbursed each year, accounting for inflation and exchange rates. These figures provide a guide to actual purchasing power – they are adjusted from the original value so that $1 in a single year would buy the same amount of goods as $1 in every other year. Real term figures are presented as US dollars to remove exchange rate fluctuations. This means that ODA spending in different years are directly comparable. The figures included are fixed at 2020 prices.
8.1 ODA flows and ODA:GNI ratios by DAC donors
Figure 16: Total ODA from DAC donors, 2000 to 2021
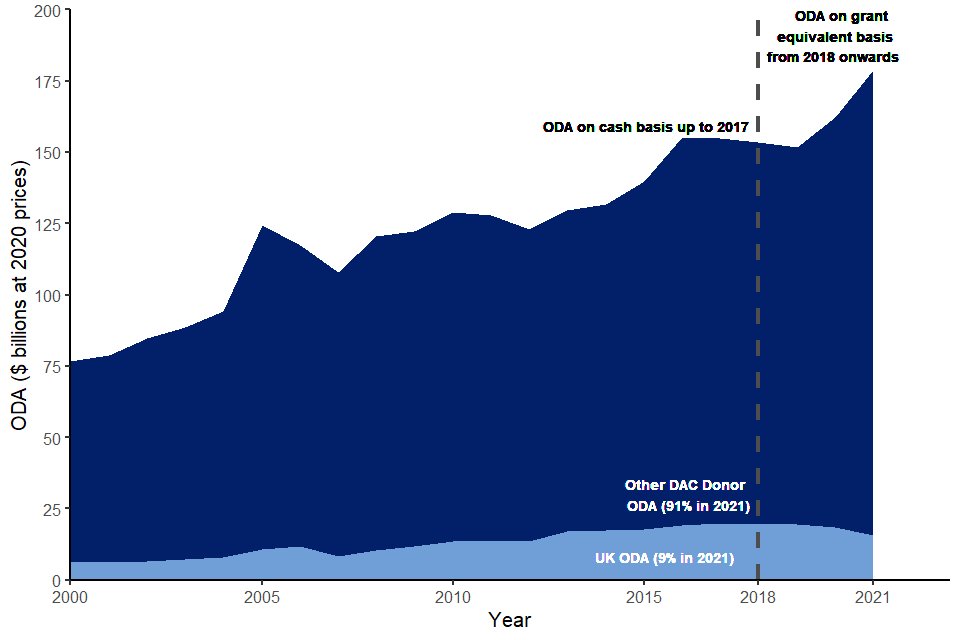
Figure 16 legend: Comparing the UK ODA (billion $) spend with other DAC donor countries for 2000 to 2021. The UK spend is highlighted in turquoise with the other donors in dark blue. This chart uses provisional 2021 spend for other DAC donors. ODA figures are in US dollars at 2020 prices to allow comparison between years.
In general, total ODA provided by DAC country donors has risen over the last decade, as shown in Figure 16. Net ODA is more than double the amount it was in 2000 in real terms. Total ODA from DAC country donors in 2021 was £130.1 billion (grant-equivalent measure[footnote 33]), an increase from £126.5 billion in 2020. Total ODA from DAC country donors in 2021 is the highest level on record. The OECD notes from the analysis of donors’ provisional 2021 ODA spend, that the main driver for the increase from 2020 is DAC members’ support for COVID-19 activities, particularly in the form of vaccine donations to respond to global vaccine inequities contribution to the global response to and recovery from the pandemic.
Figure 17 shows the UK being the fourth largest DAC donor in 2021 by value, falling from third place in 2020. This represents a reduction from £14.5 billion ODA in 2020 down to £11.4 billion in 2021, behind the United States (£30.8bn), Germany (£23.4bn) and Japan [footnote 34].
Figure 17: Provisional ODA from DAC donors, 2021
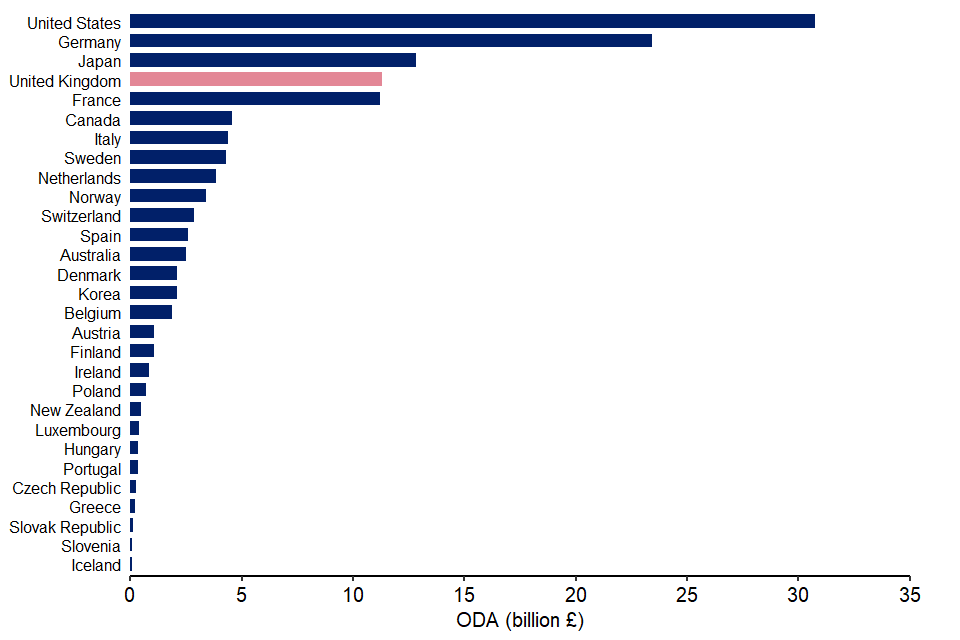
Figure 17 legend: Comparing the UK ODA (billion £) spend with other DAC donor countries in 2021. The UK spend is highlighted in pink with the other donors in dark blue. Note that provisional 2021 spend from other DAC donors is used in this chart.
Figure 18 shows ODA spend as a proportion of gross national income (GNI) in 2021. It highlights that although the United States spent the greatest volume of ODA of any DAC donor (£30.8bn), this represented a smaller share of its national income when compared with most other donors (0.18% of its GNI, in comparison with a DAC-wide ratio of 0.33%).
Luxembourg, Sweden and Norway each provided considerably less ODA than the United States in 2021, at £392 million, £4.3 billion and £3.4 billion respectively, but their ODA contributions each equate to over 0.9% of their national income. Sweden’s ODA:GNI ratio was 0.92% and Norway’s was 0.93%. Luxembourg had the highest ODA:GNI ratio at 0.99%.
Along with Luxembourg, Sweden and Norway, only Denmark (0.70%) and Germany (0.74%) met or exceeded the UN’s target of an ODA:GNI ratio of 0.7% in 2021, since the UK reduced its target to 0.5%. These same countries also met or exceeded the target in 2018, 2019 and 2020, alongside the UK.
Figure 18: DAC donors’ provisional ODA:GNI ratio, 2020 and 2021
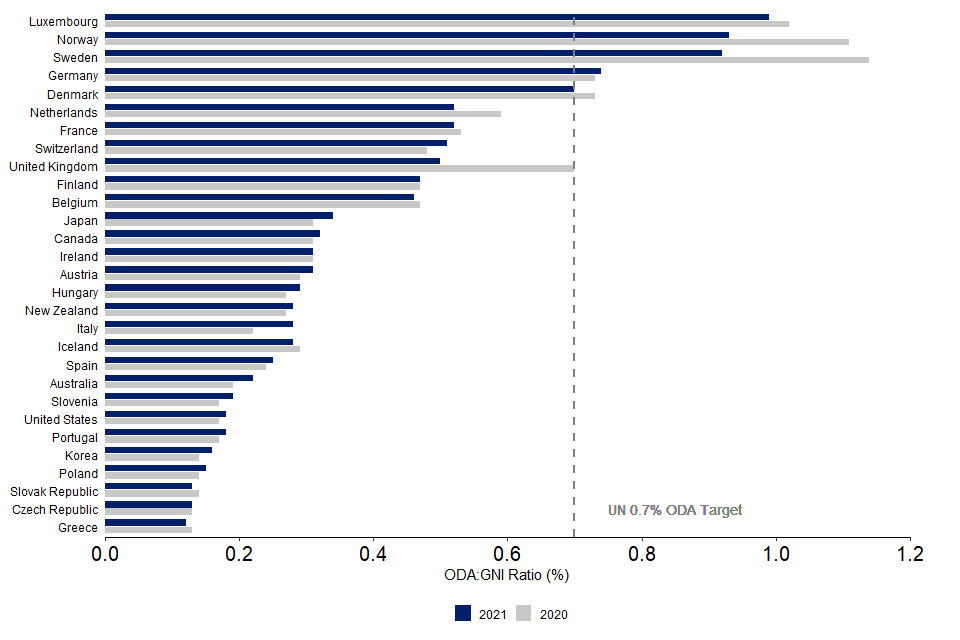
Figure 18 legend: ODA spend in terms of GNI comparing 2020 and 2021 spend for each DAC donor country (ODA:GNI ratio). In dark blue is the 2021 ODA:GNI ratio and in grey is 2020 ratio. The vertical dashed line indicates the 0.7% ODA:GNI UN target. Note that provisional 2021 spend from other DAC donors is used in this chart[footnote 35].
As a combined total, DAC members provided 0.33% of GNI as ODA in 2021. This was up slightly from 0.32% in 2020 and 0.30% in 2019.
8.2 ODA flows by recipient countries
The data used for ODA flows by recipient countries is for 2020, the latest year currently available. For comparability, UK ODA data by recipient countries is also for 2020.
Figure 19 shows the top 15 recipient countries of total ODA from the DAC donor countries in 2020 and the UK’s share of ODA in these recipient countries. It shows:
- the 15 top recipient countries in 2020 were also the top 15 in 2019, although the order has moved around. Bangladesh became the largest recipient of DAC donor ODA in 2020. The top recipient in 2019, Afghanistan, moved down the list to become the 4th largest recipient in 2020
- the UK accounted for roughly a fifth of total DAC ODA for Nigeria in 2020 (the UK provided £241m) and almost a fifth of total DAC member ODA going to Somalia and Yemen (the UK provided £232m and £221m respectively). At the other end of the scale, the UK contributed a relatively small proportion of total DAC ODA to Indonesia (2% with £33m from the UK) and Iraq (3% at £46m)
- receiving £2.0 billion in 2020, Bangladesh became the largest recipient of DAC country donor’s ODA. The UK contributed £203 million (10% of the DAC total) of this. Bangladesh was the sixth highest country-specific recipient of UK ODA in 2020
Figure 19: Map of the top 15 highest recipients of total DAC Members bilateral ODA spend and UK’s share by country, 2020
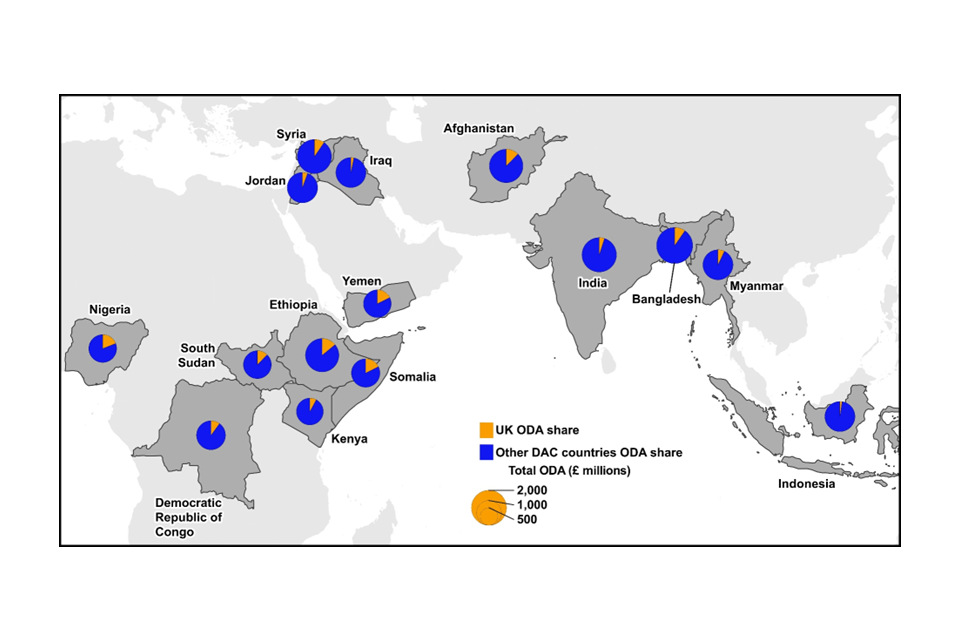
Figure 19 legend: Top 15 recipient countries of total ODA from the DAC donor countries in 2020 and the UK’s share of ODA in these recipient countries (orange) compared to other DAC countries ODA share (blue).
9. Background notes
9.1 Definitions and sources
-
Information on the main definitions and sources used in this publication can be found in Annexes 2 and 3 (PDF, 268 KB) respectively of the Statistics on International Development publication.
-
UK ODA spend figures for this publication are derived from:
-
former DFID’s ‘ARIES’ database of financial transactions relating to payments and receipts, which is quality assured centrally to ensure that data is complete, coding is correct and spend is in line with OECD definitions of ODA. Former FCO’s data is collected in a similar manner from financial transactions data and quality assured by a dedicated team. These 2 administrative sources comprise 71.6% of total UK ODA in 2021. See Future Developments (section 9.12) for information on future FCDO data sources.
-
non-FCDO sources are largely derived from financial transaction data. ODA contributors also assess whether the spend is in line with the OECD definitions of ODA. A small proportion of non-FCDO spend is estimated, for example Gift Aid on ODA eligible activity. These non-FCDO sources account for around 28.4% in 2021.
9.2 Scope
3. This publication presents information on the UK’s Official Development Assistance (ODA) spend in calendar year 2021. Comparisons are made to calendar year 2020. It includes data from UK government departments as well as the Devolved Administrations of the UK and other sources of UK ODA such as the portion of the UK’s contribution to the EU that is spent on ODA and the ODA eligible proportion of Gift Aid. Data relating to both Bilateral and Multilateral ODA are included in the scope of this publication.
This publication does not include information on:
- private spending or donations made in support of developing countries, for example by the public, the voluntary sector or through remittances. These are not part of the ODA definition and not covered in this publication
- financial year ODA budget allocations, which are set by HM Treasury. Users are advised to use caution when making comparisons between the calendar year figures reported in SID with financial year ODA budget allocations
9.3 ODA spending and reporting
4. In a calendar year, FCDO and HM Treasury will monitor spend by other departments and funds, and movements in GNI during the year[footnote 36]. The UK’s performance against the legislated commitment to spend 0.7% of Gross National Income (GNI) on ODA is reported the year following the spend based on confirmed ODA outturn, and GNI estimates published by the Office for National Statistics.
5. While FCDO will manage its own spending on ODA, FCDO has no control over GNI nor the spending by other government departments and other sources of ODA. After final decisions on UK ODA spending are made the GNI estimate can still shift due to later economic data for the year becoming available, so can the amount of ODA spent by other government departments and ODA contributions from non-departmental sources.
6. Between the spring and the autumn, the previous year’s ODA spending of government departments are finalised. Government departments will provide project-level details that allow the ODA spend to be quality assured by FCDO statisticians. The ONS will release further updates of GNI throughout the year.
7. FCDO is responsible for collating data and reporting spend on ODA to the Organisation of Economic Development and Co-operation (OECD), including the ODA:GNI ratio.
9.4 Difference between provisional and final publications
8. The “Statistics on International Development: Provisional Aid Spend 2021” publication outlines provisional ODA spend information and an estimate of GNI for 2021 published by ONS in March to calculate a provisional estimate of the ODA:GNI ratio. Between the spring and the autumn, the ODA spending of government departments and other ODA contributors are finalised, as outlined above.
9. As part of this, other government departments will provide project-level data which will have codes that allocate for each project: sectors, delivery partner, type of aid and other key variables. A project title and description are also provided. These extra details allow the ODA spend to be quality assured using guidance from OECD.
10. The final ODA data and an updated GNI estimate for 2021 released by the ONS in September 2022 have been used to calculate the final ODA:GNI ratio in this publication and to report to the OECD. Further information on the data sources, quality and processing of the statistics in this publication are found in Annexes 1-3 (PDF, 268 KB) on the Statistics on International Development webpage.
11. There were several notable changes between the data reported in the provisional 2021 publication and this final edition. These are:
-
Home Office spend increased by £125 million from £915 million to £1,041 million. This was due to the inclusion of costs incurred in 2021 via the Afghanistan Citizen Resettlement Scheme (ACRS) which were identified as ODA-eligible in September 2022. As part of the ACRS, the Home Office supports refugees with accommodation, health and education provision.
-
The figure for the UK’s EU ODA Attribution of the EU’s Budget (2014-2020) Heading IV (External) decreased by £140 million from an earlier provisional estimate of £824 million to a final amount of £684 million. This was due to a miscalculation by the European Commission of the UK’s financial obligations as part of a budget re-classification exercise in 2021 under the new EU Budget (Multiannual Financial Framework) for 2021-2027. The European Commission informed the FCDO in June 2022 about the technical mistake. More information about the UK’s contribution to the EU can be found in section 9.6 of the background notes.
-
Cabinet Office ODA spend decreased from £108 million to £18 million (£90m decrease). This was due to the original figure being provided on a resource basis rather than cash basis. A remainder of the £90 million decrease will be reflected in the 2022 Cabinet Office ODA spend.
9.5 ODA:GNI ratio
12. As mentioned above, the ODA:GNI ratio is based on confirmed ODA spend and the latest estimates of GNI published by the Office for National Statistics (ONS). The ONS produce estimates for Gross National Income (GNI) on a quarterly basis. The ONS publishes revisions to previous GNI estimates as more economic data becomes available. The 2021 final ODA:GNI ratio is based on the most recent GNI estimate published by the ONS on 30 September 2022.
There is a difference of £38 billion between the March estimate of 2021 GNI used in the provisional publication (£2,305 billion) and the September estimate of 2021 GNI used in this publication (£2,267 billion).
9.6 EU attribution
13. The finalised estimate for the UK’s share of the EU ODA budget in 2021 was £684 million compared to £1,149 million in 2020. EU attribution fluctuates from year to year due to the speed of delivery for the 7 year programming cycle, the total share of EU external programming spend that is classified as ODA and fluctuations in exchange rates. In addition to the normal fluctuations, the decrease in 2021 reflects the UK’s shrinking residual contributions to the EU Multiannual Financial Framework (MFF) 2014-2020 budget and a technical miscalculation in 2021 (see para 11).
14. Under the Withdrawal Agreement, the UK committed to meet outstanding contributions from the 2014-2020 EU budget beyond 1 January 2021 including for external action, development and humanitarian aid. This means a declining tail of ODA contributions until 2029-2030 and which is part of the wider financial settlement in the Withdrawal Agreement.
15. Before 2021 ODA reporting, the full UK attribution of the EU ODA budget was split between DFID and non-DFID contributors. This is the first year that the full UK attribution of the EU ODA budget is captured as FCDO ODA. This is in line with UK ODA allocations.
9.7 Grant equivalent
16. From 2018 onwards, Official Development Assistance (ODA) has changed from being measured on a cash basis to a grant equivalent basis, following a decision taken by the DAC in 2014. This change in measure affects official loans to sovereign states and development multilaterals. See our technical note (PDF, 345 KB) for more information.
17. The headline grant equivalent measure of UK ODA for 2021 was £11,423 million, compared to £11,834 million on the cash basis measurement (a difference of 3.5%).
18. The majority of the difference is due to the UK’s multilateral loan disbursement to the IMF-Poverty Reduction and Growth Trust (IMF-PRGT). In 2021 IMF-PRGT used £204 million ODA under the grant equivalent, (headline ODA measure for 2021) compared with £659 million ODA under the cash flow measure. The remaining difference is due to official loan reflows not being included under the grant equivalent measure.
9.8 Revisions and changes to the publication from previous
19. The revisions process is set out in FCDO’s Revisions Policy (PDF, 86.3 KB).
20. A number of revisions have been made alongside this publication. These are also reflected in the 2021 summary tables and data underlying SID. These revisions affect 2017-2021 data, are minor and do not affect any previously reported trends.
21. In February 2022, after the submission of Final ODA 2020, the OECD sent further feedback regarding ODA eligibility, which has led to several revisions of both 2019 and 2020 data. For 2020 the ODA value has been revised to £14,477 million (down from £14,479 million). The following programmes have been added or removed:
-
The DEFRA programme TFEIP has been removed from 2017, 2018 and 2019 data as it was incorrectly deemed ODA eligible. Legacy-DFID projects 203809-110 and 203809-115 have been removed from 2019 and 2020 ODA totals: even though they have a strong developmental focus, the OECD DAC has not come to an agreement on how ODA should be calculated for hybrid private sector instruments and therefore these types of interventions cannot be included. A BEIS programme has also been removed from 2019 (GCRF_MRC_IARC Cervical Cancer) and 2020 (GCRF_MRC_NS_IARC Cervical Cancer). This leads to a total reduction of £43,000 in 2017, £59,000 in 2018, £843,000 in 2019 and £1.8 million in 2020
-
Legacy-FCO projects GB-GOV-1-CP-998-FY20/21 and GB-GOV-3-CP-998-FY19/20, and DEFRA’s contribution to the Lima Conference 2019 have been added as new programmes for 2020, with a total additional value of £230,448
-
In 2020, the value of TFEIP was revised down from £57,660 to £10,000 and the UK’s contribution to the IMF PRGT was reduced by £13,250. For TFEIP, 2017-2019 payments would now be considered ineligible as most of the work would fall under the ‘global good’ description; in 2020 and 2021 a new TFEIP contract included some work that primarily supported ODA eligible countries
-
in February 2023, after the Final SID 2021 was published in November 2022, the BEIS programme ESRC_AA_ES/S00579X/1 was removed from 2020 and 2021 data, having been considered ODA ineligible with direct benefits to the military. The value is around £70 thousand for each year
22. Aside from programme additions and removals, OECD feedback has led to non-value revisions of programmes as follows:
-
For project NIHR_CC, ‘type of aid’ has been reclassified from G01 (administrative costs) to C01 (project-type interventions) in both 2019 and 2020. Legacy DFID projects 300351-110 and 300351-121 have been reclassified from C01 to B03 (multilateral INGO contributions) in both years.
-
The channel codes for projects 300351-110 and 300351-121 have also changed, from 61001 (Banks) to 47086 (Private Infrastructure Development Groups) in the same years. The channel code for 300420-101 changed from UNDP to UNOCHA in 2019 and 2020.
23. In 2015-2017 the benefitting country for the Syrian Vulnerable Persons Resettlement Scheme (SVPR) has been changed from Syria, to developing country, unspecified, in line with guidance from the OECD DAC as there is no cross-border flow involved for refugees being supported within the UK.
24. In 2021 the headline to the nearest million has not changed (£11,423m), with a total reduction of £72 thousand. The revised figure for total UK ODA in 2020 is £14,477 million, reflecting a total reduction of £1.70 million. In 2019 the headline figure to the nearest million did not change (£15,176m), with a total reduction of £0.84 million. The headline figures for 2018 and 2017 also did not change (see table of revisions below for details of these changes). The ODA:GNI ratio continues to be 0.50% for 2021, and 0.70% for 2017-2020.
Table of revisions, ODA value changes:
| ODA reporting year | Department | Donor project number | New net ODA value | Old net ODA value | Reason for revision |
|---|---|---|---|---|---|
| 2021 | BEIS | ESRC_AA_ES/S00579X/1 | NA | £71,687 | Removal |
| 2020 | DEFRA | Lima Conference 2019 | £22,876 | NA | Addition |
| 2020 | FCDO | GB-GOV-1-CP-998-FY20/21 | £122,988 | NA | Addition |
| 2020 | FCDO | GB-GOV-3-CP-998-FY19/20 | £84,583 | NA | Addition |
| 2020 | IMFPRGT | HMT PRGT IMF 002 | £254,778,383 | £254,791,633 | Value change |
| 2020 | DEFRA | TFEIP | £10,000 | £57,660 | Value change |
| 2020 | BEIS | GCRF_MRC_NS_IARC Cervical Cancer | NA | £600,000 | Removal |
| 2020 | FCDO | 203809-110 | NA | £300,000 | Removal |
| 2020 | FCDO | 203809-115 | NA | £900,000 | Removal |
| 2020 | BEIS | ESRC_AA_ES/S00579X/1 | NA | £71,111 | Removal |
| 2019 | BEIS | GCRF_MRC_IARC Cervical Cancer | NA | £200,000 | Removal |
| 2019 | FCDO | 203809-110 | NA | £150,000 | Removal |
| 2019 | FCDO | 203809-115 | NA | £450,000 | Removal |
| 2019 | DEFRA | TFEIP | NA | £43,160 | Removal |
| 2018 | DEFRA | TFEIP | NA | £58,701 | Removal |
| 2017 | DEFRA | TFEIP | NA | £43,160 | Removal |
9.9 Cross-Government Prosperity Fund
25. In March 2021, the government announced[footnote 37] that the Cross-Government Prosperity Fund would end on 31 March 2021 and prosperity programmes would move to the FCDO. Therefore, figures presented on the Prosperity Fund in this report cover January to March 2021 (quarter 1 of the calendar year) only. Prosperity Fund programmes implemented by the FCDO are included in FCDO figures from April 2021 onwards.
26. There are 2 main ways of accounting for expenditure: on a cash basis or on a resource basis. The primary difference between cash and resource accounting is the point at which a transaction is recognised in financial statements. Under resource accounting (also called accrual accounting), transactions are recognised when the activity occurs. Under cash accounting, a transaction would be recorded when cash is paid for the activity.
27. FCDO[^38] reports ODA on a cash basis in line with the OECD DAC Directives. Historically Prosperity Fund was reported on a resource basis which makes minimal difference when reporting on a full year worth of expenditure. However, as most of Prosperity Fund funded programmes were reported by FCDO for the majority of the year (from April 2021), Prosperity Fund figures (from January to March 2021) have been reported on a cash basis. This ensures consistency to the way in which Prosperity Fund programmes are reported across the calendar year and removes the risk of double counting between the 2 measures.
28. Therefore, the figure in this report is reported on a different basis to historic Prosperity Fund ODA. For consistency the Prosperity Fund figure for quarter 1 on a resource basis was £81 million, compared to £53 million on a cash basis.
9.10 Accessibility
29. An important part of our SID publications are the summary tables published as excel spreadsheets. These may contain data tables that are difficult to use with screen readers and keyboard-only navigation.
30. We aim to make all SID related spreadsheet documents we publish from now on (SID 2020 onwards) fully accessible.
31. On 30 June 2021 the Government Statistical Service (GSS) published guidance around releasing statistics in spreadsheets. This sets out best practice for accessibility in the statistics produced across Government, for example to enable access to statistics for visually impaired individuals using screen readers. As such, we have followed the guidance where possible and implemented accessibility measures to the summary tables published alongside this report (standard and additional), as well as providing alternative text where necessary to the case studies contained within this report (Chapter 9).
32. We have looked at the resources needed to make SID Excel documents published between September 2018 and September 2021, accessible (in line with The Public Sector Bodies (Websites and Mobile Applications) Accessibility Regulations 2018). We believe that making these accessible would be a disproportionate burden. It is also important to note that SID tables published before SID 2021, are updated via the tables accompanying this publication due to revisions (as per para 22 to 27).
33. If you need any of the information published as part of the SID collections (SID 2021 or historical) in a different format please contact us on statistics@fcdo.gov.uk
9.11 Afghanistan and Ukraine
34. Due to the security situation in Afghanistan and the conflict in Ukraine, all information surrounding channel of delivery, project title and project description has been temporarily removed in the data underlying SID. This includes ODA activities in which Afghanistan/Ukraine was the “recipient country” or regional programmes in which Afghanistan/Ukraine were involved. FCDO programme teams are now working to re-publish data for both countries which is a work-in-progress. The SID will reinstate this information in its Data Underlying the SID once this has been completed by the programme teams.
9.12 Future developments
35. An important part of National Statistics production is assessing whether a product continues to meet user needs. The ODA statistics team are currently reviewing the SID to identify areas to develop further, as well as testing how best to present and communicate ODA trends. So far, the SID has been peered reviewed by other statisticians. The team has also gathered information on the users of SID and their data needs via a short user feedback survey launched in April 2021.
36. The team has launched another short user feedback survey (open until 13 January 2023) alongside this publication to ensure that the future development plans incorporate the most up to date comments from our users, 1. so will use results from survey as well as the 2021 survey results. More information on the development plans and user engagement opportunities will be published on the statistics gov.uk page throughout 2023.
37. The team always welcomes the opportunity to understand further how our readers are using the SID products and data. You can provide feedback by contacting us by email at statistics@fcdo.gov.uk
38. As a newly merged department, FCDO ODA reporting for 2021 still relies on the finance systems and policies from each of the legacy departments. FCDO’s new finance and HR system “Hera” is currently being implemented. To ensure that FCDO ODA can be consistently collected and reported in line with the OECD DAC directives going forward, we have a dedicated statistician working on the transition between systems and its impact on our statistics. The change in finance systems also brings the opportunity to improve data collection processes. The ODA statistics team will keep users informed via the SID gov.uk page of any changes or improvements this brings to FCDO ODA statistics.
39. FCDO is defined as a multi-purpose agency by the OECD, as it carries out both ODA and non-ODA activities. FCDO statisticians have produced a suitable methodology that captures the ODA eligible proportion of FCDO administration costs. Information on this methodology can be found in our explanatory note (PDF, 220 KB). The methodology has been applied from April 2021 (beginning of the financial year). This methodology is expected to be used on an interim basis whilst the FCDO finance system is being fully implemented and tested. Once this happens, the methodology will be reviewed and adjusted as necessary. The explanatory note will be updated once the methodology is finalised. FCDO’s ODA eligible administration costs estimates are broken down by recipient country, this is in line with the approach to reporting former FCO’s Frontline Diplomacy Activity. Former DFID’s ODA eligible administration were all reported as “Developing Country, unspecified”. Therefore, care should be taken when comparing FCDO ODA eligible administration estimates at the country level to historical FCDO ODA eligible administration (which will only reflect former FCO).
9.13 Uses and users
40. The main purpose of this publication is to provide timely statistics on ODA expenditure by UK Official sources. They are published prior to the release of final ODA statistics by the OECD DAC for all OECD members.
41. Responses from our short user feedback survey in 2021 show that our largest user groups include expert analysts/technical users, policy influencers and information foragers see definitions of each persona. Our users use the SID primarily to find out which countries and sectors receive UK ODA, the bilateral/multilateral split of UK ODA and the amount of ODA spent by each government department.
42. We are always keen to enhance the value of these statistics and welcome your feedback either via our Statistics User Group or via email statistics@fcdo.gov.uk.
9.14 Data quality
43. The DAC sets the definitions and classifications for reporting on ODA internationally. These are laid out in the DAC Statistical Reporting Directives[^39]. The statistics in this publication are reported in line with these directives and are subject to the quality assurance process as described in Annex 3 (PDF, 268 KB) of Statistics on International Development.
44. The data in the publication is largely based on administrative data and so it is not subject to sampling error.
45. Calendar year financial transaction data are used to compile UK ODA spend statistics. These are extracted from former DFID’s ARIES database, former FCO’s financial transactions data and other contributor financial transaction data and are subject to input errors from spending teams. The risk of input error is relatively low for estimates of total spend, and by country/region, and relatively higher for spending by sector (where there is sometimes ambiguity, especially for projects or programmes that cut across sectors) and by funding channel. The quality assurance Annex 3 (PDF, 268 KB) describes the steps that have been taken by FCDO statisticians to minimise these kinds of input errors, and to produce UK ODA statistics.
46. Temporary sustenance for asylum seekers and refugees is ODA eligible for their first 12 months of stay. This includes basic health and education services. There may be some ODA eligible health and education activity as part of the Afghanistan Citizens Resettlement Scheme in the devolved administrations that is not included in these figures.
47. The figure presented for the Welsh Government represents their estimated spend for the financial year 2020/21 and are used as a proxy for their calendar year 2020 spend.
9.15 Estimates on ODA spend in response to the coronavirus (COVID-19) pandemic
48. The activities captured in the COVID-19 ODA figure have the objective of supporting the control of the COVID-19 pandemic or responding to its socio-economic impacts. The OECD DAC has requested activity level COVID-19 ODA spend data from all donors. This will be published in their final statistics in late December.
49. The sources of this ODA data are as follows:
-
former-DFID: COVID-19 spend data was captured on the Aid Management Platform, which is the same source[^40] as former DFID spend data on sectors and benefitting country. ODA activities can be tagged either as a COVID-19 activity or as not applicable. Some ODA activities were designed specifically to address COVID-19 (COVID-19 specific), while some existing programmes were adapted or flexed to respond to the crisis (COVID-19 adapted)
-
former-FCO: COVID-19 activities were carried out through the International Programme’s enabling fund, which provides small amounts of discretionary funding to posts /directorates within the FCO for small-scale activities. The Fund is designed to be agile, to allow posts to respond quickly to developing events[^41]
-
non-FCDO: ODA contributors provided the amount of ODA focused on addressing the COVID-19 pandemic via the usual final data return
50. Please note that the amount spent on activities which addressed the COVID-19 pandemic is an approximate estimate. As part of this publication, there is a COVID-19 ODA activity level dataset, these figures should also be treated as estimates.
51. Approximately 71% of former DFID’s COVID-19 data is COVID-19 spend that can be defined as adapted spend. This estimate is based on the proportion of the programme’s overall budget that was focused on addressing COVID-19 for financial year 2020-21 and 2021-22. Proportions for 2020-21 were collected last year, this year programme teams were requested to provide a separate proportion for 2021-22. Programme teams were supplied with refreshed and refined guidance on how to calculate the proportion. These proportions have been applied to the corresponding periods within the calendar year: the 2020-21 proportion applied to Jan to Mar 2021 and the 2021-22 applied to Apr to Dec 2021.
52. The £602 million of UK ODA spent on COVID-19 in 2021 does not include the UK’s core contributions to multilaterals, a proportion of which will have been channelled to address the pandemic.
9.16 Timing and releases
53. FCDO releases 2 editions of Statistics on International Development each year:
-
provisional UK Aid spend will be published in the spring and includes a preliminary estimate of the UK’s ODA:GNI ratio for the previous calendar year. The latest edition of this publication can be found on gov.uk.
-
final UK Aid spend is usually published in the autumn. This publication confirms the UK’s ODA:GNI ratio for the previous year, as well as including more detailed analysis of the UK’s Bilateral and Multilateral ODA, and includes the microdata used to produce the publication
9.17 Related statistics and publications
54. The OECD statistics provide ODA breakdowns for DAC donors (including multilaterals). This source is useful when carrying out international comparisons. Figures for DAC donors’ final 2021 ODA will be published in December 2022.
55. The Development Tracker can be used to explore details of the individual development projects that the UK is funding. This allows you to filter projects by country and sector and view further details about the project as published in documents such as the business case and annual review. The tracker uses open data on development projects, compliant with the International Aid Transparency Initiative (IATI) standard, to show where funding by the UK Government and its partners is going and ‘trace’ it through the delivery chain.
9.18 National statistics
56. The Office for Statistics Regulation (part of the United Kingdom Statistics Authority) designated these statistics as National Statistics in March 2016, in accordance with the Statistics and Registration Service Act 2007 and signifying compliance with the Code of Practice for Statistics. Designation means the statistics carry the National Statistics label and conform to the standards summarised below.
57. The Office for Statistics Regulation published their findings from a compliance check of SID in 2019 which confirmed that it is designated a National Statistic.
58. The Foreign, Commonwealth and Development Office is now responsible for producing the Statistics on International Development statistical series. The designation of National Statistics carries through to the new Department.
59. Information on the work of the UK Statistics Authority
9.19 Contact details
For enquiries (non-media) about the information contained in this publication, or for more detailed information, please contact:
Jacqueline Robertson
Telephone: 07768 90 42 27
Email: statistics@fcdo.gov.uk
Website:FCDO statistics on GOV.UK
For media enquiries please contact the FCDO Press Office on +44 (0)20 7008 3100.
For further information on development issues and FCDO policies, please contact the Public Enquiry Point on 020 7008 5000.
10. Listing of main activities of UK government departments and other contributors of UK ODA other than FCDO in 2021
| Non-FCDO Government Department or other contributor of UK ODA | Main ODA funded activity in 2021 |
|---|---|
| BBC World Service | BBC World Service contributes to the BBC’s international news mission by providing trusted, accurate, impartial, and independent information and analysis to audiences around the globe. The BBC World Service aims through journalism to contribute to accountability and good governance and improve the welfare and economic development of citizens in developing countries. |
| Cabinet Office (CO) | In November 2021, the UK hosted the 26th meeting for Conference of the Parties (COP26). Held in Glasgow, COP26 began with a World Leaders Summit, a meeting of leaders from over 100 countries to address the climate change impact, challenges, concerns and agree on mitigation for a better future. Over the 2 week-long event, a particular focus surrounded developing countries, particularly those vulnerable to climate change. The costs of these activities had a main focus on developing countries therefore they are ODA eligible. Furthermore, the COP26 Unit - Cabinet Office’s ODA relates to all relevant eligible costs such as supporting attendance of ODA eligible countries delegates. |
| Colonial Pensions administered by DFID | Pension payments made to ex-members of the UK Overseas Civil Service who were employed directly by developing country governments |
| Conflict, Stability and Security Fund (CSSF) | The Conflict Stability and Security Fund (CSSF) is a unique cross-government fund that tackles the greatest threats to UK national security arising from instability overseas. Its ability to blend ODA and non-ODA is unique across HMG and amongst international donors. The CSSF continues to support the delivery of the Government’s top national security priorities linked to conflict and instability, state threats, transnational threats, and women, peace, and security in more than 85 countries and territories. For more details on the CSSF please see the latest annual report. |
| Cross-Government Prosperity Fund | The Prosperity Fund is an innovative cross-government fund, focused on Official Development Assistance (ODA) eligible middle-income countries and emerging economies. It supports the UK’s aim of promoting global prosperity, creating the broad-based and inclusive growth needed for poverty reduction, contributing to the UN Sustainable Development Goals. The Fund works across 5 key themes which are essential to its aim. These are: investment in infrastructure; human capital, innovation, and technology; trade; financial and economic reform and ease of doing business. Major projects supported in 2020: 1. Working with 19 cities worldwide to address the urgent challenges of unplanned and overcrowded settlements, congestion, and pollution, with a focus on improving transportation, urban planning and resilience, the Future Cities Programme had a spend of £22.7m. 2. Working to strengthen local health systems and improve the quality of care in Brazil, Malaysia, Mexico, Myanmar, the Philippines, South Africa, Thailand, and Vietnam the Global Health Programme had a spend of £19.4m. In March 2021, the government announced that the Cross-Government Prosperity Fund would end on 31 March 2021 and prosperity programmes would move to the FCDO. Therefore, figures presented on the Prosperity Fund in this report cover January to March 2021 (quarter 1 of the calendar year) only. Prosperity Fund programmes implemented by the FCDO are included in FCDO figures from April 2021 onwards. |
| Department for Business, Energy and Industrial Strategy (BEIS) | The UK’s International Climate Finance (ICF) was established in 2011 to help developing countries tackle climate change and move to sustainable economic growth. It is the government’s primary instrument to deliver the UK’s share of the financial and technical assistance to developing countries required under the £100bn per annum Climate Finance commitment in the Paris Agreement. ICF spending is split between FCDO (previously DFID), DEFRA and BEIS. BEIS spent £3.6bn between 2011/12 and 2021/22 primarily on large scale mitigation projects in the following thematic areas: affordable and clean energy for all, halting deforestation and preventing biodiversity loss, helping countries become resilient to the effects of climate change and sustainable cities and transport. Each programme in the portfolio is designed to support catalytic change in developing countries. Most of BEIS ICF is spent through large multilateral development banks including the World Bank Group. It is also a major contributor to multilateral climate funds – including the Green Climate Fund and the Climate Investment Funds (CIFs). The BEIS ICF also works through contracting delivery partners (both public and private) and public-private partnerships, such as UK Climate Investments, run with the Macquarie Group. BEIS ODA also contributes to the UK’s annual subscriptions for membership of organisations including the International Atomic Energy Agency, United Nations Framework Convention on Climate Change, and the Intergovernmental Panel on Climate Change. BEIS ICF has prioritised large-scale emission mitigation programmes in middle-income countries (MICs), and in forest-rich countries that play a critical role as major carbon sinks, reflecting where the potential for emissions abatement is highest. BEIS also manages the Newton Fund and Global Challenges Research Fund (GCRF). The Newton Fund supports bilateral and regional research and innovation partnerships between the UK and selected middle income countries. The aim of this is to address specific global development challenges and build science and innovation capacity. GCRF provides dedicated funding to research focused on addressing global challenges which most significantly impact upon developing countries. It achieves this by supporting challenge-led disciplinary and interdisciplinary research, strengthening capability for research and innovation within developing countries, and providing an agile response to emergencies. |
| Department for Digital, Culture, Media and Sport (DCMS) | DCMS’s Cultural Protection Fund (CPF) is a world-renowned partnership between DCMS and the British Council that delivers grant funding to local organisations working on cultural heritage protection in 12 conflict-affected countries in the MENA region and contributes towards key HMG stabilisation, security, and development objectives. In 20/21 the CPF expanded to protect cultural heritage at risk from climate change and natural disasters in 15 countries, mainly in East Africa and the Indo Pacific, with projects delivered through the British Council, and a new partnership with the Arts and Humanities Research Council. |
| Department for Education (DfE) | DfE’s ODA covers support of asylum seekers in the first 12 months after they make a claim for asylum in the UK. This support relates to the provision of publicly-funded education services for asylum seekers of compulsory school age. |
| Department for Environment, Food and Rural Affairs (DEFRA) | The key programme areas of Defra’s ODA portfolio aim to protect and restore critical terrestrial and marine ecosystems, address the decline in species and wildlife, expand knowledge and research on biodiversity, nature, and climate and integrate nature into financial and economic decision making. Defra also provides contributions to, multilateral environment agreements Main Activities: 1. The Darwin Initiative: a global competitive grant scheme that funds projects in developing countries and our UK Overseas Territories to help them better manage their natural resources and protect biodiversity. 2. Illegal Wildlife Trade (IWT) Challenge Fund: a global competitive grant scheme that funds projects in developing countries to develop sustainable livelihoods for communities affected by illegal wildlife trade; strengthen law enforcement and the criminal justice system; and reduce demand for the products of the illegal wildlife trade. 3. Blue Planet Fund (BPF): a global fund designed to aid developing countries protect the marine environment and reduce poverty by improving marine biodiversity; adapting to and mitigating climate change; reducing marine pollution; and supporting sustainable seafood production. 4. International Contributions to Multilateral Organisations and Environmental Agreements (MEAs): Covering subjects including sustainable use of natural resources, sustainable development, air quality, waste management, control of chemicals and food security. Examples of major projects and countries supported in 2021: Defra’s ODA is delivered through a range of aid instruments, organisations and supports a range of countries. This includes global demand led challenge funds like Darwin and IWT to new programmes such as the Biodiverse Landscapes Fund which will be focussed on 6 specific landscapes and 18 countries (including Peru, Ecuador, Vietnam, Laos, Cambodia, Madagascar, Zambia, Zimbabwe, Botswana, Angola, Guatemala, Honduras).The Blue Planet Fund has a strong focus on Small Island Developing States and will also support marine programmes in countries such as Sri Lanka, Indonesia, Vietnam and Madagascar. |
| Department for International Trade (DIT) | DIT’s ODA included a pilot Investment Promotion Programme working with the Prosperity Fund Joint Unit, support for capability and compliance at headquarters, and promotion of prosperity objectives in African countries through DIT’s ODA funded Africa Uplift. Following the Spending Review 2020 settlement, DIT’s ODA work was de-prioritised. All ODA programming was stopped by March 2021. |
| Department for Work and Pensions (DWP) | DWP pays an annual contribution to the regular budget of the International Labour Organisation (ILO). 60% of this is ODA-eligible. DWP spend for 2021 also included ODA-eligible benefits to refugees within the first 12 months of stay in the UK as part of the Vulnerable Persons Resettlement (VPR) programme. The VPR ended in March 2021. |
| Department of Health and Social Care (DHSC) | In support of the UK Aid Strategy, DHSC’s expenditure on Official Development Assistance was £226 million in 2021. DHSC’s main ODA activities are on the areas of global health, health security and global health research. The Global Health Security (GHS) programme’s activities in these areas have helped developing countries to reduce preventable deaths and burden from disease; to detect health threats; and to provide rapid and effective response to health threats that emerge. GHS research activities funded innovative research in specific vaccine and vaccine technologies and informed best practice in disease outbreaks interventions and to reduce the threat of antimicrobial resistance. In addition, through the National Institute for Health and Care Research (NIHR), the Global Health Research (GHR) portfolio has supported high-quality applied health research for the direct and primary benefit of people in low- and middle-income countries (LMICs). The portfolio aims were delivered through a mix of researcher-led and commissioned calls delivered by NIHR and through partnerships with other global health research funders, through initiatives to develop and advance global health research and career pathways both in LMICs and in the UK. Organisations supported (not exhaustive): World Health Organization Africa Centres for Disease Control and Prevention Eastern Mediterranean Public Health Network United Nations Antimicrobial Resistance Multi-Partner Trust Fund Food and Agriculture Organisation (FAO) World Organisation for Animal Health (OIE) Foundation for Innovative New Diagnostics (FIND) South Centre Commonwealth Pharmacists Association Tropical Health and Education Trust (THET) Global Antibiotic Research and Development Partnership (GARDP) Coalition for Epidemic Preparedness Innovations (CEPI) European and Developing Country Clinical Trials Partnerships (EDCTP) Grand Challenges Canada UK Collaborative on Development Research (UKCDR) Global Alliance for Chronic Diseases Global Road Safety Facility (GSRF) Elton John AIDS Foundation |
| EU Attribution (non-FCDO) | This is the estimate for the non-DFID share of the EU ODA budget. EU attribution fluctuates from year to year because the EU works on a 7-year programming cycle and so EU disbursements in a given year can vary. Non-DFID EU contributions include ODA eligible spend in peace, security, democracy, human rights and civil society. |
| Export Credits Guarantee Department | UKEF is the operating name of the Export Credits Guarantee Department, the UK’s export credit agency. It helps UK exporters by providing insurance to them and guarantees to banks to share the risks involved in providing export finance. It also makes loans to overseas buyers of goods and services from the UK. If an overseas borrower defaults on a UKEF-guaranteed bank loan or if UKEF pays out on an insurance claim, it becomes the owner of the debt and will seek to make recoveries, taking account of UK government policy on debt forgiveness. In certain circumstances this debt is restructured or forgiven. In 2020 UKEF cancelled debt owed by Somalia. The debt cancellation followed Somalia reaching Decision Point under the Heavily Indebted Poor Countries Initiative and on 31 March 2020 receiving a Paris Club debt treatment. The terms of the debt treatment were implemented by UKEF via the UK/Somalia Debt Agreement No. 3 which came into effect on 21 December 2020. |
| Gift Aid | The portion of Gift Aid claimed by UK based international development charities that is then used on ODA eligible activities. To understand more about ODA eligible Gift Aid, please see methodology note. |
| HM Revenue and Customs (HMRC) | HMRC works with ODA-eligible countries, supporting economic development through improving tax administration functions, providing economic integration, stability and growth. This includes provision of peer-to-peer technical assistance in tax administration functions. Areas of focus also include international tax transparency standards, the OECD Global Forum standard for transparency and the more recently introduced standards under Pillars 1&2. Accelerate Trade Facilitation supports ODA eligible countries to implement the WTO Trade Facilitation Agreement (TFA) and related reforms. The aim is to help beneficiary countries to align their border procedures to the TFA, reducing the time and cost of trading goods, which leads to enhanced economic growth and development. The programme is delivered by multilateral partners, the World Customs Organization (WCO) and the United Nations Conference on Trade and Development (UNCTAD). WCO provide targeted support to customs administrations to implement technical customs reforms in line with the TFA and enhance organisational development. UNCTAD supports the operationalisation of National Trade Facilitation Committees (NTFCs) which comprise of different agencies and private sector stakeholders that coordinate domestic trade facilitation reforms. |
| HM Treasury (HMT) | HMT ODA relates to development-related administrative costs, and countering money laundering and illicit finance. |
| Home Office (HO) | The Home Office’s main ODA activities include: In-donor spend on support to asylum seekers and the resettlement of vulnerable people. This is linked to support and shelter for up to 12 months. Work upstream in ODA countries to build capacity and capability in recipient countries to improve security, protect children and tackle modern slavery. Organisations supported: UNICEF IOM. Countries and sectors supported: Developing countries unspecified Refugees in donor countries Security System management and reform Ending violence against women and girls, social protection, Human Rights Facilitation of orderly, safe, regular and responsible migration and mobility, Relief co-ordination and support services, Justice, law and order policy, planning and administration |
| Ministry of Defence (MoD) | MoD ODA spend includes training in human rights, rule of law, international humanitarian law, protection of civilians in conflict, maritime law, and the UK Hydrographic Office support to developing countries in maritime charting. |
| Office for National Statistics | ONS ODA is used to provide high-quality technical assistance, mainly through experts from the UK Office for National Statistics, to build the capacity of statistical systems in developing countries. We have key partnerships with national statistical offices globally, primarily in Africa. We set up an ONS and FCDO Data Science Hub to provide training and mentoring to build data science skills, and research into new uses of AI and big data for the SDGs. It enables the ONS SDG team to provide support to developing countries on SDG monitoring, through the provision of the open source tool OpenSDG and technical advice on inclusive data. |
| Other In-donor Refugee Costs | Education (for compulsory school age) and healthcare for asylum seekers based in Scotland, Wales and Northern Ireland. Only asylum seekers within the first 12 months after they make a claim for asylum in the UK are included. |
| Scottish Government | The Scottish Government, through its £10M pa International Development Fund in 2021, supports development work in its partner countries Malawi, Zambia, Rwanda and Pakistan, in pursuit of the UN Global Goals; in 2021, this included a pivoting of funds to support these partner countries’ COVID-19 responses, including funding for: oxygen concentrators; ventilators; to enable the donation of £8m worth of PPE equipment to Malawi, Rwanda and Zambia through the NHS Scotland Global Citizenship Programme. A separate £1m Humanitarian Emergency Fund also provides humanitarian funding to support crises as they occur, including during 2021 funding support: vulnerable people affected by the ongoing conflict in Tigray region in Ethiopia, and refugees displaced to Sudan; the food emergency in South Sudan, for food distribution in the region facing famine; and the people of Afghanistan, including donating to the Disasters Emergency Committee (DEC) Appeal for their December 2021 appeal. Finally, the Scottish Government’s Climate Justice Fund helps tackle the effects of climate change in the poorest, most vulnerable countries, based on a simple and powerful message: the poor and vulnerable at home and overseas are the first to be affected by climate change, and will suffer the worst, yet have done little or nothing to cause the problem. |
| Welsh Government | The Welsh Assembly supports the Wales for Africa programme, which aims to help deliver the Sustainable Development Goals. It also provides small grants to organisations based in Wales to promote development awareness. |
11. Alternative text for 1-pager factsheets
60. Main summary factsheet – page 6 Infographic
This factsheet covers the key headlines of the Final SID 2021.
Box 1: Headlines
- the UK has spent in line with the government’s decision to reduce ODA from 0.7% of Gross National Income to 0.5% in 2021
- 62.6% of UK ODA was spent bilaterally (i.e. going to specific countries, regions or programmes)
- 37.4% of UK ODA was spent as core contributions to multilaterals
- in 2021, Afghanistan was the largest bilateral recipient of UK ODA, at £187m
Box 2: Total UK net ODA: by contributor
This box presents a line chart of total UK ODA by FCDO, Other Government Departments (OGDs) and Other Contributors of UK ODA from 2009 to 2021. The FCDO line starts at £6.7bn in 2009 and ends at £8.2bn in 2021. The FCDO line grows steadily over time, peaking in 2019 and then dipping in 2020 and then further 2021. The OGD line starts at £0.2bn in 2009 and gradually increases over time to its highest point of £2.8bn in 2021. The Other Contributors of UK ODA line starts at £0.5bn and peaks at £1.4bn in 2017 then decreases to £0.4bn in 2021. The text reads: From 2009 to 2021, FCDO’s (including combined former DFID and former FCO) total ODA share has gradually decreased from 91% to 72% , while Other Government Departments’ (OGDs) share has been increasing, from 2.3% in 2009 to 25% in 2021.
Box 3: UK bilateral ODA by region, 2021
This box presents a bar chart of UK region-specific spend broken down by region – Africa (£1,727m), Asia (£1,334m), Americas (£196m), Europe (£154m) and Pacific (£10m).
Box 4: UK bilateral ODA: Top 10 recipient countries, 2021
This box presents a bar chart of the top 20 recipient countries of UK bilateral ODA in 2021 from the largest to smallest. It shows the following countries and value: Afghanistan (£187m) to the 20th – Lebanon (£58m). All the values in the bar chart are found in Table 6a. Afghanistan (£187m), Nigeria (£140m), Pakistan (£128m), Ethiopia (£120m), Yemen (£114m), South Africa (£102m), Somalia (£101m), South Sudan (£96m), Sudan (£94m), Syria (£91m), India (£91m), Bangladesh (£87m), Congo, Dem. Rep. (£73m), Kenya (£72m), Myanmar (£66m), Uganda (£64m), Jordan (£62m), Tanzania (£61m), Nepal (£59m), Lebanon (£58m).
Box 5: Total ODA spend by contributor, 2021
This box presents a doughnut chart of ODA spend by contributor. It shows contributors that spent over £200 million each in 2021. FCDO is the largest contributor at £8,175m, followed by the Home Office (£1,041m), the Department for Business, Energy and Industrial Strategy (£935m), Conflict, Stability and Security Fund (£426m) and the Department of Health and Social Care (£226m) as well as other contributors (£619m).
Box 6: UK bilateral ODA: top 5 sectors, 2021
This box presents a bar chart of the percentage share of the top 5 sectors – Refugees in Donor Countries (£1,052m), Health (£970m), Economics & Infrastructure Services (£820m), Multisector (£795m), Government & Civil Society (£773m).
61. Bilateral and multilateral case study – page 15
This infographic sets out some key definitions, breakdowns and programme examples of bilateral, multilateral and bilateral through multilateral ODA spent in 2021 and previous years.
Box 1: Definitions and examples
- Multilateral ODA definition: ODA that is given directly to a multilateral organisation (ML) without being designated for a specific purpose. It is pooled with other donors’ funding. Example: The Joint United Nations Programme on HIV/AIDS. UNAIDS is a multilateral organisation that received £2.5m of core multilateral funding from the UK in 2021, alongside funding from other donors. UNAIDS’ goal of strengthening the response to HIV and ending the AIDS epidemic aligns with the UK’s goal to end the preventable deaths of mothers, babies and children, corresponding with UK priorities on global issues
- Bilateral through Multilateral ODA definition: Bilateral through Multilateral: ODA provided for a specific purpose (normally a particular country, region or sector) using a multilateral organisation to deliver the programme. Example: The World Food Programme (WFP) in Yemen. In 2021, the UK provided £22.8m of ODA to deliver emergency food assistance to food insecure and conflict-affected people in Yemen. To deliver this work, the WFP, a multilateral organisation, was used as the delivery partner. Therefore, this bilateral through multilateral ODA was specifically allocated to the WFP for these specific activities in Yemen
- (Other) Bilateral ODA definition: ODA provided for a specific purpose (normally a particular country, region or sector) which is given directly to recipient governments or delivered through other UK partners. Example: Livelihood and Relief Programme in Syria. In 2021, the UK provided £8.1m of bilateral ODA to conflict-affected Syrians in order to strengthen their capacity to cope with the shocks and effects of conflict, with lifesaving assistance. To deliver this humanitarian assistance, an NGO was used as the delivery partner in order to deliver these activities in Syria. and 2021 example of (other) bilateral ODA, livelihood and Relief Programme in Syria
Box 2: Flowchart of UK ODA flows
This box contains a flowchart which visualises multilateral, bilateral, and bilateral through multilateral ODA flows from the UK to recipient countries, regions and programmes. It depicts that bilateral ODA is earmarked and either flows through a multilateral organisation or straight to a specific purpose or fund and that multilateral ODA is unearmarked core funding to a multilateral organisation.
Box 3: Largest multilateral ODA delivery partners, 2021
This box presents a bar chart with the largest 5 multilateral organisation delivery partners in 2021, specifically for multilateral ODA. It shows that the European Commission – Development Share of Budget was the largest multilateral partner, with £684m worth of ODA spend. This was followed by International Development Association (£670m), European Commission – European (£635m), Global Fund to fight AIDS, Tuberculosis and Malaria (£380m) and the Green Climate Fund (£281m). Text in box reads: In 2021, the UK provided £8.1m of bilateral ODA to conflict-affected Syrians in order to strengthen their capacity to cope with the shocks and effects of conflict, reducing their exposure to harm as a result of lifesaving assistance. To deliver this humanitarian assistance, an NGO was used as the delivery partner in order to deliver these activities in Syria.
Box 4: Bilateral/multilateral ODA breakdown, 2014 to 2021
Box 4 presents a 100% stacked column of bilateral, bilateral through multilateral and multilateral ODA shares from 2014 to 2021. It shows that the share of other bilateral ODA increasing from 40.1% in 2014 to 50.5% in 2021. Multilateral ODA varies slightly each year, decreasing overall from 41.6% in 2014 to 37.4% in 2021. Bilateral though multilateral ODA decreases from 18.3% in 2014 to 12.0% in 2021.
Note on multilateral organisations
Multilateral Organisations are international institutions made up of multiple countries who work together to tackle common, often global, challenges. Although they decide where their funding is spent, the UK only funds MLs that align with its priorities, using its seat on boards and dialogue with other donors to influence MLs’ priorities and strategies. The UK estimates its share of core multilateral ODA spent in different countries, regions and sectors using the Imputed Multilateral Share approach (see section 7.3).
62. Afghanistan case study – page 29
This is a case study on Afghanistan, including background information and key headlines and charts on ODA to Afghanistan in 2021 and previous years.
Box 1: Background information and key figures
This box presents background information with context on the current political situation in Afghanistan. It includes humanitarian figures as well as key UK ODA data.
- background information: Afghanistan has endured several decades of conflict with frequent natural disasters, economic decline and rising poverty over recent years. In 2021, Afghanistan saw a military takeover by the Taliban and subsequent collapse of the government. This had immediate and significant consequences for the country with political, economic and social shocks. In December 2021, the UN launched the largest humanitarian appeal in history at $4.4 billion up from $1.7 billion
- humanitarian figures: 24.4 million people in need of humanitarian assistance in Afghanistan in 2022. 22.8 million people (half of the population) projected to be acutely food insecure in 2022. 689 thousand newly displaced people in Afghanistan
- there is also a map of Afghanistan and the surrounding region which shows that Afghanistan is bordered by Iran, Turkmenistan, Uzbekistan, Tajikistan and Pakistan
- UK ODA figured for 2021: Overall, the UK provided £187 million of ODA to Afghanistan in 2021, down by £38.3m (17%) from £226m in 2020. Despite this reduction, Afghanistan was the largest recipient of country-specific bilateral ODA, with a 6.7% share. In 2021, £136.5 million of bilateral ODA to Afghanistan (72.9%) was in the form of Humanitarian Aid. The UK also funded the Afghanistan Citizen Resettlement Scheme (ACRS) in 2021, a UK resettlement scheme for Afghan citizens. ODA for this scheme is not assigned to Afghanistan as the benefitting country, in line with the DAC rules around in-donor refugee costs
Box 2: Breakdown of 2021 UK bilateral ODA to Afghanistan, by humanitarian sector
This box presents a doughnut chart which shows the Humanitarian Aid sector breakdown of UK bilateral ODA in 2021. Material relief assistance and services makes up the largest proportion of the chart (£82m) followed by Emergency Food Assistance (£27m), Relief coordination and support services (£26m) and Immediate post-emergency reconstruction and rehabilitation (£1.4m).
In the box, there is also an example of FCDO’s main humanitarian programme in Afghanistan, the Afghanistan Multiyear Humanitarian Response Programme. The Afghanistan Multiyear Humanitarian Response Programme (AMYHRP) is FCDO’s main programme delivering humanitarian ODA to Afghanistan.
It was designed to provide lifesaving humanitarian assistance to vulnerable populations across Afghanistan, and support the early recovery and resilience of returnees, internally displaced populations and host communities. It also aims to increase support for local actors (‘localisation’) and to improve data collection, to ensure a more credible and accountable humanitarian response.
In 2021, UK ODA contributed £67m towards this programme, 60% of which was allocated as Material relief assistance and services and 20% was allocated each for both Emergency food assistance and Relief co-ordination and support services.
Box 3: UK 2021 bilateral ODA through multilateral organisations, specifically earmarked to Afghanistan
This box presents a bar chart of bilateral through multilateral delivery channels for ODA to Afghanistan and the ODA spend for each one. The World Food Programme (£68m) has the largest spend, followed by UNOCHA (£62m), UN Development Programme (£15m), UN agency, fund or commission (£5m), UNHCR (£3m) and UN Population Fund (£0.4m).
Box 4: UK 2021 Bilateral ODA through multilateral organisations, specifically earmarked to Afghanistan
This box presents a line graph of total bilateral ODA to Afghanistan from 2010 to 2021, including Humanitarian Aid ODA over the same years. Total Bilateral ODA to Afghanistan has fluctuated since 2010, increasing overall from £152m in 2010 to £187m in 2021. It has decreased from 2019 to 2020 (£226m) then decreasing further to £187m 2021. The proportion Humanitarian Aid ODA has increased since 2010, rising from £6.5m in 2010, then to £52m in 2020 and £136m in 2021.
-
A glossary, explaining key terms used throughout this report, is available in Annex 1 (PDF, 268 KB) ↩
-
For more information on the grant equivalent measure and the historical cash measurement, please see background note 9.3, paragraphs 16 to 18 ↩
-
This figure is in line with the DAC guidance on reporting vaccine donations in 2021, which includes the safeguard to not report ODA above the price paid for donated vaccines. The UK ODA figure reflects the price paid by the UK for its donated vaccines in 2021. The price per dose as of August 2022 has been used. Should there be further changes to the price per dose, we will review these in line with the revisions policy (PDF, 86.3 KB). ↩
-
Note 1. Figures may not sum to totals due to rounding ↩
-
From 2021, the full UK Attribution of the development share of the EU budget is reported under FCDO. This is in line with ODA allocations. Prior to 2021, the UK EU Attribution core contribution was partly reported by former DFID, and partly by non-DFID ↩
-
Prosperity Fund programmes implemented by the FCDO have been included in FCDO figures from April 2021 onwards. ↩
-
FCDO’s ODA eligible administration costs estimates are broken down by recipient country, in line with the approach to reporting former FCO’s Frontline Diplomacy Activity. Former DFID’s ODA eligible administration were all reported as “Developing Country, unspecified”. Therefore, care should be taken when comparing FCDO ODA eligible administration estimates at the country level to historical FCDO ODA eligible administration (which will only reflect former FCO). ↩
-
For some multi-country/region programmes, the current administrative system does not allow recording of spend by individual recipients. Improvements to the system are being considered but for this publication, where this is the case spend is reported as bilateral ODA spend with no single benefitting country or region section 5.1.5 (Bilateral ODA Spend). ↩
-
The Global Partnership for Education is an example of a sectoral-specific fund where amounts allocated to countries is not known in advance. ↩
-
The term ‘country-specific’ is used here because countries may also benefit from regional programmes that benefit multiple countries these would be reported under regional codes such as “Africa, regional”. ↩
-
European countries that received ODA in 2021 were: Albania, Belarus, Bosnia-Herzegovina, Kosovo, Moldova, Montenegro, North Macedonia, Serbia, Turkey and Ukraine. ↩
-
For breakdowns of spend to the top 20 recipients, see Table 6A on the publication landing page. ↩
-
From 2017, a single project could allocate spend to one or more sectors codes. See our note on Multiple Sector Codes for Project Activity – Analysis 2017 (PDF, 784 KB) which looks at the impact of this methodology change. ↩
-
See OECD directives: https://one.oecd.org/document/DCD/DAC/STAT(2020)44/FINAL/en/pdf (PDF, 2.8 MB). ↩
-
By definition, this support could include contributions the UK gives to support refugees in other donor countries. In 2021, this spend was all in the UK. ↩
-
The COVID-19 sector code was introduced by the OECD DAC in 2020. It does not cover all UK COVID-19 activities such as responses to international humanitarian appeals and COVID-19 activities on the socio-economic impacts of the pandemic. ↩
-
Economic Services & Infrastructure include programmes that focus on Transport, Energy Generation, Banking & Financial Services and Business. See Annex 1 (PDF, 268 KB) for more detail. ↩
-
Defined as ODA-eligible multilateral organisations for core (unearmarked) contributions by the OECD DAC, see http://www.oecd.org/dac/stats/annex2.htm. ↩
-
The UK may also provide funding to these organisations for specific programmes, which would be recorded as bilateral spend through a multilateral organisation. ↩
-
Note 1. Figures may not sum to totals due to rounding. Note 2. FCDO figures are the total sum of former FCO and former DFID ODA spend. Note 3. From 2021, the full UK Attribution of the development share of the EU budget is reported under FCDO. This is in line with ODA allocations. Prior to 2021, the UK EU Attribution core contribution was partly reported by former DFID, and partly by non-DFID. Note 4. For this publication the basic health support for asylum seekers have been produced with a health unit cost (per capita cost) for 2021. “0” is null and “[low]” is less than half the smallest unit displayed. For a full breakdown of UK-ODA by government department and other contributors to UK ODA by delivery channel for 2017, 2020 and 2021 please see Table 10. [r] Several minor revisions have been made to 2017, 2018, 2019 and 2020 data. See section 9.8 in the SID Report background notes. ↩
-
Finalised figures for DAC members will be published in December 2022, therefore we are using provisional figures in this chapter. To illustrate the impact of using provisional figures, DAC members’ provisional ODA for 2020 was £125.6 billion. This increased to £126.5 billion for final ODA for 2020 – an overall increase of 0.73%. ↩
-
The EU is also a DAC member but has not been included in this chapter. ↩
-
The OECD refers to nominal prices as ‘current’ prices (i.e. current for each individual year). ↩
-
The OECD refers to real prices as ‘constant’ prices (i.e. the series uses one year as the constant price across all years). ↩
-
From 2018 onwards, Official Development Assistance (ODA) has changed from being measured on a cash basis to a grant equivalent basis, following a decision taken by the DAC in 2014. For more information please see the Grant Equivalent Technical note (PDF, 345 KB). ↩
-
For further analysis on DAC country donors, see the OECD report on donor’s provisional figures: https://www.oecd.org/dac/financing-sustainable-development/development-finance-standards/ODA-2021-summary.pdf (PDF, 1.7 MB). ↩
-
Figure 18 is based on the provisional 2021 ODA data from all 29 DAC member countries, except the UK for which final 2021 ODA data is used. ↩
-
GNI is monitored using forecasts published by the independent Office for Budget Responsibility (OBR) to manage the 0.7% commitment. ↩
-
A small part of FCDO spend is measured on a resource basis (£14.6m). These programmes will switch to the cash measure once the new FCDO finance system “Hera” is implemented. ↩
-
See OECD, Aid Statistics, Methodology webpage: https://www.oecd.org/dac/financing-sustainable-development/development-finance-standards/data-collection-and-resources-for-data-reporters.htm. ↩
-
See the SID accompanying annexes (PDF, 268 KB) for more information on FCDO’s assessment of assurance of the administrative data. ↩
-
For more information please see published note. ↩