Statistics on International Development: Provisional UK Aid Spend 2019
Updated 7 April 2020

© Crown copyright 2020
This publication is licensed under the terms of the Open Government Licence v3.0 except where otherwise stated. To view this licence, visit nationalarchives.gov.uk/doc/open-government-licence/version/3 or write to the Information Policy Team, The National Archives, Kew, London TW9 4DU, or email: psi@nationalarchives.gov.uk.
Where we have identified any third party copyright information you will need to obtain permission from the copyright holders concerned.
This publication is available at https://www.gov.uk/government/statistics/statistics-on-international-development-provisional-uk-aid-spend-2019/statistics-on-international-development-provisional-uk-aid-spend-2019
About this release
The publication focuses on the key international measure of official aid spend, known as Official Development Assistance (ODA). The box below explains the definition of ODA.
Key definition: Official Development Assistance
Official Development Assistance (ODA) is produced according to the standardised definitions and methodologies of the Organisation for Economic Cooperation and Development’s (OECD) Development Assistance Committee (DAC). ODA is defined as resource flows to developing countries (According to the OECD DAC list of ODA recipient countries) and multilateral organisations, which are provided by official agencies (e.g. the UK Government) or their executive agencies, where each transaction meets the following tests:
- It is administered with the promotion of the economic development and welfare of developing countries as its main objective
- It is concessional, including grants and soft loans (ODA is calculated on a grant equivalent basis from 2018 ODA statistics onwards. For more details see the background note 7.1)
A glossary, explaining key terms used throughout this report, is available in Annex 1 of SID.
This publication provides statistics about the amount of Official Development Assistance (ODA) the UK provided in 2019, including UK ODA as a percentage of Gross National Income (GNI) (the ODA:GNI ratio) and various other breakdowns of ODA spend. The spend figures in this publication are provisional and based on summary data with limited sector and geography breakdowns. A final estimate of UK ODA, the ODA:GNI ratio and more detailed breakdowns of spend will be published in autumn 2020 in ‘Statistics on International Development: Final UK Aid Spend 2019’ (Final SID)[footnote 1]. More information about the UK government’s approach to aid spending is set out in the UK Aid Strategy[footnote 2].
Further information on the technical terms, data sources, quality and processing of the statistics in this publication are found in Annexes 1-3 on the Statistics on International Development webpage.
Infographic - UK Official Development Assistance (ODA) 2019
Key Points
-
The provisional ODA:GNI ratio for 2019 was 0.70%
-
In 2019, UK Official Development Assistance (ODA) spend was £15,174 million, an increase of £623 million (4.3% increase) on 2018
-
In 2019, UK bilateral ODA spend was £10,113 million while UK multilateral ODA spend was £5,061 million. For more information and definitions see section 3
-
The Department for International Development (DFID) spent £11,107 million on ODA in 2019, compared with £10,897 million in 2018 (an increase of £210 million). DFID’s share of total UK ODA stood at 73.2% in 2019, compared with 74.9% in 2018
-
Non-DFID spend on ODA in 2019 was £4,068 million, compared with £3,655 million in 2018 (an increase of £412 million). The non-DFID share was 26.8% in 2019, increasing from 25.1% of the total in 2018
-
Statistics on bilateral ODA by geographic region are currently only available for DFID spend. Africa received the largest share (56.34%) of DFID’s bilateral country or region-specific spending in 2019, representing £2,448 million. Asia received £1,771million of bilateral ODA from DFID – an increase of £225 million compared to 2018
ODA :GNI Ratio
The ODA:GNI ratio presents UK Official Development Assistance (ODA) spend as a proportion of against UK Gross National Income (GNI).
Key Definition – 0.7% commitment
The ODA:GNI commitment of 0.7% was first agreed internationally in 1970 by the United Nations General Assembly. The UK government made a commitment to invest 0.7% of GNI on ODA from 2013. In 2015 the International Development (Official Development Assistance Target) Act placed the 0.7% commitment in UK law from 2015 and in each subsequent calendar year.
Table 1 shows that in 2019:
- The ODA:GNI ratio was 0.70%. The commitment to spend 0.70% of GNI on ODA has been met/not been met
- UK ODA was £15,174 million, an increase of £623 million (4.3% increase) on 2018
Table 1: UK GNI Estimates, total UK ODA and ODA:GNI ratios; Current prices (£ millions) 2018 and 2019
(a) Measured on a grant equivalent basis. For more detail see background note 7.2
(b) The Gross National Income (GNI) used is measured on a pre-2019 Blue Book methodology. For more detail see background note 7.2
The Office for National Statistics (ONS) implemented a new methodology for calculating GDP in its September 2019 Blue Book, which in turn had an impact on Gross National Income (GNI). The GNI used to calculate the ODA:GNI ratio for 2019 is based on the pre-2019 Blue Book methodology, since the first quarterly estimate of 2019 GNI under new methodology did not become available until 30 September 2019. From 2020, the ODA:GNI ratio will be reported against the new GNI measure. For more details see background note 7.2.
Long-term Trends in UK ODA
Figure 1 shows the trend in UK ODA since 1970. Overall there has been a steady increase in the level of UK ODA since 1970, with a spike in 2005 and 2006 which was driven by high levels of debt relief[footnote 3], and then a steep increase in 2013 when the UK Government first met the 0.7% ODA:GNI commitment.
The jump in the level of ODA in 2016 reflects ONS’s switch to the European System of Accounts (ESA) 2010 methodology for measuring GNI and the consequent need to increase UK ODA to meet the 0.7% ODA commitment.
Figure 1: UK ODA Levels between 1970 and 2019
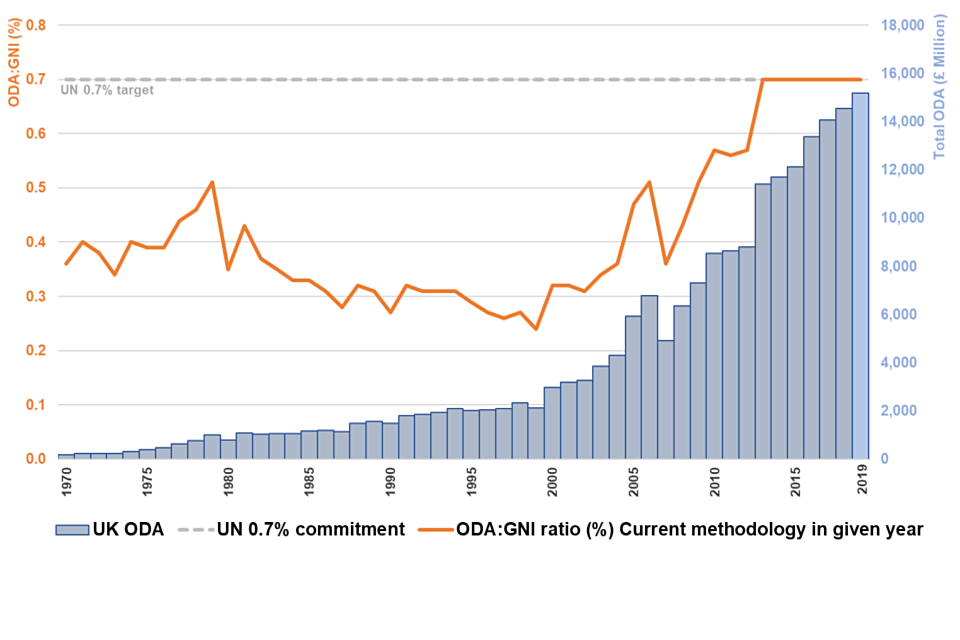
Figure 1: UK ODA Levels between 1970 and 2019
- 2018 and 2019 are measured on a grant equivalent basis
- Underlying data for this graph can be found in the accompanying excel file ‘SID Provisional UK aid spend 2019 - accompanying tables’. The bar for 2019 is a lighter colour to represent that this figure is provisional.
UK Bilateral and Multilateral ODA
There are 2 main delivery channels for ODA: bilateral and multilateral.
Bilateral ODA
Earmarked spend, this means that the donor has specified where and what the ODA is spent on – this is usually ODA going to specific countries, regions or programmes. For example, delivering family planning services across Malawi through a non-government organisation.
Core multilateral ODA
Un-earmarked core funding from national governments to multilateral organisations[footnote 4], which are pooled with other donors’ funding and disbursed as part of the core budget of the multilateral organisation. For example, the UK’s contribution to the World Bank International Development Association. Core contributions will fluctuate from year to year in part due to the payment schedules of the receiving multilateral organisation[footnote 5].
Table 2 shows that in 2019:
- £5,061 million of UK ODA was delivered through core contributions to multilaterals. This was a 4.3% decrease (£228 million) compared to 2018. The decrease was in part due to a smaller annual contribution to the International Development Association compared with 2018 in line with the planned payment schedule
- £10,113 million of UK ODA spend was delivered through bilateral channels. This was a 9.2% increase (£850 million) compared to 2018. The increase in bilateral spend, was the largest increase seen since 2016 when the UK switched to the ESA[footnote 6]. 2010 methodology for GNI estimate
- Bilateral ODA accounted for 66.6% of total UK ODA. In comparison over the previous 5 years (2014 to 2018) bilateral ODA represented on average around 62.3%. This shift in share was in part driven by the decrease seen in the UK’s core contributions to multilaterals as well as the actual increase in bilateral ODA spend
- £1,507 million of bilateral ODA spend was for humanitarian assistance (9.9% of total UK ODA). This represents an increase of £208 million compared with 2018 and was partly driven by UK responses to humanitarian crises, for example in Yemen[footnote 7].
Table 2: UK Official Development Assistance 2018-2019
Breakdown of UK ODA by contributor
Table 3 shows 2019 ODA spend by government department and other contributors of UK ODA as well as changes in ODA spend from 2018. The analysis presented in the table is based on summary provisional returns from government departments and other sources. More detailed spending data will be published in ‘Statistics on International Development: Final UK Aid Spend 2019’ this autumn.
The overall amount of ODA spend is determined by the size of GNI, however shifts in the percentage shares of departments and other ODA contributors depend on their spending in the given year.
Contributors of UK ODA in 2019
- DFID spent £11,107 million of ODA, an increase of £210 million, or 1.9%, compared to 2018. In particular, DFID’s bilateral ODA spend increased by £575 million, to £6,952 million in 2019, the largest increase since 2013. An area of bilateral spend which increased in 2019, is DFID’s capital injection to CDC, the UK’s Development Finance Institution, which increased by £266 million. The increase in capital will be used to make investments in Africa and South Asia[footnote 8]. DFID’s bilateral spending is explored further in Sections 5 and 6.
- ODA spend by departments other than DFID and other contributors of UK ODA (referred to in Table 3 as non-DFID spend) was £4,068 million in 2019, an increase of £412 million, or 11.3%, on 2018
- ODA spend by departments other than DFID (Other Government Departments) was the driver behind the increase in non-DFID ODA, with the top 7 highest spending departments all spending more when compared with 2018. Other Government Departments spent £3,387 million of ODA in 2019, increasing by £423 million on 2018
Table 3: UK ODA Contributors 2018-2019; ordered by 2019 ODA spend
-
The largest year on year increases were:
- BEIS spent £951 million of ODA in 2019 – an increase of £101 million, or 11.8%, on 2018. Funding on research activities increased by £81 million while spending on climate-related programmes increased by £21 million[footnote 9].
- Home Office spent £452 million of ODA in 2019, an increase of £115 million, or 34%, on 2018. This was due to a rise in spending to support asylum seekers in the UK, primarily reflecting an increase in Asylum Support volumes in 2019, in comparison to 2018
- The Cross Government Prosperity Fund spent £175 million of ODA in 2019, this was an increase of £82 million, or 87.1%, on 2018. The Cross Government Prosperity Fund has increased its ODA spend year on year since the fund started spending ODA in 2016, as they move more programmes into implementation
-
Non-departmental ODA, for example Gift Aid claimed by charities carrying out ODA eligible activities and spend by Devolved Administrations contributed £681 million in 2019, a slight decrease of £11 million compared to 2018. For the first time since 2014, there was no core contribution to the IMF-Poverty Reduction Growth Trust
Contributors’ share of UK ODA
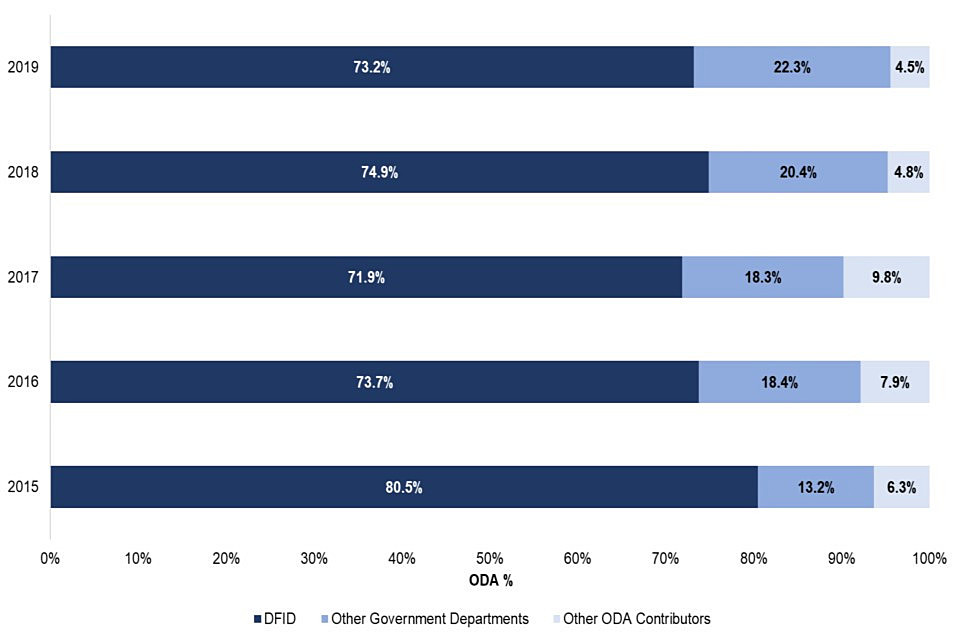
- Despite DFID’s ODA spend increasing, DFID’s share of total ODA dropped from 74.9% in 2018 to 73.2% in 2019. This decrease in share contrasts with the direction of travel in 2018 when DFID’s share increased for the first time since 2013
- The share of total ODA spent by non-DFID contributors increased from 25.1% in 2018, to 26.8% in 2019. This share was still below the 2017 level of 28.1%
- Of the non-DFID contributors, Other Government Departments’ (OGD) ODA accounted for 22.3% of total UK ODA, their largest share since the time series began. The largest OGD shares of ODA were: the Department for Business, Energy & Industrial Strategy (BEIS) (6.3% of ODA); the Foreign and Commonwealth Office (4.5%), the Conflict, Stability and Security Fund (4.4%); and the Home Office (3.0%)
- The largest non-departmental sources (referred to as Other UK Contributors of ODA in Figure 2) were non-DFID EU attribution[footnote 10]. (3.1% of UK ODA) and Gift Aid claimed by charities working on ODA eligible activities (1.0% of UK ODA). These shares are similar to 2018
Figure 2: Proportion of UK ODA accounted for by DFID, Other Government Departments and Other contributors of ODA: 2015 to 2019*
Proportion of UK ODA accounted for by DFID, Other Government Departments and Other contributors of ODA: 2015 to 2019
*Figures may not sum to totals due to rounding.
DFID Region-Specific Bilateral ODA
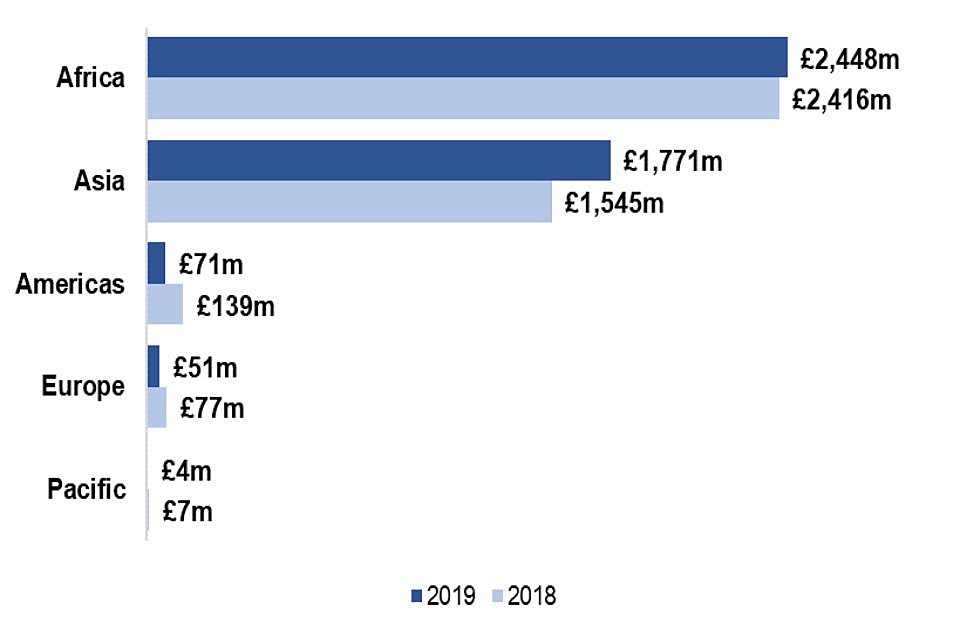
Figure 3 presents the breakdown of DFID’s region-specific bilateral ODA. These figures represent only part of the picture on UK ODA spend for each region because similar data from government departments other than DFID and other contributors of UK ODA is not available with this provisional release. Also, core contributions to multilateral organisations, or spend that is not assigned to a specific country or region is not included.
- In 2019, DFID region-specific bilateral ODA was £4,344 million compared to £4,185 million in 2018, an increase of £1593 million. However, whilst the amount of region specific ODA increased, the proportion of DFID’s total bilateral ODA this represented decreased from 65.6% in 2018 to 62.5% in 2019. This decrease in percentage share of region-specific ODA reflects more spend through centrally funded programmes in 2019 that benefit multiple countries or multiple regions (see section 6)
- In 2019, Africa received £2,448 million of DFID bilateral ODA, an increase by £32 million. Africa remained the largest recipient of DFID bilateral ODA in 2019, representing 56.4% of the total, down from 57.7 per cent in 2018
- In 2019, Asia received £1,771 million of bilateral ODA from DFID – an increase of £225 million compared to 2018. This also represents an increase in the share of UK ODA. The increase was partly driven by humanitarian[footnote 11]. spend in Bangladesh and Yemen[footnote 12].
- The Americas received £71 million of DFID bilateral ODA in 2019, a decrease of £67 million compared to 2018. This decrease was partly due to smaller spend in the Caribbean
- DFID bilateral spend in Europe decreased from £77 million in 2018 to £51 million in 2019 and reflects a reduction in spend to Turkey
Figure 3: DFID’s Region-Specific Bilateral ODA 2018 and 2019
DFID’s Region-Specific Bilateral ODA 2018 - 2019
ODA spend by region will be presented for all UK expenditure in the ‘Statistics on International Development: Final UK Aid Spend 2019’ publication that will be published later in the year.
DFID Non-Region-Specific Bilateral ODA
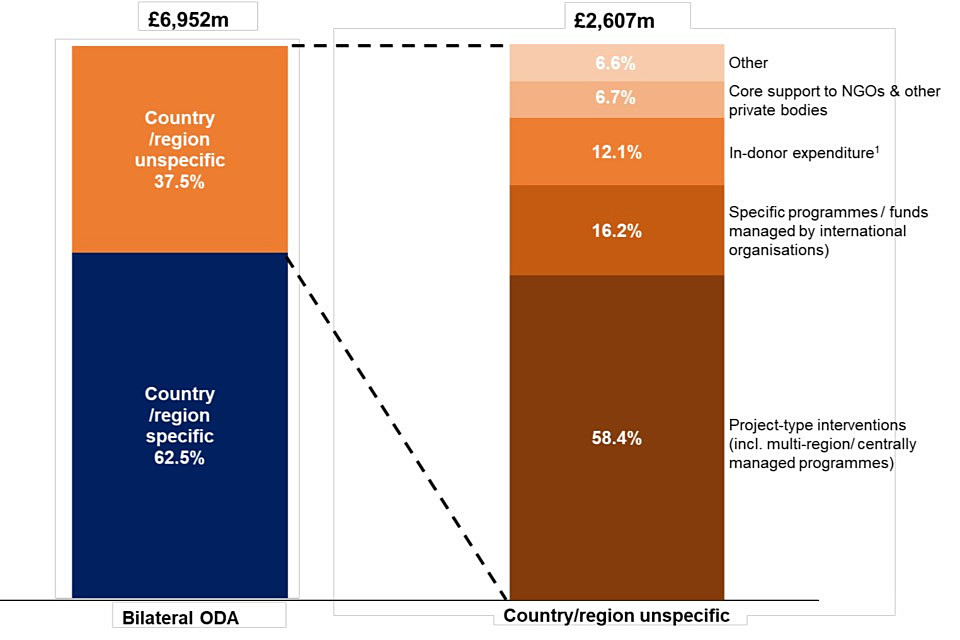
Non-region-specific bilateral ODA consists of spend on projects which are not assigned to any single recipient country or region[footnote 13]. For example, centrally-funded research or programmes that develop policies which benefit several developing countries and cannot be meaningfully recorded to a single benefitting country or region.
Bilateral ODA spend by DFID on projects not assigned to any single recipient country or region amounted to £2,607 million in 2019, an increase of £416 million compared to 2018. This accounted for 37.5% of DFID’s total bilateral ODA spend, an increase from 34.4% in 2018. Figure 4 provides a breakdown of this expenditure for 2019, which was proportionally similar to 2018.
Figure 4: Breakdown of DFID’s Non-Region-Specific Bilateral ODA in 2019
Breakdown of DFID’s Non-Region-Specific Bilateral ODA in 2019
-
Donor expenditure relates to ODA-eligible activities conducted within countries that donate aid, including the United Kingdom. ODA spend in the UK to support development work overseas or refugees within the UK are both examples of in-donor expenditure
-
Numbers may not sum due to rounding
Background Notes
Definitions and Sources
Information on the main definitions and sources used in this publication can be found in Annexes 2 and 3 respectively of the Statistics on International Development publication.
UK ODA spend figures for this publication are derived from:
- DFID’s ‘ARIES’ database of financial transactions relating to DFID payments and receipts, which is quality assured centrally to ensure that data is complete, coding is correct and spend is in line with OECD definitions of ODA. This administrative source comprises 73% of total UK ODA in 2019
- Non-DFID sources, who also assess whether the spend is in line with the OECD definitions of ODA. These non-DFID sources account for around 27% in 2019 and are largely derived from financial transaction data also. A small proportion of non-DFID spend is estimated, for example Gift Aid on ODA eligible activity
ODA spending and reporting
UK ODA spend includes DFID spend, ODA spend by government departments other than DFID and other sources of ODA (such as EU attribution and Gift Aid). DFID and HM Treasury monitor spend by other departments and funds, and movements in GNI during the year[footnote 14]. The UK commitment to spend 0.7% of Gross National Income (GNI) on ODA is reported the year following the spend based on confirmed ODA outturn and GNI estimates published by the Office for National Statistics.
While DFID manages its own spending on ODA, DFID has no control over GNI nor the spending by other government departments and other sources of ODA. After final decisions on UK ODA spending are made the GNI estimate can still shift due to later economic data for the year becoming available, so can the amount of ODA spent by other government departments and ODA contributions from non-departmental sources.
Between the spring and the autumn, the previous year’s ODA spending of DFID and other government departments are finalised. Government departments other than DFID will provide project-level details that allow the ODA spend to be quality assured by DFID. The ONS will release further updates of GNI throughout the year. The final ODA data and an updated GNI estimate are then used to calculate the final ODA:GNI ratio in the autumn publication.
DFID is responsible for collating data and reporting spend on ODA to the Organisation of Economic Development and Co-operation (OECD), including the 0.7 ODA:GNI ratio commitment.
ODA:GNI ratio
As mentioned above, the ODA:GNI ratio is based on confirmed ODA spend and estimates of GNI published by the Office for National Statistics (ONS). The ONS produce estimates for UK Gross Domestic Product (GDP) and Gross National Income (GNI) on a quarterly basis. The ONS publishes revisions to GNI estimates as more economic data becomes available. The 2019 provisional ODA:GNI ratio is based on a GNI estimate published by the ONS on 31 March 2020.
The ONS publish the full set of National Accounts each autumn via the Blue Book. The Blue Book is where the ONS tend to implement methodology changes. In the Blue Book 2019, the ONS implemented a major new methodology framework for GDP, which in turn had a sizable impact on GNI. To understand the new framework in greater detail please see the ONS detailed articles. DFID considered several factors and consulted with key stakeholders, ONS and HM Treasury when determining its approach for implementing the new framework for reporting on the ODA:GNI ratio.
For 2019, the ODA:GNI ratio is based on the pre-Blue Book 2019 level since the first quarterly estimate of 2019 GNI under the new GDP framework did not become available until 30 September 2019. This approach is in line with how DFID dealt with the last major GNI methodology change[footnote 15]. and provides consistency between the in-year monitoring and reporting of the ODA:GNI ratio.
ONS has published GNI figures for 2019 based on the ‘pre-Blue Book 2019’ framework and will continue to up to June 2020. These are being published on the same day as the Quarterly National Accounts and are found on the ONS website.
To give users an understanding of the impact of the changes implemented in Blue Book 2019, the UK GNI measured on the new GDP framework leads to an ODA:GNI ratio of 0.69% in 2019, compared to 0.70% on the pre-Blue Book 2019 level. This is set out in the table below:
GNI estimates and ODA:GNI ratios: 2019
| 2019 | GNI £ millions | ODA:GNI ratio |
|---|---|---|
| Pre-Blue Book 2019 | 2,162,572 | 0.70 |
| New GDP Framework | 2,184,546 | 0.69 |
DFID will move to the new framework from the start of 2020, the next full calendar year, for managing and reporting 2020 ODA spend. For more information please see the explanatory note that was published in September 2019.
EU attribution
The provisional estimate for the UK’s share of the EU ODA budget in 2019 was £972 million compared to £952 million in 2018. EU attribution fluctuates from year to year because the EU works on a seven-year programming cycle and so EU disbursements in a given year can vary. Other reasons for fluctuations between years include the change in UK’s share of the EU budget in comparison to other member states and exchange rate variations. The estimate in 2018 and 2019 is based on published data from the European Commission on the UK’s share of development expenditure.
To avoid double counting, Table 3 reports £27.5 million of the EU attribution figure for the UK’s contribution to EU peacekeeping under the CSSF, as the fund responsible for this spending. This does not affect the overall EU attribution figure.
Grant Equivalent
From 2018 onwards, Official Development Assistance (ODA) has changed from being measured on a cash basis to a grant equivalent basis, following a decision taken by the DAC in 2014.
The headline grant equivalent measure of UK ODA for 2019 was £15,178 million, compared to £15,160 million on the cash basis measurement (a difference of 0.1%). The difference is due to official loan reflows not being included under the grant equivalent measure. See our technical note for more information.
Revisions and Changes to the Publication
The revisions process is set out in DFID’s Revisions Policy.
The Office for Statistics Regulation (OSR), the regulatory arm of the UK Statistics Authority, has completed a short review[footnote 16]. of DFID’s Statistics on International Development (SID) compliance against the Code of Practice for official statistics. This confirmed that SID continues to be designated as National Statistics. OSR’s full findings, published on 18 September, can be found on the UKSA website.
In future versions of “Statistics on International Development”, the production team will look to improve the statistics in line with the recommendations from the OSR. For instance, in this publication we have included a one-page summary infographic and have included extra information in the background note.
Future developments
An important part of National Statistics production is assessing whether a product continues to meet user needs. In January 2020, the statisticians working on the production of SID assessed the use of the Gross Public Expenditure suite of tables. As part of this we engaged with our largest GPEX user group – DFID policy colleagues. Findings and conclusions from this assessment will be shared via an explanatory note published summer 2020.
The OECD DAC is currently reviewing all DAC members methodologies for calculating ODA eligible in-donor refugee costs. The UK submitted its methodology in May 2019 and is engaging with the DAC to validate its methodology. We will update users if there are any refinements on how this area of ODA spend is calculated as a result of this review.
The UK is participating in the OECD DAC Peer Review process in 2019/20. This is an in-depth investigation of the UK’s development systems and policies. The date for publication is still to be confirmed, owing to the impact of COVID-19 on the review’s completion. To understand further what a DAC Peer Review involves please see the OECD guidance.
Timing and Releases
‘Statistics on International Development: Final UK Aid spend 2019’ is due to be published in Autumn 2020. The Office for Statistics Regulation published guidance in respect to Corvid-19 and the effect this could have on Government Statistical publications. We will endeavour to keep our users up to date via our GOV.UK page if there are any implications to the publication timeline, content or quality.
Provisional 2019 ODA statistics for all members of the OECD will be published by the OECD Development Assistance Committee (DAC) in April 2020. Final data is normally published by the OECD in December.
Quality
Data for this publication comes from the following sources:
i) DFID’s ARIES database that records financial transactions relating to DFID payments and receipts. It also includes information on the dates of transactions, where the transactions took place and in which sector. This information is primarily input by spending teams in DFID country offices and central departments, with some quality assurance carried out at input level and centrally to ensure that spend is in line with OECD definitions of ODA
ii) Other Government Departments and other ODA contributors some of which have similar databases to record ODA transaction data
As the data in the publication is largely based on administrative data it is not subject to sampling error. However, these provisional statistics may change between now and the final release in Autumn 2020 as the data is further audited and assured as part of the closing of accounts and statistical quality assurance processes.
The DAC sets the definitions and classifications for reporting on ODA internationally. These are laid out in the DAC Statistical Reporting Directives[footnote 17]. The statistics shown here are reported in line with these directives and are subjected to a quality assurance process as described in Annex 3 of Statistics on International Development.
The figure presented for the Welsh Government represents their estimated spend for the financial year 2019/20 and are used as a proxy for their calendar year 2019 spend.
Related Statistics and Publications
The OECD statistics provide ODA breakdowns for DAC donors (including multilaterals). This source is useful when carrying out international comparisons. Figures for DAC donor’s provisional 2019 ODA will be published in early April.
Private spending or donations made in support of developing countries, for example by the public, the voluntary sector or through remittances, are not part of the ODA definition and not covered in this publication. Information on this spend can be found in the Office for National Statistics’ Living costs and Food Survey or the Charities Aid Foundation’s UK giving report.
DFID’s results website provides information on results achieved in international development through DFID spend. DFID’s Annual Report draws on information from the results publication and also provides information on DFID’s spending, performance and efficiency.
The Development Tracker can be used to explore details of the individual development projects that the UK is funding. This allows you to filter projects by country and sector and view further details about the project as published in documents such as the business case and annual review. The tracker uses open data on development projects, compliant with the International Aid Transparency Initiative (IATI) standard, to show where funding by the UK Government and its partners is going and ‘trace’ it through the delivery chain.
Uses and users
The main purpose of these statistics is to provide timely summary statistics on ODA expenditure by the UK government. They are published prior to the release of provisional ODA statistics by the OECD DAC for all OECD members.
Based on user feedback, these statistics are used for a variety of purposes: preparing material for briefs; PQs and public correspondence; inclusion in reports and reviews and providing data for research and monitoring. Our users represent the government, civil society and non-government organisations, students, academia and the media.
We are always keen to enhance the value of these statistics and welcome your on-going feedback either via our Statistics User Group or via email statistics@dfid.gov.uk
National Statistics
The Office for Statistics Regulation (part of the United Kingdom Statistics Authority) designated these statistics as National Statistics in March 2016, in accordance with the Statistics and Registration Service Act 2007 and signifying compliance with the Code of Practice for Statistics. Designation means the statistics carry the National Statistics label and conform to the standards summarised below.
Office for Statistics Regulation published their finding of the compliance check of SID which confirmed that it is designated a National Statistics.
Information on the work of the UK Statistics Authority
National Statistics Status
Contacts
For enquiries (non-media) about the information contained in this publication, or for more detailed information, please contact:
Alice Marshall
Telephone: 01355 84 36 51
E-mail: statistics@dfid.gov.uk
For media enquiries please contact the DFID Press Office on +44 (0) 20 7023 0600. For further information on development issues and DFID policies, please contact the Public Enquiry Point on 0845 300 4100.
DFID Website: Statistics at DFID
For media enquiries please contact the DFID Press Office on +44 (0) 20 7023 0600. For further information on development issues and DFID policies, please contact the Public Enquiry Point on 0845 300 4100.
-
Once released the publication will be available on the DFID Statistics webpage ↩
-
UK aid: tacking global challenges in the national interest ↩
-
See commitments made by the UK and other donors at the 2005 G8 Summit in Gleneagles ↩
-
The multilateral must be on the OECD DAC list of eligible multilaterals in order to receive unearmarked funding. The list also states want proportion of a core contribution to each multilateral can be counted as ODA. ↩
-
The UK core contribution could be used for different programmes or initiatives as well as general operations of the organisation. See Tables A9 and A10 [LINK] for estimates on how UK’s core contributions were spent in 2018. ↩
-
European System of Accounts ↩
-
For example, the UK Prime Minister announced an increase in UK aid to Yemen in Feb 2019 ↩
-
This is part of the agreed scale-up of CDC over the 5 year period 2017-2021 to resource CDC’s Strategy over that period. ↩
-
Figures may not sum due to rounding ↩
-
New UK aid underlines “continued commitment” to the Rohingya people ↩
-
See further explanation on unspecified regions (p35) SID 2018 ↩
-
GNI is monitored using forecasts published by the independent Office for Budget Responsibility (OBR) to manage the 0.7% commitment ↩